Article

Influence of SiO2 Particles on the Corrosion and Wear Resistance of Plasma Electrolytic Oxidation-Coated AM50 Mg Alloy

1
Corrosion and Protection Division, Shenyang National Laboratory for Materials Science, Northeastern University, Shenyang 110819, China
2
Key Laboratory for Anisotropy and Texture of Materials (Education Ministry of China), Northeastern University, Shenyang 110004, China
3
Magnesium Innovation Centre (MagIC), Helmholtz-Zentrum Geesthacht, Max-Planck-Str. 1, 21502 Geesthacht, Germany
4
Faculty of Engineering, University of Kiel, Kaiserstrasse 2, 24143 Kiel, Germany
*
Authors to whom correspondence should be addressed.
Coatings 2018, 8(9), 306; https://doi.org/10.3390/coatings8090306
Submission received: 10 July 2018 / Revised: 31 July 2018 / Accepted: 20 August 2018 / Published: 29 August 2018
(This article belongs to the Special Issue Plasma Electrolytic Oxidation (PEO) Coatings)

Abstract

:
The influence of SiO2 particles on the microstructure, phase composition, corrosion and wear performance of plasma electrolytic oxidation (PEO) coatings on AM50 Mg was investigated. Different treatment durations were applied to fabricate coatings in an alkaline, phosphate-based electrolyte (1 g/L KOH + 20 g/L Na3PO4 + 5 g/L SiO2), aiming to control the incorporated amount of SiO2 particles in the layer. It was found that the uptake of particles was accompanied by the coating growth at the initial stage, while the particle content remained unchanged at the final stage, which is dissimilar to the evolution of the coating thickness. The incorporation mode of the particles and phase composition of the layer was not affected by the treatment duration under the voltage-control regime. The corrosion performance of the coating mainly depends on the barrier property of the inner layer, while wear resistance primarily relies on the coating thickness.

1. Introduction

Inferior corrosion and wear resistance are the main issues that restrict the wide range of applications of Mg and its alloys [1,2,3,4]. Plasma electrolytic oxidation (PEO) is one of the promising surface treatment processes derived from conventional anodizing to produce ceramic-like coatings on light alloys (Al, Mg and Ti) with enhanced anti-corrosion properties, wear resistance and biological compatibility [5,6,7,8]. In the case of Mg alloys, aqueous alkaline electrolytes are usually used during the PEO process and coatings are formed by the localized dielectric breakdown of the oxide film at high voltage [9,10,11]. The microstructure, phase composition and properties of the coating primarily depend on the electrolyte components and applied electrical parameters [12,13,14]. Particularly, energy input is the main driving force when producing a coating and plays an important role in the coating formation process. The current-control and voltage-control modes are generally applied to fabricate coatings under pulsed DC, AC or bipolar regimes [15,16,17].
Recently, solid particles (SiC, TiO2, Al2O3, ZrO2, etc.) have been introduced into PEO electrolyte to provide a wider range of phase compositions and new functionalities for PEO-coated Mg alloys [18,19,20,21,22,23,24,25]. It was found that the uptake and incorporation of the particles were significantly influenced by electrical parameters, such as the voltage/current density, frequency and duty cycle, leading to a modified coating microstructure, phase composition and properties [26,27,28,29,30]. Lin et al. [31] investigated the effects of voltage and oxidation duration on the corrosion properties of PEO coating using HA (hydroxyapatite)-containing electrolyte. It was proposed that higher voltage facilitates the incorporation of HA particles into the coating and enhances the corrosion resistance of the layer. However, a longer treatment duration induces more defects in the coating, which can act as a rapid route for the penetration of corrosive ions. Our previous work demonstrated that a lower frequency and higher duty ratio generates large-sized pores, leading to the uptake of more particles into the coating. Moreover, it is assumed that the pulse-on duration of each pulse is more important than the pulse-off duration for particle uptake during PEO processing [32]. To date, there have only been a limited number of reports on the effect of treatment duration on PEO coatings with addition of particles under a voltage-control regime. In the present work, the influence of SiO2 particles on the microstructure, phase composition and properties of the coating was investigated to elucidate the optimized processing parameters to improve the coating properties.

2. Materials and Methods

Specimens of AM50 Mg alloy with dimensions of 15 mm × 15 mm × 4 mm were cut from gravity cast ingot material. The chemical composition of AM50 alloy as identified by an Arc Spark OES (Spark analyser M9, Spectro Analytical Instruments GmbH, Kleve, Germany) is 4.74 wt % Al, 0.383 wt % Mn, 0.065 wt % Zn, 0.063 wt %, Si, 0.002 wt % Fe, 0.002 wt % Cu and Mg balance. The specimens were ground using SiC abrasive papers up to 1200 grit, rinsed with ethanol and then air-dried prior to PEO treatment.
The PEO process was performed using a lab-produced pulsing unit in combination with a commercial power supply (PS 8000 2U, Elektro-Automatik, Viersen, Germany). The frequency was 250 Hz and the duty ratio were 10%. The specimen and a stainless steel tube were used as the anode and cathode, respectively. A total of 5 g/L of micro-sized SiO2 particles were added to a phosphate-based electrolyte (20 g/L Na3PO4 and 1 g/L KOH). PEO coatings were produced under a constant voltage regime (450 V) for different treatment durations (1, 3, 5, 10, 20, 30 and 60 min). A stirrer and bubbling generator were used to facilitate the uniform distribution of the particles in the electrolyte. The temperature of the electrolyte was maintained at 20 ± 2 °C by a water cooling system.
A scanning electron microscope (SEM, TESCAN Vega3 SB, TESCAN, Brno, Czech Republic) combined with an energy dispersive spectrometer (EDS) system was used to examine the surface morphology, composition and microstructure of the PEO coatings. An acceleration voltage of 15 kV was applied for SEM and EDS investigations. The phase composition analysis was done with a Bruker X-ray diffractometer (XRD, Bruker, Billerica, MA, USA) using Cu Kα radiation. The dry sliding wear behavior of the PEO coatings was assessed using a Tribotec ball-on-disc oscillating tribometer (Tribotec, Brno, Czech Republic) with an AISI 52100 steel ball of 6 mm diameter as the static friction partner. The wear tests were performed under ambient conditions (25 ± 2 °C and 30% relative humidity) under a 5 N load with an oscillating amplitude of 10 mm at a sliding velocity of 5 mm s−1, for a sliding distance of 12 m.
The corrosion behavior of the PEO coatings was assessed by electrochemical impedance spectroscopy (EIS) tests using an ACM Gill AC computer-controlled potentiostat (ACM Instruments, Cumbria, UK). A typical three-electrode cell with a saturated Ag/AgCl electrode as the reference electrode, a platinum mesh as the counter electrode and a coated specimen as the working electrode (0.5 cm2 exposed area) was used. EIS studies were performed at open circuit potential (OCP) with an AC amplitude of 10 mV RMS (root mean square) sinusoidal perturbations over the frequency range from 30 kHz to 0.01 Hz. The measurements were taken at 0 (after 5 min immersion), 1, 3, 6, 12, 24, 48 and 72 h immersion time.

3. Results and Discussion
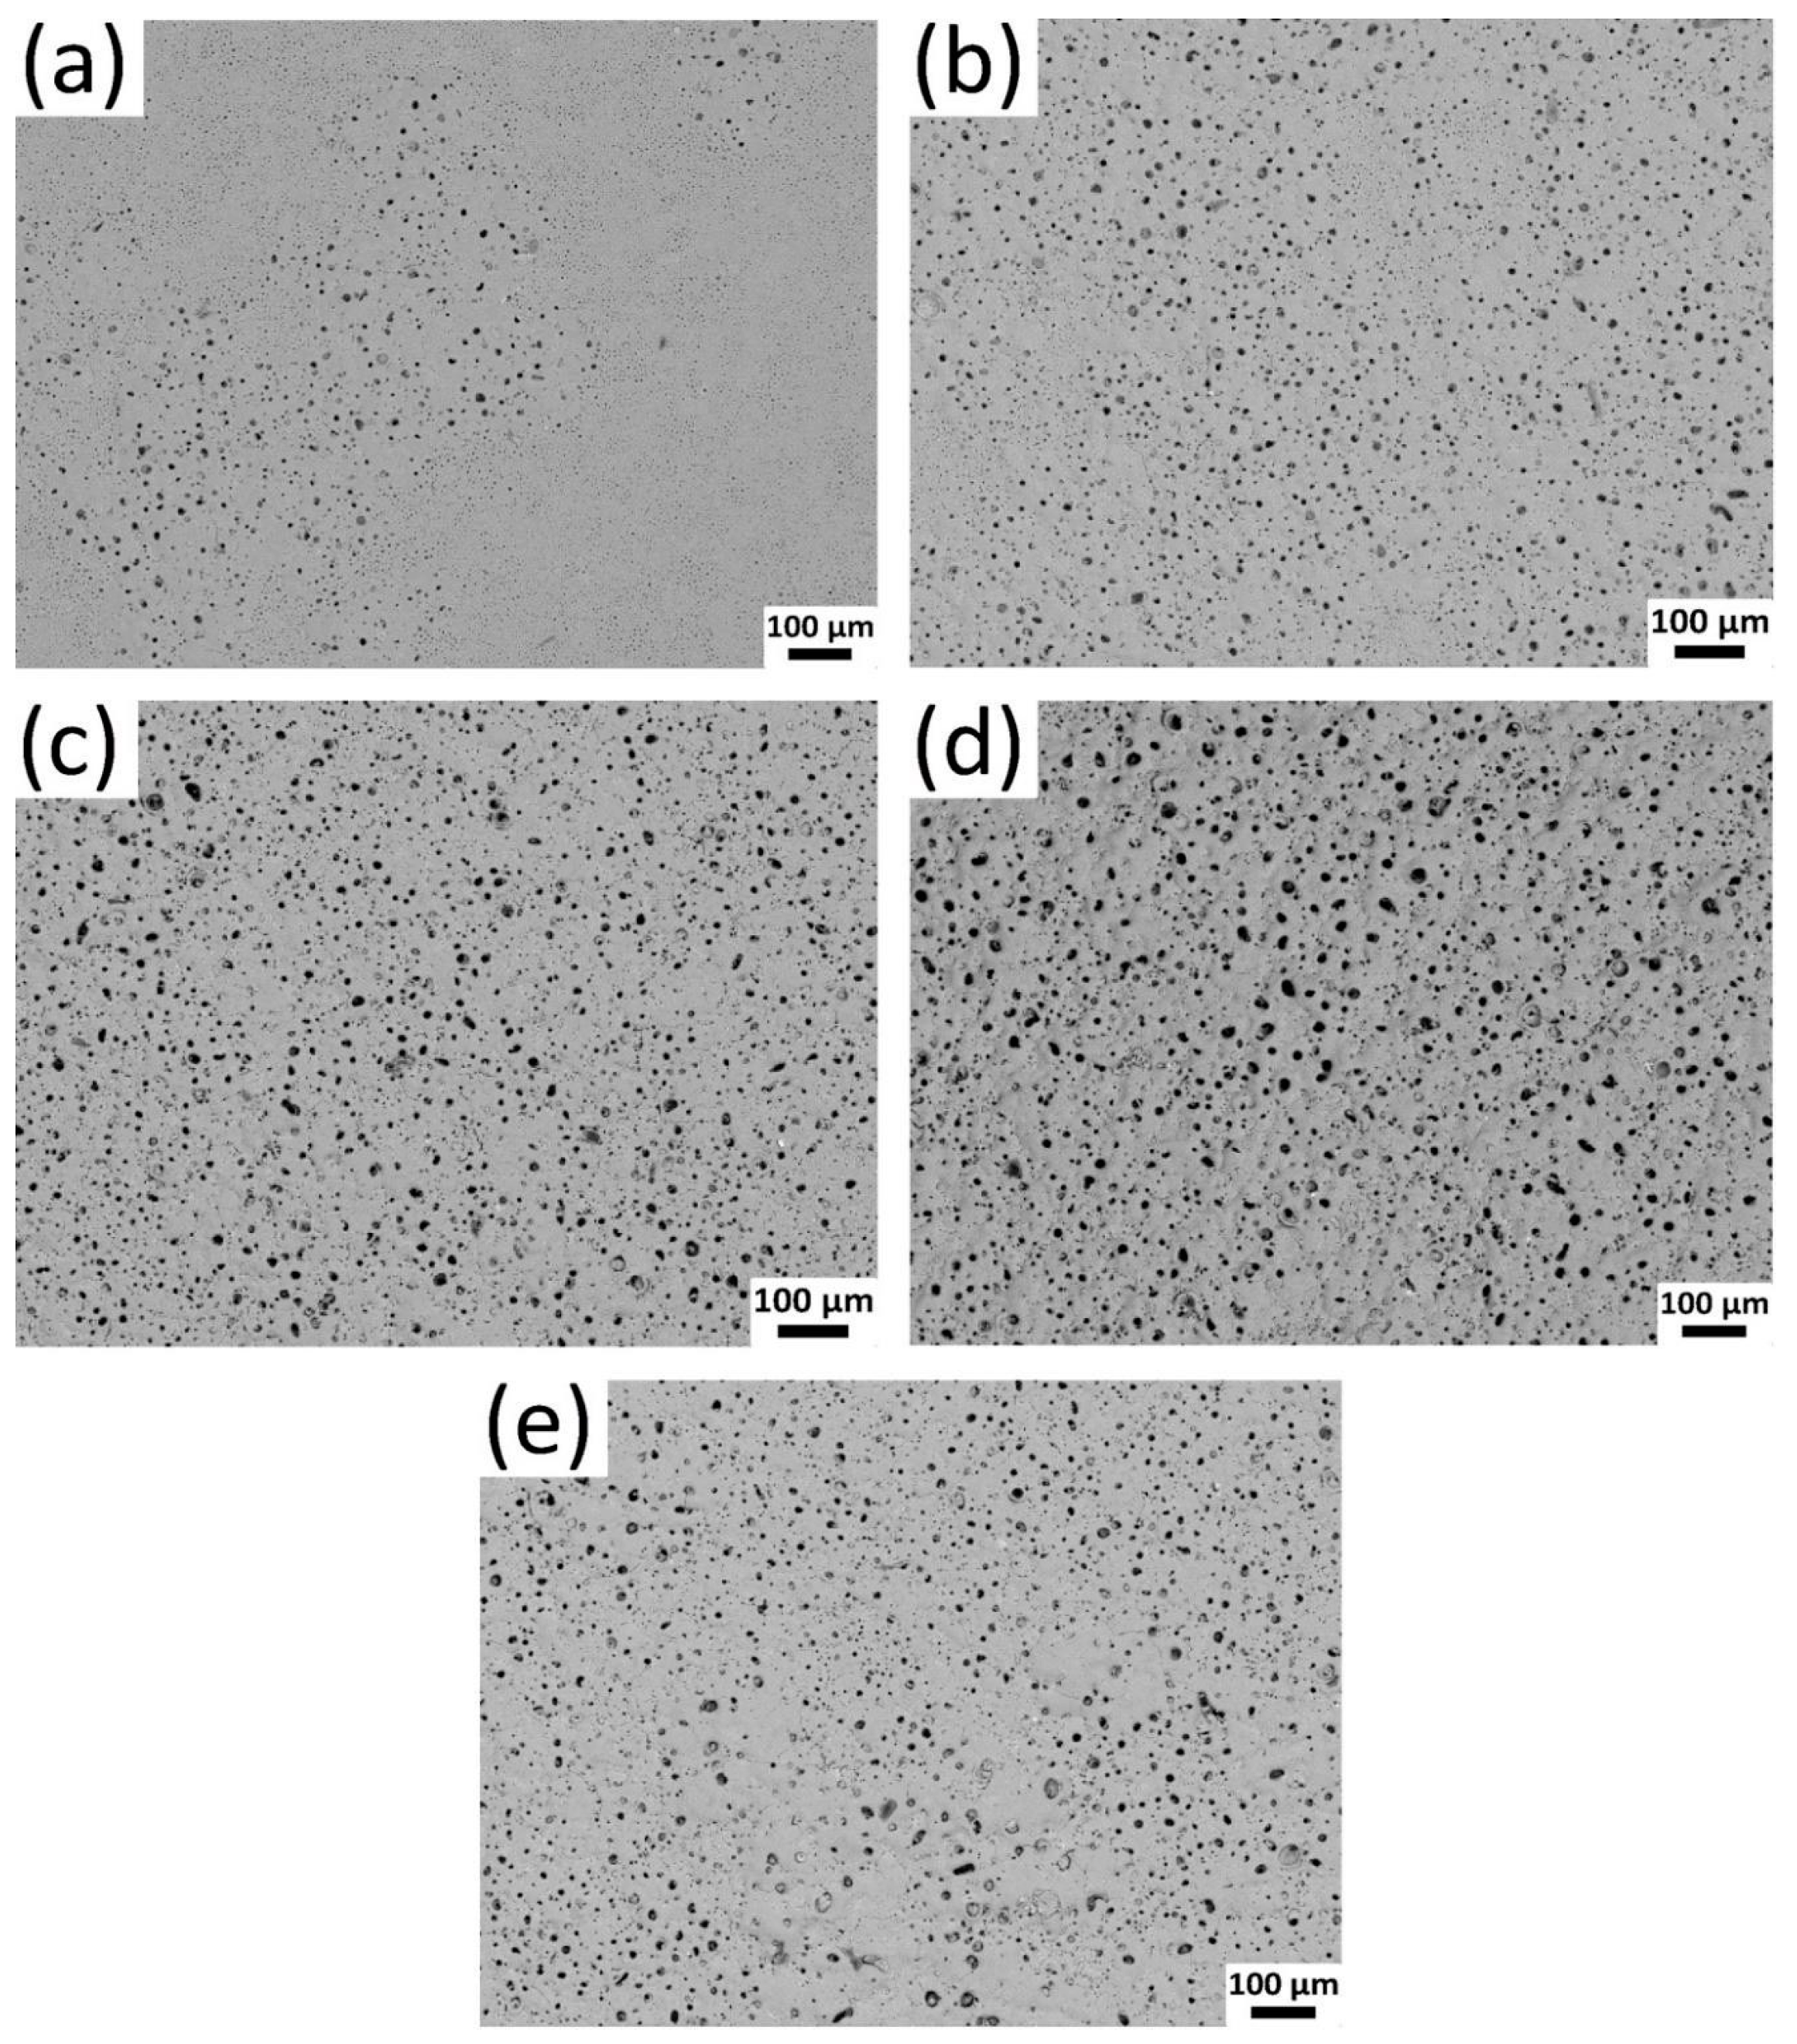
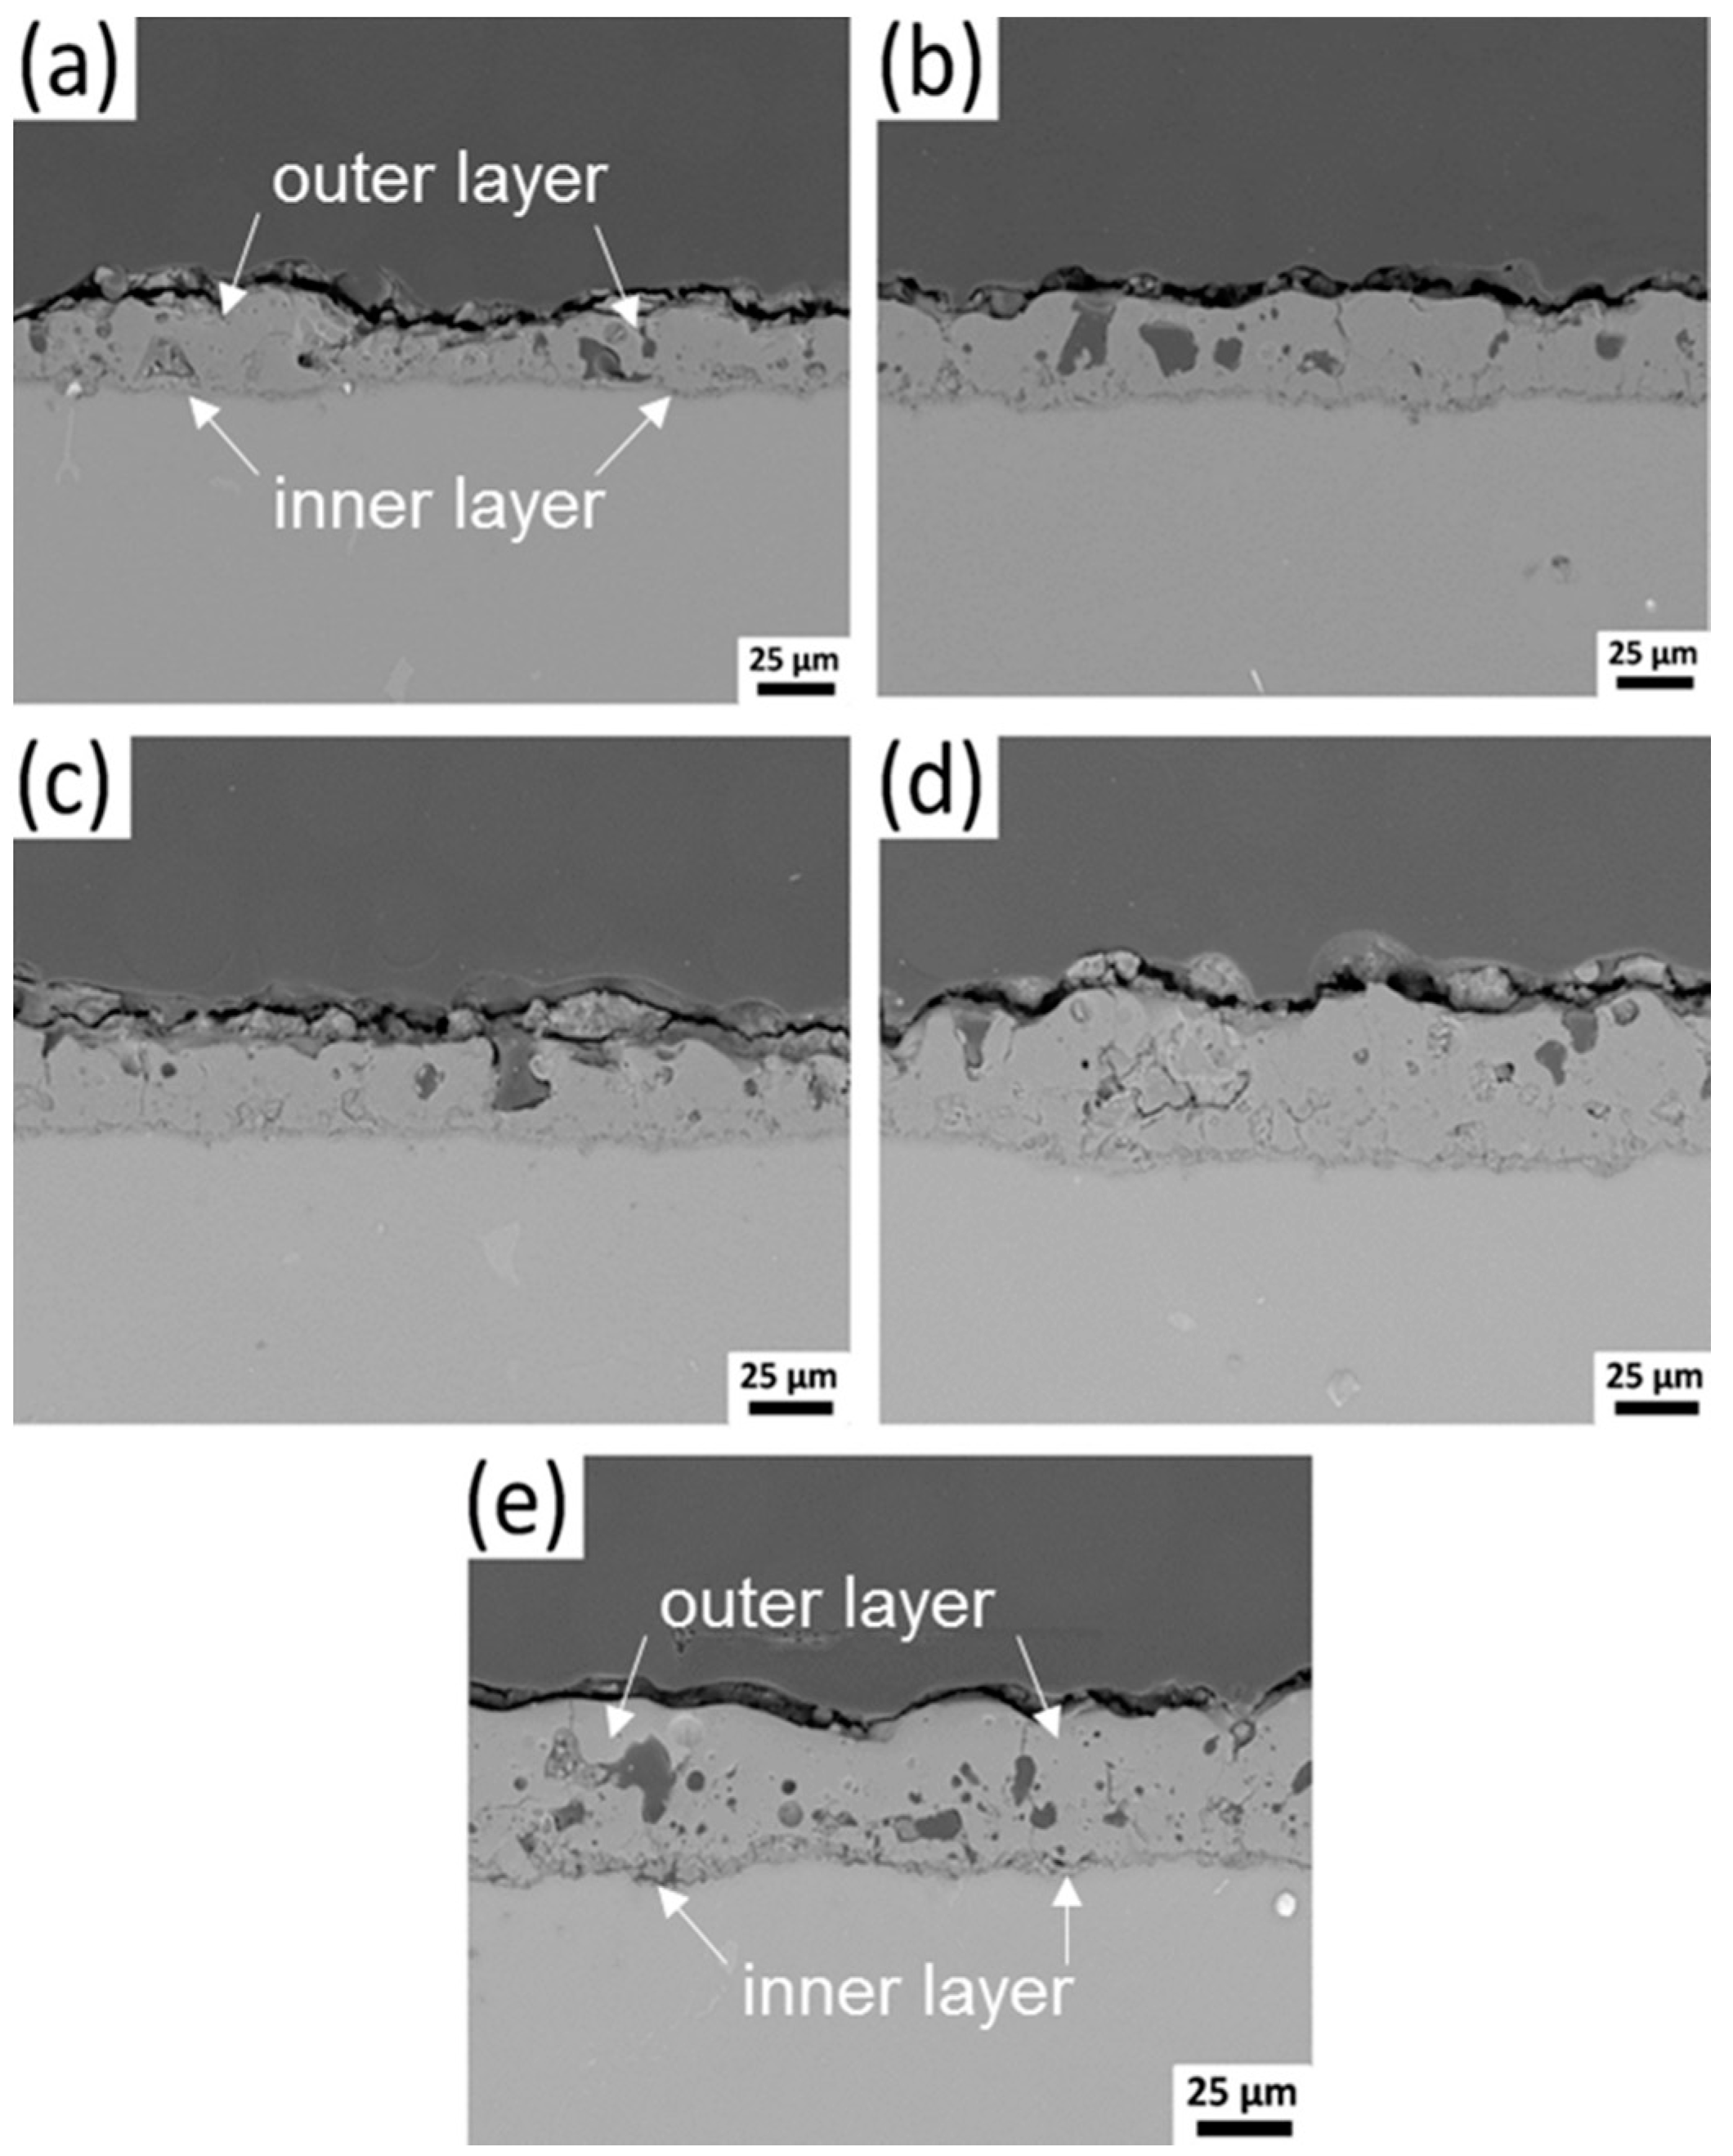
3.1. Microstructure

The effect of the treatment duration on the surface morphology of the PEO coatings is shown in Figure 1. It is evident that the number, size and distribution of the open pores is mainly related to the treatment duration. At the very beginning (1 min), few open pores appear in localized areas on the coating surface, indicating that the growth of the layer is inhomogeneous at the initial stage. A larger number of large-sized pores can be observed on the coating surface with a prolonged treatment duration (3 and 5 min). The specimen coated for 20 min revealed a much higher pore density with large-sized and uniformly distributed pores. It is also worth noting that the pore morphology on the coating surface remained unchanged after oxidation for 1 h. Moreover, apparent protrusions in the vicinity of large-sized pores indicate re-deposition of melted coating materials after the localized dielectric breakdown of the layer.
Backscattered electron images of the cross-section of the coatings are shown in Figure 2. The coatings are composed of two layers, an outer porous layer and an inner barrier layer, between which a characteristic pore band for PEO coatings produced from phosphate-based electrolyte is clearly observed [33]. A longer treatment duration is likely to generate more defects in the inner layer, specifically for the coating treated for 60 min. The cross-section of the 1 min-treated PEO coating was very inhomogeneous and characterized by varied thicknesses in different regions, which is in good agreement with the pore morphology on the coating surface. The thickness of the coating increases with the treatment duration. Moreover, the coating thickness measured by SEM observation is well corroborated with the measurements from the eddy current probe (Figure 3). The growth of the PEO coatings exhibited significant variance during different stages. For example, the coatings grew at a rate of approximately 8 μm/min in the initial 5 min. However, the growth of the coatings slowed down to around 0.2 μm/min after reaching a certain thickness (40 μm). This can be ascribed to the low current density at the final stage of the voltage-control regime. A thick layer is harder to grow when the applied voltage remains unchanged [34,35]. As for the defects and open pores, they are slightly affected by the treatment duration and coating thickness.

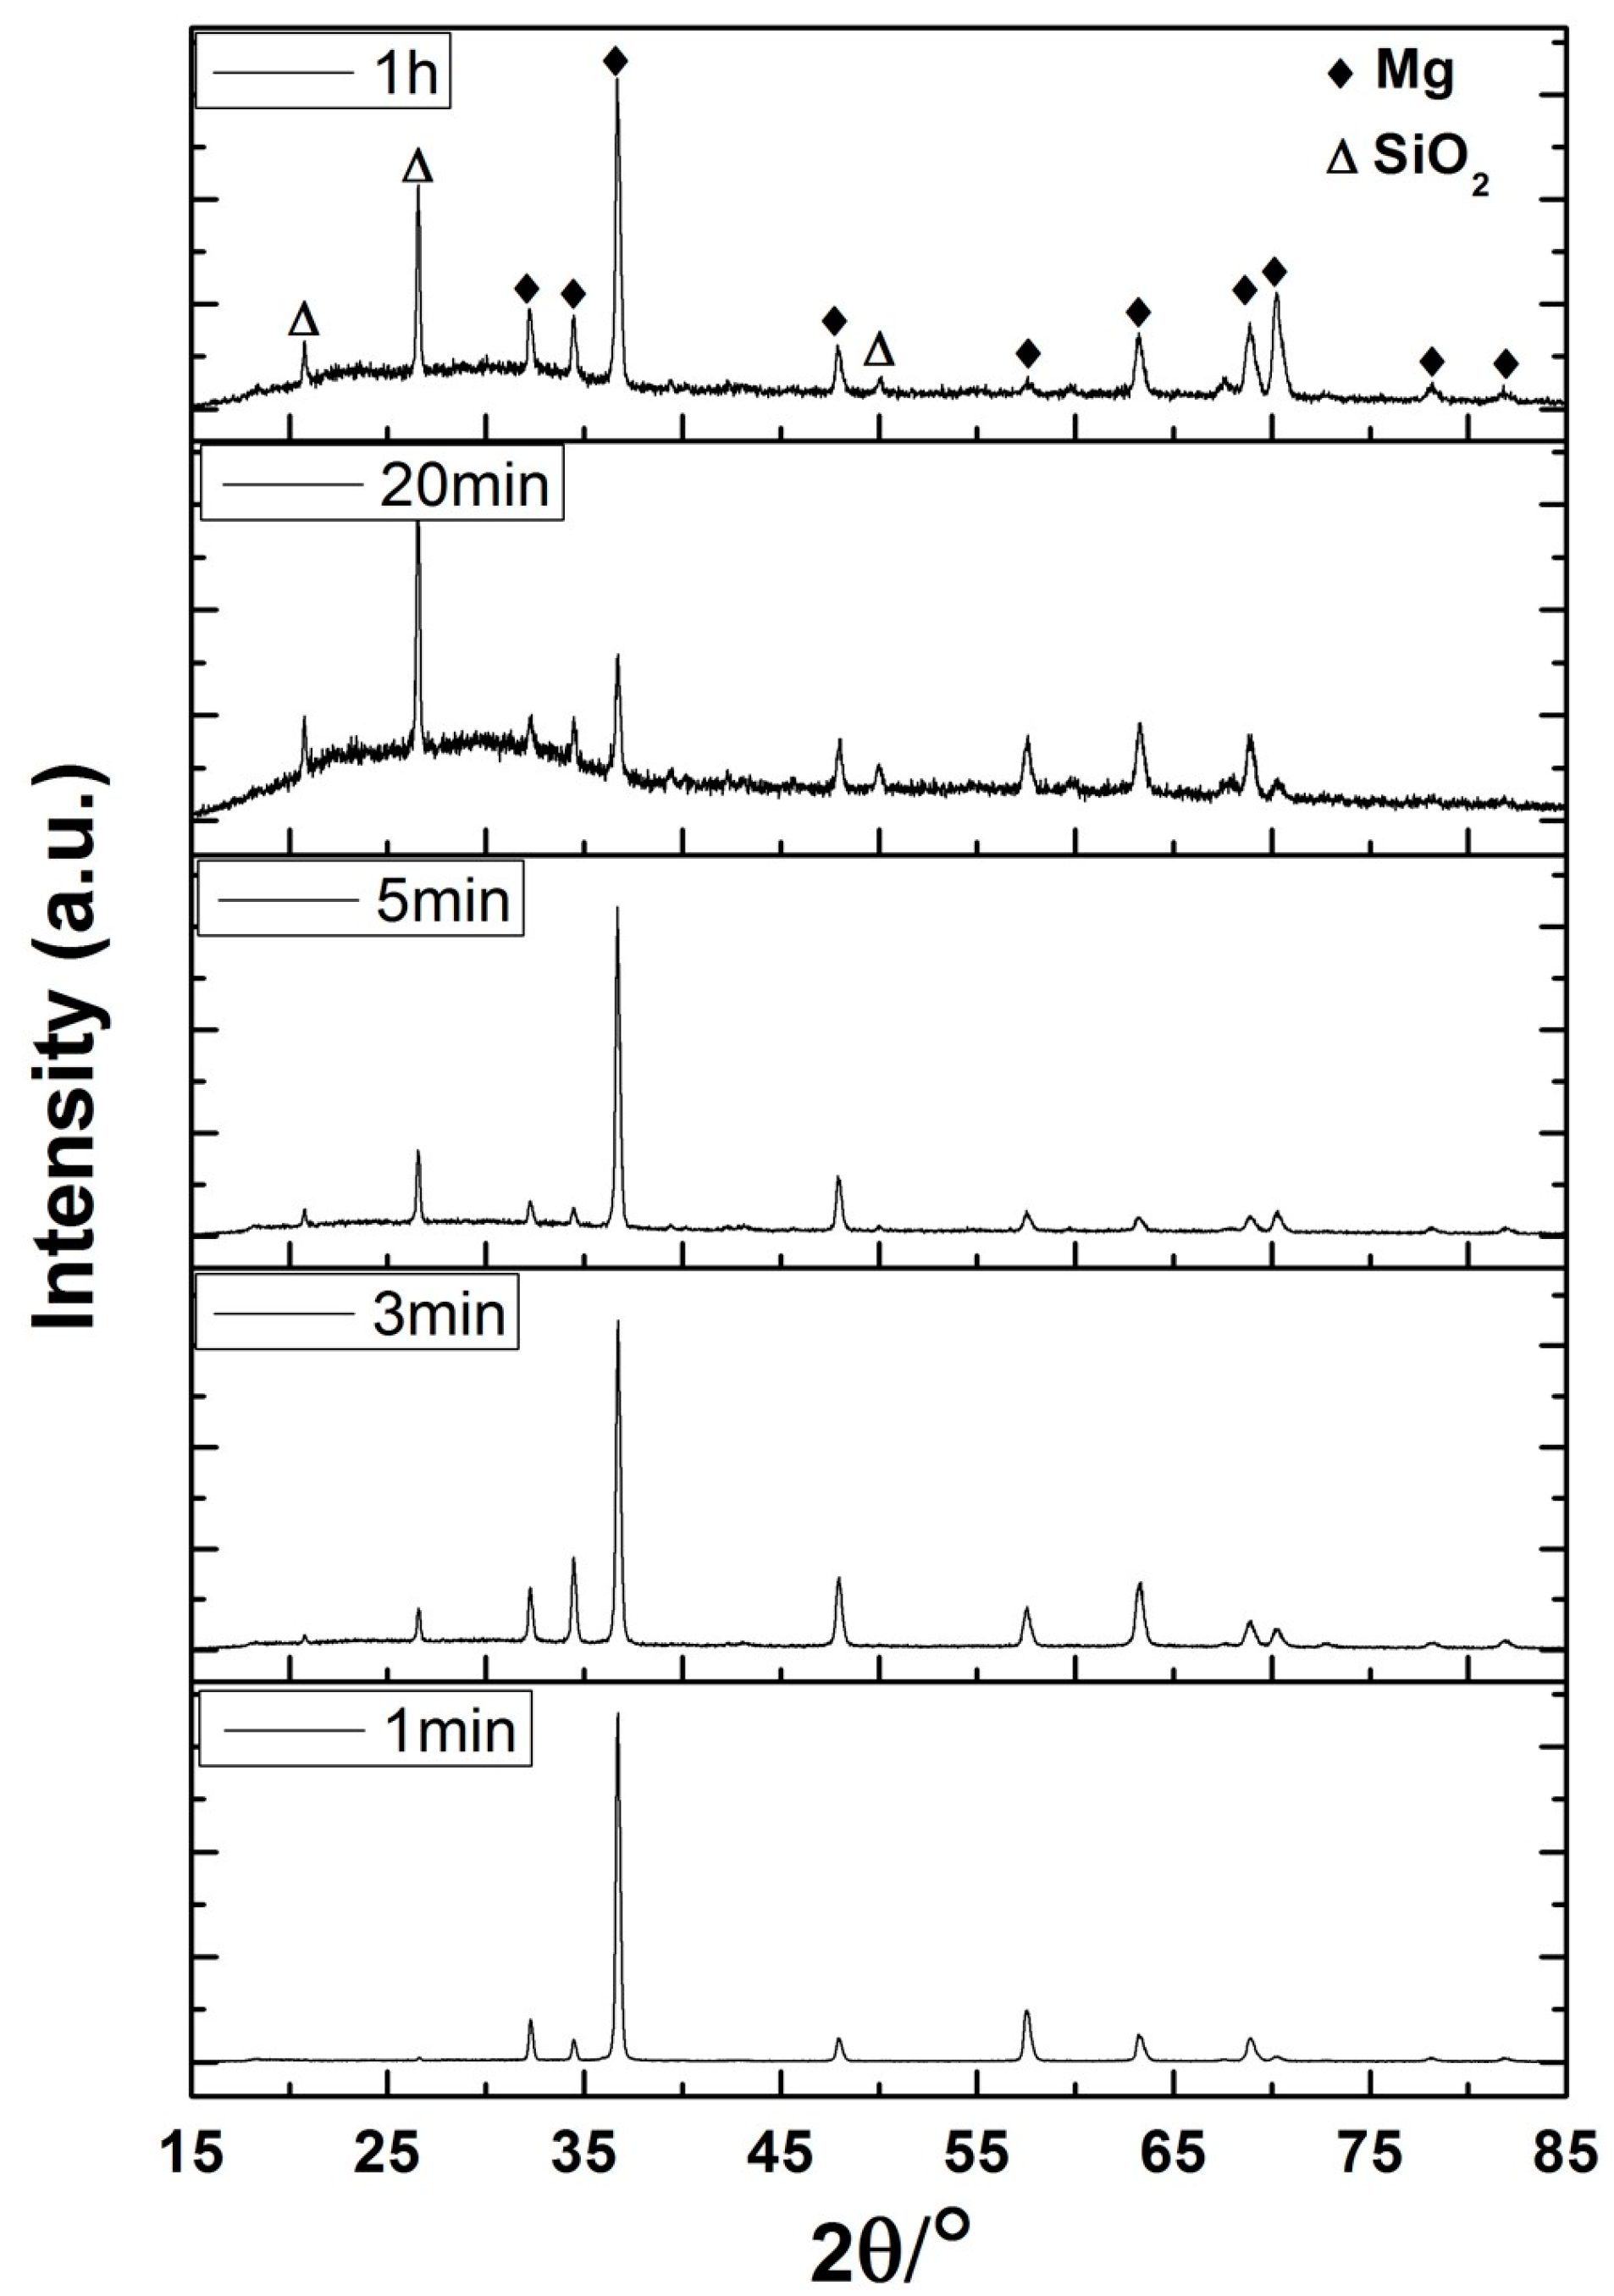
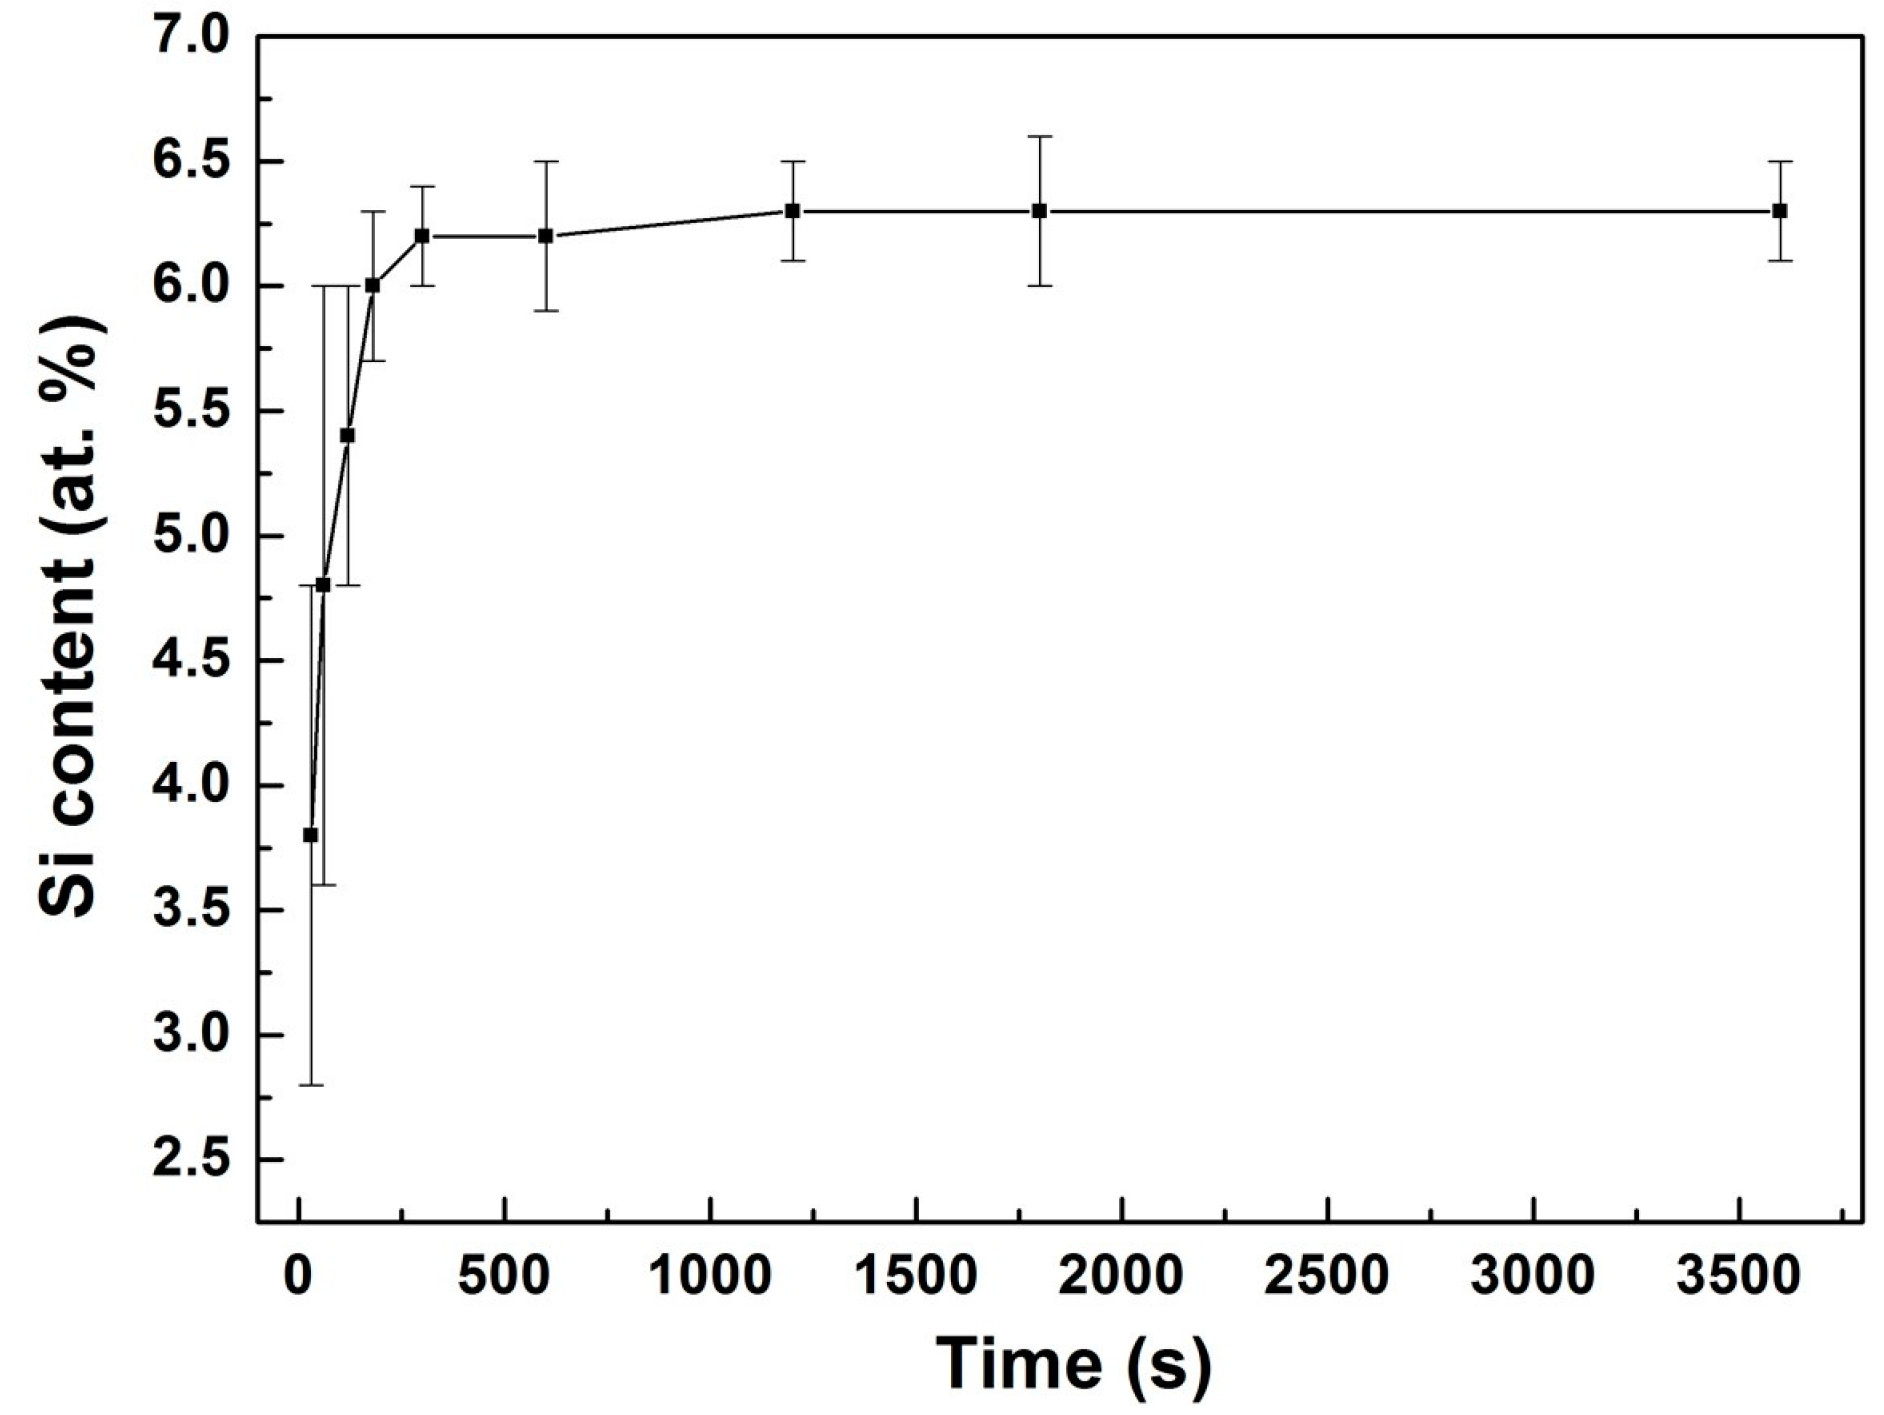
3.2. Phase and Chemical Composition

The X-ray diffraction patterns of the coatings are shown in Figure 4. The appearance of Mg peaks is ascribed to the penetration of the X-ray through the entire coating. SiO2 particles can be found in all the coatings except the one treated for 1 min, indicating that the micro-sized particles have been inertly incorporated into the layer and the coating treated for a short duration might be too thin to preserve the particles. Particularly, the coatings treated for 20 min and 1 h are composed of an amorphous phase in the 2θ range of 20–30°, possibly based on phosphorus-containing phases, which is consistent with our previous investigations [19]. EDS analysis was performed on the surface of all the coatings and the Si content is depicted in Figure 5, showing particle uptake during the coating growth process. It was found that the amount of the incorporated particles increased rapidly within the first 5 min, then stayed at the same level (6.3 at.%) in the later stage. It is worth noting that the evolution of the particle content on the coating surface is somehow dissimilar to that of the coating thickness at the final stage. The layer grew slowly outwards after a certain treatment duration, while the particle content remained unchanged in the meantime. This can be ascribed to the fact that the uptake of particles is primarily related to the characteristics of the discharges and pore morphology on the coating surface, which remain almost unchanged at the final stage under a constant voltage mode.

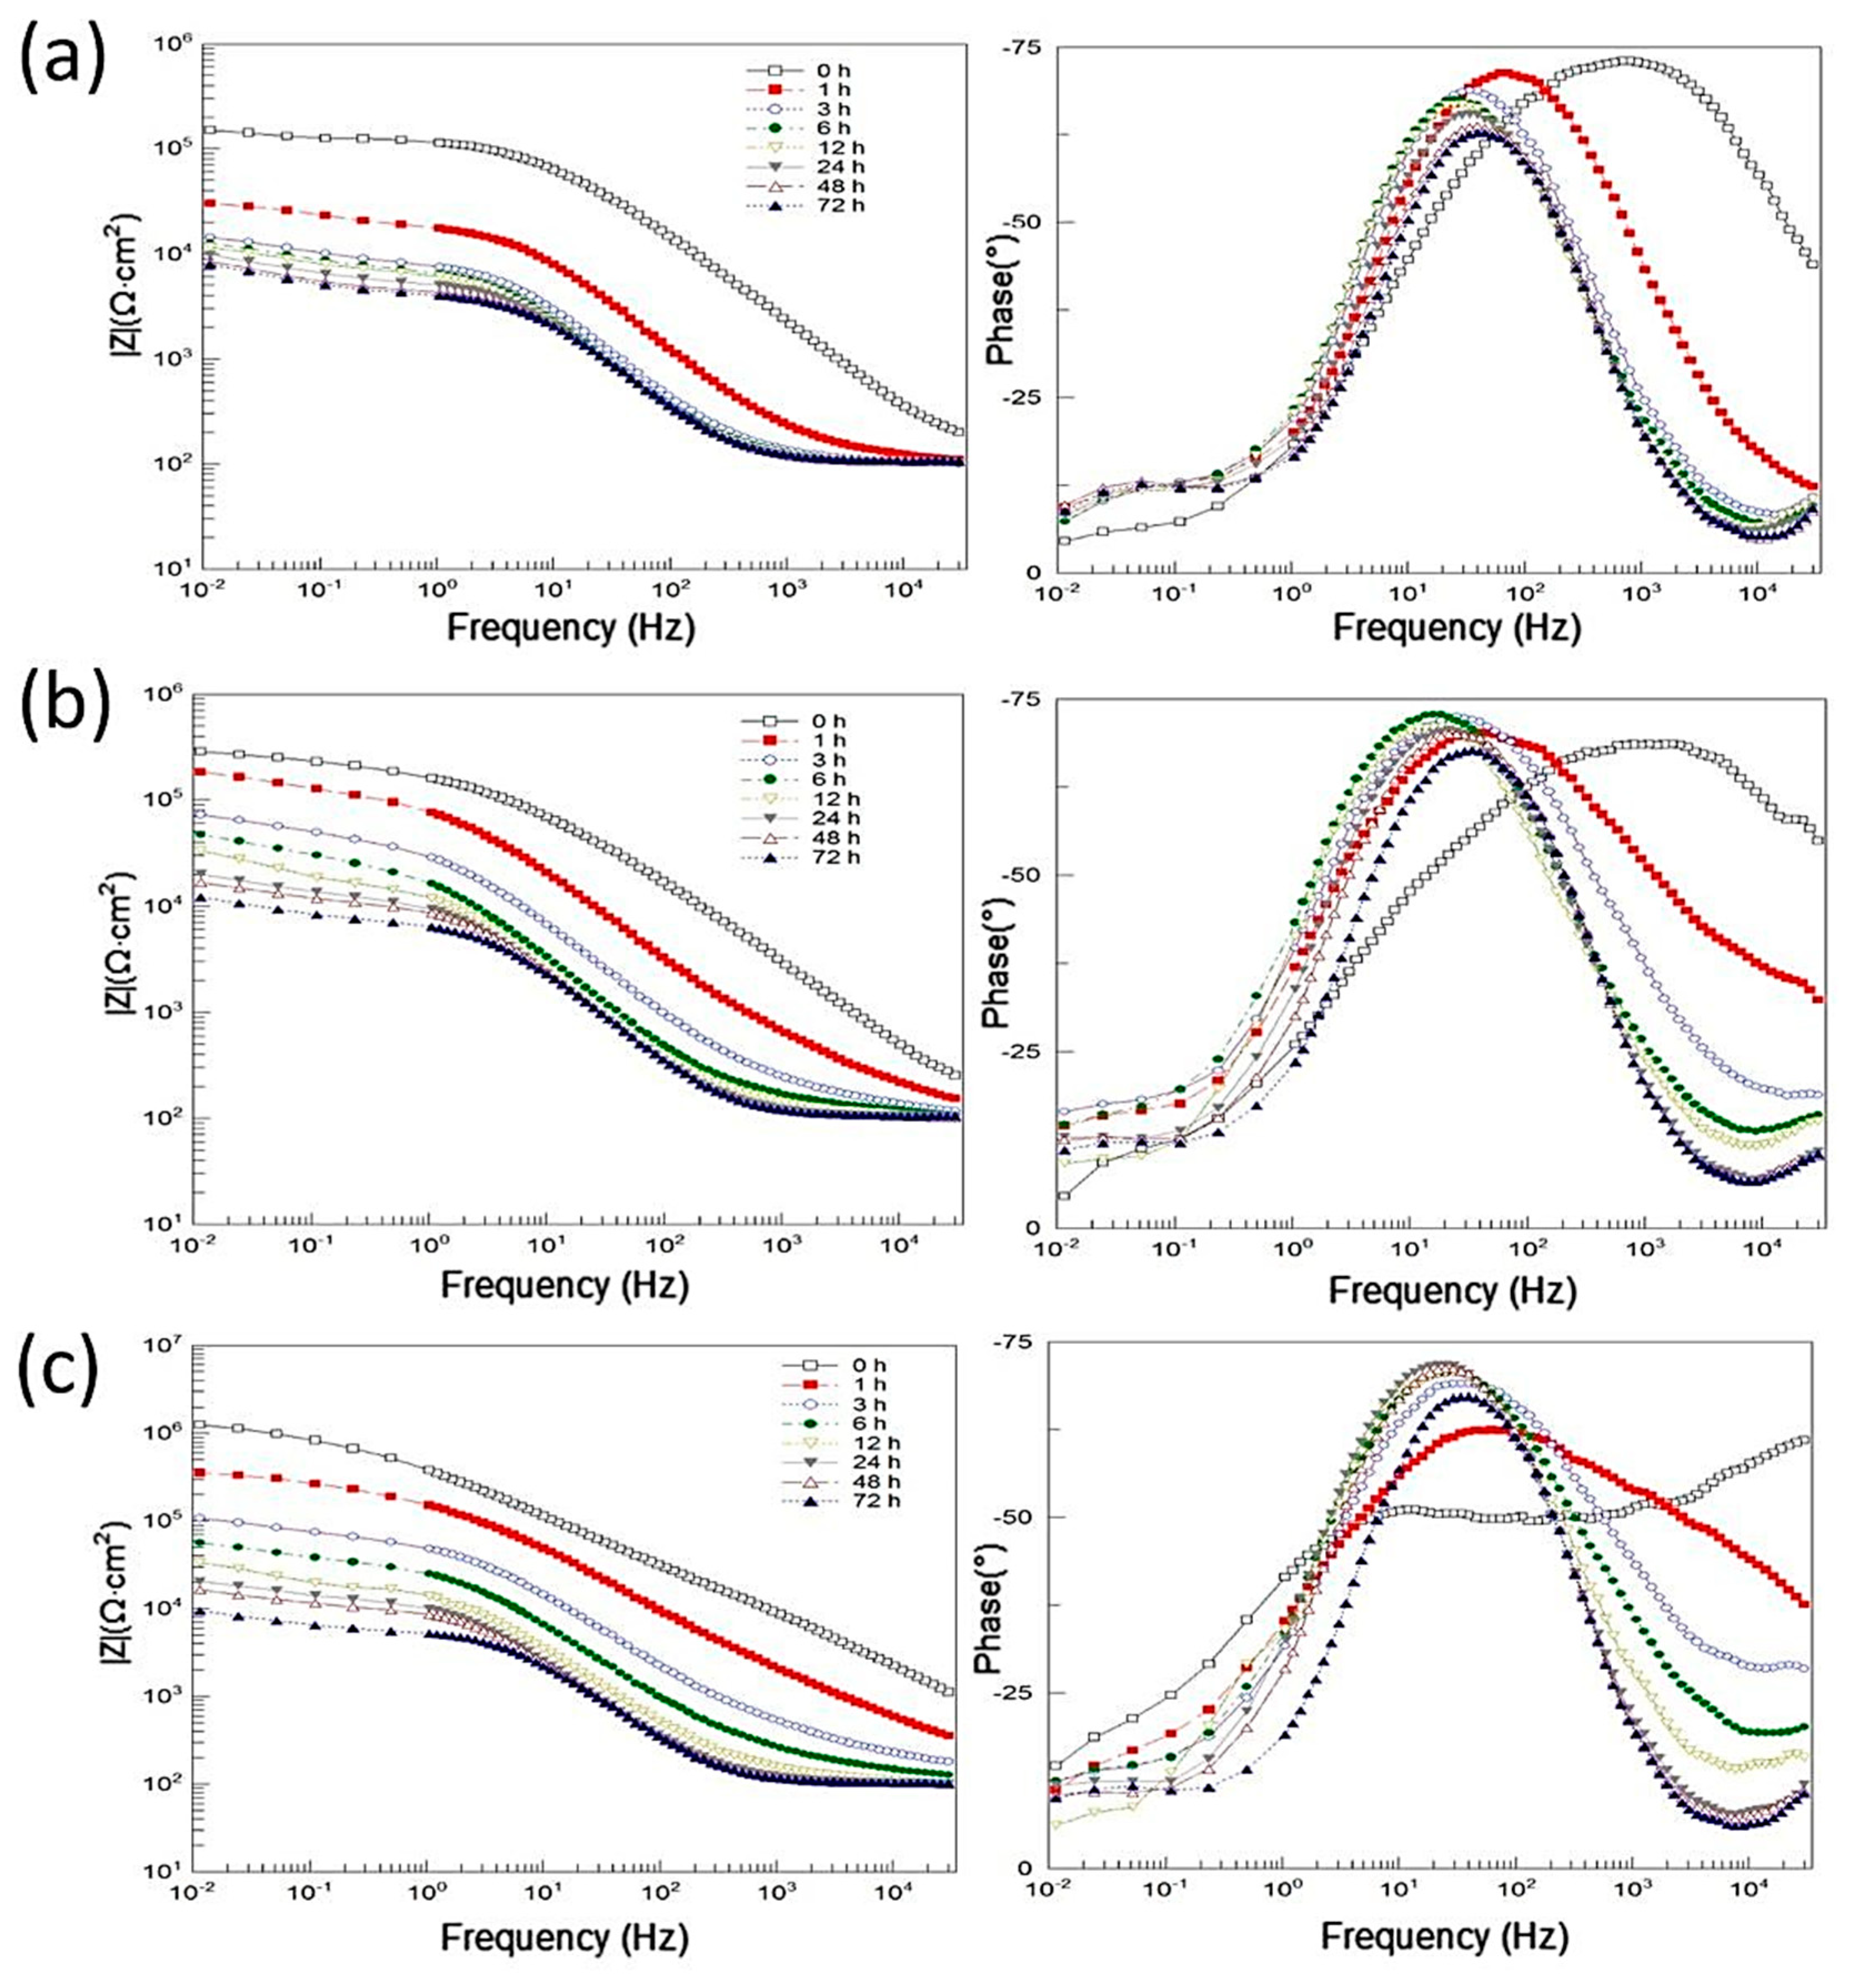
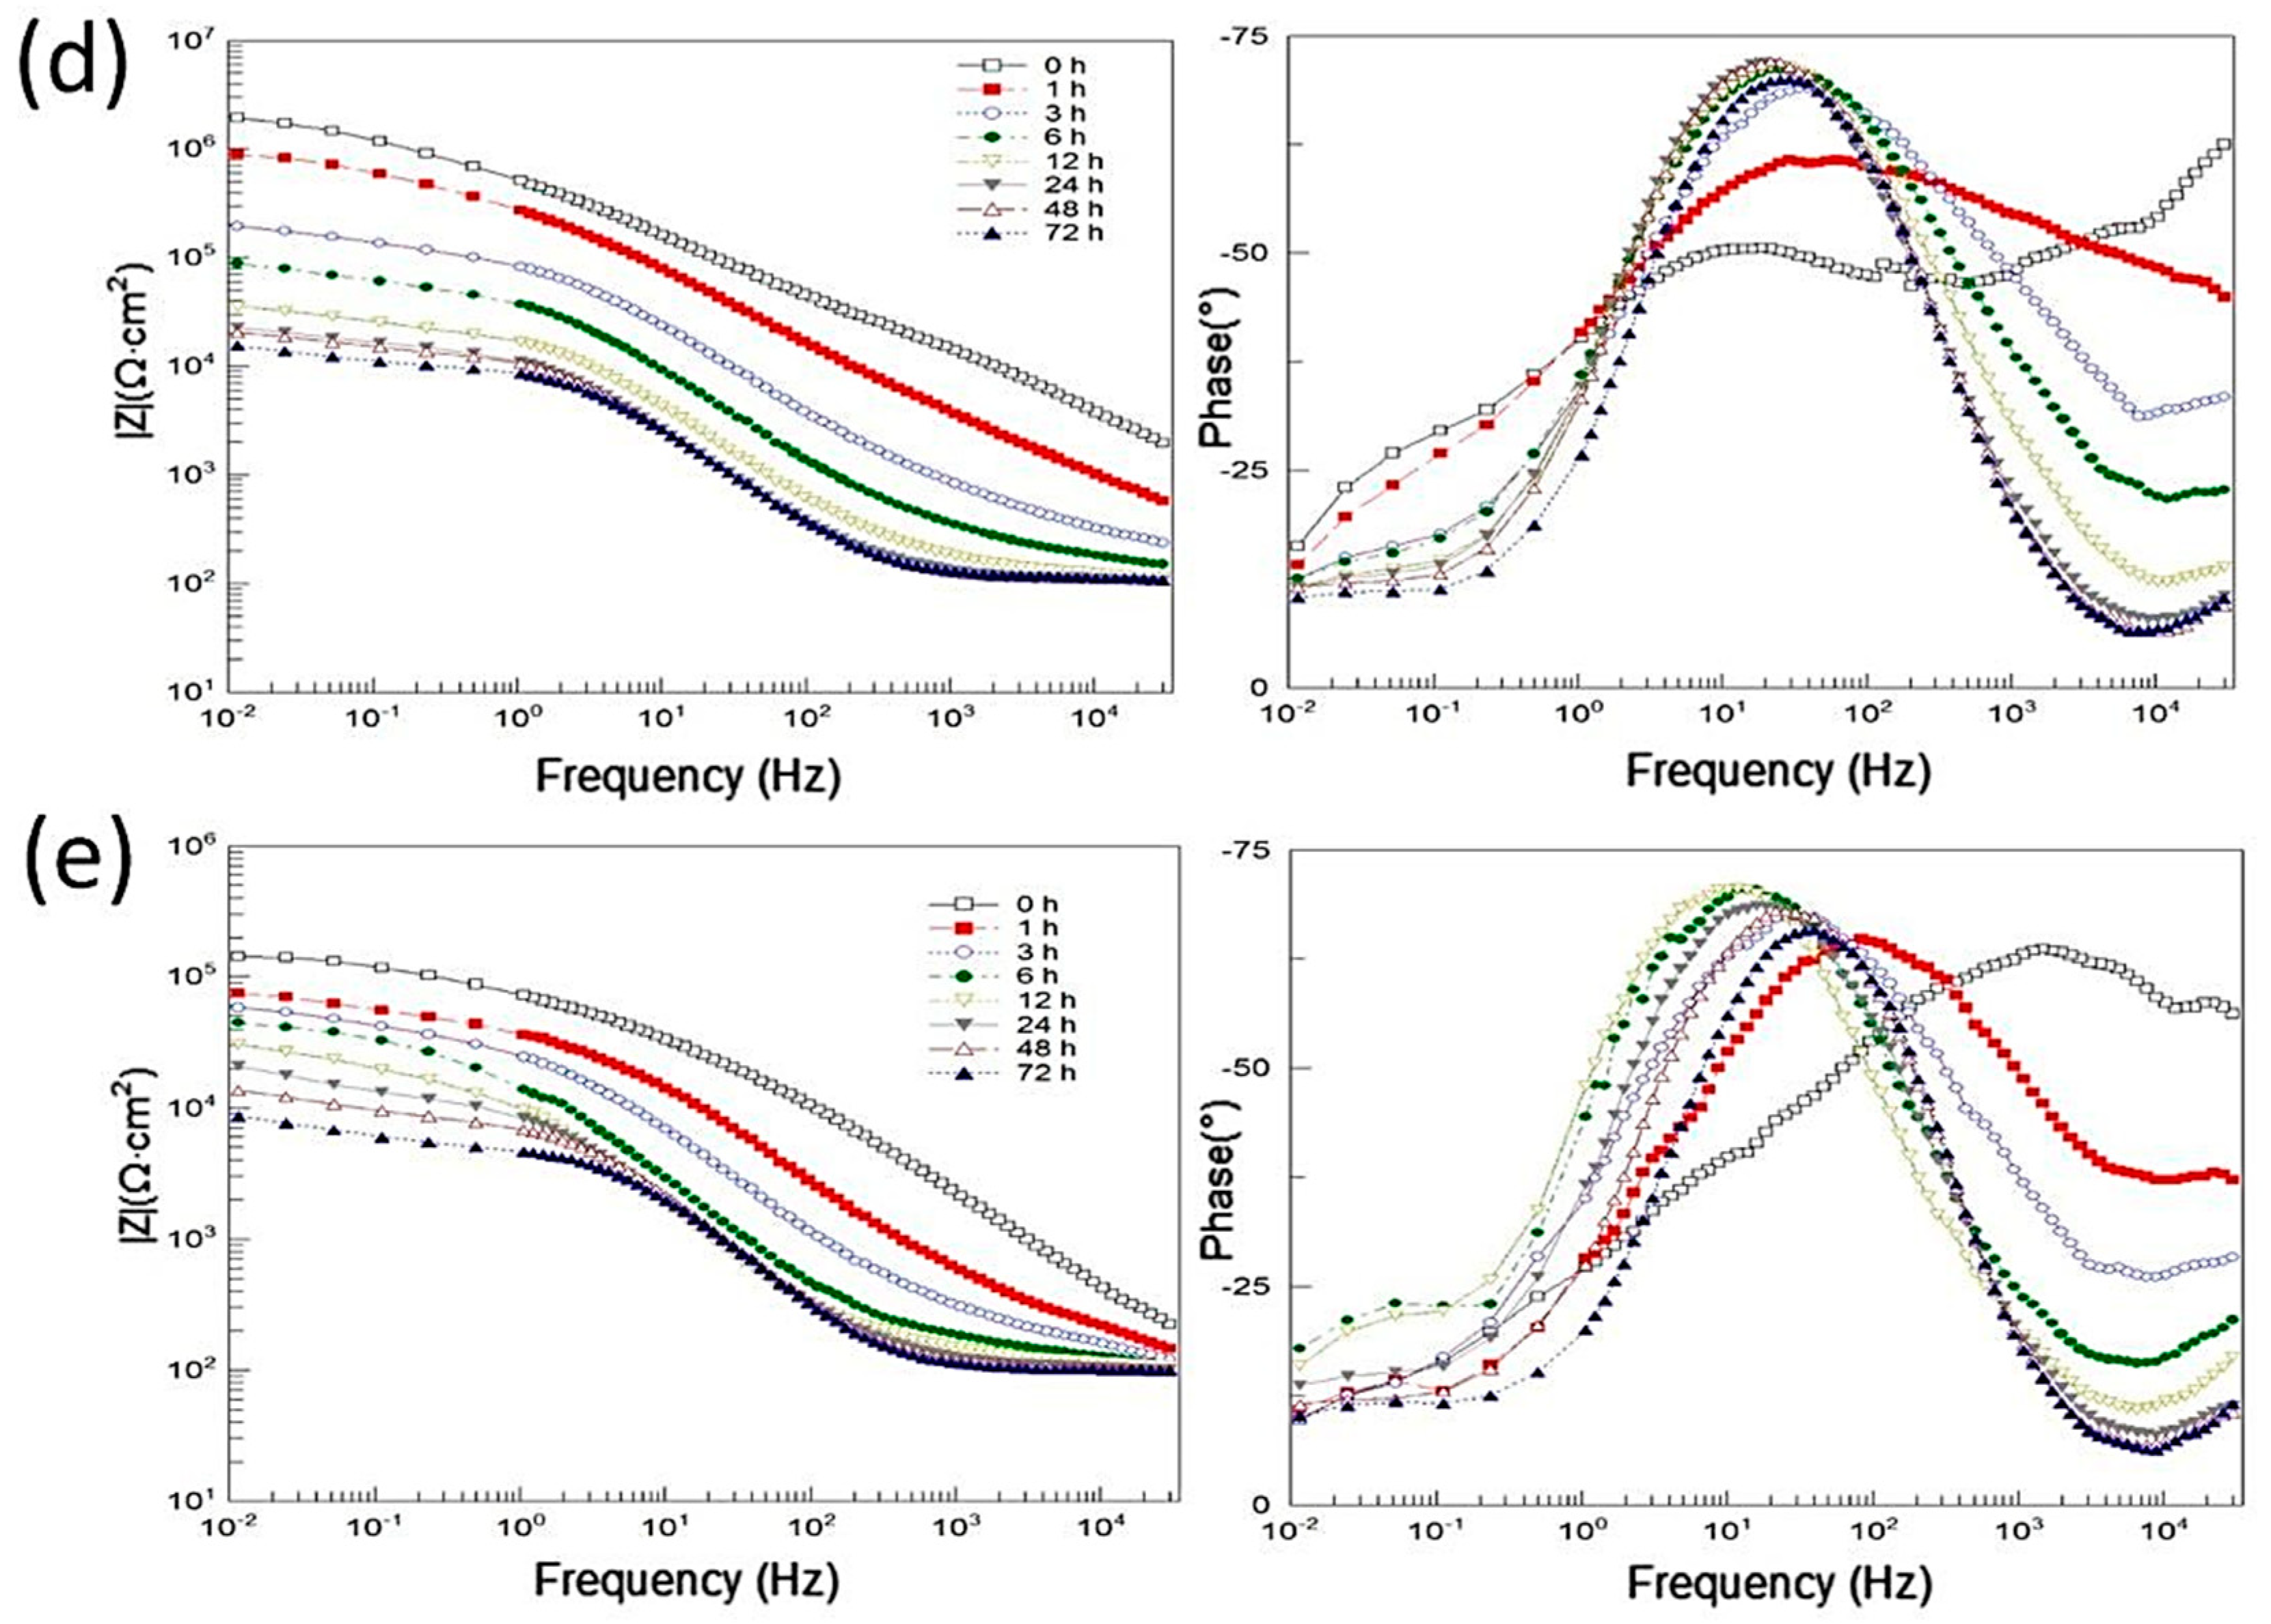
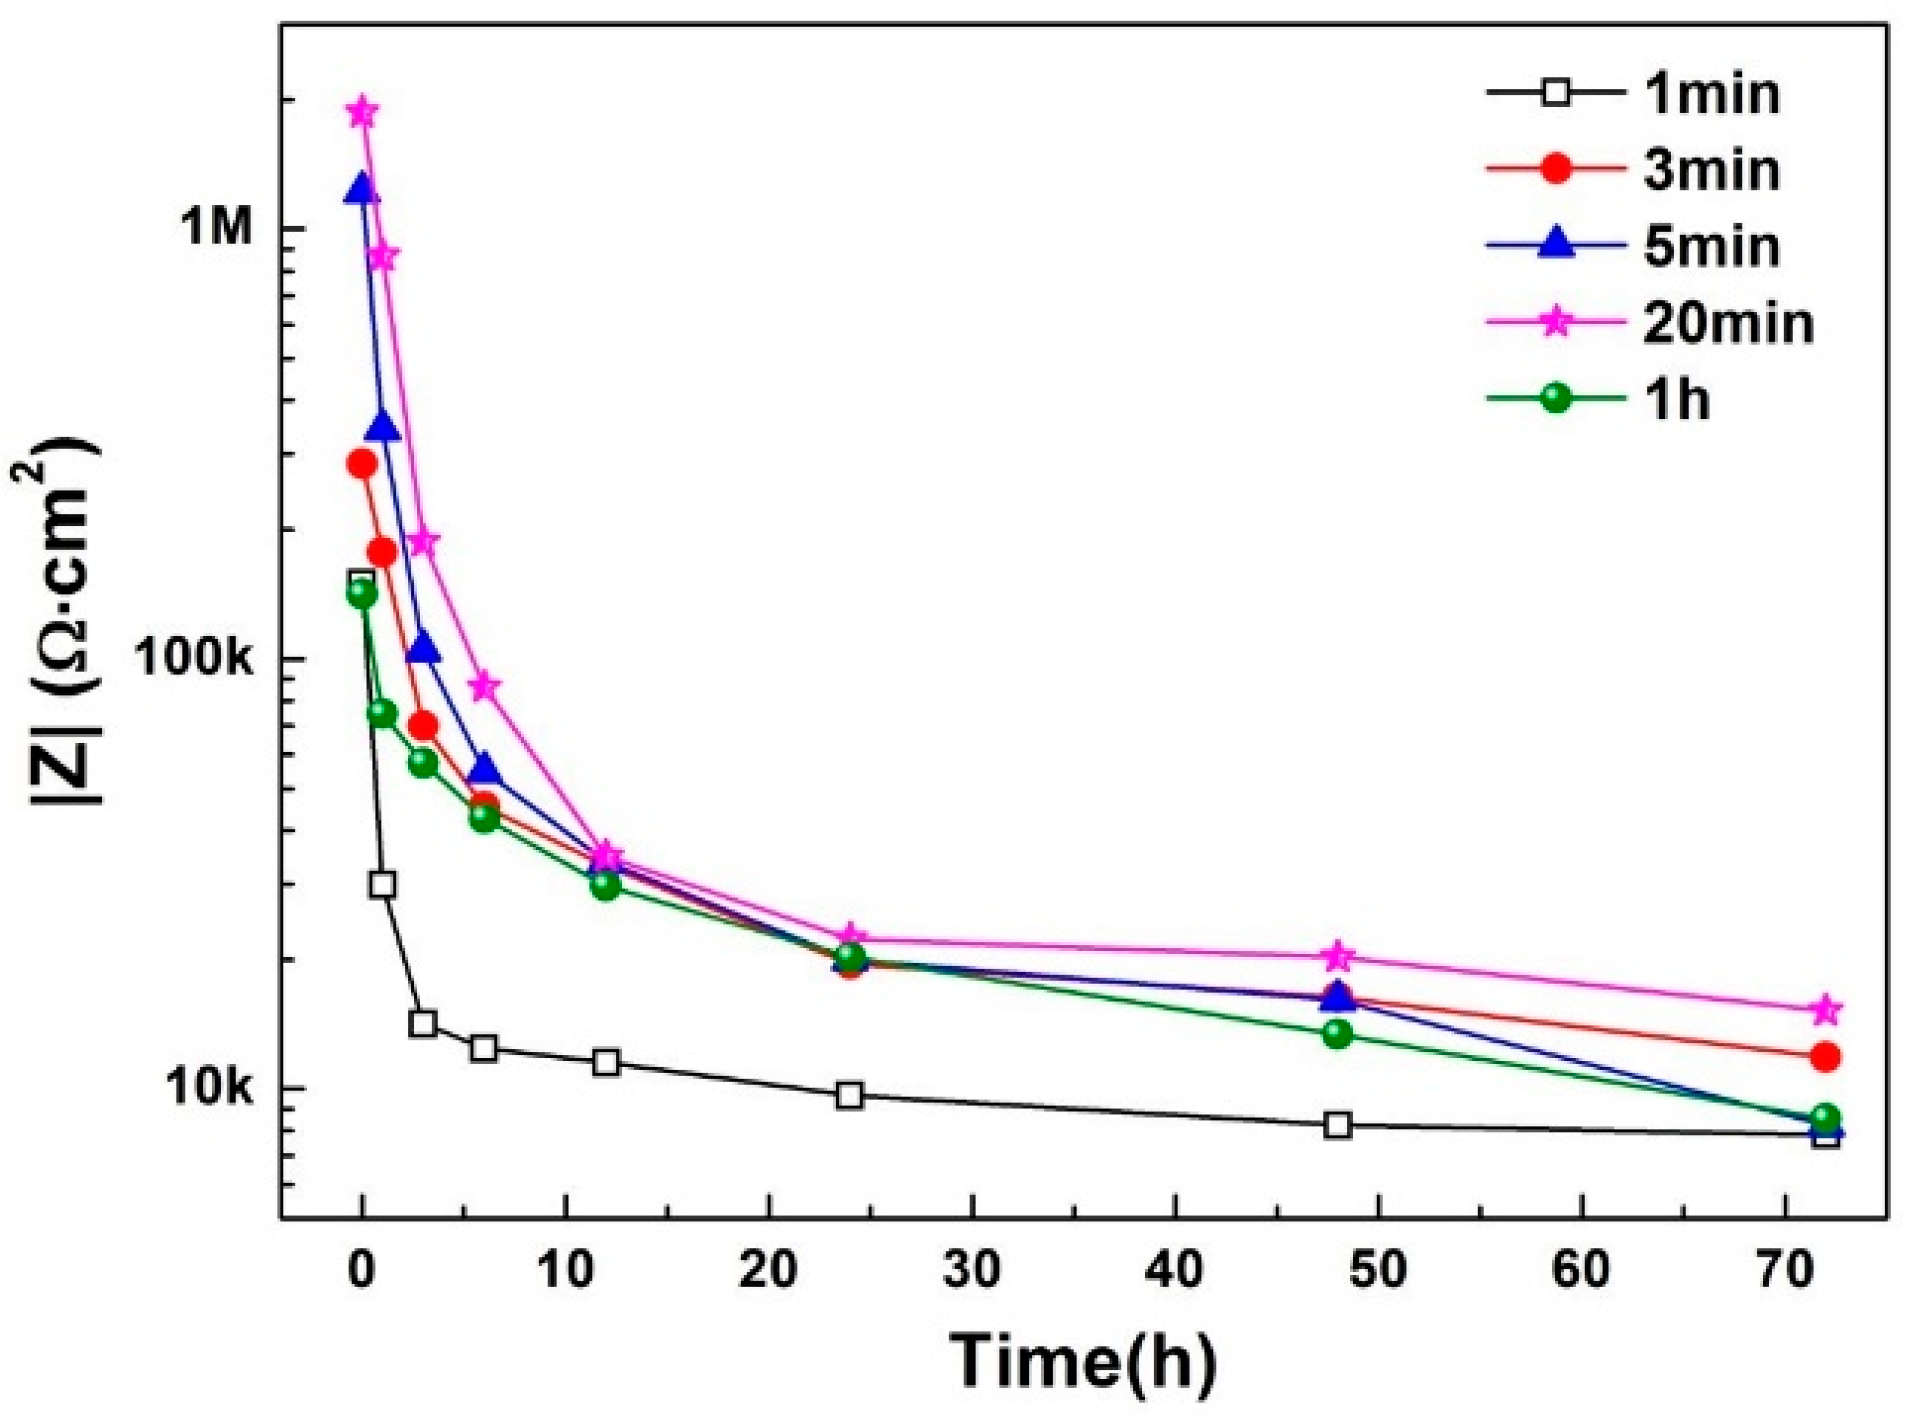
3.3. Corrosion Behavior

The degradation behavior of the coatings in 0.5 wt % NaCl solution was examined by EIS measurements. The Bode plots of the EIS spectra for PEO coatings obtained after different treatment durations are presented in Figure 6. Two well-defined time constants can be distinguished in all Bode plots at low and high frequencies, except for the coating treated for 1 min. It should be noted that this measurement was done after immersion for 5 min when the open circuit potential (OCP) of the coating was relatively stable. For the specimen treated for 1 min, the coating was too thin and inhomogeneous to prevent the substrate from corrosion. However, the aggressive ions could not fill the open pores and reach the substrate in the case of thick coatings. Therefore, the time constant at high frequency (104 Hz) can be assigned to the outer layer, while the time constant at lower frequencies (10 Hz) can be assigned to the compact inner layer. Signs of an additional time constant in the low frequency range appear after 1-h immersion. This is ascribed to the initiation of the corrosion process at the metal/electrolyte interface. The time constant at high frequencies disappeared with a prolonged immersion time, indicating that the outer layer is fully penetrated by the electrolyte.
The impedance at the lowest frequency (0.01 Hz) is used to roughly estimate the total corrosion resistance of different systems (Figure 7) to manifest the influence of treatment duration on the corrosion behavior of the PEO coatings. As expected, the coating treated for 1 min exhibited the lowest corrosion resistance and fastest degradation of all the coatings. The coating treated for 20 min showed the highest corrosion resistance, while the thickest coating (oxidized for 60 min) demonstrated relatively inferior property. The corrosion resistance of the coating treated for 3, 5 and 20 min was quite different, while the Si content on the coating surface was nearly the same. Therefore, the presence of the particles had a slight influence on the corrosion resistance of the PEO coating. The corrosion performance and degradation behavior of the PEO coating are mainly related to the coating thickness and barrier property of the inner layer, while the latter is more critical for the corrosion performance.

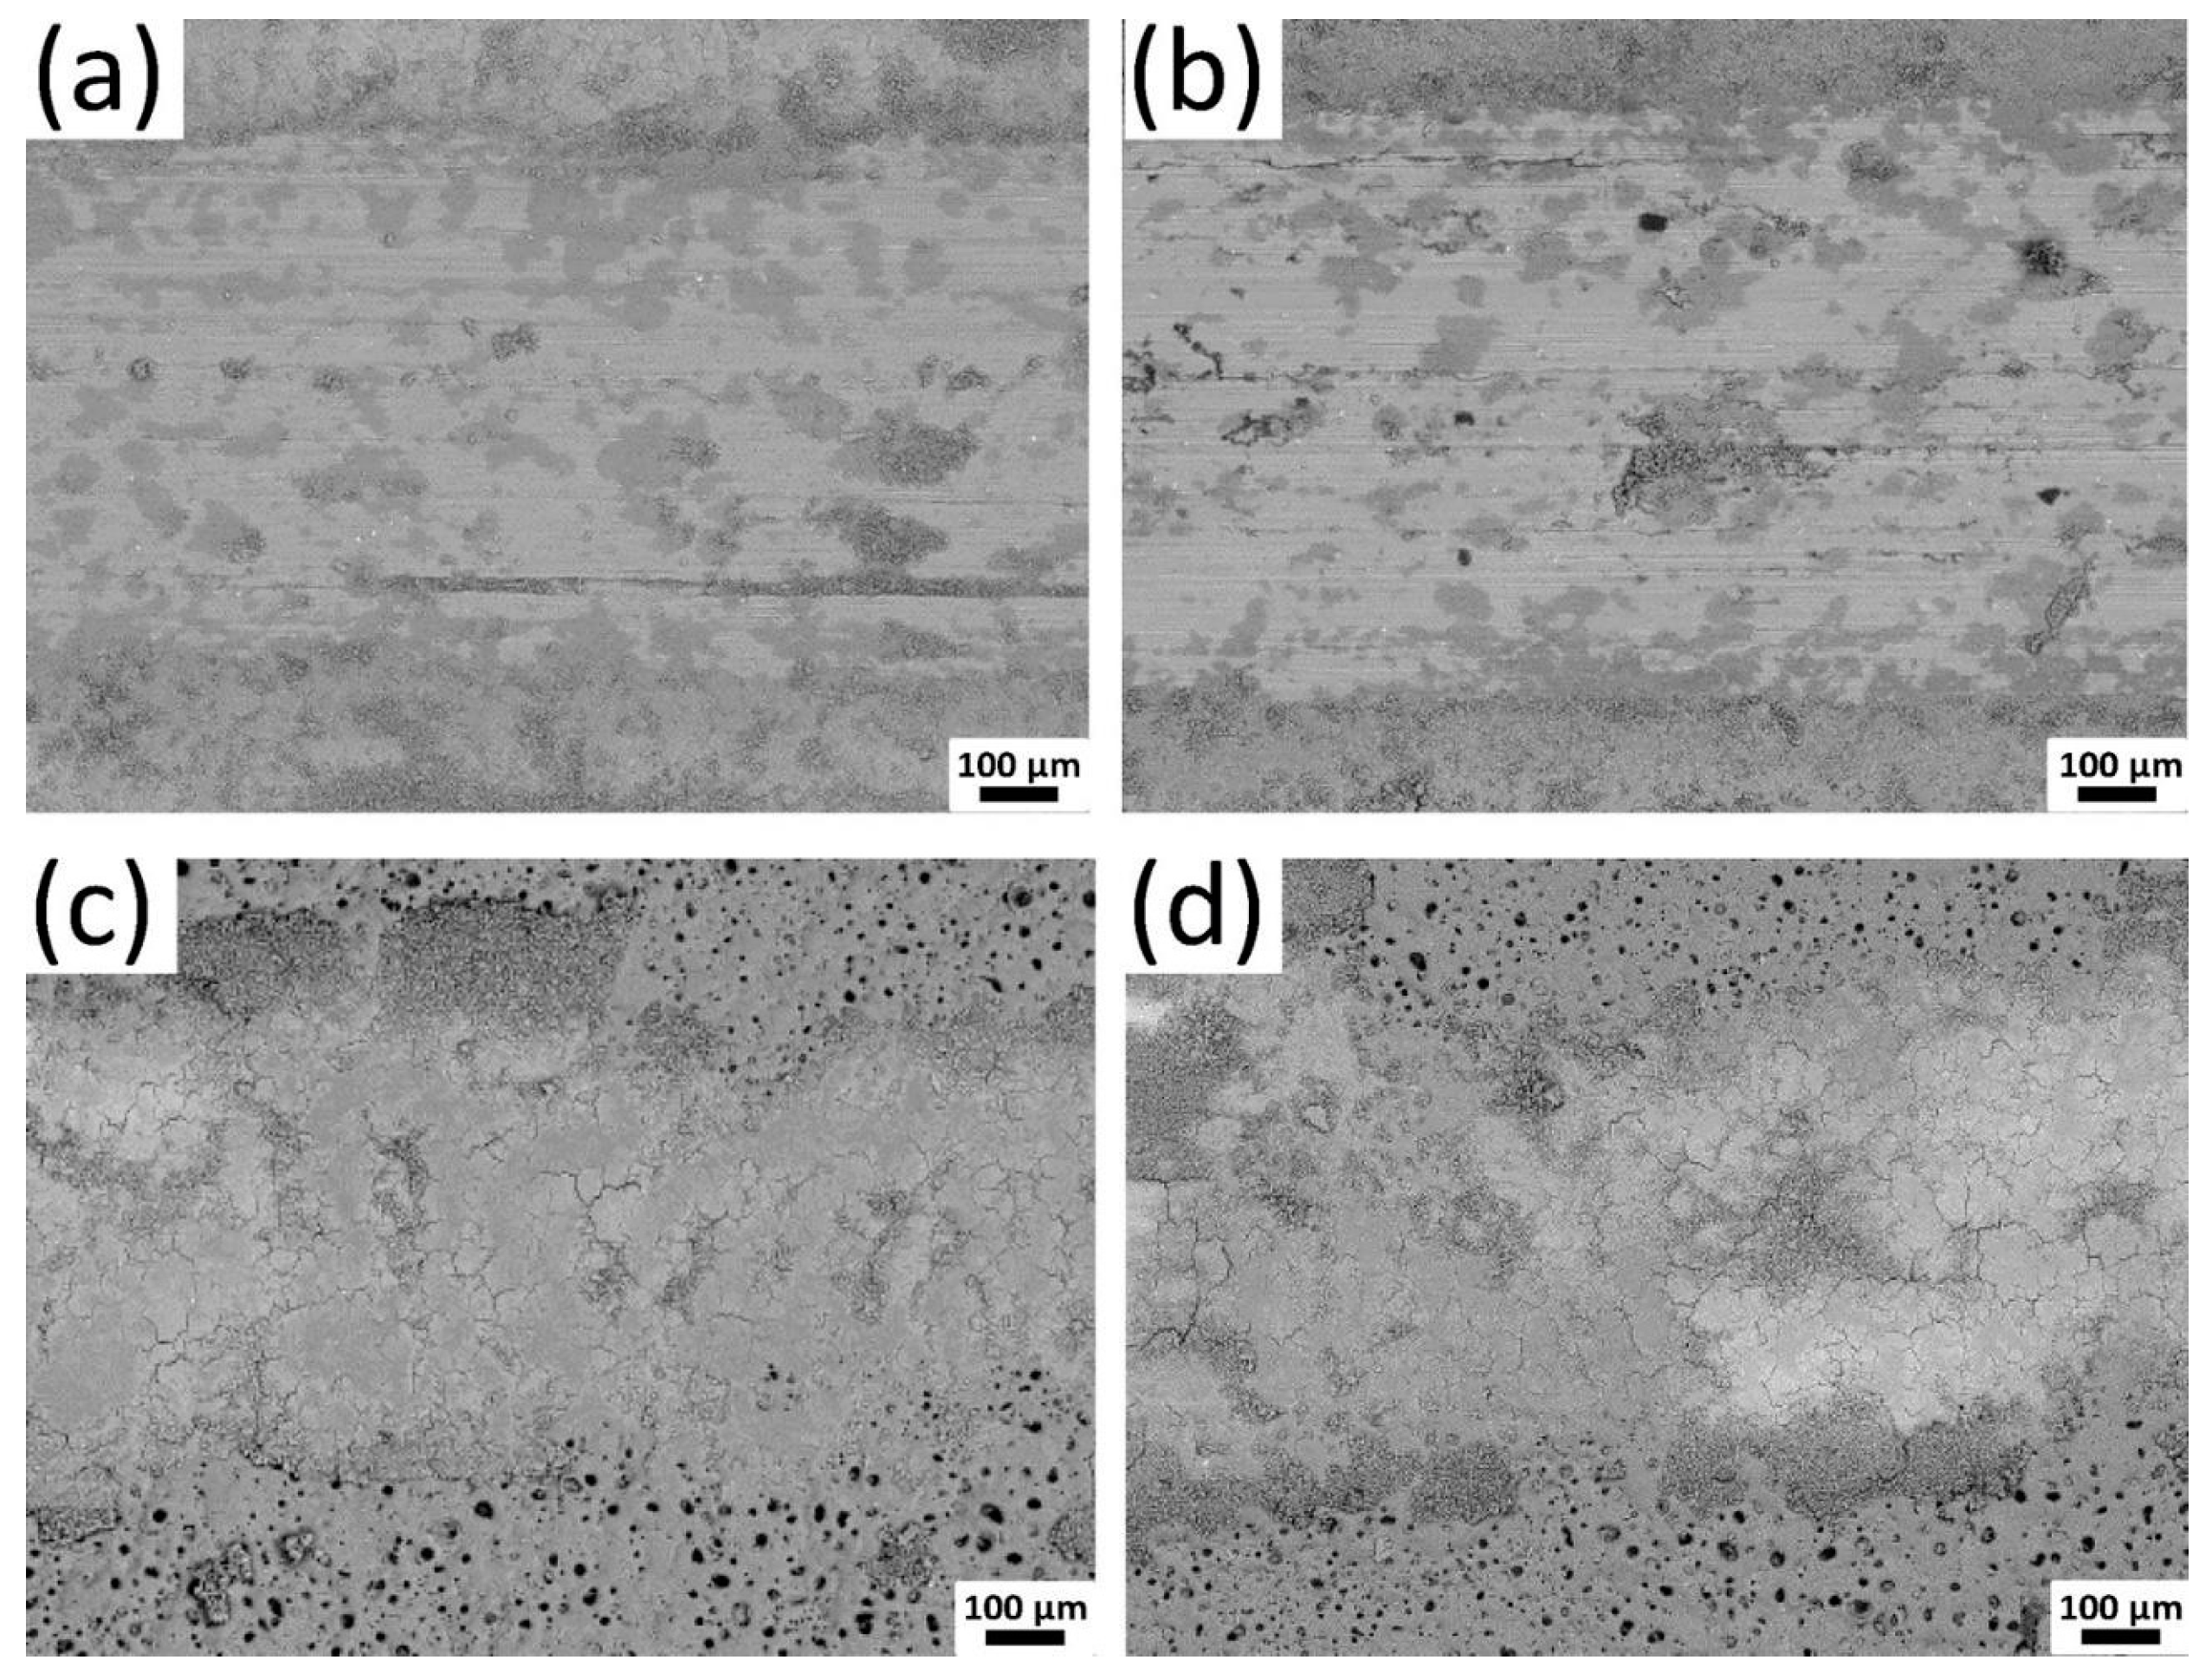
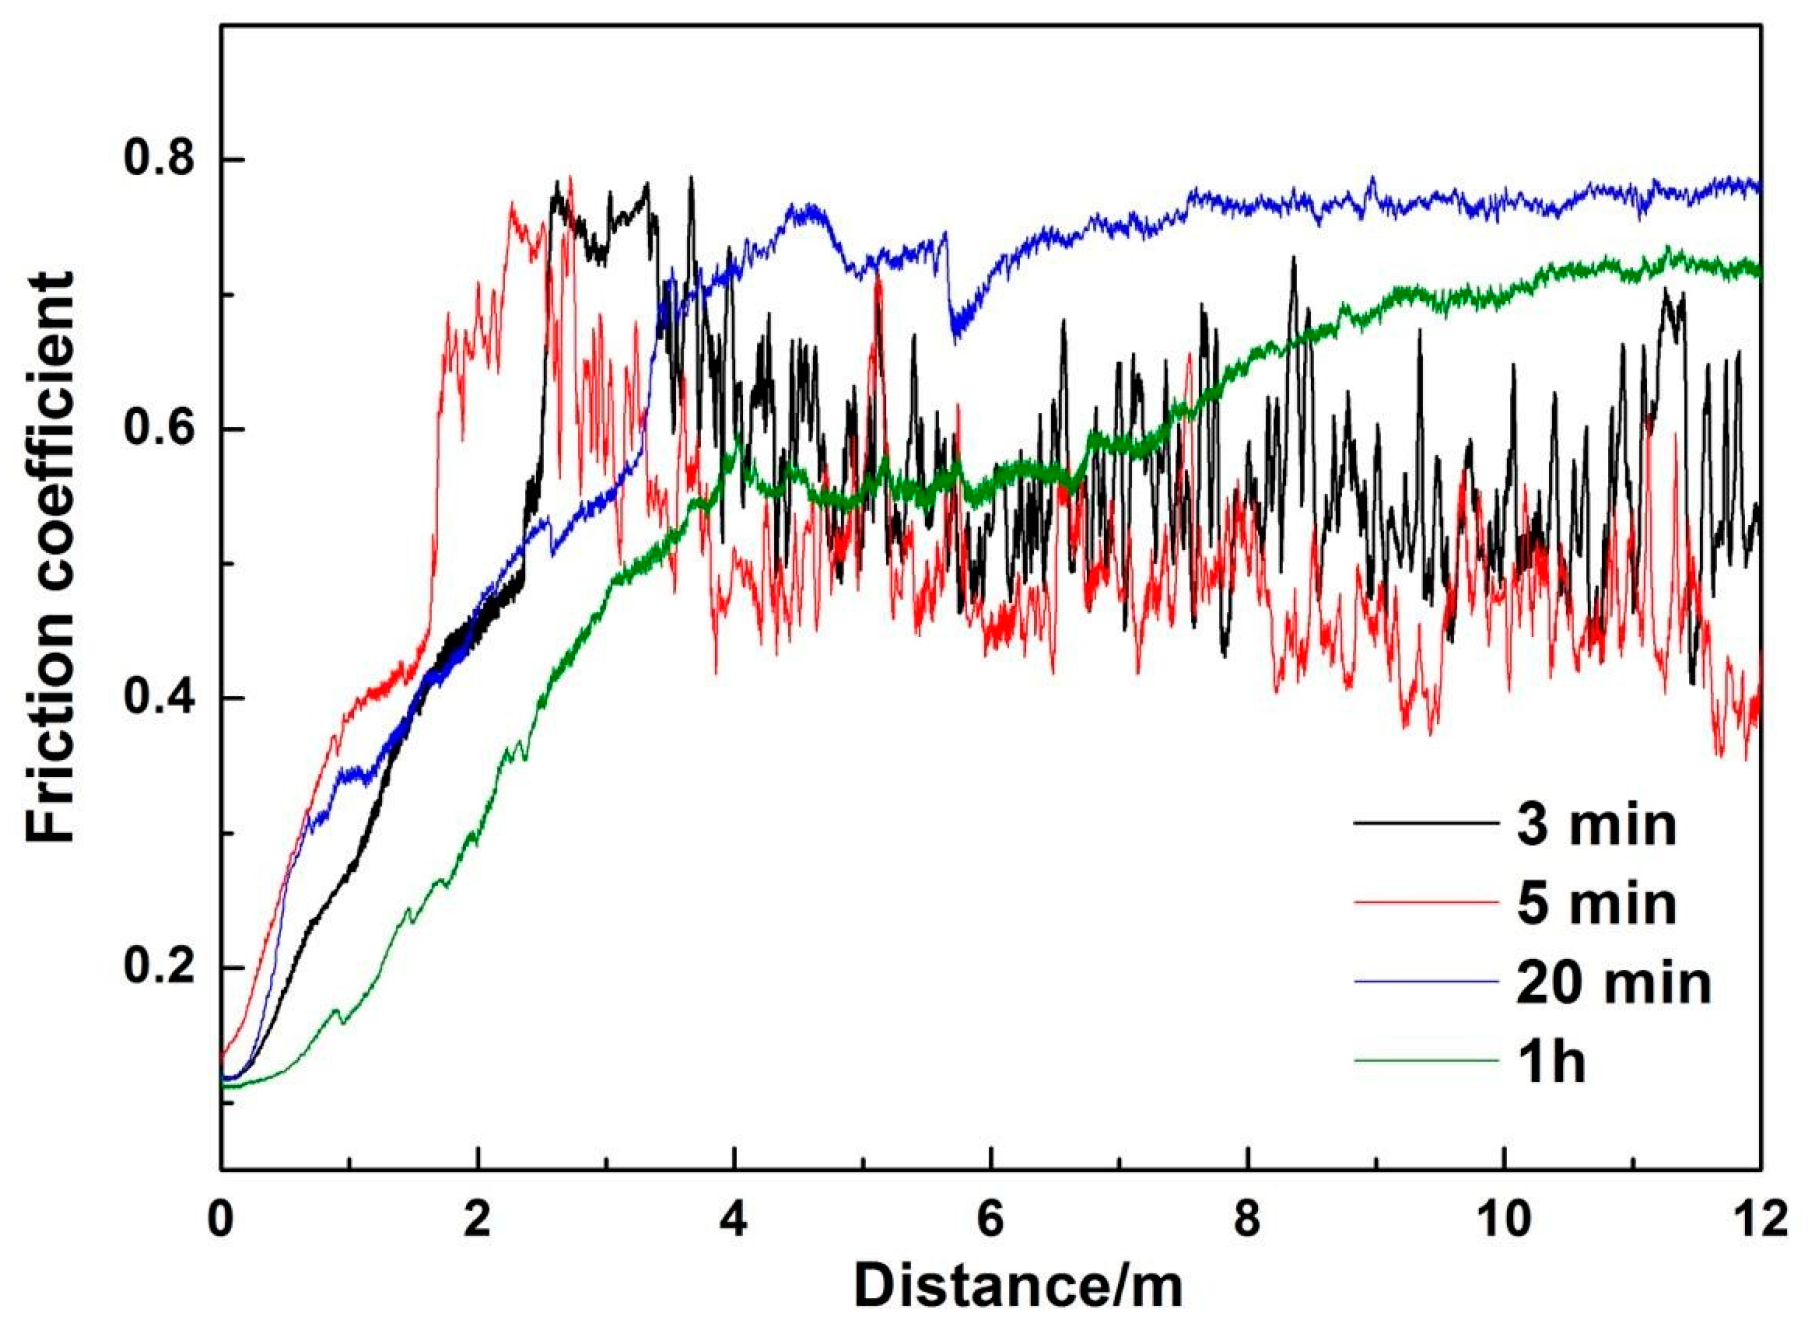
3.4. Tribological Performance

The evolution of the friction coefficient determined for the respective coatings is shown in Figure 8. In the first 3 m of sliding, the friction coefficient rose rapidly to 0.76 for the coating treated for 3 min, followed by large fluctuations in the range of 0.42–0.75, indicating the failure of the coating and exposure of the Mg substrate. A similar behavior can be observed for the coating treated for 5 min. In the case of the coatings treated for a longer duration, the friction coefficient was relatively low, without severe fluctuation during the entire wear test.
The wear tracks of the coatings after the dry sliding wear test are shown in Figure 9. The wear tracks of the coating treated for 3 and 5 min (Figure 9a,b) are broad and deep, where many grooves, parallel scratches and oxidized regions are visible. This indicates that the thin coatings are completely removed, corresponding to the recorded friction coefficient profile (Figure 8). On the contrary, the wear track of the coatings treated for a longer treatment duration (20 min and 1 h) are still intact and compact, which is consistent with the EDS analysis of the wear tracks (Table 1). The enhanced tribological performance can be ascribed to the thick layer with inertly incorporated SiO2 particles on the coating surface.

4. Conclusions

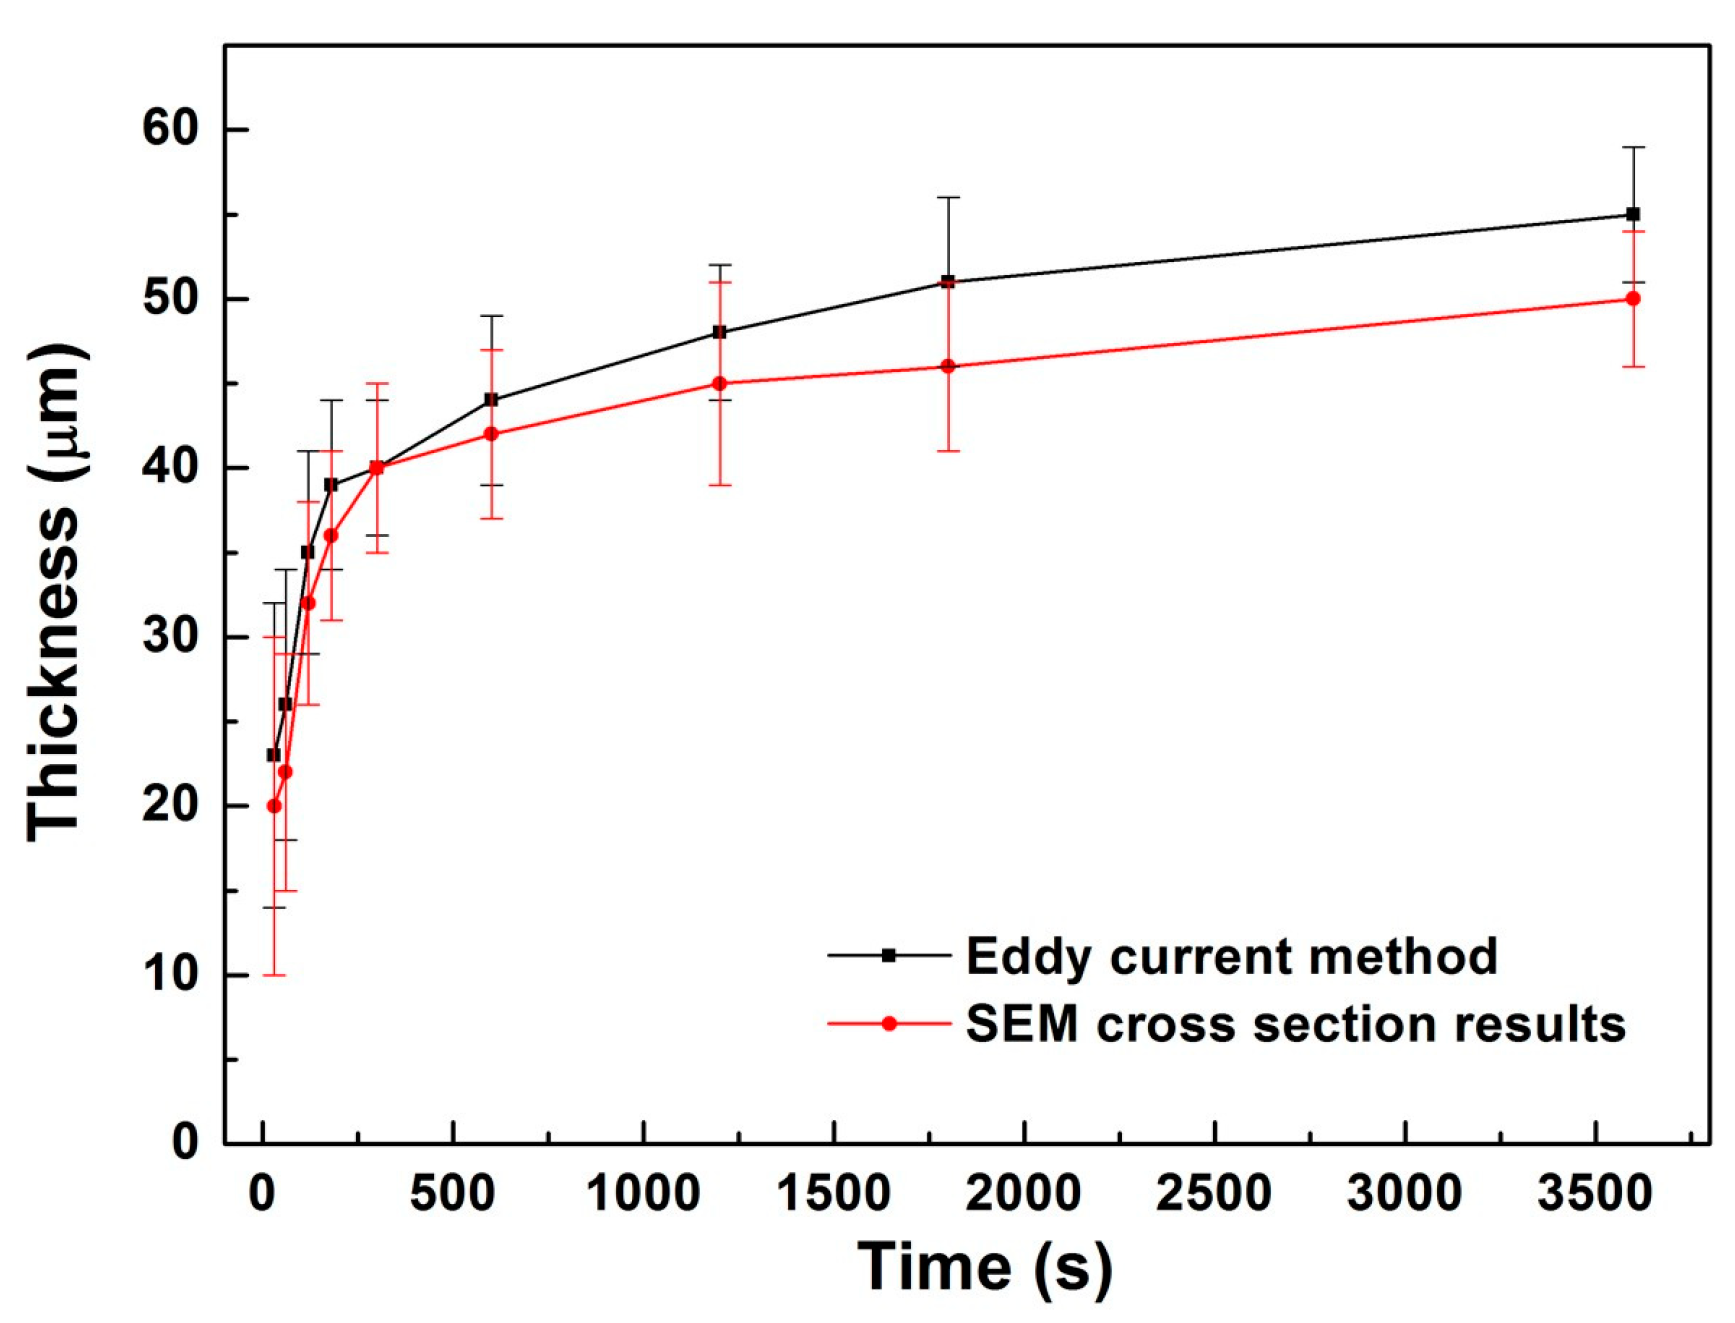
  • The amount of particles increased significantly in the initial stage of coating growth, while it remained unchanged in the final stage under a constant voltage regime, which is dissimilar to the evolution of the coating thickness.
  • The corrosion performance and wear performance of the coating is primarily related to the coating thickness and barrier property of the inner layer. Of these, the corrosion resistance of the coating mainly depended on the barrier property of the inner layer, while the wear resistance primarily relied on the coating thickness.
  • The addition of SiO2 particles can greatly enhance the wear resistance of the PEO coating.

Author Contributions

Formal Analysis, X.L., Y.C. and Y.L.; Investigation, X.L.; Methodology, Y.L.; Resources, F.W. and K.U.K.; Supervision, C.B., K.U.K. and M.Z.; Validation, T.Z.; Writing—Original Draft Preparation, X.L. and Y.C.; Writing—Review & Editing, C.B., T.Z., F.W. and M.Z.

Funding

This research was funded by the National Natural Science Foundation of China (U1737102, 51531007 and 51771050), Young Elite Scientists Sponsorship Program by CAST (2017QNRC001), Fundamental Research Funds for the Central Universities (N170203006 and N170205002) and National Program for Young Top-notch Professionals.

Acknowledgments

The technical support of Volker Heitmann and Ulrich Burmester is gratefully acknowledged.

Conflicts of Interest

The authors declare no conflict of interest.

References

  1. Yang, J.; Lu, X.; Blawert, C.; Di, S.; Zheludkevich, M.L. Microstructure and corrosion behavior of Ca/P coatings prepared on magnesium by plasma electrolytic oxidation. Surf. Coat. Technol. 2017, 319, 359–369. [Google Scholar] [CrossRef]
  2. Lu, X.; Chen, Y.; Zhang, C.; Zhang, T.; Yu, B.; Xu, H.; Wang, F. Formation mechanism and corrosion performance of phosphate conversion coatings on AZ91 and Mg–Gd–Y–Zr alloy. J. Electrochem. Soc. 2018, 165, C601–C607. [Google Scholar] [CrossRef]
  3. Wu, L.; Yang, D.; Zhang, G.; Zhang, Z.; Zhang, S.; Tang, A.; Pan, F. Fabrication and characterization of Mg-M layered double hydroxide films on anodized magnesium alloy AZ31. Appl. Surf. Sci. 2018, 431, 177–186. [Google Scholar] [CrossRef]
  4. Yang, L.; Liu, G.; Ma, L.; Zhang, E.; Zhou, X.; Thompson, G. Effect of iron content on the corrosion of pure magnesium: Critical factor for iron tolerance limit. Corros. Sci. 2018, 139, 421–429. [Google Scholar] [CrossRef]
  5. Aliofkhazraei, M.; Gharabagh, R.S.; Teimouri, M.; Ahmadzadeh, M.; Darband, G.B.; Hasannejad, H. Ceria embedded nanocomposite coating fabricated by plasma electrolytic oxidation on titanium. J. Alloys Compd. 2016, 685, 376–383. [Google Scholar] [CrossRef]
  6. Lu, X.; Mohedano, M.; Blawert, C.; Matykina, E.; Arrabal, R.; Kainer, K.U.; Zheludkevich, M.L. Plasma electrolytic oxidation coatings with particle additions—A review. Surf. Coat. Technol. 2016, 307, 1165–1182. [Google Scholar] [CrossRef]
  7. Mohedano, M.; Serdechnova, M.; Starykevich, M.; Karpushenkov, S.; Bouali, A.C.; Ferreira, M.G.S.; Zheludkevich, M.L. Active protective PEO coatings on AA2024: Role of voltage on in-situ LDH growth. Mater. Des. 2017, 120, 36–46. [Google Scholar] [CrossRef]
  8. Matykina, E.; Garcia, I.; Arrabal, R.; Mohedano, M.; Mingo, B.; Sancho, J.; Merino, M.C.; Pardo, A. Role of PEO coatings in long-term biodegradation of a Mg alloy. Appl. Surf. Sci. 2016, 389, 810–823. [Google Scholar] [CrossRef] [Green Version]
  9. Chen, Y.; Lu, X.; Blawert, C.; Zheludkevich, M.L.; Zhang, T.; Wang, F. Formation of self-lubricating PEO coating via in-situ incorporation of PTFE particles. Surf. Coat. Technol. 2018, 337, 379–388. [Google Scholar] [CrossRef]
  10. Lu, X.; Blawert, C.; Tolnai, D.; Subroto, T.; Kainer, K.U.; Zhang, T.; Wang, F.; Zheludkevich, M.L. 3D reconstruction of plasma electrolytic oxidation coatings on Mg alloy via synchrotron radiation tomography. Corros. Sci. 2018, 139, 395–402. [Google Scholar] [CrossRef]
  11. Mohedano, M.; Lu, X.; Matykina, E.; Blawert, C.; Arrabal, R.; Zheludkevich, M.L. Plasma electrolytic oxidation (PEO) of metals and alloys. In Encyclopedia of Interfacial Chemistry, 1st ed.; Wandelt, K., Ed.; Elsevier: Oxford, UK, 2018; pp. 423–438. [Google Scholar]
  12. Song, Y.; Dong, K.; Shan, D.; Han, E.-H. Investigation of a novel self-sealing pore micro-arc oxidation film on AM60 magnesium alloy. J. Magnes. Alloys 2013, 1, 82–87. [Google Scholar] [CrossRef]
  13. Dong, K.; Song, Y.; Shan, D.; Han, E.-H. Corrosion behavior of a self-sealing pore micro-arc oxidation film on AM60 magnesium alloy. Corros. Sci. 2015, 100, 275–283. [Google Scholar] [CrossRef]
  14. Stojadinović, S.; Vasilić, R.; Radić-Perić, J.; Perić, M. Characterization of plasma electrolytic oxidation of magnesium alloy AZ31 in alkaline solution containing fluoride. Surf. Coat. Technol. 2015, 273, 1–11. [Google Scholar] [CrossRef]
  15. Yu, L.; Cao, J.; Cheng, Y. An improvement of the wear and corrosion resistances of AZ31 magnesium alloy by plasma electrolytic oxidation in a silicate–hexametaphosphate electrolyte with the suspension of SiC nanoparticles. Surf. Coat. Technol. 2015, 276, 266–278. [Google Scholar] [CrossRef]
  16. Barati Darband, G.; Aliofkhazraei, M.; Hamghalam, P.; Valizade, N. Plasma electrolytic oxidation of magnesium and its alloys: Mechanism, properties and applications. J. Magnes. Alloys 2017, 5, 74–132. [Google Scholar] [CrossRef]
  17. Cui, L.-Y.; Gao, S.-D.; Li, P.-P.; Zeng, R.-C.; Zhang, F.; Li, S.-Q.; Han, E.-H. Corrosion resistance of a self-healing micro-arc oxidation/polymethyltrimethoxysilane composite coating on magnesium alloy AZ31. Corros. Sci. 2017, 118, 84–95. [Google Scholar] [CrossRef]
  18. Lu, X.; Blawert, C.; Zheludkevich, M.L.; Kainer, K.U. Insights into plasma electrolytic oxidation treatment with particle addition. Corros. Sci. 2015, 101, 201–207. [Google Scholar] [CrossRef]
  19. Lu, X.; Blawert, C.; Huang, Y.; Ovri, H.; Zheludkevich, M.L.; Kainer, K.U. Plasma electrolytic oxidation coatings on Mg alloy with addition of SiO2 particles. Electrochim. Acta 2016, 187, 20–33. [Google Scholar] [CrossRef]
  20. Zoubi, W.A.; Kamil, M.P.; Ko, Y.G. Synergistic influence of inorganic oxides (ZrO2 and SiO2) with N2H4 to protect composite coatings obtained via plasma electrolyte oxidation on Mg alloy. Phys. Chem. Chem. Phys. 2017, 19, 2372–2382. [Google Scholar] [CrossRef] [PubMed]
  21. Stojadinović, S.; Tadić, N.; Radić, N.; Grbić, B.; Vasilić, R. MgO/ZnO coatings formed on magnesium alloy AZ31 by plasma electrolytic oxidation: Structural, photoluminescence and photocatalytic investigation. Surf. Coat. Technol. 2017, 310, 98–105. [Google Scholar] [CrossRef]
  22. Mohedano, M.; Arrabal, R.; Mingo, B.; Pardo, A.; Matykina, E. Role of particle type and concentration on characteristics of PEO coatings on AM50 magnesium alloy. Surf. Coat. Technol. 2018, 334, 328–335. [Google Scholar] [CrossRef]
  23. NasiriVatan, H.; Ebrahimi-Kahrizsangi, R.; Asgarani, M.K. Tribological performance of PEO-WC nanocomposite coating on Mg alloys deposited by plasma electrolytic oxidation. Tribol. Int. 2016, 98, 253–260. [Google Scholar] [CrossRef]
  24. Pezzato, L.; Angelini, V.; Brunelli, K.; Martini, C.; DabalÀ, M. Tribological and corrosion behavior of PEO coatings with graphite nanoparticles on AZ91 and AZ80 magnesium alloys. Trans. Nonferrous Met. Soc. China 2018, 28, 259–272. [Google Scholar] [CrossRef]
  25. Tonelli, L.; Pezzato, L.; Dolcet, P.; Dabalà, M.; Martini, C. Effects of graphite nano-particle additions on dry sliding behaviour of plasma-electrolytic-oxidation-treated EV31A magnesium alloy against steel in air. Wear 2018, 404, 122–132. [Google Scholar] [CrossRef]
  26. Lu, X.; Blawert, C.; Kainer, K.U.; Zheludkevich, M.L. Investigation of the formation mechanisms of plasma electrolytic oxidation coatings on Mg alloy AM50 using particles. Electrochim. Acta 2016, 196, 680–691. [Google Scholar] [CrossRef]
  27. Shokouhfar, M.; Allahkaram, S.R. Formation mechanism and surface characterization of ceramic composite coatings on pure titanium prepared by micro-arc oxidation in electrolytes containing nanoparticles. Surf. Coat. Technol. 2016, 291, 396–405. [Google Scholar] [CrossRef]
  28. Yeung, W.K.; Sukhorukova, I.V.; Shtansky, D.V.; Levashov, E.A.; Zhitnyak, I.Y.; Gloushankova, N.A.; Kiryukhantsev-Korneev, P.V.; Petrzhik, M.I.; Matthews, A.; Yerokhin, A. Characteristics and in vitro response of thin hydroxyapatite-titania films produced by plasma electrolytic oxidation of Ti alloys in electrolytes with particle additions. RSC Adv. 2016, 6, 12688–12698. [Google Scholar] [CrossRef] [PubMed]
  29. Liu, C.-Y.; Tsai, D.-S.; Wang, J.-M.; Tsai, J.T.J.; Chou, C.-C. Particle size influences on the coating microstructure through green chromia inclusion in plasma electrolytic oxidation. ACS Appl. Mater. Interfaces 2017, 9, 21864–21871. [Google Scholar] [CrossRef] [PubMed]
  30. Lou, B.-S.; Lin, Y.-Y.; Tseng, C.-M.; Lu, Y.-C.; Duh, J.-G.; Lee, J.-W. Plasma electrolytic oxidation coatings on AZ31 magnesium alloys with Si3N4 nanoparticle additives. Surf. Coat. Technol. 2017, 332, 358–367. [Google Scholar] [CrossRef]
  31. Lin, X.; Wang, X.; Tan, L.; Wan, P.; Yu, X.; Li, Q.; Yang, K. Effect of preparation parameters on the properties of hydroxyapatite containing micro-arc oxidation coating on biodegradable ZK60 magnesium alloy. Ceram. Int. 2014, 40, 10043–10051. [Google Scholar] [CrossRef]
  32. Lu, X.; Blawert, C.; Mohedano, M.; Scharnagl, N.; Zheludkevich, M.L.; Kainer, K.U. Influence of electrical parameters on particle uptake during plasma electrolytic oxidation processing of AM50 Mg alloy. Surf. Coat. Technol. 2016, 289, 179–185. [Google Scholar] [CrossRef]
  33. Lu, X.; Sah, S.P.; Scharnagl, N.; Störmer, M.; Starykevich, M.; Mohedano, M.; Blawert, C.; Zheludkevich, M.L.; Kainer, K.U. Degradation behavior of PEO coating on AM50 magnesium alloy produced from electrolytes with clay particle addition. Surf. Coat. Technol. 2015, 269, 155–169. [Google Scholar] [CrossRef]
  34. Hussein, R.O.; Nie, X.; Northwood, D.O. An investigation of ceramic coating growth mechanisms in plasma electrolytic oxidation (PEO) processing. Electrochim. Acta 2013, 112, 111–119. [Google Scholar] [CrossRef]
  35. Cheng, Y.-L.; Xue, Z.-G.; Wang, Q.; Wu, X.-Q.; Matykina, E.; Skeldon, P.; Thompson, G.E. New findings on properties of plasma electrolytic oxidation coatings from study of an Al–Cu–Li alloy. Electrochim. Acta 2013, 107, 358–378. [Google Scholar] [CrossRef]
Figure 1. Backscattered electron images of surface morphology of plasma electrolytic oxidation (PEO) coatings produced after different treatment durations: (a) 1 min; (b) 3 min; (c) 5 min; (d) 20 min; (e) 60 min.
Coatings 08 00306 g001
Figure 2. Backscattered electron images with a cross-sectional morphology of the plasma electrolytic oxidation (PEO) coatings produced after different treatment durations: (a) 1 min; (b) 3 min; (c) 5 min; (d) 20 min; (e) 60 min.
Coatings 08 00306 g002
Figure 3. Thickness of the coatings treated for 1, 3, 5, 10, 20, 30 and 60 min.
Coatings 08 00306 g003
Figure 4. XRD patterns of the coatings treated for 1, 3, 5, 20 and 60 min.
Coatings 08 00306 g004
Figure 5. Si content of the coatings treated for 1, 3, 5, 10, 20, 30 and 60 min.
Coatings 08 00306 g005
Figure 6. Electrochemical impedance behavior (bode plots) of the PEO coatings produced after different treatment durations: (a) 1 min; (b) 3 min; (c) 5 min; (d) 20 min; (e) 60 min.
Coatings 08 00306 g006aCoatings 08 00306 g006b
Figure 7. The change of |Z|f = 0.01 Hz of the PEO coatings produced after different treatment durations (1 min, 3 min, 5 min, 20 min, and 60 min) as a function of immersion time.
Coatings 08 00306 g007
Figure 8. The evolution of the friction coefficient of the PEO coatings anodized for different durations in the dry sliding test.
Coatings 08 00306 g008
Figure 9. Surface morphology of the corresponding counterparts (steel ball) after wear test: PEO coatings treated for (a) 3 min, (b) 5 min, (c) 20 min, and (d) 60 min.
Coatings 08 00306 g009
Table 1. Elemental composition (at.%) of the wear tracks in Figure 9.
CoatingONaMgAlPSi
PEO (3 min)890.50.51
PEO (5 min)1088.50.51
PEO (20 min)604.519196.5
PEO (60 min)59520196

