Next Article in Journal
Oxidation Behavior of MoSi2-Coated TZM Alloys during Isothermal Exposure at High Temperatures
Next Article in Special Issue
Chromium Carbide Growth by Direct Liquid Injection Chemical Vapor Deposition in Long and Narrow Tubes, Experiments, Modeling and Simulation
Previous Article in Journal
Improvement of Corrosion Resistance for Gray Cast Iron in Palm Biodiesel Application Using Thermoreactive Diffusion Niobium Carbide (NbC) Coating
Previous Article in Special Issue
Effect of the N/C Ratios of Ammonia Added to Process Gas Mixtures on the Morphology and Structure of MPCVD Diamond Films
 
 
Correction published on 28 March 2019, see Coatings 2019, 9(4), 221.
Article

On the Activity Enhancing Role of Iron Oxide for Noble Metal Oxidation Catalysts: A CVD-Based Study with Differently Structured Combinations of Pt and FeOx Coatings on Al2O3

1
Institute for Mechanical Process Engineering and Mechanics, Karlsruhe Institute of Technology (KIT), Straße am Forum 8, 76131 Karlsruhe, Germany
2
Institute of Applied Geosciences, Karlsruhe Institute of Technology (KIT), Adenauerring 20b, 76131 Karlsruhe, Germany
*
Author to whom correspondence should be addressed.
Coatings 2018, 8(6), 217; https://doi.org/10.3390/coatings8060217
Submission received: 8 March 2018 / Revised: 27 May 2018 / Accepted: 1 June 2018 / Published: 11 June 2018
(This article belongs to the Special Issue Chemical Vapor Deposition 2018)

Abstract

:
With regard to the catalysis of oxidation reactions by noble metals, the addition of FeOx to an Al2O3-supported Pt catalyst is known to be energetically more favorable compared to only Pt. In this work, different process routes for the preparation of such Fe-promoted Pt/Al2O3 catalysts via atmospheric chemical vapor deposition (CVD) in a fluidized bed were explored. Specifically, the question of whether it would be advantageous to deposit the Fe before, along with, or after the Pt was addressed, and new information was obtained about the optimum FeOx–Pt interface and mixing ratio. Vapors of Trimethyl(methylcyclopentadienyl)platinum(IV) and/or Ethyl-ferrocene were injected into the bed from the top, permitting a quasi-lossless precursor operation and a very good control of the deposited metal, and hence of the catalyst structure. Samples could be extracted from the top while CVD was ongoing to obtain time-resolved data. The catalytic activity was determined through CO oxidation. The Fe-Pt mixing ratio was then varied for the most active deposition sequence, in order to identify an activity optimum generated by the minimum amount of Pt catalyst. When compared to pure Pt/Al2O3, the optimum catalyst consistently showed superior performance even after thermal stress.

1. Introduction

The activity of supported noble metal catalysts used for oxidation reactions, and notably of Pt on an Al2O3 support, is known to be enhanced significantly by the addition of FeOx to the active phase [1,2,3,4,5,6]. The combined FeOx/Pt surface exposed to the reaction atmosphere offers an energetically more favorable mechanism for such reactions, resulting in increased rates when compared to a reference catalyst of supported Pt without FeOx. Korotkikh et al. [5] present a detailed study of this mechanism, showing that the FeOx phase, when in direct contact with Pt, works simultaneously as buffer and source of dissociated oxygen (from the FeOx lattice phase) for the reaction, thus skipping the “usual” O2 adsorption and dissociation steps on the Pt surface.
The production and characterization of model catalysts combining FeOx and Pt was described by Xu et al. [4] and Lewandowski et al. [2,3]. However, important questions remain with regard to the optimum coverage of the Pt phase by iron oxide. The objectives of the current paper are to study the influence of this arrangement on the catalytic potential of the combined FeOx/Pt system and, more generally, to develop optimized catalyst preparation routes via chemical vapor deposition (CVD). In this regard, CVD offers significant potential, due to its excellent reproducibility and control over the structure of the active phase(s) [7,8,9,10,11].
The study was conducted with Pt and FeOx supported on Al2O3, a widely used and very heat-resistant support material. Pt-based oxidation catalysts are in high demand for various industrial applications, and so is their continued improvement with regard to activity per amount of noble metal. Catalyst samples on the order of 10–20 g each were prepared by depositing the nanoscale noble metal and the iron oxide in different sequences by chemical vapor deposition (CVD) in a lab-scale fluidized bed (FB) with a reaction bed volume of about 100 cm3. The study relies primarily on changing the order of deposition of Pt and Fe, and on varying the amount of deposited Fe while leaving the Pt content unchanged. The required degree of control over the structure of the active phase(s) was achieved by an atmospheric pressure FB-CVD process shown recently to provide very reproducible results [7]. There are no reports in the literature of using atmospheric FB-CVD for the production of combined FeOx/Pt systems. The content by mass of Pt and Fe was characterized by XRF; the resulting exposed Pt surface was measured by CO chemisorption; and the catalytic activity occurred via the oxidation reaction of CO to CO2. The Pt/FeOx/Al2O3 catalysts were also exposed to different sintering temperatures up to 800 °C, to determine the thermally induced sintering effect on activity and effective exposed Pt surface compared to a Pt/Al2O3 reference catalyst.

2. Materials and Methods

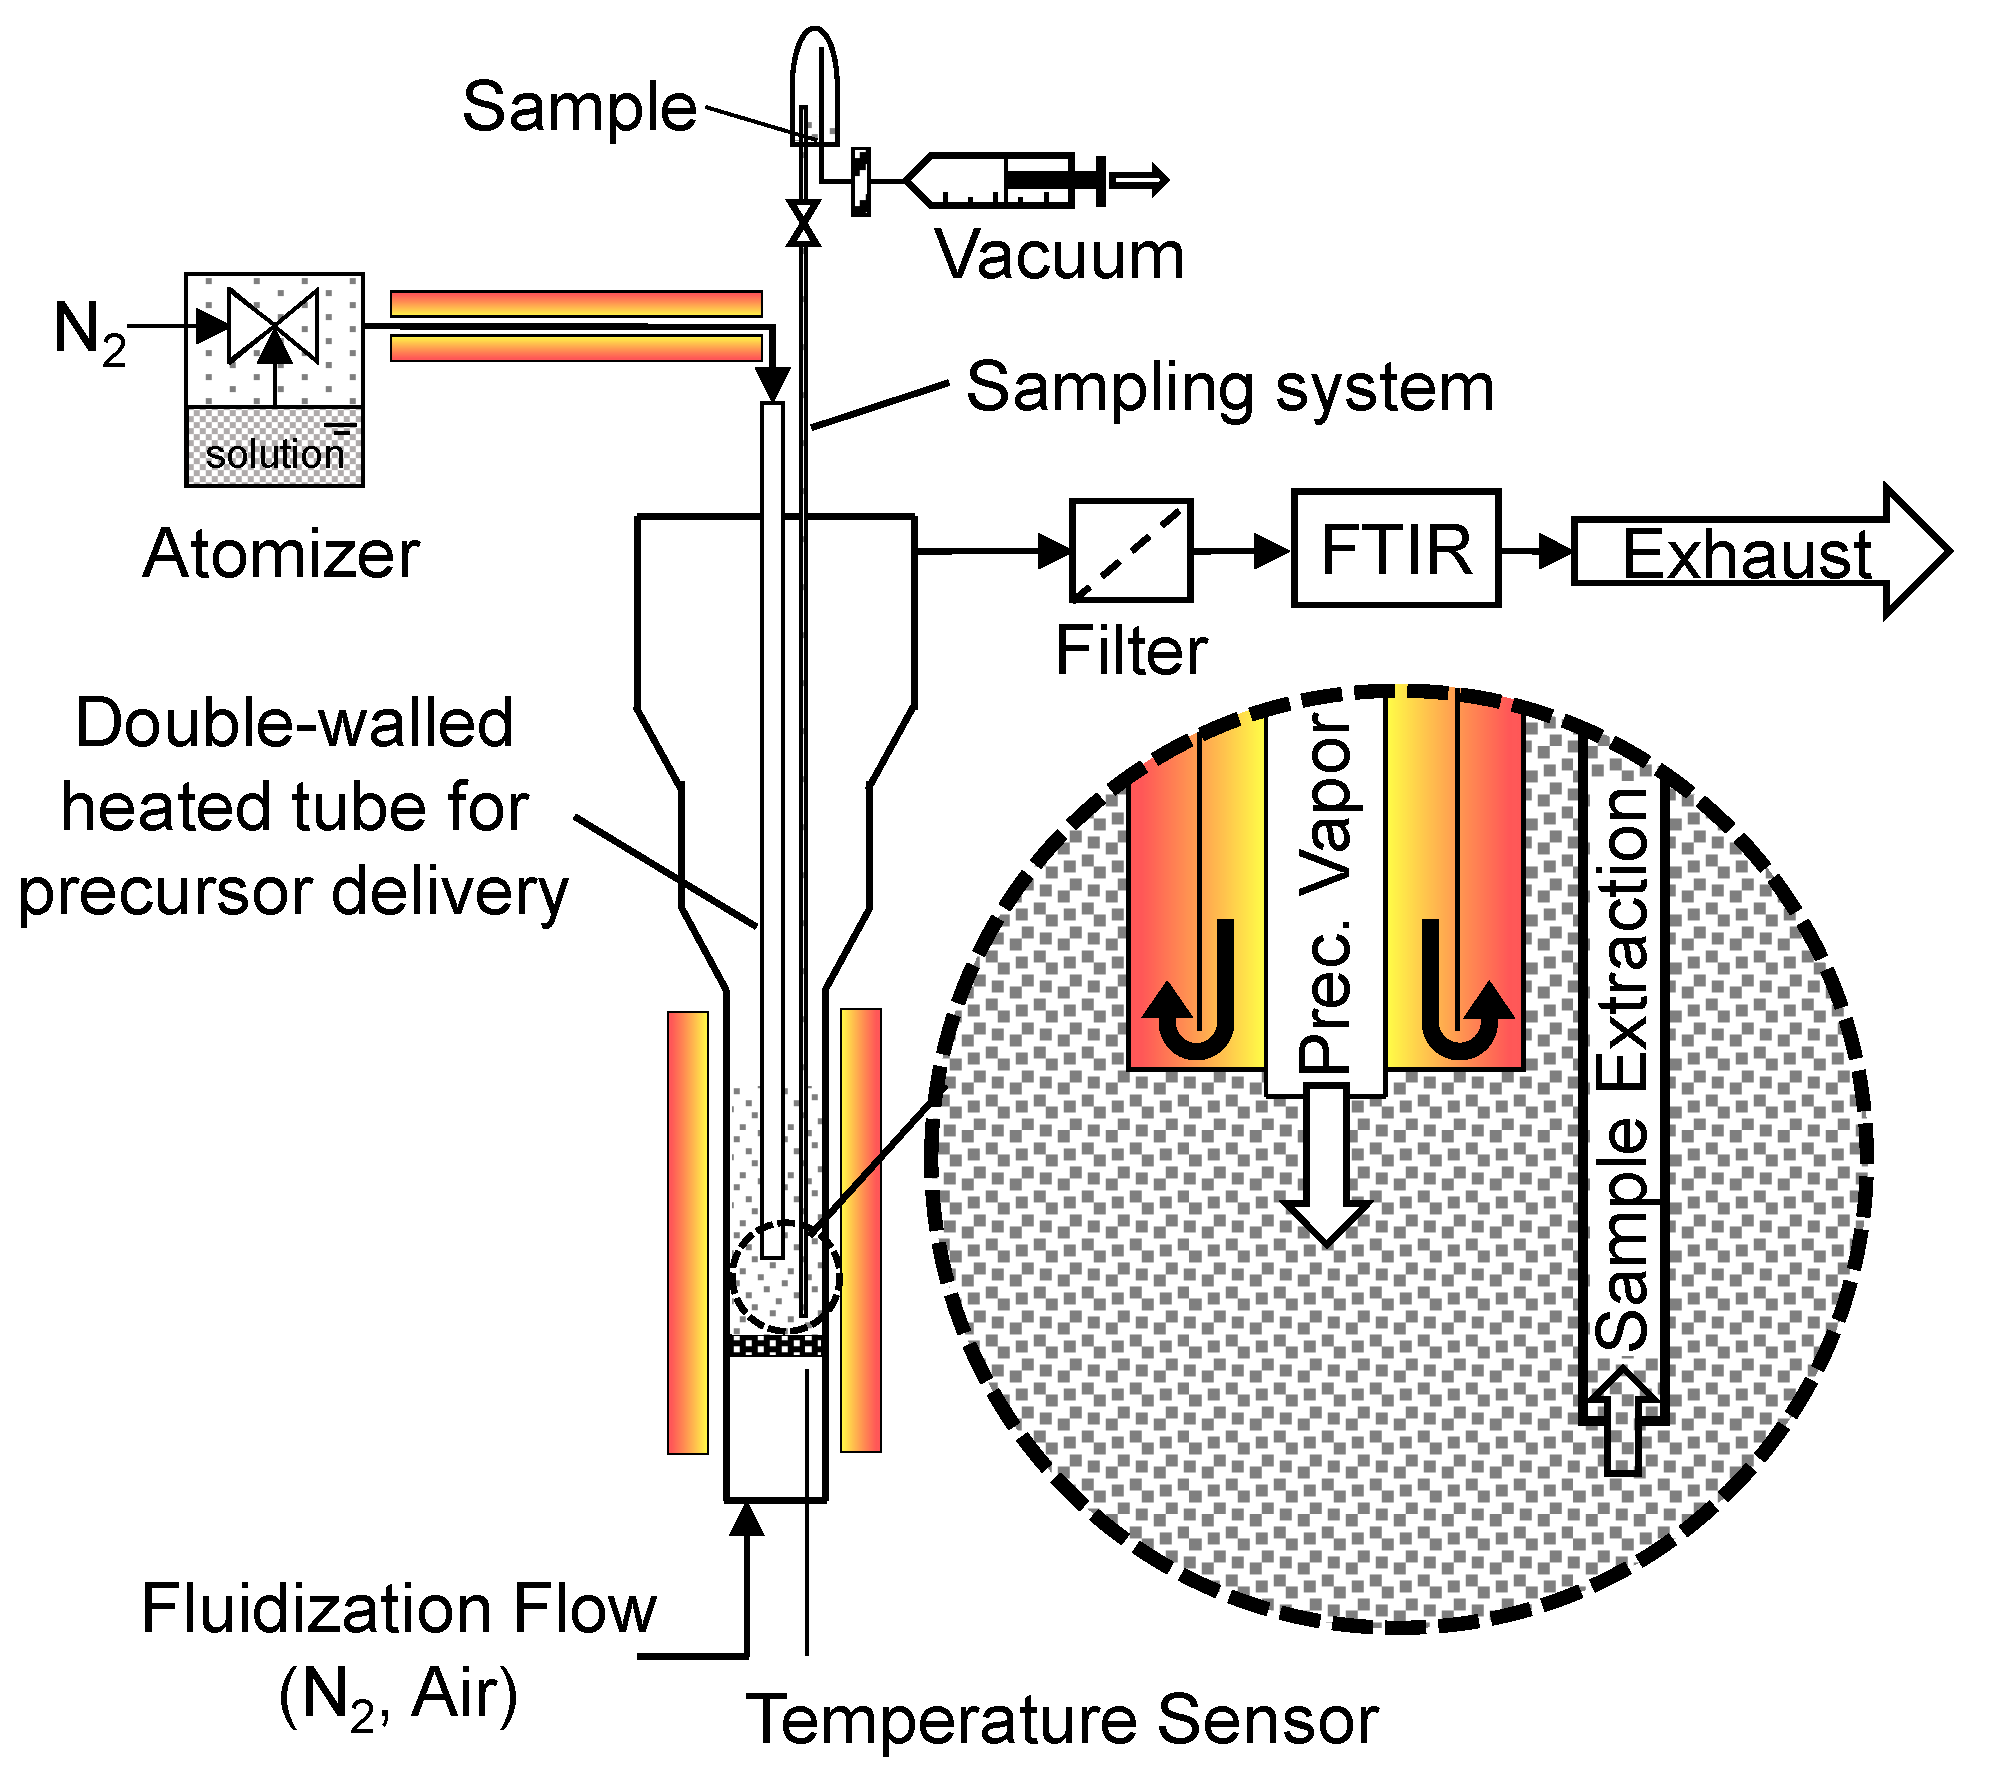
2.1. Apparatus for Production of Catalysts by Fluidized Bed Chemical Vapor Deposition (CVD)

A schematic of the FB-CVD reactor, described previously in full detail [7], is shown in Figure 1. It consists essentially of a segmented quartz glass tube with a glass frit bottom, mounted inside a vertical furnace. The lowest segment of the reactor tube with an inner diameter of 24 mm and a height of 150 mm is filled with up to 20 g of support material, an amount chosen so that every run yields more than enough material for characterization tests. The upper, wider segments of the glass tube function as particle decelerators to prevent smaller agglomerates from getting blown out of the FB by the fluidization flow of 40 standard L/h.
Precursor vapor is delivered to the bed from above, via a double-wall heated stainless steel tube inserted directly into the bed. The delivery system first aerosolizes the precursor at ambient temperature from a solution, then ensures complete vaporization/sublimation of the submicron aerosol particles in the delivery tube at temperatures up to 150 °C. This delivery technique has the advantage of being quasi-lossless with regard to the precursor, which helps to ensure stable and reproducible deposition rates. Details of the deposition process and in particular, the order in which Fe and Pt precursors are injected and decomposed are key parts of the investigation and will be given in the results section of the paper.
The reactor exhaust is connected also to a FTIR (Model Dx 2000, Ansyco Gasmet, Karlsruhe, Germany) to monitor the exhaust gas composition for complete thermal decomposition of the precursor. In addition, time-resolved data were collected without having to stop the deposition process or open the reactor, by extracting small amounts of bed material in the range of 0.2 g with a second stainless-steel tube attached to the reactor lid (see insert in Figure 1).

2.2. CVD Precursors

Two precursors were selected for chemical stability and low toxicity [12]. Trimethyl(methylcyclopentadienyl)platinum(IV), commonly referred to as MeCpPtMe3 (Abcr) is widely used ([8,9,13,14,15]), relatively volatile ([16]), and rather expensive. The iron precursor Ethylferrocene (EF) (Abcr) is relatively affordable and volatile [17]. Both precursors decompose in the range of 300 °C, a common decomposition temperature for metal organic compounds.

2.3. Catalyst Characterization Methods

The noble metal content of the catalysts was measured by X-ray fluorescence spectroscopy (Pan-Analytical Model 5, Malvern, Kassel, Germany). For XRF, the spectrum and intensity of fluorescent energy returned by a sample are intrinsic to the noble metal material and concentration in the sample [18]. The concentration was calculated through calibration experiments conducted with several samples in the Pt concentration range of 0–5%, with 0.1% steps between 0% and 2%, and 0.5% steps between 2% and 5% Pt.
The specific surface area of the Pt phase was measured by titration with CO pulses of defined volume at room temperature after reduction in a device of our own design according to the norm DIN 66136-1 [19,20]. CO chemisorbs selectively on metallic noble metal surfaces such as Pt, enabling the specific measurement of the exposed Pt area without measuring the Al2O3 support or FeOx phase.
For these measurements, the catalyst sample was mixed with 1 g of previously sieved quartz sand and sandwiched between quartz wool stoppers in a 10 mm ID quartz glass tube. The output CO and CO2 signals were measured using NDIR sensors (SmartGAS, Heilbronn, Germany) calibrated periodically and compared to measurements using a FTIR.
Noble-metal-specific surface area measurements for several commercial catalysts obtained with this equipment showed an average variation of 11% and a maximum variation for one sample of 20%, when compared with data measured with a commercial equipment (ASAP 2020 from Micromeritics, Aachen, Germany). CO chemisorption experiments conducted with FeOx/Al2O3 samples confirmed furthermore that CO does not chemisorb to these surfaces (Table 1), meaning the Al2O3 and FeOx surfaces are inert to CO chemisorption under the applied measurement conditions.
Furthermore, some samples were analyzed in a transmission electron microscope (TEM, Phillips CM 12, Frankfurt am Main, Germany), in particular to the particle size of the deposited Pt phase.
To compare different catalysts according to their catalytic activity, the oxidation of CO was used as a model reaction. These experiments were conducted with samples containing 1 mg of Pt each, unless stated otherwise. The catalyst samples were mixed with 4 g of previously sieved quartz sand and sandwiched between quartz wool stoppers in an ID 18 mm quartz glass tube (reactor). Tests were conducted with a mixture of CO, O2, and N2 (1000 ppm CO, 10% O2, 89.9% N2) in temperature ramps of 3 °C/min from 40 °C to 200 °C at 300 cm³/min of reagent input. The CO and CO2 output signals were also measured using NDIR sensors (SmartGAS) calibrated periodically and compared to measurements using a FTIR. The CO and CO2 signals consistently complemented each other, guaranteeing that the produced CO2 originated from the oxidation of the input CO. The activity data are expressed as T100 temperature, i.e., the energy input required to achieve 100% reaction conversion.
The samples were also exposed to a sintering sequence in air, during which the temperature was raised from 150 °C to 800 °C in 7 steps; the set temperature was held for 30 min for each temperature step. The catalytic activity and Pt-specific surface area of the sample were measured after every aging step. This measurement routine was conducted so as to test the catalyst samples in a broad range of temperatures in a short amount of time. The influence of the holding time of 30 min was found to be insignificant at all temperatures when compared to the effect of a 100 °C increase in temperature (for details, see Section 3.4).

2.4. Al2O3 Substrate Material and its Characterization

The carrier particle material was an agglomerated aluminum oxide (Puralox, TH 100/150 from Sasol, Hamburg, Germany) with a primary particle size between 20 nm and 70 nm. The powder is white and easily fluidizable, belonging to the type A–B in the classification by Valverde et al. [20].
To differentiate thermal aging of the active phase from that of the substrate, the substrate material was sintered under harsher conditions (1000 °C for 48 h in air) prior to conducting the CVD coating steps, thereby decreasing its specific surface area (measured through N2 adsorption in a Quantachrome Autosorb 1, Odelzhausen, Germany) from an initial 143 m2/g to 81 m2/g (±4 m2/g). The cumulative thermal aging of the catalyst (7 × 30 min from 150 °C to 800 °C) is relatively mild compared to the thermal conditions previously applied to the substrate. A test with an Al2O3 sample exposed successively to both sintering sequences yielded a final specific surface area of 78 m2/g (±4 m2/g), which is insignificantly less than the 81 m2/g and within the uncertainty range of the measurement. The alumina substrate also loses its porous morphology during this sintering routine. The achieved material, which is effectively used in this work, is thus non-porous.

3. Results and Discussion

In the following, we compare three different CVD routes to produce the desired FeOx/Pt/Al2O3 catalysts. These routes differ in the order of injection and thermal decomposition of the Pt and Fe precursors. Samples produced by the respective routes are characterized and ranked according to their morphologies and the accessible interface area (SInterface) between Pt and FeOx, and finally also according to their catalytic activities. In addition, samples containing only FeOx on Al2O3 without Pt, and Pt on Al2O3 without FeOx were produced as references. For better comparison between routes, samples were matched with regard to their concentrations by weight of Fe and Pt.
Each route will be shown to yield different morphological parameters with regard to the relative arrangement of the Pt and FeOx phases to one another, and thus with different amounts of exposed Pt surface area for equal Fe and Pt concentrations. This also leads to a ranking with regard to catalytic activity and permits some conjecture about the underlying phenomena.

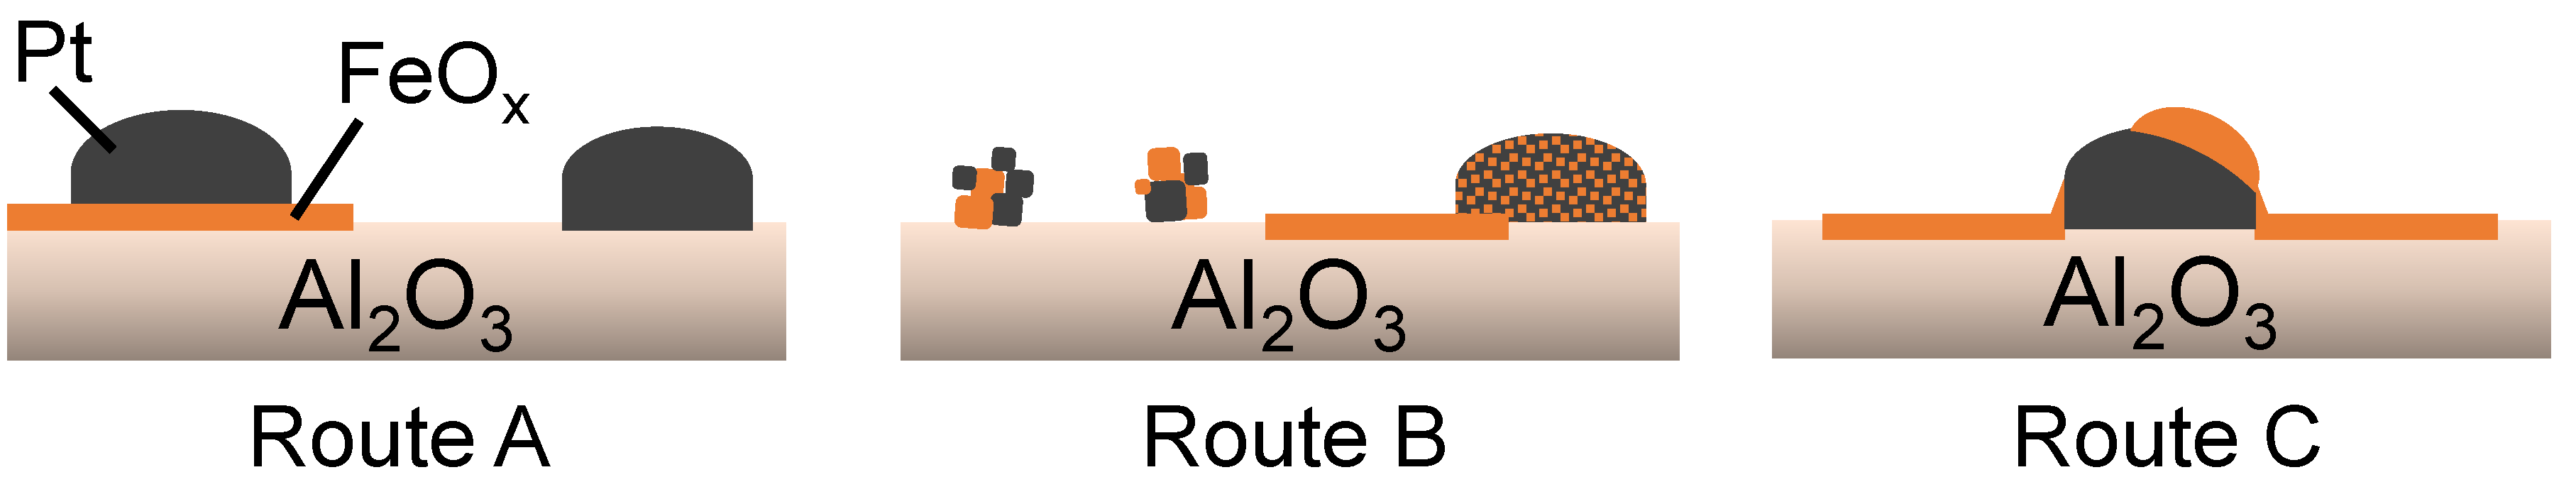
3.1. CVD Coatings Routes

The three routes, denoted in the following as A, B, and C, differ mainly in the order in which the precursors for FeOx and Pt were injected into the reactor. Note that the Pt phase is exposed only once to the decomposition step at 300 °C, regardless of chosen route. In all cases, complete adsorption of the delivered precursor(s) on the target support was verified by FTIR (Figure 1). Indeed, no precursor was detected in the reactor gas exhaust in any of the experiments.
● Route A—Successive Precursor Feed and Decomposition (Fe before Pt)
  • Coating with FeOx by dosing EF at 300 °C in air
  • Dosage of MeCpPtMe3 to the FeOx/Al2O3 particles in N2 at room temperature
  • Decomposition of adsorbed MeCpPtMe3 at 300 °C in N2 for about 30 min, followed by exposure to air to ensure complete decomposition of potentially remaining precursor ligands
● Route B—Simultaneous Precursor Feed and Decomposition
4.
Dosage of MeCpPtMe3 dissolved in EF (no additional solvents) at 300 °C in N2, followed by air for complete decomposition of potentially remaining precursor ligands
● Route C—Successive Feed (Pt before Fe), Simultaneous Decomposition
5.
Dosage of MeCpPtMe3 in N2 at room temperature
6.
Dosage of EF in N2 at 300 °C, leading simultaneously also to decomposition of MeCpPtMe3 in N2, followed by air for complete decomposition of potentially remaining precursor ligands

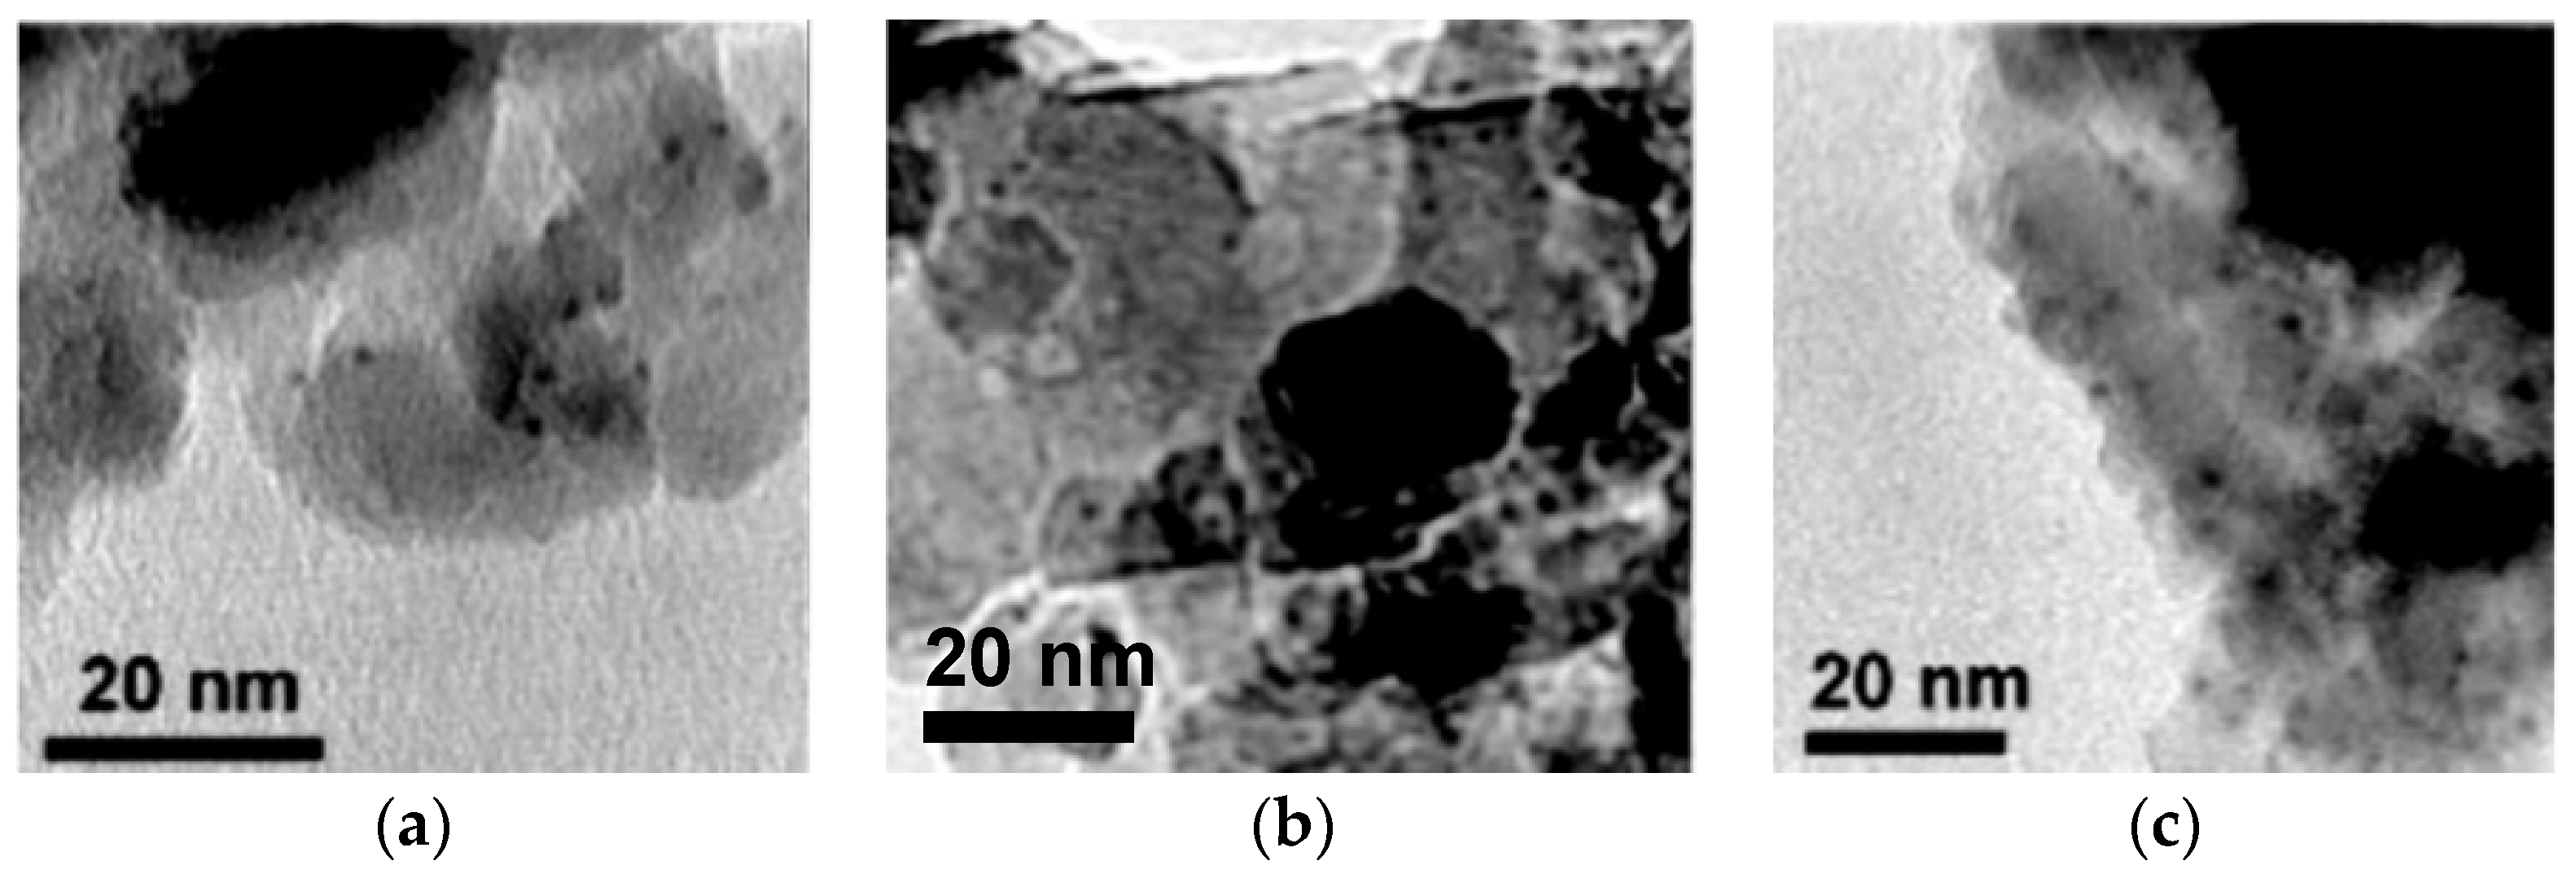
3.2. Comparison of Routes with Regard to Morphology, FeOx/Pt Interfacial Area and Catalytic Activity

Each of the above process routes will probably generate a somewhat different morphology of the deposit and thus a different Pt–FeOx interface. The first indication of the likely deposit morphology can be inferred from considerations of interfacial energy between two phases (either metallic or oxidic), of which one is the substrate, while the other acts liquid-like during CVD deposition [10,11,21,22]: Oxide-oxide interfaces tend to have lower interfacial energies and are therefore associated with lower contact angles (i.e., “wetable” surfaces) than metal-oxide interfaces. One may thus be relatively certain that Pt deposited on Al2O3 or FeOx will form nanodots (i.e., discrete, droplet-like islands on the nanoscale) that remain intact, even in the presence of some surface oxidation of the noble metal or subsequent thermal sintering [23]. On the other hand, Al2O3 is “wetable” for FeOx and will probably cause it to spread into a thin layer [1,2].
Route A should thus lead to Pt dots, regardless of whether the Pt deposits on Al2O3 or previously formed FeOx films, as shown in the left-hand diagram of Figure 2. The nanodots will probably have an initial size in the range of a few nanometers, depending somewhat on the amount of deposit, and may grow by subsequent heating and sintering. Route C is basically the reverse of route A: FeOx deposited after Pt should, in principle, form discrete islands on Pt or, given the extremely small dimensions and curvature of the Pt dots, surround and even cover them, as suggested by Lewandowski et al. [2], according to the right-hand schematic in Figure 2. With regard to morphology, route B is the most speculative because Pt and co-deposited FeOx are, in principle, unwilling to mix, which could lead to cluster-like structures. Earlier findings with co-deposited systems [24] also suggest, however, that FeOx and Pt may form a kind of alloy. Both variants are depicted in the center diagram of Figure 2.
The main difference between routes A and C in terms of resulting interfacial structure between Pt and FeOx—which ultimately determines the accessibility by oxygen during the oxidation reaction—may therefore be the thickness of the respective top layer. If route B leads to cluster-like structures, it is likely to produce the largest and most accessible interfacial area of all three process routes, whereas that of an alloy will be much smaller.
In order to study these morphological variations experimentally, samples with the same (or nearly same) Fe and Pt contents were produced by each of the above process routes. The targeted concentrations by weight were 3% for Fe and 0.8% or 0.3% for Pt. As a first step, the exposed Pt surface area was determined by CO chemisorption for each process route. This measure is selective for Pt, because CO does not chemisorb on FeOx under the applied conditions, as we determined by a separate set of measurements. By measuring the specific Pt surface areas of comparable samples (i.e., at equal Fe and Pt concentrations) produced by each route, and comparing it to that of a reference sample without any Fe deposit (SPt reference), one can calculate a relative interfacial surface (SInterface), according to Equation (1). It gives the FeOx/Pt area (relative to a reference sample without FeOxSPt reference), for SPt and FeOx denotes the remaining “uncovered” Pt surface of a sample.
S Interface   ( S Pt   reference     S Pt   and   FeO x ) S Pt   reference
SInterface is thus given by the loss of Pt surface area due to FeOx coverage. This calculation is based on the assumption that samples containing equal Pt concentrations have the same specific Pt surface areas.
Beginning the discussion with the column “0.3% Pt”, note that the Pt surface area (per g of sample mass) measured for route A is the same as that for the reference sample without Fe, namely 0.3 m2/g. This agrees, first of all, with the assumption that the samples produced with equal Pt concentration also yield similar Pt-specific surface area areas. Moreover, this indicates that the “underside” of the Pt nanodots is not accessible to CO, regardless of whether they “sit” on Al2O3 or FeOx. We may thus assume that the interfacial Pt/FeOx surface area is not directly exposed to the reaction atmosphere for route A; hence SInterface = 0.
In the column “0.8% Pt”, the Pt-specific surface area for the reference sample without Fe is 1.2 m2/g, indicating that the Pt surface (consisting of discrete nanodots as seen in Figure 3) has not so much grown in size, but increased in number (due to higher concentration). Unfortunately, we do not have a 0.8% Pt sample for route A because it was not possible to obtain more than 0.4% Pt-loading via this route without initiating some sintering of Pt, for MeCpPtMe3 required higher energy inputs (ca. 700 °C) to decompose upon the already partially FeOx-coated substrate. For the sake of this analysis, we may assume, however, that the CO accessible Pt/FeOx interfacial area produced via route A is also zero.
By comparison, routes B and C, as far as data are available, produced increasingly larger interfacial areas, with route C giving the highest. Increasing the Pt concentration from 0.3% to 0.8% produces a disproportionately large increase in interfacial area from A to B to C, although the Fe content (3%) is held constant. This is consistent with an increase in number density of the Pt dots, and also with the schematic of Figure 2, according to which the FeOx on (or around) Pt dots produces an interfacial area that is accessible to CO, whereas Pt on FeOx is not. From the perspective of catalysis, route C should therefore be the most interesting.
Figure 3 shows three samples with same Pt content, all produced via route C. The Pt loading of 2% was chosen high, to make the Pt nanodots stand out against the light gray background of aluminum oxide for the TEM analysis. The Fe content increases from left to right, from 0 to 9% by mass. Within the accuracy of measurement, the Pt dots do not change in size with increasing Fe concentrations. This indicates that the decrease in Pt surface area due to the FeOx coating is indeed a coverage effect, and not due to a significant increase in Pt dot diameter.
Since route C produced the relatively highest exposed surface area, according to the mechanism proposed by Korotkikh et al. [5], it should also present the highest catalytic activities per Pt amount. The samples previously ranked in Table 1 by accessible surface area were therefore tested for their catalytic activity using CO oxidation as a reaction test. The 100% conversion temperatures shown in Table 2 show that route C consistently produces the lowest conversion temperatures, an indication that this route also produces the most active of the three tested morphologies.

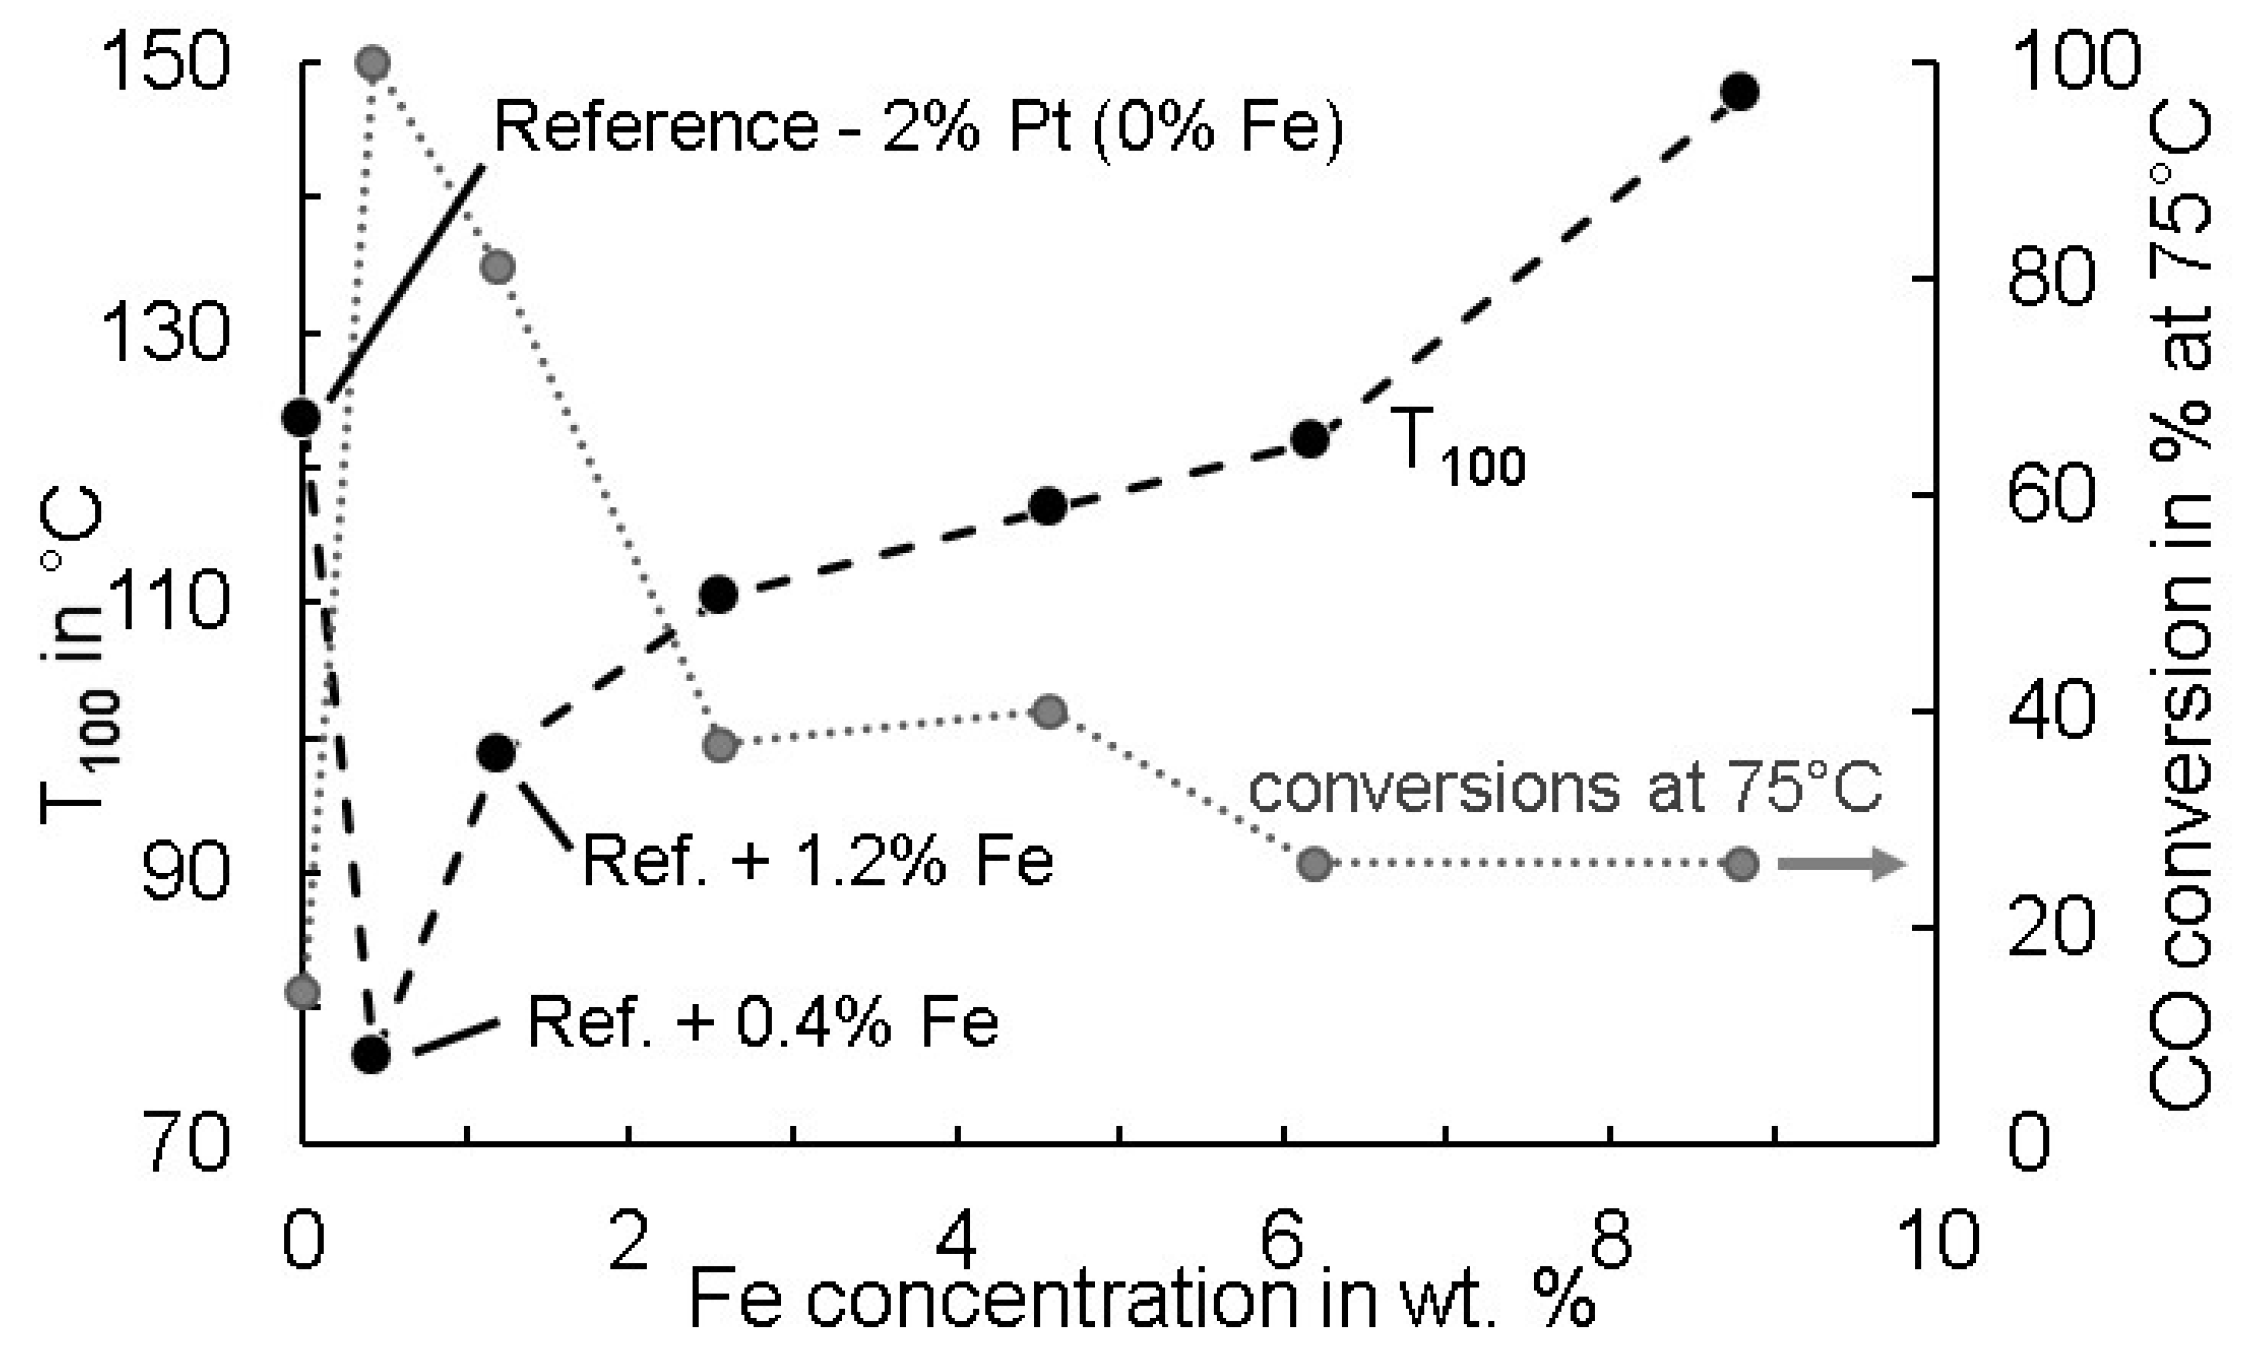
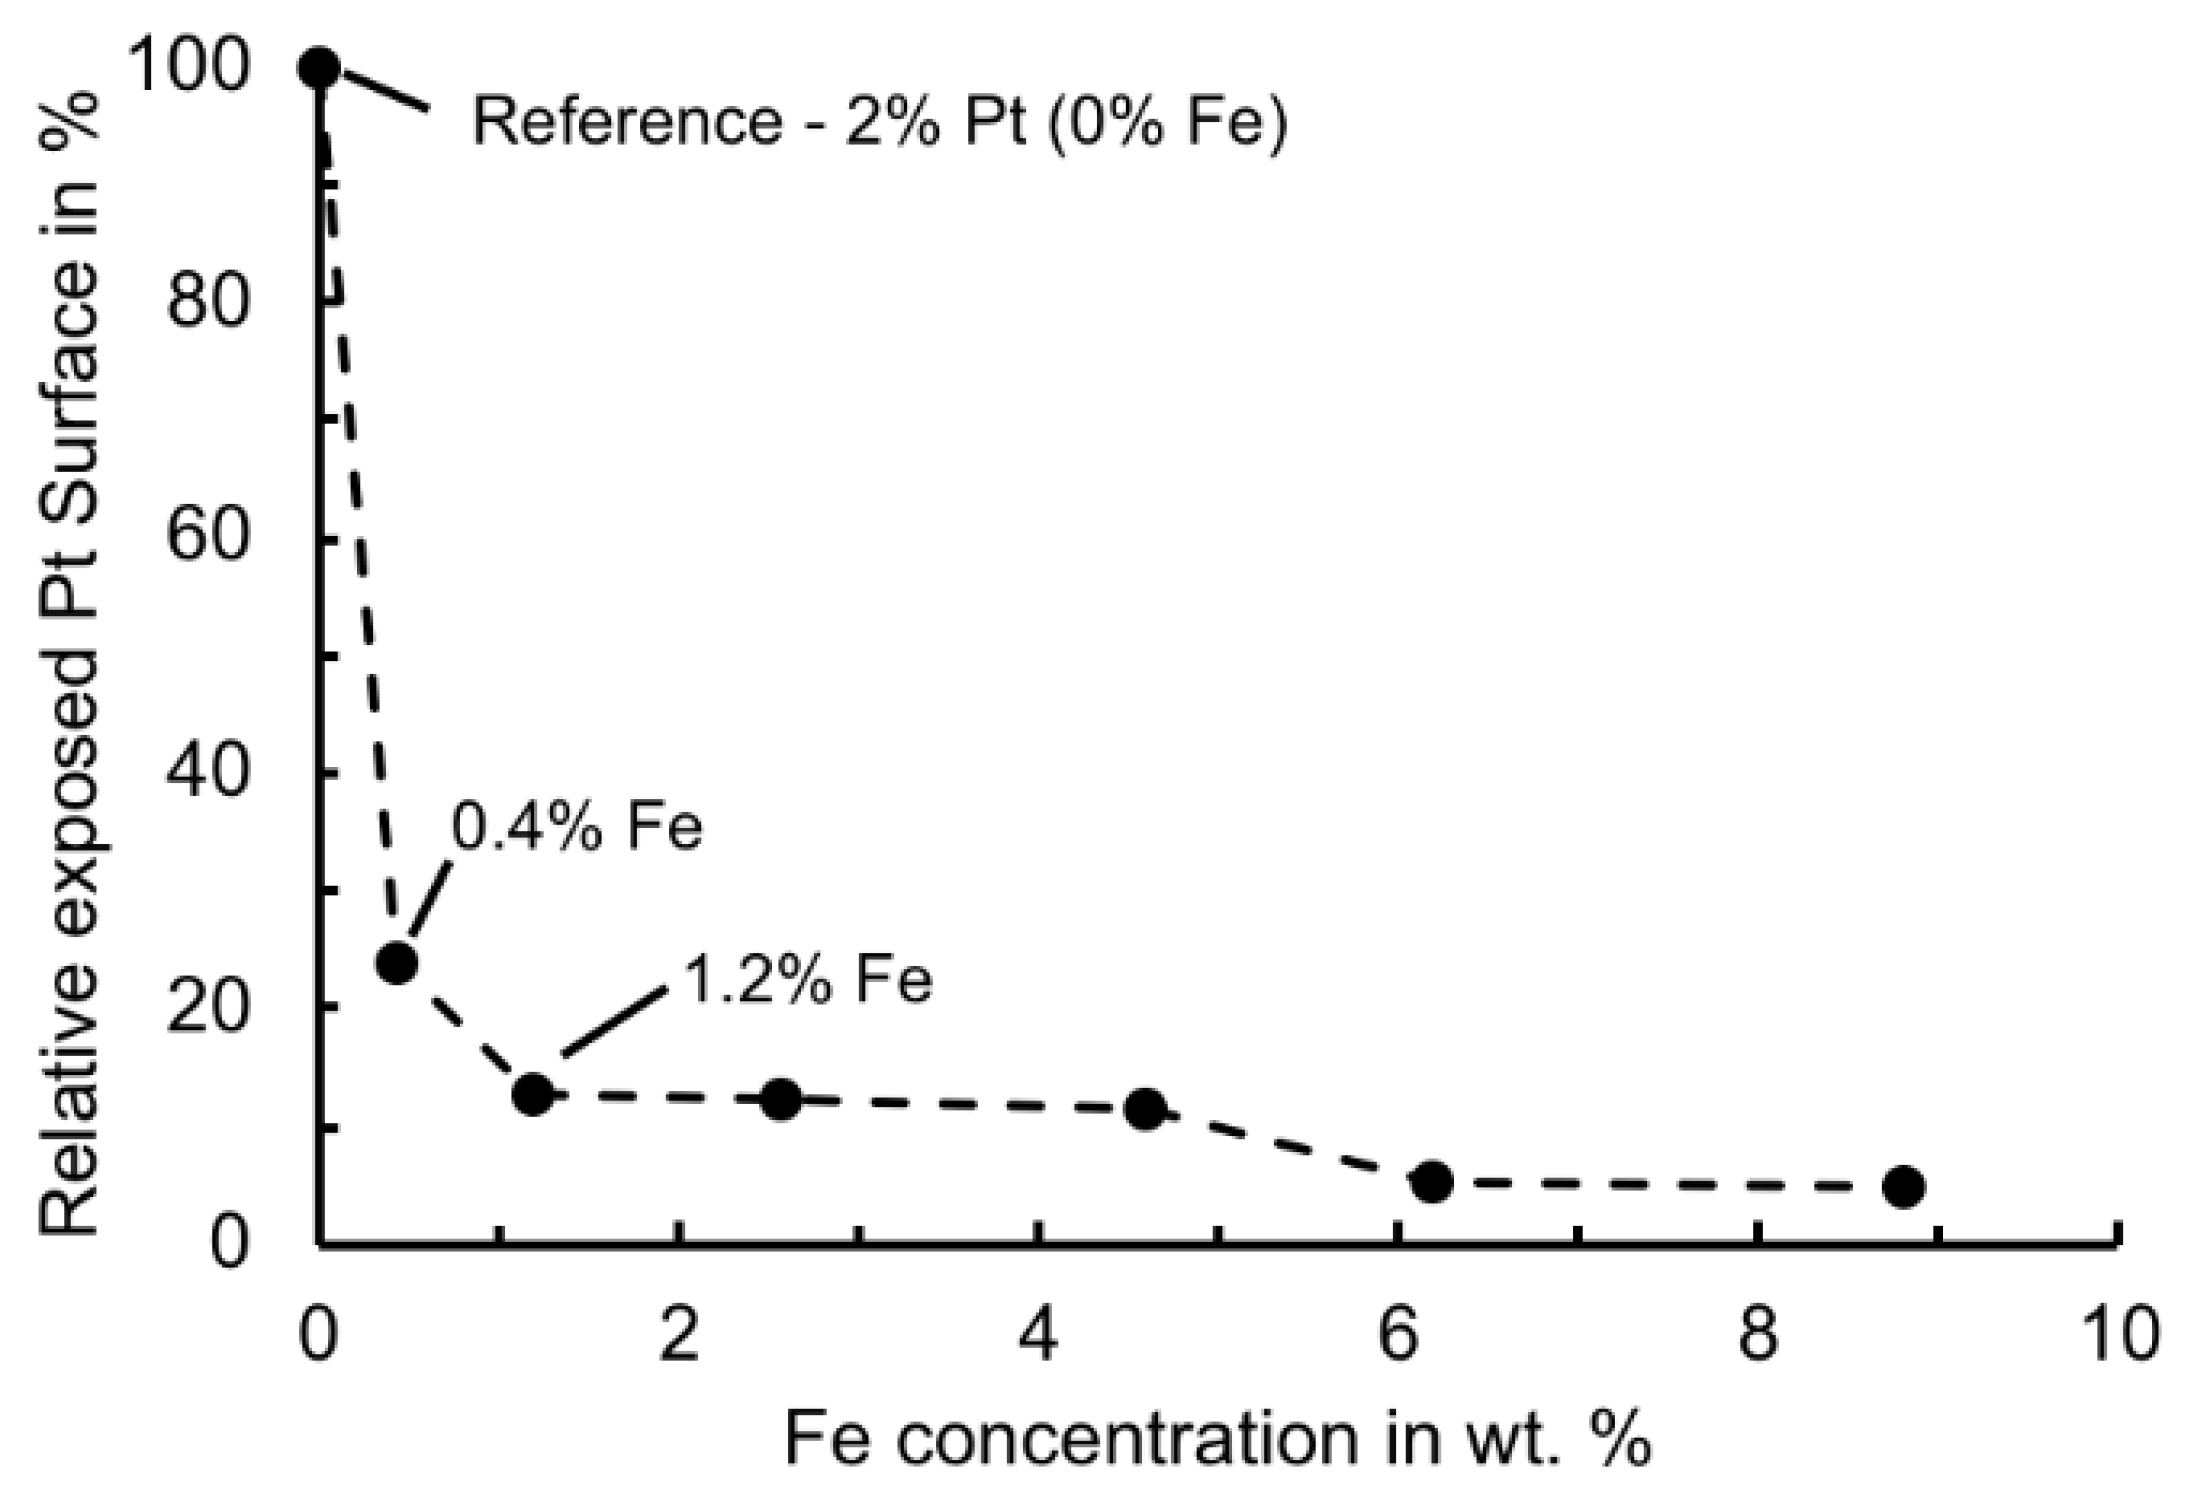
3.3. Identification of an Optimun FeOx–Pt Ratio with Regard to Catalyst Activity

We now proceed to vary the Fe concentration at constant Pt content in order to determine the FeOx–Pt ratio giving the highest catalyst activity. In light of the findings from the previous section, this catalyst optimization will be pursued on the basis of samples produced via process route C, which gave the relatively highest activity. In order to make samples as comparable as possible with regard to the Pt morphology, the amount of Fe was varied in a single CVD run with continuous Fe precursor delivery, during which samples (with increasingly higher FeOx content) were extracted periodically from the fluidized bed. This was done through a sampling device depicted schematically in Figure 1.
The experimental sequence was as follows: Prior to Fe precursor delivery (and thus also prior to the decomposition of any precursor), a first sample was drawn to establish the “Pt only” reference. The bed material of Al2O3 with adsorbed MeCpPtMe3 was drawn after the complete MeCpPtMe3 amount was delivered. The decomposition of the precursor was performed in a second furnace under N2 atmosphere followed by air at 300 °C. After the reference sample had been extracted, process route C was pursued, i.e., the FB was heated up and delivery of the Fe precursor feed under N2 atmosphere began when the bed temperature reached 100 °C. The process atmosphere was switched to air when a CO signal was detected in the exhaust gas, while continuing to deliver Fe precursor. During this time, samples with increasingly higher FeOx concentrations were drawn periodically from the fluidized bed.
The samples were evaluated in terms of catalytic activity and exposed Pt surface area, as shown in Figure 4 and Figure 5 for one representative data set. (A relatively high Pt content of 2% was chosen for these measurements, in order to obtain the best possible reproducibility.) In Figure 4, the catalytic activity is expressed both in terms of T100, the temperature for 100% CO conversion, and in terms of conversion at a fixed temperature of 75 °C (which corresponds to the lowest T100 value for the data set). The addition of a small amount of FeOx has a visibly positive effect on the activity, with a very distinct minimum around 0.5% Fe in the T100 values and a corresponding maximum in the conversion. The conversion at other temperatures exhibits the same trend as the one at 75 °C, but this is not shown here. Figure 5 shows the corresponding variation of exposed Pt surface area with Fe content, relative to the Pt surface area of the reference catalyst drawn from the reactor without FeOx. The sharpest decline occurs in the range of the maximum activity around 0.5% Fe, where 75% of the original Pt surface area are no longer accessible to CO adsorption. Further FeOx coverage decreases the activity; beyond about 90%, the catalyst performs worse than without Fe.
While neither the exact morphology of the resulting Pt–FeOx interface nor the surface sites responsible for the increased catalyst activity can be determined from our experiments, the substantial loss of accessible Pt surface area observed in Figure 5, combined with the sharply increased catalytic activity in a narrow range of Fe concentrations seen from Figure 4, would suggest (a) that there must be a partial coverage (at least) of the Pt by FeOx; and (b) that the resulting interfacial area SInterface is (at least partially) accessible to process gases, with a narrow optimum at a rather small amount of Fe addition. When placing this in perspective with the observations from Section 3.2 about the preferred deposition sequence (process route C vs. process route A, FeOx onto Pt vs. Pt onto FeOx), process route C yields more “reaction accessible” Pt–FeOx interface.
A final point to discuss is the evaluation of our results in terms of turn over frequency (TOF), a parameter commonly used to evaluate and compare catalysts and defined in many textbooks. TOF normalizes the amount of reaction products generated per unit time (a quantity proportional to our conversion from Figure 4) with regard to the active surface area of the catalyst. In our case, one can use either the total Pt surface area for this purpose, or the exposed Pt surface area. For the data of Figure 4 and Figure 5 the total Pt surface area (as given by the reference with 0% FeOx) is the same for all samples, because FeOx coatings do not influence the Pt dispersion, as we argued previously. Hence, such a TOF curve would be proportional to the conversion curve in Figure 4 and lead to the same conclusions. On the other hand, using the exposed Pt surface area from Figure 5, i.e., the remaining Pt surface not covered by FeOx, to calculate the TOF would ignore the FeOx–Pt interfacial area actually considered responsible for the activity enhancement. Moreover, TOFs calculated in this way tend to mislead by suggesting an optimum activity toward extreme Fe coverages, where the exposed Pt surface area decreases to nearly zero (Figure 5).

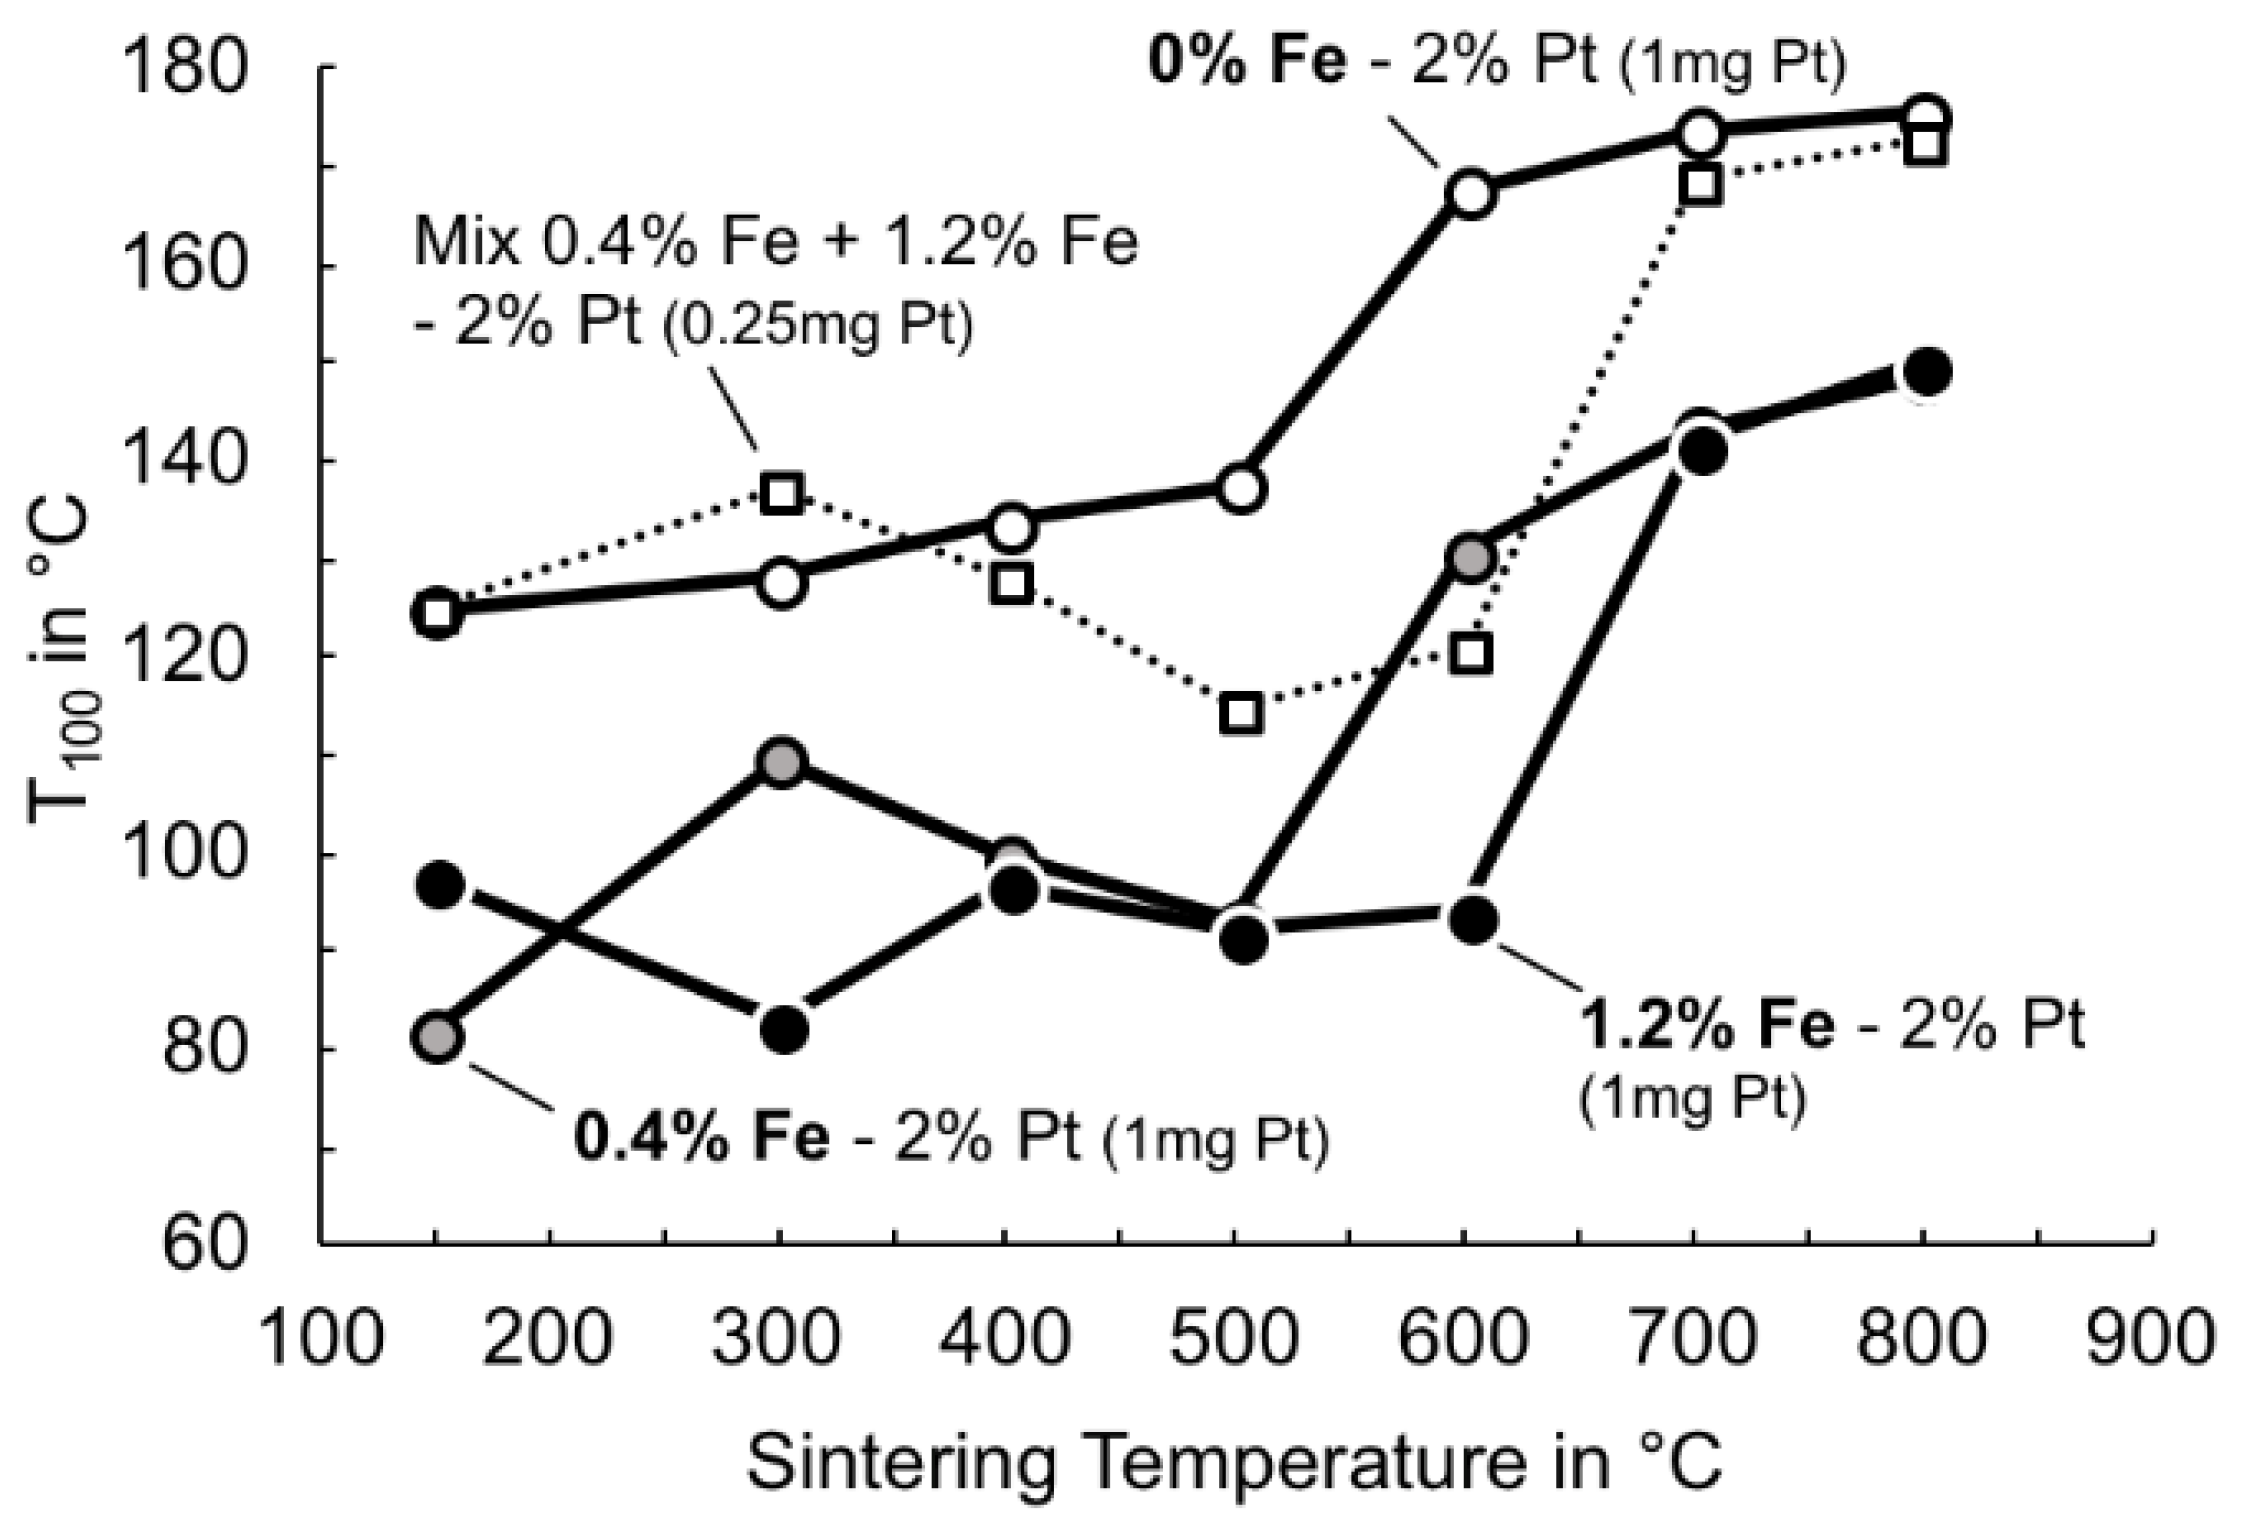
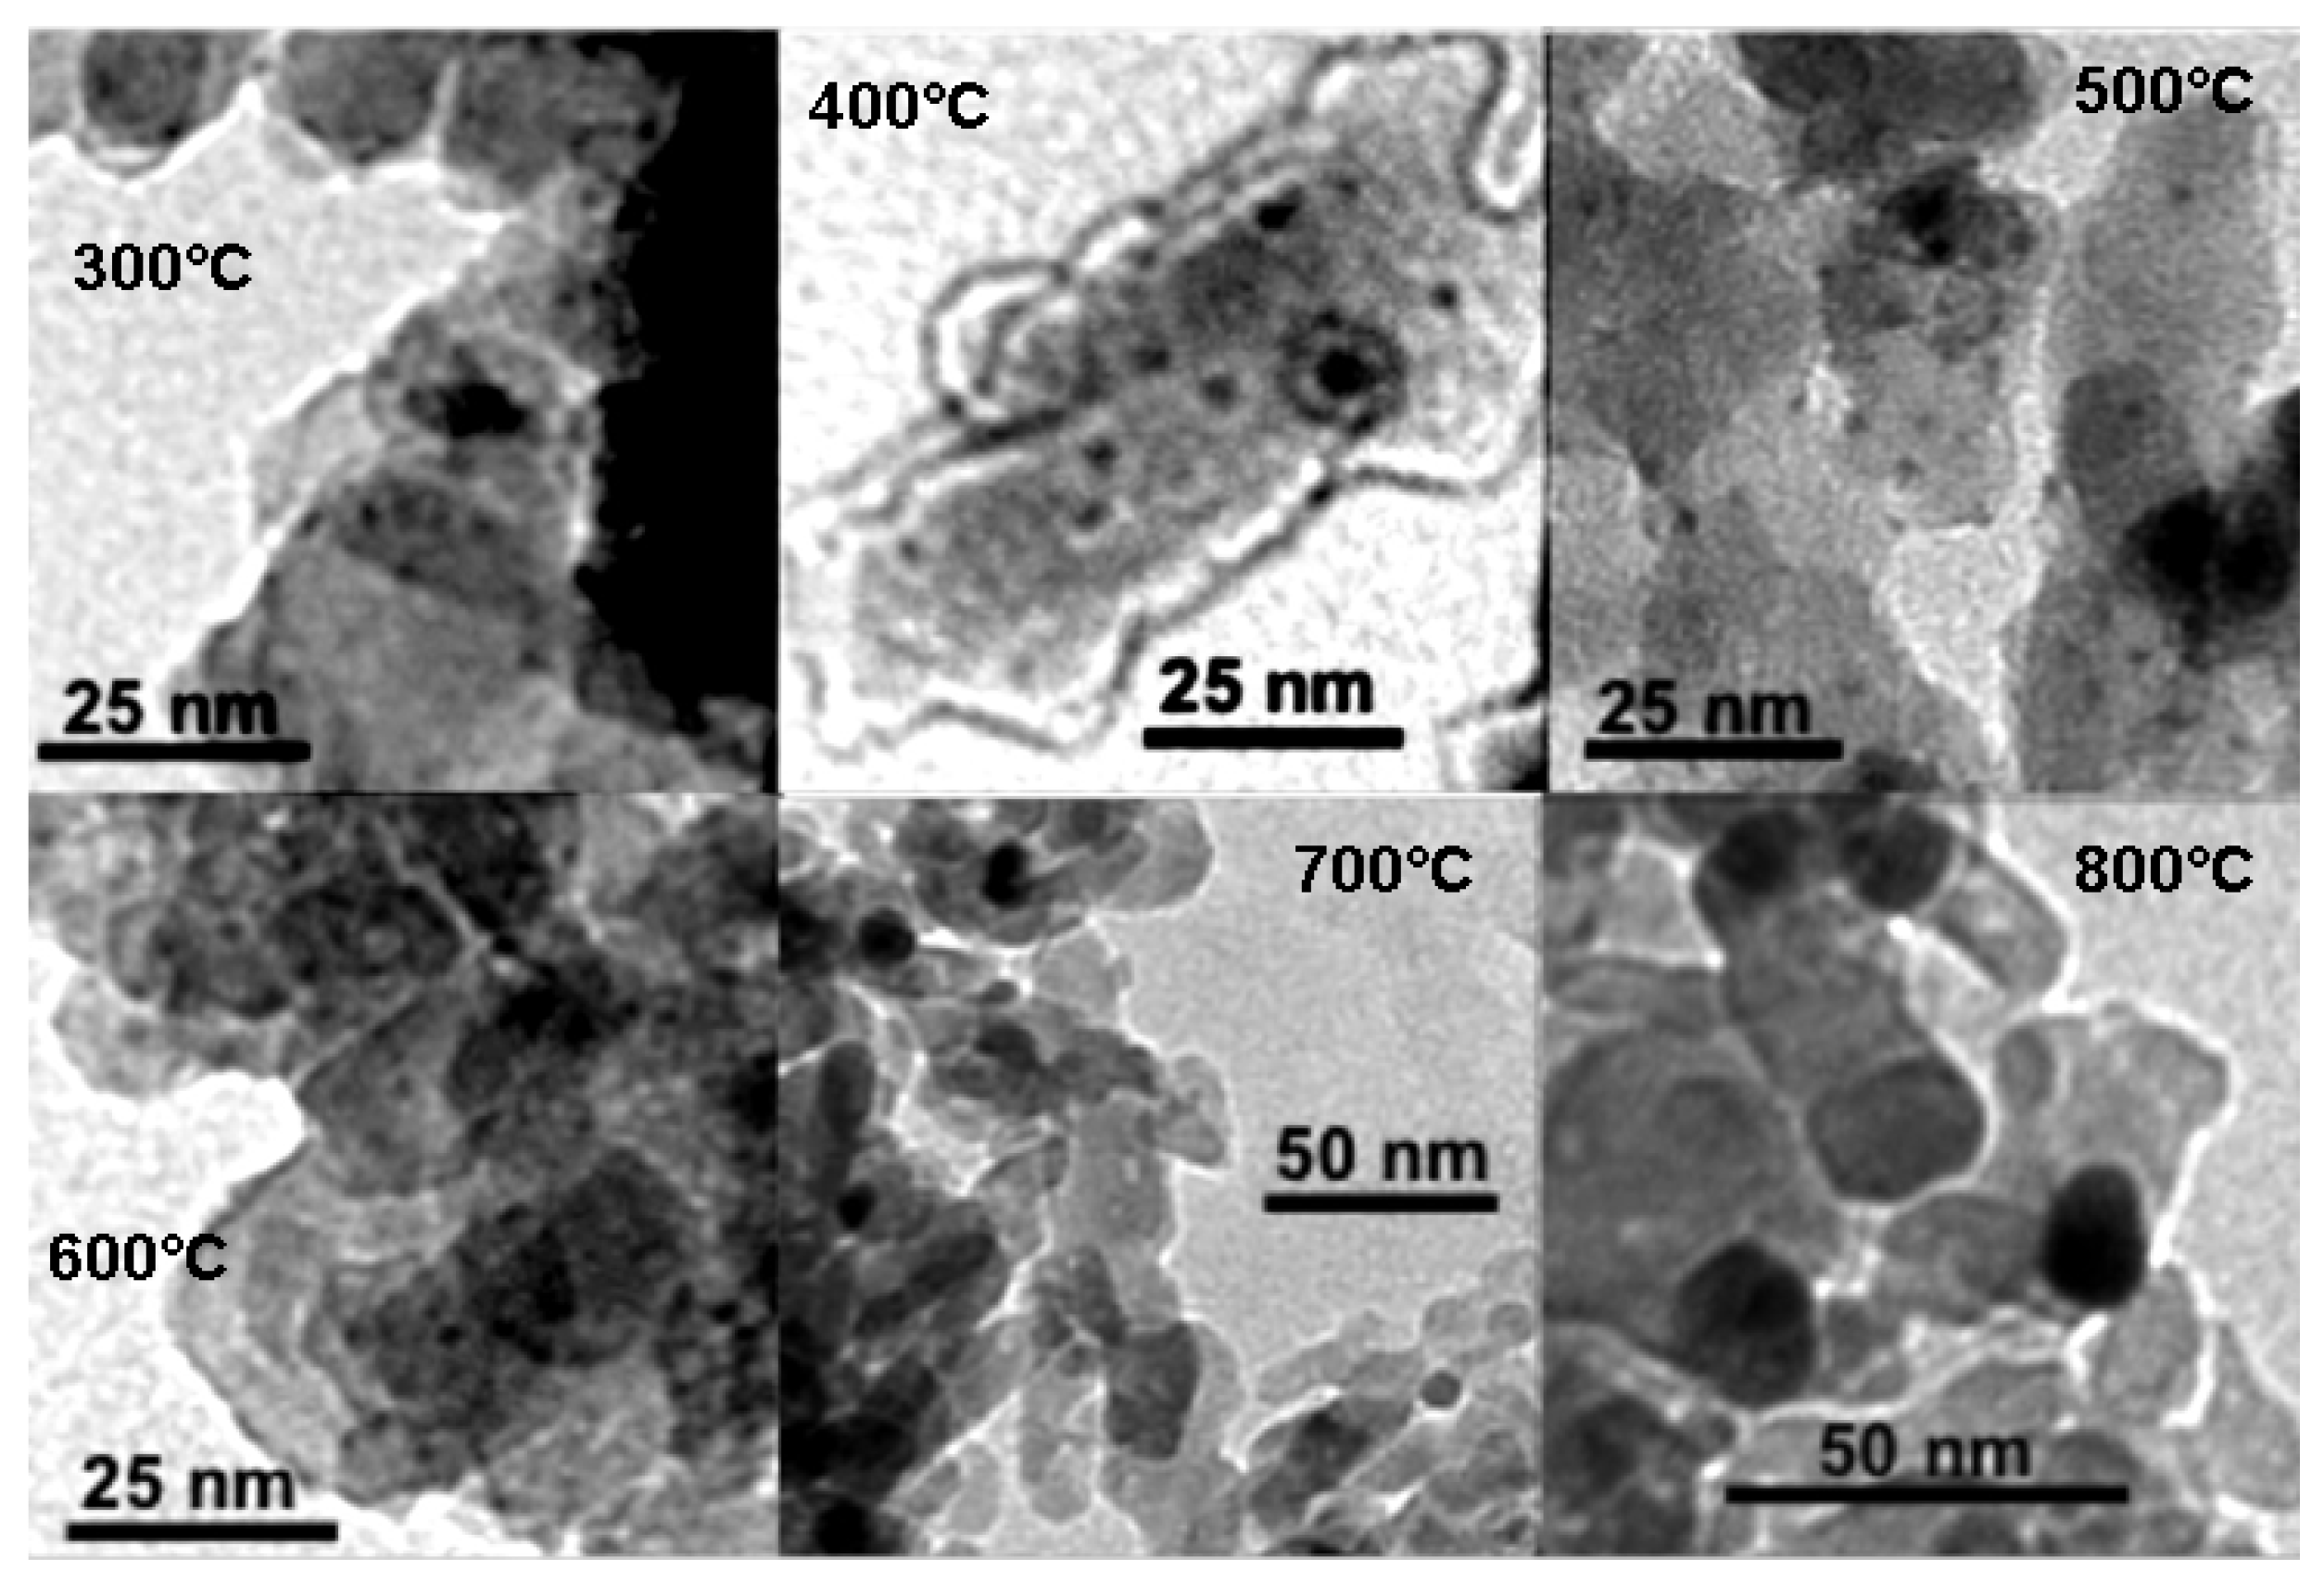
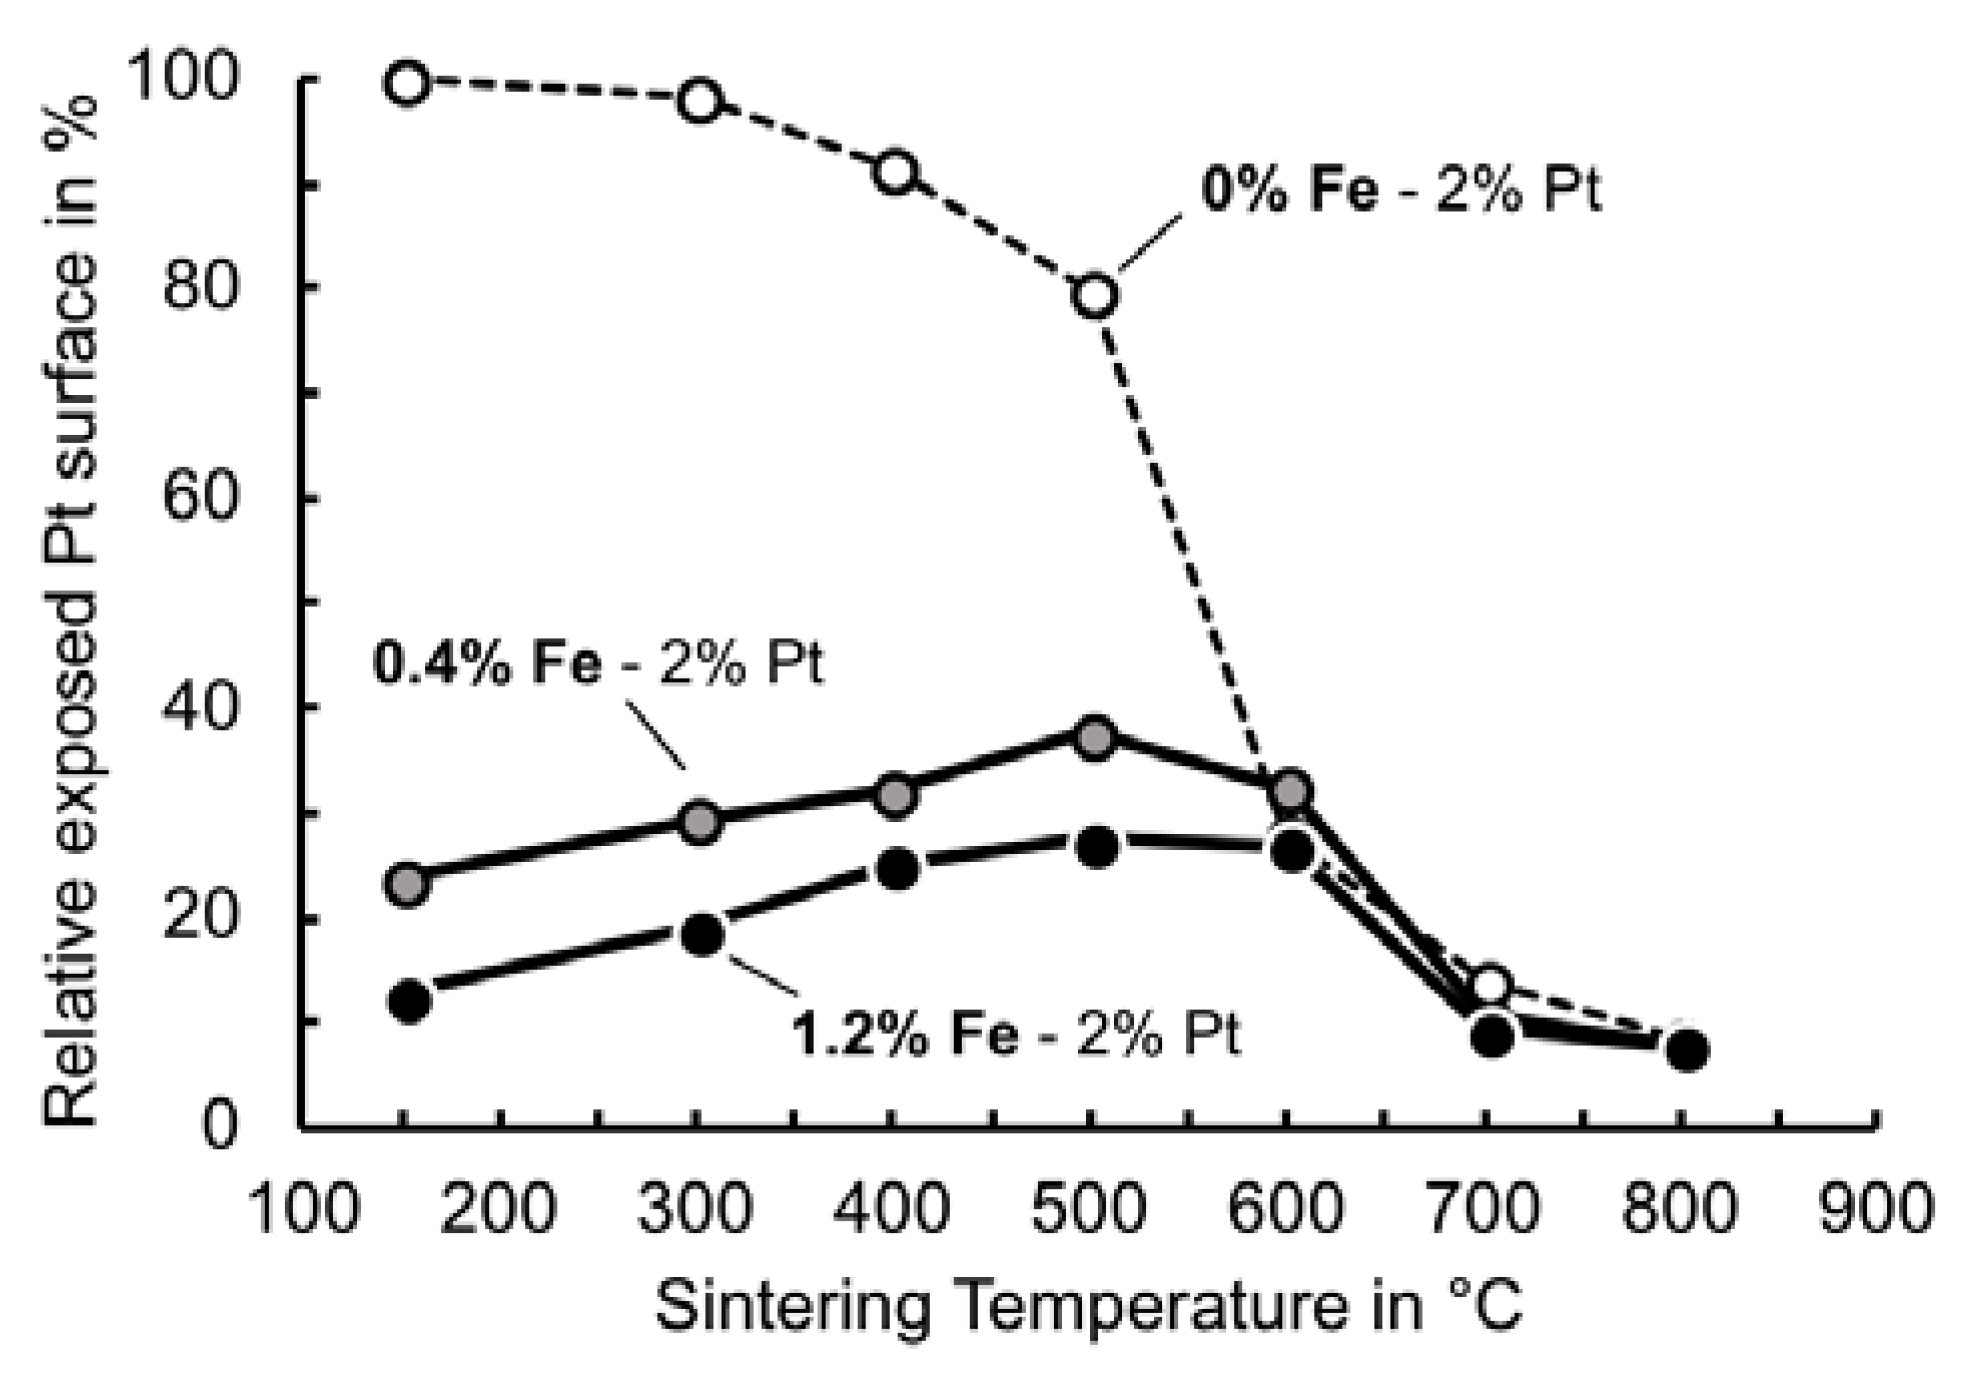
3.4. Effect of Sintering Temperature on Catalyst Behaviour

According to Figure 4, the most active Pt/FeOx catalysts were those with a Fe content of 0.4% and 1.2% respectively. Samples of these materials, along with the reference catalyst were studied with regard to their behavior under thermally induced sintering (as also investigated in Figure 8). For this purpose, their catalytic performance was tracked after successive and cumulative aging steps at temperatures between 150 and 800 °C. Each temperature step was held for 30 min. Results in terms of T100 are presented in Figure 6.
According to Figure 6, both Fe promoted Pt/Al2O3 samples have consistently superior activities compared to the reference sample (0% Fe). At higher temperatures, this is true also for the mixed sample, considering only 0.25 mg of Pt was effectively applied, as opposed to the other results produced by using a catalyst sample amount corresponding to 1 mg of Pt. The mixed sample was prepared and tested mainly to see how much of the Pt content in a Pt/FeOx/Al2O3 system could be reduced to achieve the same activity as the pure Pt/Al2O3 reference catalyst that is only 25% by means of Pt mass.
The T100 values of the Fe containing samples remain below 100 °C, up to sintering temperatures of 500 °C and 600 °C respectively. The sample with the higher Fe content is slightly more stable in this regard. By comparison, the reference sample shows a gradual but slow increase in T100 from the very start, followed by a more abrupt deterioration above 500 °C. Interestingly, neither Fe containing sample exhibits a uniform trend in T100 below 500 °C, but rather a local extremum in the vicinity of 300 °C (which incidentally appears also in the mixed sample). This “wave” could be explained by variations in the coverage of the Pt catalyst by the FeOx phase, possibly due to variations in FeOx mobility on the Pt with temperature that affect the accessible FeOx/Pt contact surface area.
Further insight can be obtained from Figure 7, where exposed Pt surface areas are plotted as obtained by CO chemisorption. Again, the reference sample shows a continual loss in Pt surface area with increasing sinter temperature, due to coalescence and growth of the Pt nanodots, which is shown in Table 3. This loss accelerates above 500 °C and correlates well with the rapid activity loss seen in Figure 6.
In Fe-containing samples, the Pt nanodots sinter and grow at roughly the same rate as in the reference sample (Table 3). However, the exposed Pt surface area relative to that of the reference sample increases at first with sinter temperature. For the 0.4% Fe sample, it increases from 13% at 150 °C to 27% at 600 °C (roughly 2×); and for the 1.2% Fe sample, it increases from 24% to 38% at 500 °C (roughly 1.6×). This must be due to a decrease in FeOx coverage on Pt (which is also seen by the relative increase in exposed Pt surface area by the sample in this temperature range, presented in Figure 7), probably because the FeOx migrates onto the aluminum oxide support. Above 600 °C, this migration appears to be complete because the surface area curves coincide for all samples. Nevertheless, the T100 data in Figure 6 show a sustained higher activity for the Fe-containing samples up to 800 °C. The exact nature of the Pt–FeOx interface at this stage is not entirely clear. Perhaps the Pt nanodots are surrounded by FeOx as shown in Figure 2.

4. Summary and Conclusions

A continuous atmospheric-pressure fluidized-bed-based CVD process has been used to prepare Fe-promoted Pt/Al2O3 catalysts via different deposition sequences. The questions addressed were (a) whether it would be advantageous in terms of catalytic activity to deposit the Fe before, along with, or after the Pt phase, and (b) which FeOx content would produce the optimal activity.
The catalytically most active Pt/FeOx/Al2O3 morphology and the (initially) largest accessible interfacial area were achieved by the deposition of FeOx following the deposition of Pt (route C). The inverse process (route A) gave the least active samples and the smallest interfacial area. The maximum enhancement effect (previous to thermal sintering) was observed for an Fe content of about 0.4%, while the sample containing 1.2% Fe showed superior results after sintering conditions.
Stepwise thermal sintering of these samples (0.4% and 1.2% Fe) with the best performance suggests that the FeOx phase migrated from the Pt to the substrate with increasing temperature. This process was completed between 500 °C and 600 °C depending on initial Fe content, when the exposed Pt surface area of the samples equaled that of a reference sample without Fe. At that stage, the catalytic performance of the Pt/FeOx/Al2O3 was still substantially better than that of the Pt reference sample.
Clearly, the contact of FeOx with Pt is decisive for the catalytic activity. And apparently, a very small amount of FeOx covering the Pt phase suffices. In this regard, the experiments with variable Fe deposition agree with the sintering experiments. On the other hand, samples with an initial optimum coverage retain their superior performance even when practically all the FeOx has migrated off the Pt. Thus, the nature of the interface leading to optimum performance cannot be entirely deduced from the experiments we conducted.
The above conclusions related to the catalytic function of our supported FeOx/Pt systems were made possible by a highly reproducible CVD-based process to produce well-defined samples in sufficient quantity. The method is versatile and flexible and could be applied to other material mixtures/pairings. Furthermore, the process is readily scalable.

Author Contributions

L.P., J.M. and G.K. conceived and designed the experiments; L.P. performed the experiments; all authors analyzed (at least) part of the data, depending on measurement method; E.E. strongly contributed with materials/analysis tools; L.P. and G.K. wrote the paper.

Funding

This research was funded by Deutsche Forschungsgemeinschaft and Open Access Publishing Fund of Karlsruhe Institute of Technology.

Acknowledgments

The author are very thankful for the help of Utz Kramar, Beate Ötzel, Benjamin Niethammer, Marion Arzt and Danielle Chati Seraphim.

Conflicts of Interest

The authors declare no conflict of interest.

References

  1. Sun, Y.N.; Qin, Z.H.; Lewandowski, M.; Shaikhutdinov, S.; Freund, H.J. CO adsorption and dissociation on iron oxide supported Pt particles. Surf. Sci. 2009, 603, 3099–3103. [Google Scholar] [CrossRef] [Green Version]
  2. Lewandowski, M.; Sun, Y.N.; Qin, Z.H.; Shaikhutdinov, S.; Freund, H.J. Promotional effect of metal encapsulation on reactivity of iron oxide supported Pt catalysts. Appl. Catal. A Gen. 2011, 391, 407–410. [Google Scholar] [CrossRef] [Green Version]
  3. Sun, Y.; Qin, Z.; Lewandowski, M.; Kaya, S.; Shaikhutdinov, S. When an Encapsulating Oxide Layer Promotes Reaction on Noble Metals: Dewetting and in situ Formation of an “Inverted” FeOx/Pt Catalyst. Catal. Lett. 2008, 126, 31–35. [Google Scholar] [CrossRef]
  4. Xu, H.; Fu, Q.; Yao, Y.; Bao, X. Highly active Pt–Fe bicomponent catalysts for CO oxidation in the presence and absence of H2. Energy Environ. Sci. 2012, 5, 6313–6320. [Google Scholar] [CrossRef]
  5. Korotkikh, O.; Farrauto, R. Selective catalytic oxidation of CO in H2: Fuel cell applications. Catal. Today 2000, 62, 249–254. [Google Scholar] [CrossRef]
  6. Liu, X.; Korotkikh, O.; Farrauto, R. Selective catalytic oxidation of CO in H2: Structural study of Fe oxide-promoted Pt/alumina catalyst. Appl. Catal. A Gen. 2002, 226, 293–303. [Google Scholar]
  7. Pasin, L.; Meyer, J.; Eiche, E.; Kasper, G. Efficient aerosol assisted delivery of low volatile precursors for CVD applications. J. Aerosol Sci. 2018. submitted. [Google Scholar]
  8. Faust, M.; Seipenbusch, M. Highly controlled structuring of Pt nanoparticles on TiO2 and on ZrO2 by a modified MOCVD process. Surf. Coat. Technol. 2014, 259, 577–584. [Google Scholar] [CrossRef]
  9. Faust, M.; Enders, M.; Bruns, M.; Bräse, S.; Gao, K.; Seipenbusch, M. Synthesis of nanostructured Pt/oxide catalyst particles by MOCVD process at ambient pressure. Surf. Coat. Technol. 2013, 230, 284–289. [Google Scholar] [CrossRef]
  10. Heel, A.; Kasper, G. Catalyst Nanoparticles from a Continuous MOCVS/MOCVD Aerosol Process at Atmospheric Pressure. Aerosol Sci. Technol. 2005, 39, 1027–1037. [Google Scholar] [CrossRef]
  11. Binder, A.; Heel, A.; Kasper, G. Deposition of palladium nanodots of controlled size and density onto surface-modified SiO2 particles by an atmospheric pressure CVS/MOCVD process. Chem. Vap. Depos. 2007, 13, 48–54. [Google Scholar] [CrossRef]
  12. Maury, B.F. Trends in Precursor Selection for MOCVD. Chem. Vap. Depos. 1996, 2, 113–116. [Google Scholar] [CrossRef]
  13. Thurier, C.; Doppelt, P. Platinum OMCVD processes and precursor chemistry. Coord. Chem. Rev. 2008, 252, 155–169. [Google Scholar] [CrossRef]
  14. Li, J.; Liang, X.; King, D.M.; Jiang, Y.B.; Weimer, A.W. Highly dispersed Pt nanoparticle catalyst prepared by atomic layer deposition. Appl. Catal. B Environ. 2010, 97, 220–226. [Google Scholar] [CrossRef]
  15. Zhou, Y.; King, D.M.; Liang, X.; Li, J.; Weimer, A.W. Applied Catalysis B : Environmental Optimal preparation of Pt/TiO2 photocatalysts using atomic layer deposition. Appl. Catal. B Environ. 2010, 101, 54–60. [Google Scholar] [CrossRef]
  16. Xue, Z.; Thridandam, H. Organometallic chemical vapor deposition of platinum. Reaction kinetics and vapor pressures of precursors. Chem. Mater. 1992, 4, 162–166. [Google Scholar] [CrossRef]
  17. Charpak, F.S.G.; Perkov, V. Ethyl ferrocene in gas, condensed, or adsorbed phases: Three types of photosensitive elements for use in gaseous etectors. Nucl. Instrum. Methods Phys. Res. 1989, 277, 537–546. [Google Scholar] [CrossRef]
  18. Karlsruhe Institut for Technlogy. X-Ray fluorescence Spectrometers. In Encyclopedia of Spectroscopy and Spectrometry; Academic Press: Waltham, MA, USA, 1999; pp. 2467–2477. [Google Scholar]
  19. Karakaya, C.; Deutschmann, O. A simple method for CO chemisorption studies under continuous flow: Adsorption and desorption behavior of Pt/Al2O3 catalysts. Appl. Catal. A Gen. 2012, 445–446, 221–230. [Google Scholar] [CrossRef]
  20. Valverde, J.M.; Castellanos, A. Types of gas fluidization of cohesive granular materials. Phys. Rev. Lett. 2007, 75, 031306. [Google Scholar] [CrossRef] [PubMed]
  21. Wang, C.; Cai, Y.; Wachs, I.E. Reaction-Induced Spreading of Metal Oxides onto Surfaces of Oxide Supports during Alcohol Oxidation: Phenomenon, Nature, and Mechanisms. Langmuir 1999, 15, 1223–1235. [Google Scholar] [CrossRef]
  22. Weis, F.; Schneider, R.; Seipenbusch, M.; Kasper, G. Synthesis of Bi2O3/SiO2 core–shell nanoparticles by an atmospheric CVS/CVD process and their modification by hydrogen or electron-beam induced reduction. Surf. Coat. Technol. 2013, 230, 93–100. [Google Scholar] [CrossRef]
  23. Neubauer, N.; Palomaeki, J.; Karisola, P. Size-dependent ROS production by palladium and nickel nanoparticles in cellular and acellular environments—An indication for the catalytic nature of their interactions. Nanotoxicology 2015, 9, 1059–1066. [Google Scholar] [CrossRef] [PubMed]
  24. Powell, Q.H. Gas Phase Production and Coating Titania in Tubular, Hot-Wall Reactors; University of New Mexico: Albuquerque, NM, USA, 1995. [Google Scholar]
  25. DIN 66136-1:2004-03 Bestimmung des Dispersionsgrades von Metallen durch Chemisorption—Teil 1: Grundlagen; DIN: Berlin, Germany, 2014; (InGerman).
Figure 1. Schematic depiction of the fluidized bed chemical vapor deposition (FB-CVD) with the aerosol assisted precursor delivery and sampling systems.
Coatings 08 00217 g001
Figure 2. Schematic of the morphologies and phase interfaces expected from the three CVD routes.
Coatings 08 00217 g002
Figure 3. TEM analysis showing samples with 2% Pt on Al2O3 produced via route C. (a) 0% Fe; (b) 0.4% Fe; (c) 9% Fe. Pt dot sizes are approx. 1.9–2 nm in all samples.
Coatings 08 00217 g003
Figure 4. Catalytic activity as a function of Fe concentration. Activity is expressed in terms of temperature for 100% CO conversion (black data points) and CO conversion at 75 °C (the lowest T100 temperature in the data set; gray data points). Each data point is the mean of several measurements, with a maximum variation of ±5 °C.
Coatings 08 00217 g004
Figure 5. Exposed Pt surface area (relative to that of the reference sample without Fe) as a function of Fe concentration. Each data point is the mean of several measurements, with a maximum variation of ±10%.
Coatings 08 00217 g005
Figure 6. Change in catalytic activity as a function of sintering temperature. Pt content in each measurement sample 1 mg except the “mix sample” which contained only 0.25 mg Pt (0.125 mg 0.4% Fe sample and 0.125 mg 1.2% Fe sample).
Coatings 08 00217 g006
Figure 7. Exposed Pt surface (relative to the fresh Pt catalyst without Fe) as a function of the sintering temperature; each step was held for 30 min.
Coatings 08 00217 g007
Figure 8. TEM images after sintering at successively higher temperatures up to 800 °C, each step being held for 30 min (left to right and top to bottom) for a sample with 2% Pt and 0.4% Fe.
Coatings 08 00217 g008
Table 1. Exposed Pt surface and relative FeOx/Pt interface area (SInterface) by process route.
Sample/Route0.3 wt % Pt and 3 wt % Fe0.8 wt % Pt and 3 wt % Fe
Pt surface Area [m2/g Sample] (±0.1 m2/g Sample)Relative FeOx/Pt Interfacial Area SInterface (%)Pt surface Area [m2/g Sample] (±0.1 m2/g Sample)Relative FeOx/Pt Interfacial Area SInterface (%)
Reference Pt (no Fe)0.3~01.2~0 *
Route A0.3
Route B0.742
Route C0.2330.283
Reference Fe (no Pt)0
Note: * based on the results obtained with 0.3 wt % Pt samples.
Table 2. T100 conversion temperatures for each process route, obtained with samples, each containing 1 mg of Pt, or in case of “Fe without Pt”, with 1 mg of Fe.
Sample/RouteT100 (°C) (±5 °C)
0.3 wt % Pt & 3 wt % Fe0.8 wt % Pt & 3 wt % Fe
Reference Pt (no Fe)183143
Route A110
Route B124
Route C87103
Reference Fe (no Pt)>300
Table 3. Mean Pt dot diameters as a function of sinter temperature. Diameters for the reference sample were obtained from CO chemisorption data (uncertainty ± 10%), for the 0.4% Fe sample from TEM data (uncertainty ± 20%) because CO chemisorption on a partially covered Pt surface would yield incorrect values.
Sinter Temp. (°C)Reference Sample a (nm)0.4% Fe Sample b (nm)
1502.31.9 c
3002.31.9
4002.72
5003.22.3
6009.15.1
70018.113
80029.520
Notes: a CO/Pt chemisorption stoichiometry of 1 ([25]) and assuming hemispherical Pt particle shape; b TEM images of Figure 3 and Figure 8; c Top left-hand of Figure 3.

