Article

Influence of Oxygen Contents on the Microstructure, High Temperature Oxidation and Corrosion Resistance Properties of Cr–Si–O–N Coatings

1
School of Chemistry and Chemical Engineering, South China University of Technology, Guangzhou 510640, China
2
School of Physics Science and Technology, Lingnan Normal University, Zhanjiang 524048, China
*
Author to whom correspondence should be addressed.
Coatings 2018, 8(1), 19; https://doi.org/10.3390/coatings8010019
Submission received: 8 November 2017 / Revised: 19 December 2017 / Accepted: 25 December 2017 / Published: 3 January 2018
(This article belongs to the Special Issue Hybrid Surface Coatings & Process (Selected Papers from HyMaP 2017))

Abstract

:
Cr–Si–O–N coatings with different oxygen contents were deposited by multi-arc ion plating, where various O2/(N2 + O2) reactive gas rates were adopted. The XRD and XPS results showed that the CrN crystals disappeared with the increasing of the oxygen flux ratio to 10 at.%. The microhardness of all the Cr–Si–O–N coatings was approximately 2000 Hv0.05, which were dramatically plummeted compared to that of the Cr–Si–N coatings (≈3300 Hv0.05). The Cr–Si–O–N coatings were annealed under 800 °C and 1200 °C in the air atmosphere for 2 h to study the high-temperature oxidation resistance of the coatings. Meanwhile, Cr–Si–O–N coatings with different O2/(N2 + O2) rates were also used to carry out the corrosion resistance testing using the electrochemical working station in 3.5% NaCl solution under free air condition at room temperature. The results indicated that the coatings containing oxygen were more vulnerable to the high-temperature destruction and more easily corroded in the NaCl electrolyte.

1. Introduction

CrN has been one of the most extensively used hard coatings for various forming and casting applications [1,2], due to its excellent high-temperature oxidation resistance and good corrosion resistance [3,4]. In recent years, efforts have been continuously devoted in order to further improve the properties of CrN coatings. One of the most promising approaches is to synthesize the Cr–Si–N nanocomposite coatings, which follows the design concept of superhard nc-MeN/a-Si3N4 proposed by Veprek et al. [5].
In the nanocomposites coatings, the oxygen has a great impact on the properties. On one hand, it has been reported that the oxygen impurity could be critically harmful to the superhard nanocomposite coatings [6,7]. Veprek et al. [8] synthesized the Ti–Si–N superhard nanocomposites coatings with a hardness of ≥50 GPa, which was difficult for some other groups to achieve [9,10,11]. Verprek et al. [8] figured that one of the important reasons for the lack of reproducibility was the oxygen impurity incorporated into the coatings during the deposition process. It was impossible to achieve the hardness of 40 GPa when the oxygen impurity was larger than 0.4 at.%. Ma et al. [12] also reported that oxygen impurity of 1–1.5 at.% could lead to a sharp decrease in hardness to 30 GPa, while they could obtain 45–55 GPa in the nc-TiN/a-Si3N4 coatings by controlling the oxygen impurity below 0.2 at.%. On the other hand, however, Lee et al. [13] reported that the mechanical and tribological properties of the Cr–Si–O–N nanocomposite coatings with appropriate oxygen contents were much better than that of the Cr–Si–N coatings. Therefore, it is really important to investigate the influence of the oxygen and the oxygen contents on the properties of Cr–Si–N coatings.
In this work, the quaternary Cr–Si–O–N coatings with different oxygen contents were deposited by a multi-arc ion plating process in a N2 + O2 atmosphere. The microstructure, mechanical, high-temperature oxidation and electrochemical corrosion resistance properties of the Cr–Si–O–N coatings, as a function of oxygen contents, were systematically investigated. Although scant information about the deposition of the Cr–Si–O–N coatings has been reported [14], the influence of varying the oxygen content to the microstructure and properties of the Cr–Si–O–N coatings is still relatively unclear.

2. Experimental Details

Cr–Si–O–N coatings were deposited by the multi-arc ion plating technique (supplied by company of DongGuan HuiCheng Mechanical Engineering, Dongguan, China) under a deposition temperature of approximately 100 °C, where the CrSi target (Cr 85 at.% and Si 15 at.%, cylindrical in shape and with a diameter of 95 mm) was used as the cathode. During all experiments, the Cr–Si–O–N coatings with different oxygen contents were obtained by varying the O2/(N2 + O2) flow rate ratio. In this work, the working pressure was stabilized at 1 Pa, and the reactive gas flow rate ratio (O2 flow:N2 flow) was set at 0% (O2:N2 = 0 sccm:45 sccm), 2% (O2:N2 = 0.9 sccm:44.1 sccm), 5% (O2:N2 = 2.25 sccm:42.75 sccm), 10% (O2:N2 = 4.5 sccm:40.5 sccm), 15% (O2:N2 = 6.75 sccm:38.25 sccm) and 20% (O2:N2 = 9 sccm:36 sccm), respectively. Prior to deposition, the WC–Co cemented carbide (16 mm in diameter, 5 mm in thickness) and silicon wafer (111) (10 mm in diameter, 1 mm in thickness) substrates were ultrasonically cleaned by acetone and alcohol in sequence for 20 min, followed by a rapid Ar drying. Then, the substrates were placed on the sample holder in the middle of the vacuum chamber for the following deposition, and the whole chamber was heated at 300 °C for 0.5 h. The substrates were DC (direction current) biased at −100 V and the current of the CrSi target was fixed at 70 A. The deposition was performed for 50 min to obtain the Cr–Si–O–N coatings, whose thickness was about 1.5 μm under a working pressure of 1.0 Pa. The parameters of the deposition are summarized in Table 1.
The coatings deposited on Si wafer were used for oxidation experiment, and the high-temperature oxidation resistance ability was evaluated by comparison of the change of coatings phase using XRD (X-ray diffraction, X’Pert-MPD System, PHILIPS, Amsterdam, The Netherlands) and observation of separation extent between Cr–Si–O–N coatings and substrates using SEM (scanning electron microscope, MERLIN, ZEISS, Jena, Germany). The experiments were carried out at a heating rate of 10 °C/min and the coatings were annealed at 800 °C and 1200 °C in the air for 2 h. The electrochemical corrosion test resistance of the deposited Cr–Si–O–N coatings and WC–Co cemented carbide substrate were tested by an electrochemical working station (CS350, Wuhan Kesite Instrument Co., Ltd., Wuhan, China) in 3.5% NaCl solution. The crevice corrosion was carried out under free air condition at room temperature, with scanning range from −0.5 to 1.5 V versus open circuit potential, and the mercury/mercury chloride combined with luggin probe as the reference electrode, and the platinum electrode (1 cm2) as the counter electrode. To obtain accurate curve, Lujin capillary was as close as possible to the study electrode for decreasing liquid potential and the scan rate of 0.5 mV/s was used. The corrosion potential, corrosion current and polarization resistance obtained from the Tafel plots were used to evaluate the corrosion rate of deposited coatings. In addition, Electrochemical Impedance Spectroscopy (EIS, CS350, Wuhan Kesite Instrument Co., Ltd., Wuhan, China) measurements were recorded at open circuit potential in the frequency range of 10−2–10−5 Hz with a signal amplitude of 10 mV in 3.5% NaCl solution. The experiment of Potentiodynamic Polarization Curves, Electrochemical Impedance Spectroscopy and high-temperature oxidation test were repeated for 3 times.
The structure and phases of the Cr–Si–O–N coatings deposited on Si wafer were analyzed by X-ray diffraction (XRD, X’Pert-MPD System, PHILIPS, Amsterdam, The Netherlands) with 0.04° using Cu Kα radiation. The bonding status of Cr–Si–O–N coatings was studied by X-ray photoelectron spectra (XPS, PHI X-tool, ULVAC-PHI, Inc., Chigasaki, Japan) with Al Kα X-ray at 15 kV and 50 W. The chemical compositions of coatings were investigated by the electron probe microanalyzer (EPMA, EPMA 1600, Shimadzu, Kyoto, Japan). The field emission scanning electron microscope was used to obtain the surface morphology and the cross sectional images of the coatings before and after annealing. The microhardness of Cr–Si–O–N coatings deposited on cemented carbide substrate were measured by using an HX-1000 micro-hardness tester (ShangHai TaiMing Optical Instrument Co., Ltd., Shanghai, China) with a load of 50 gf (0.49 N) and the final values are taken from average values of 10 measurements.

3. Results and Discussion

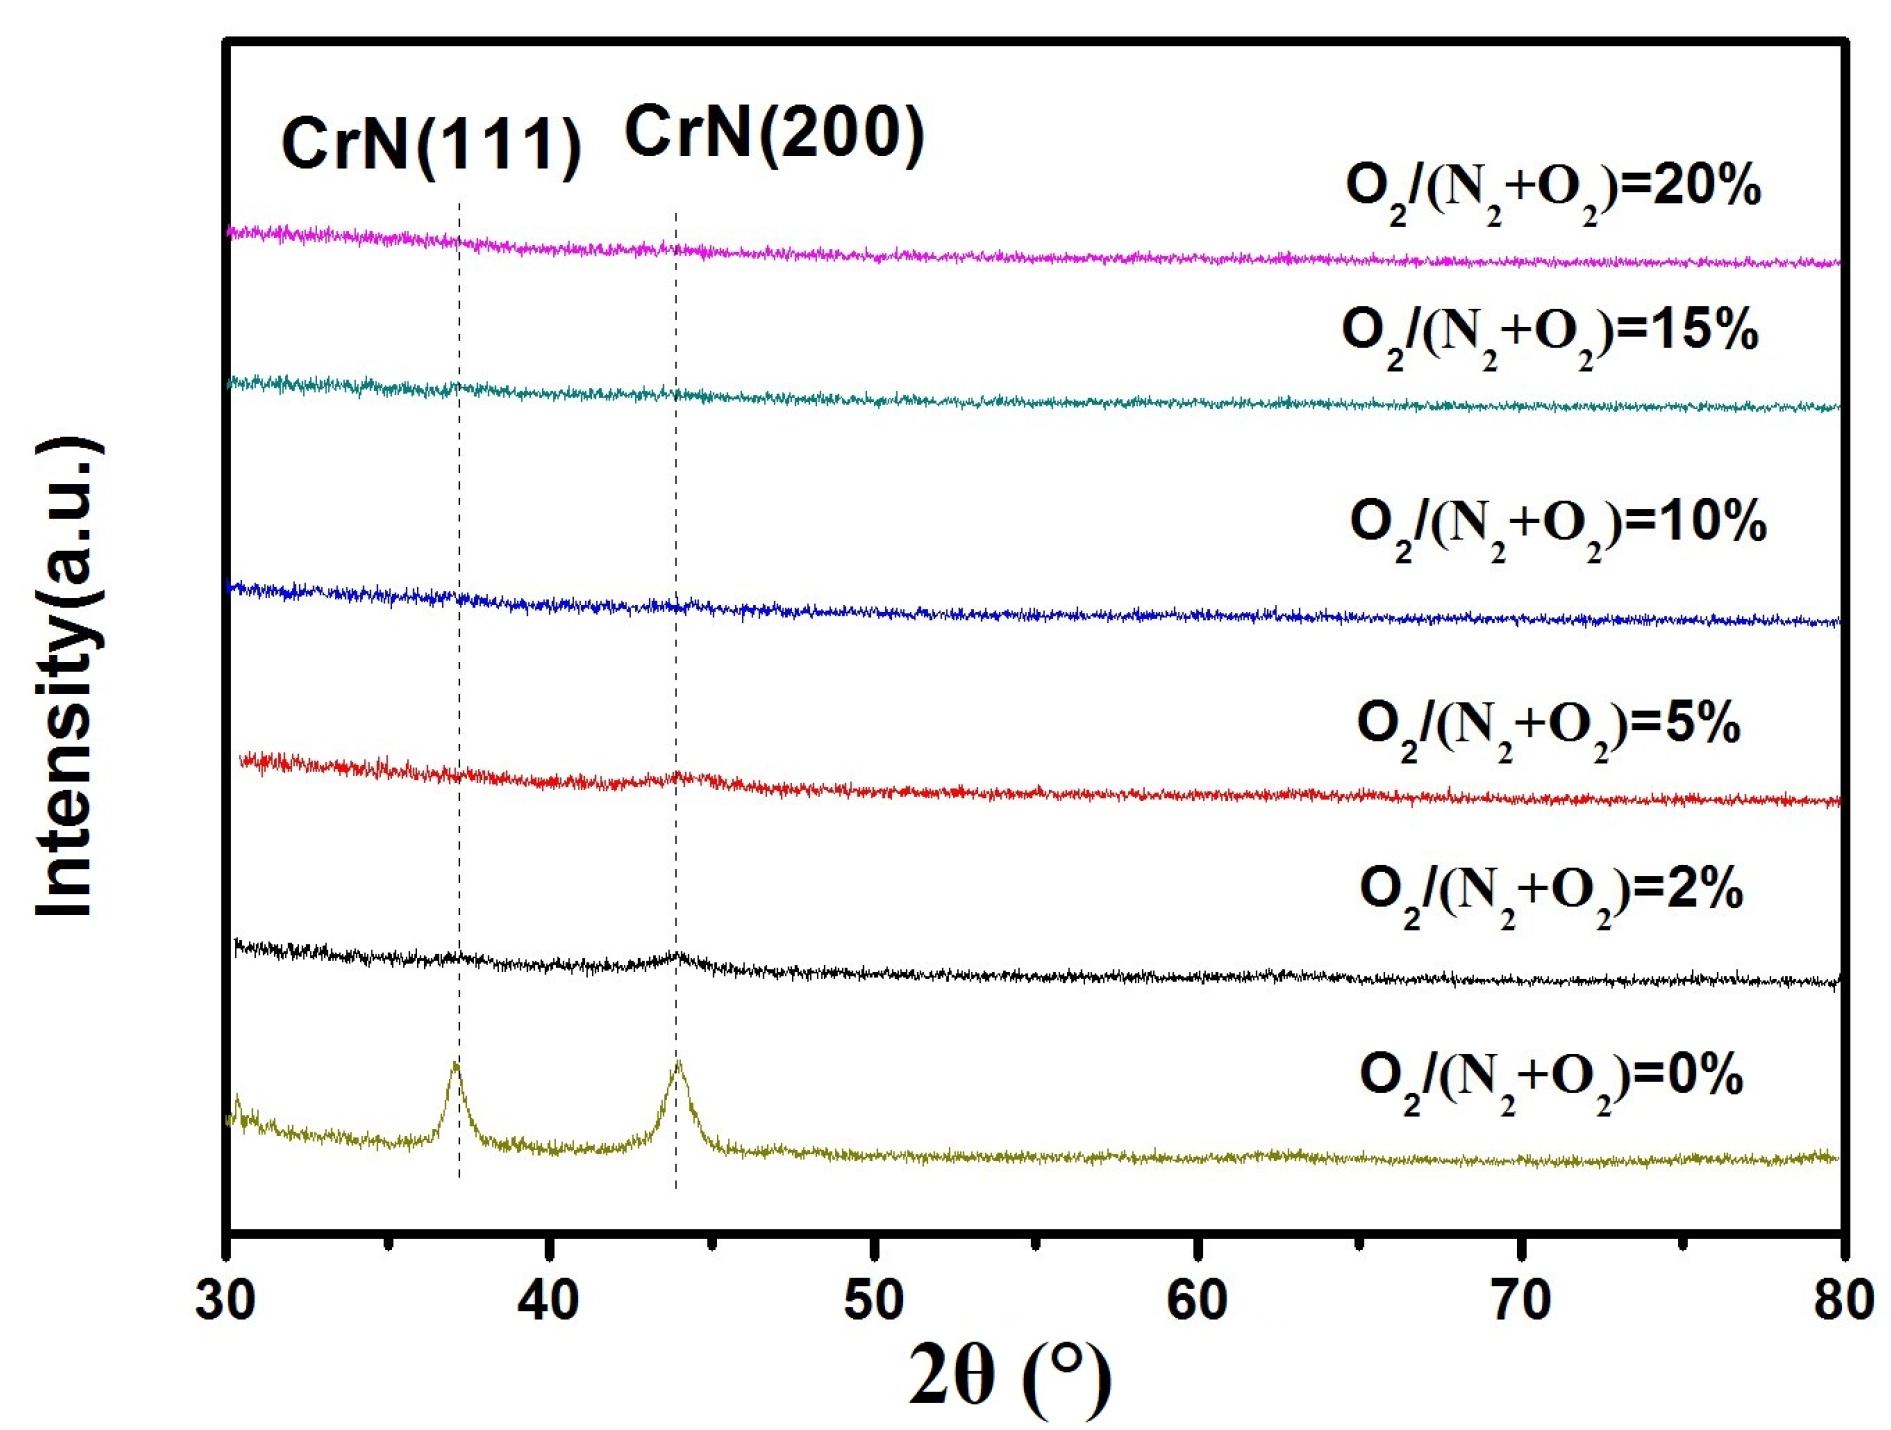
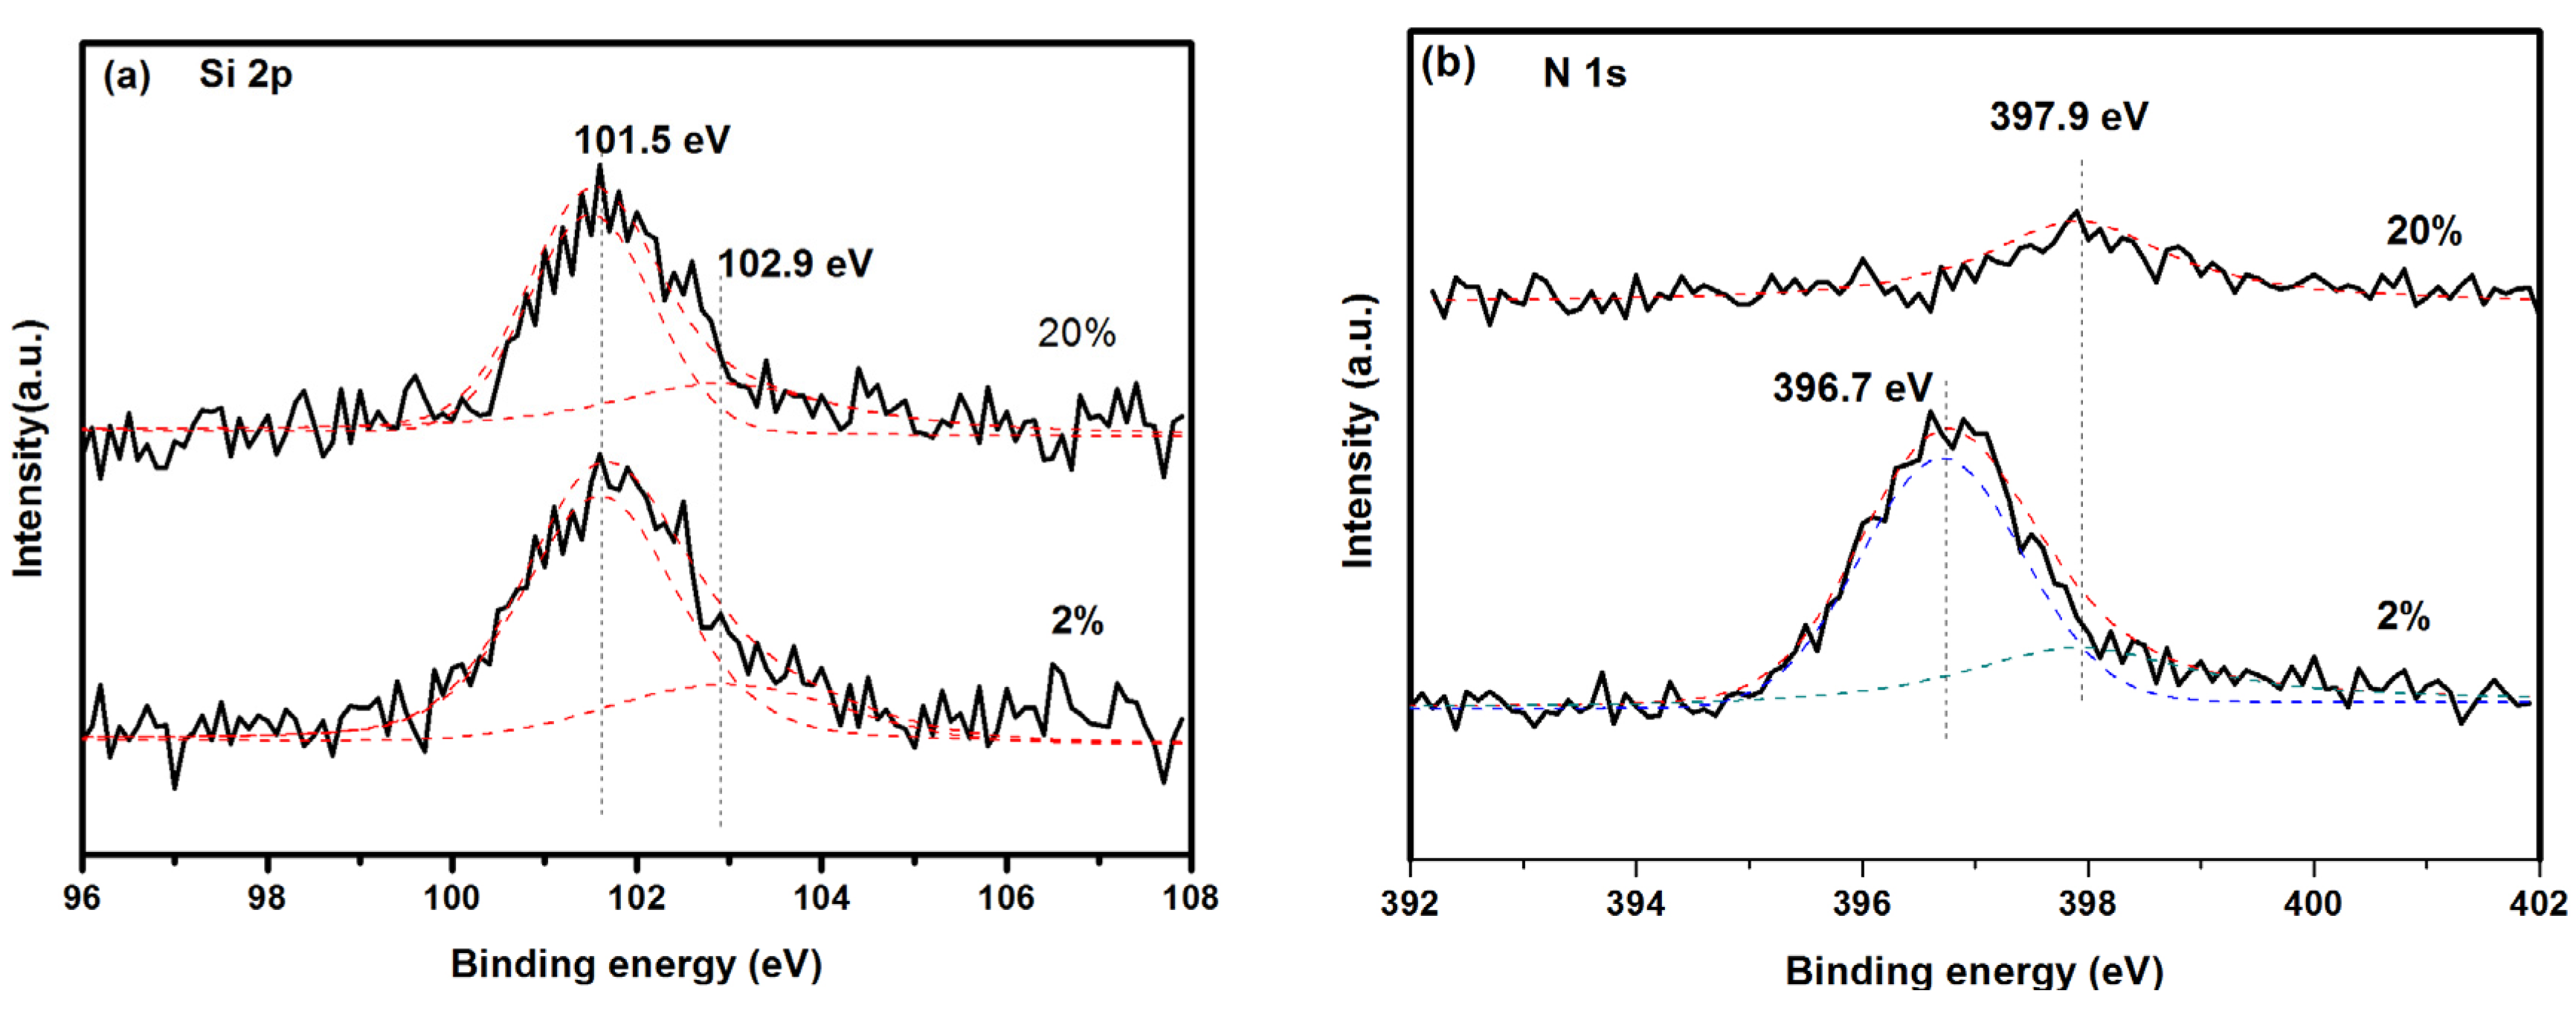
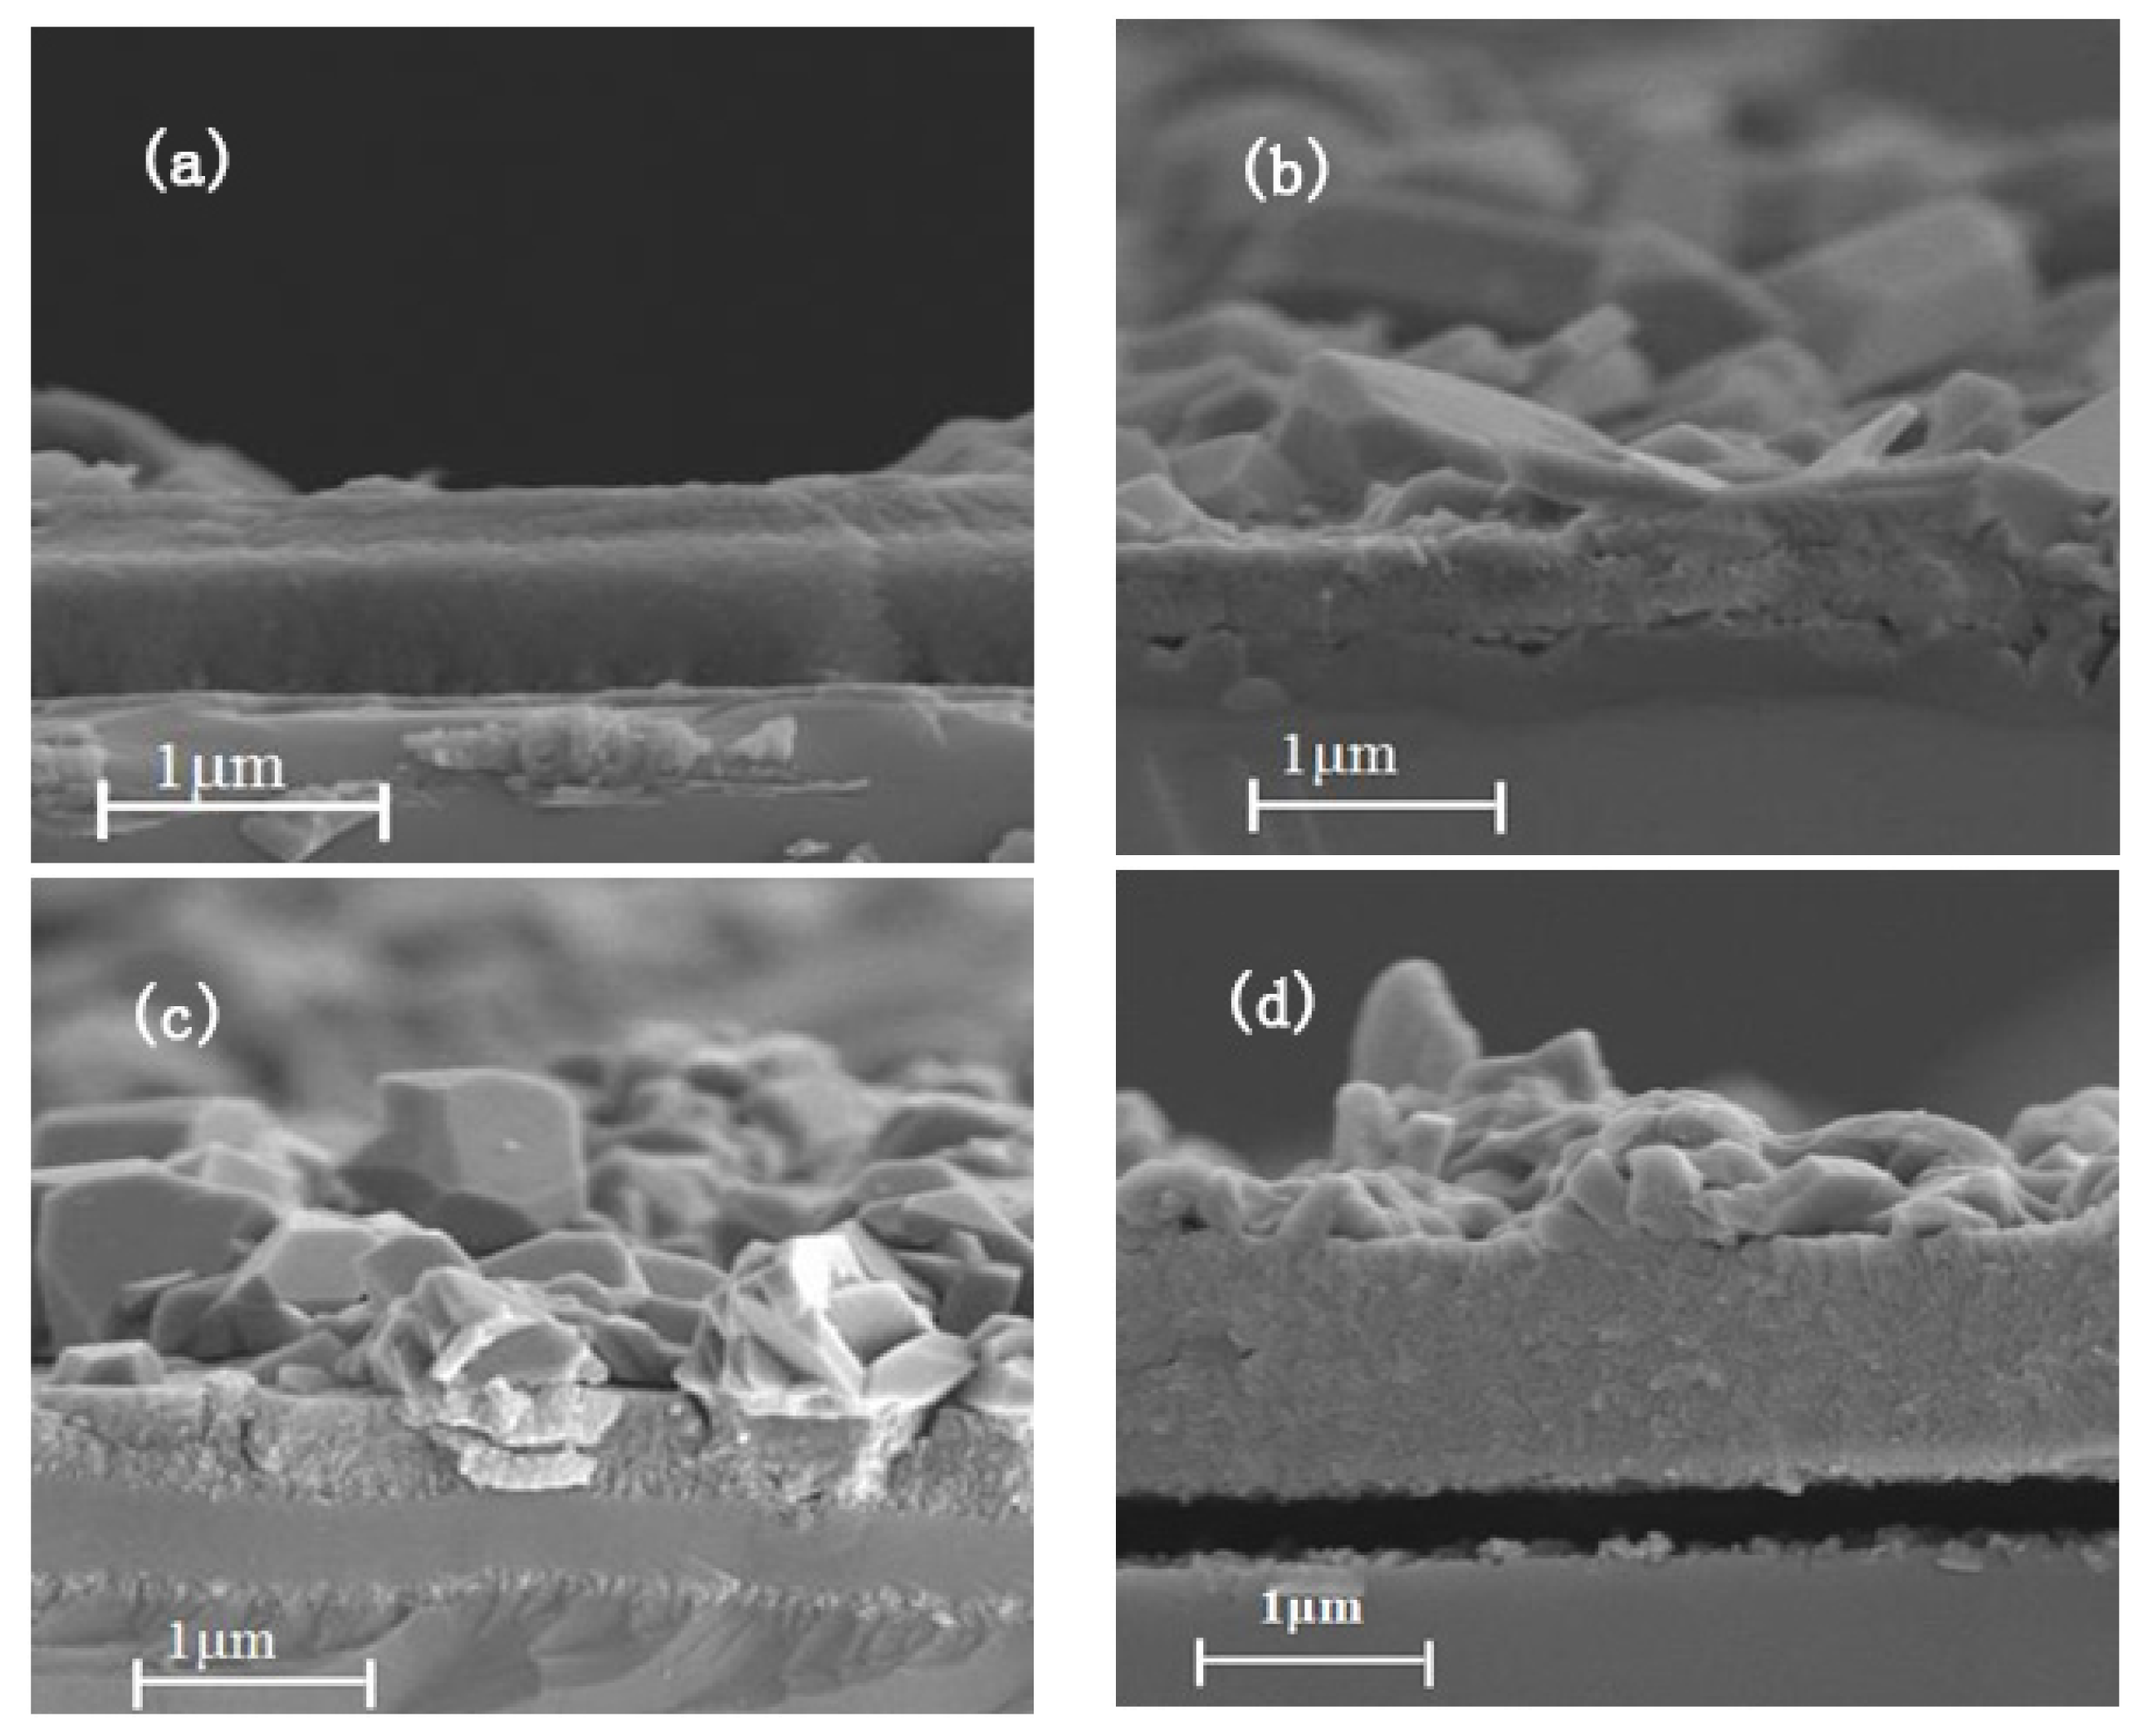
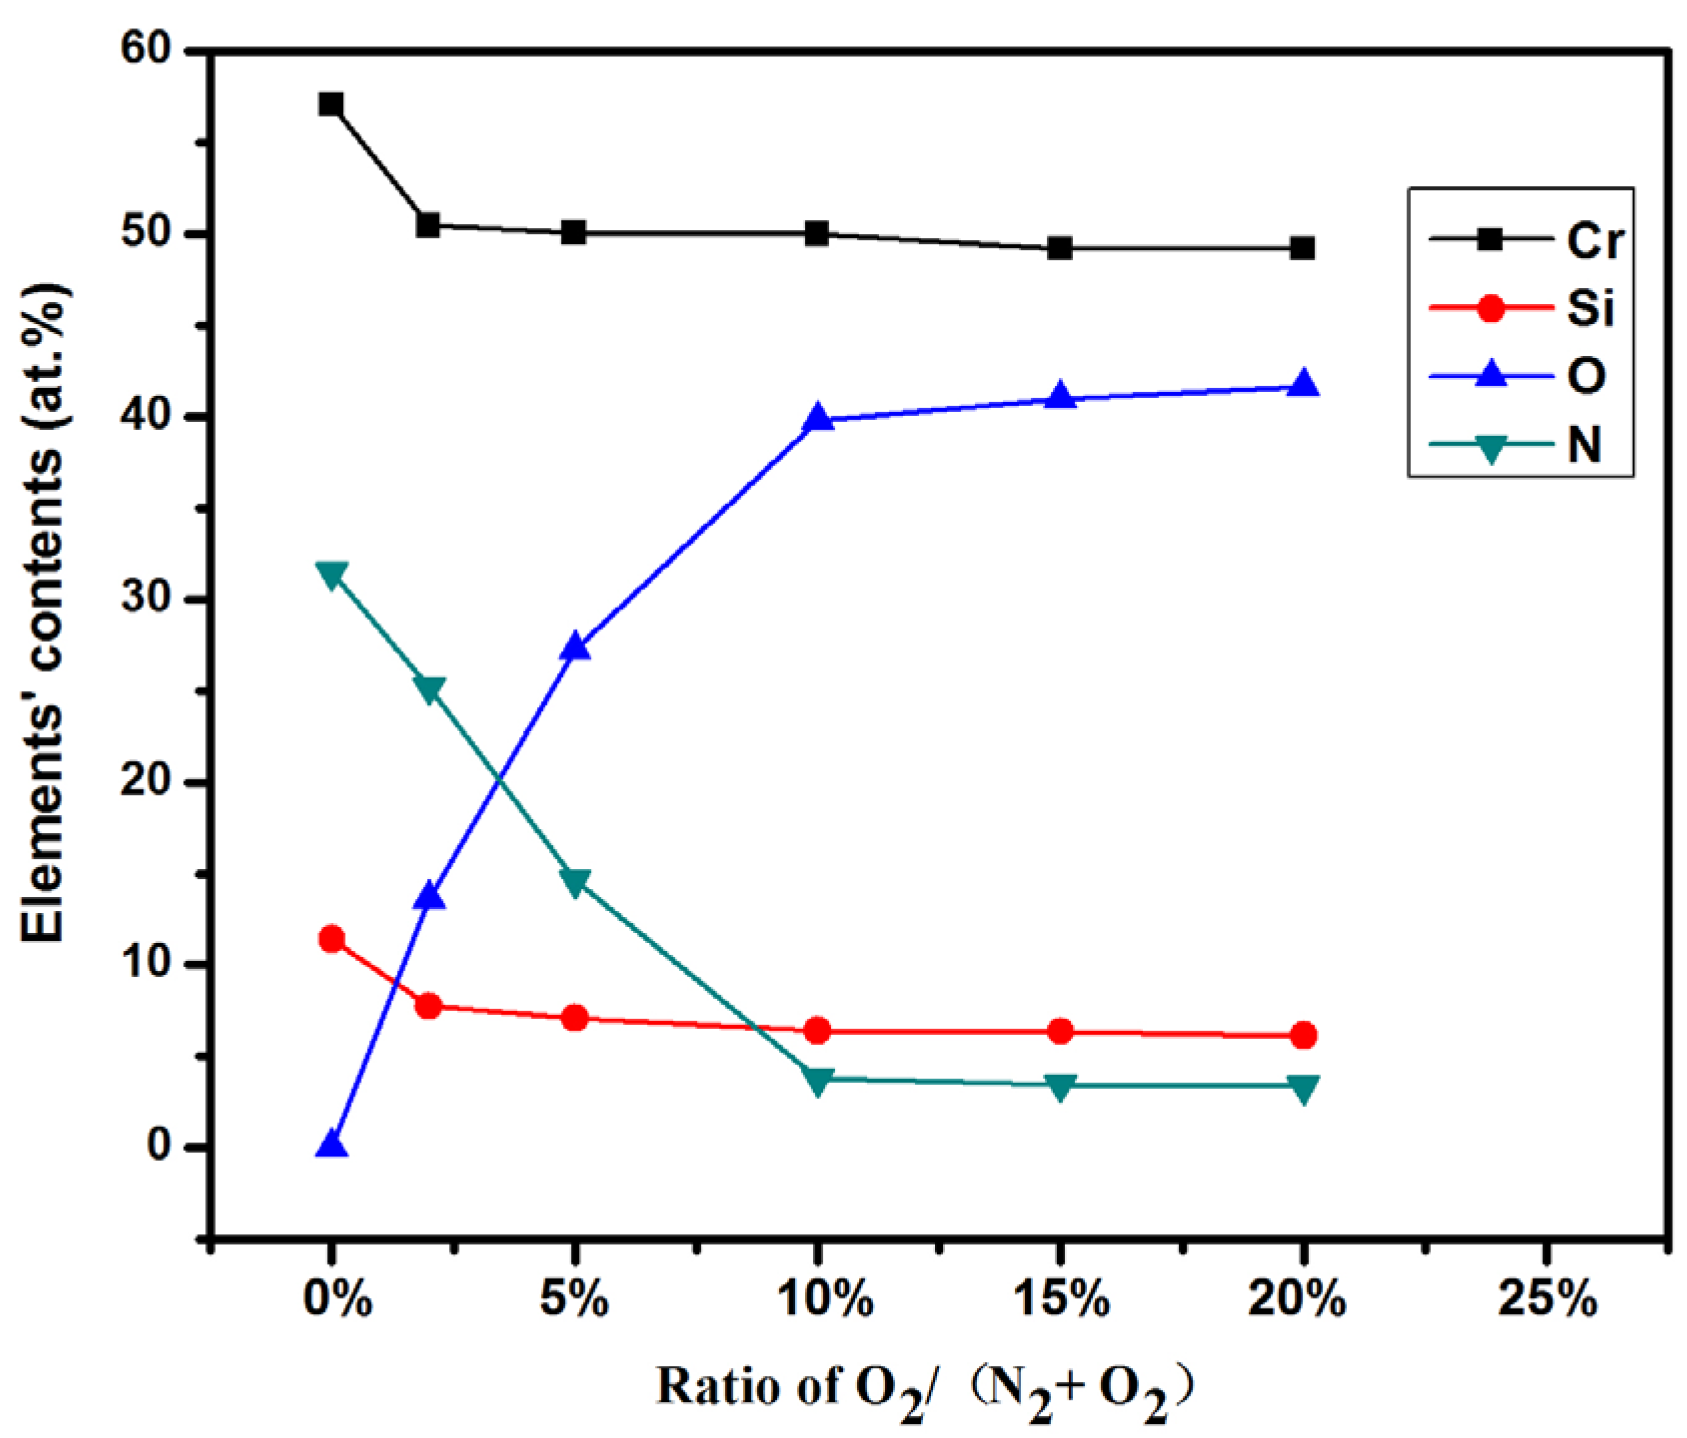
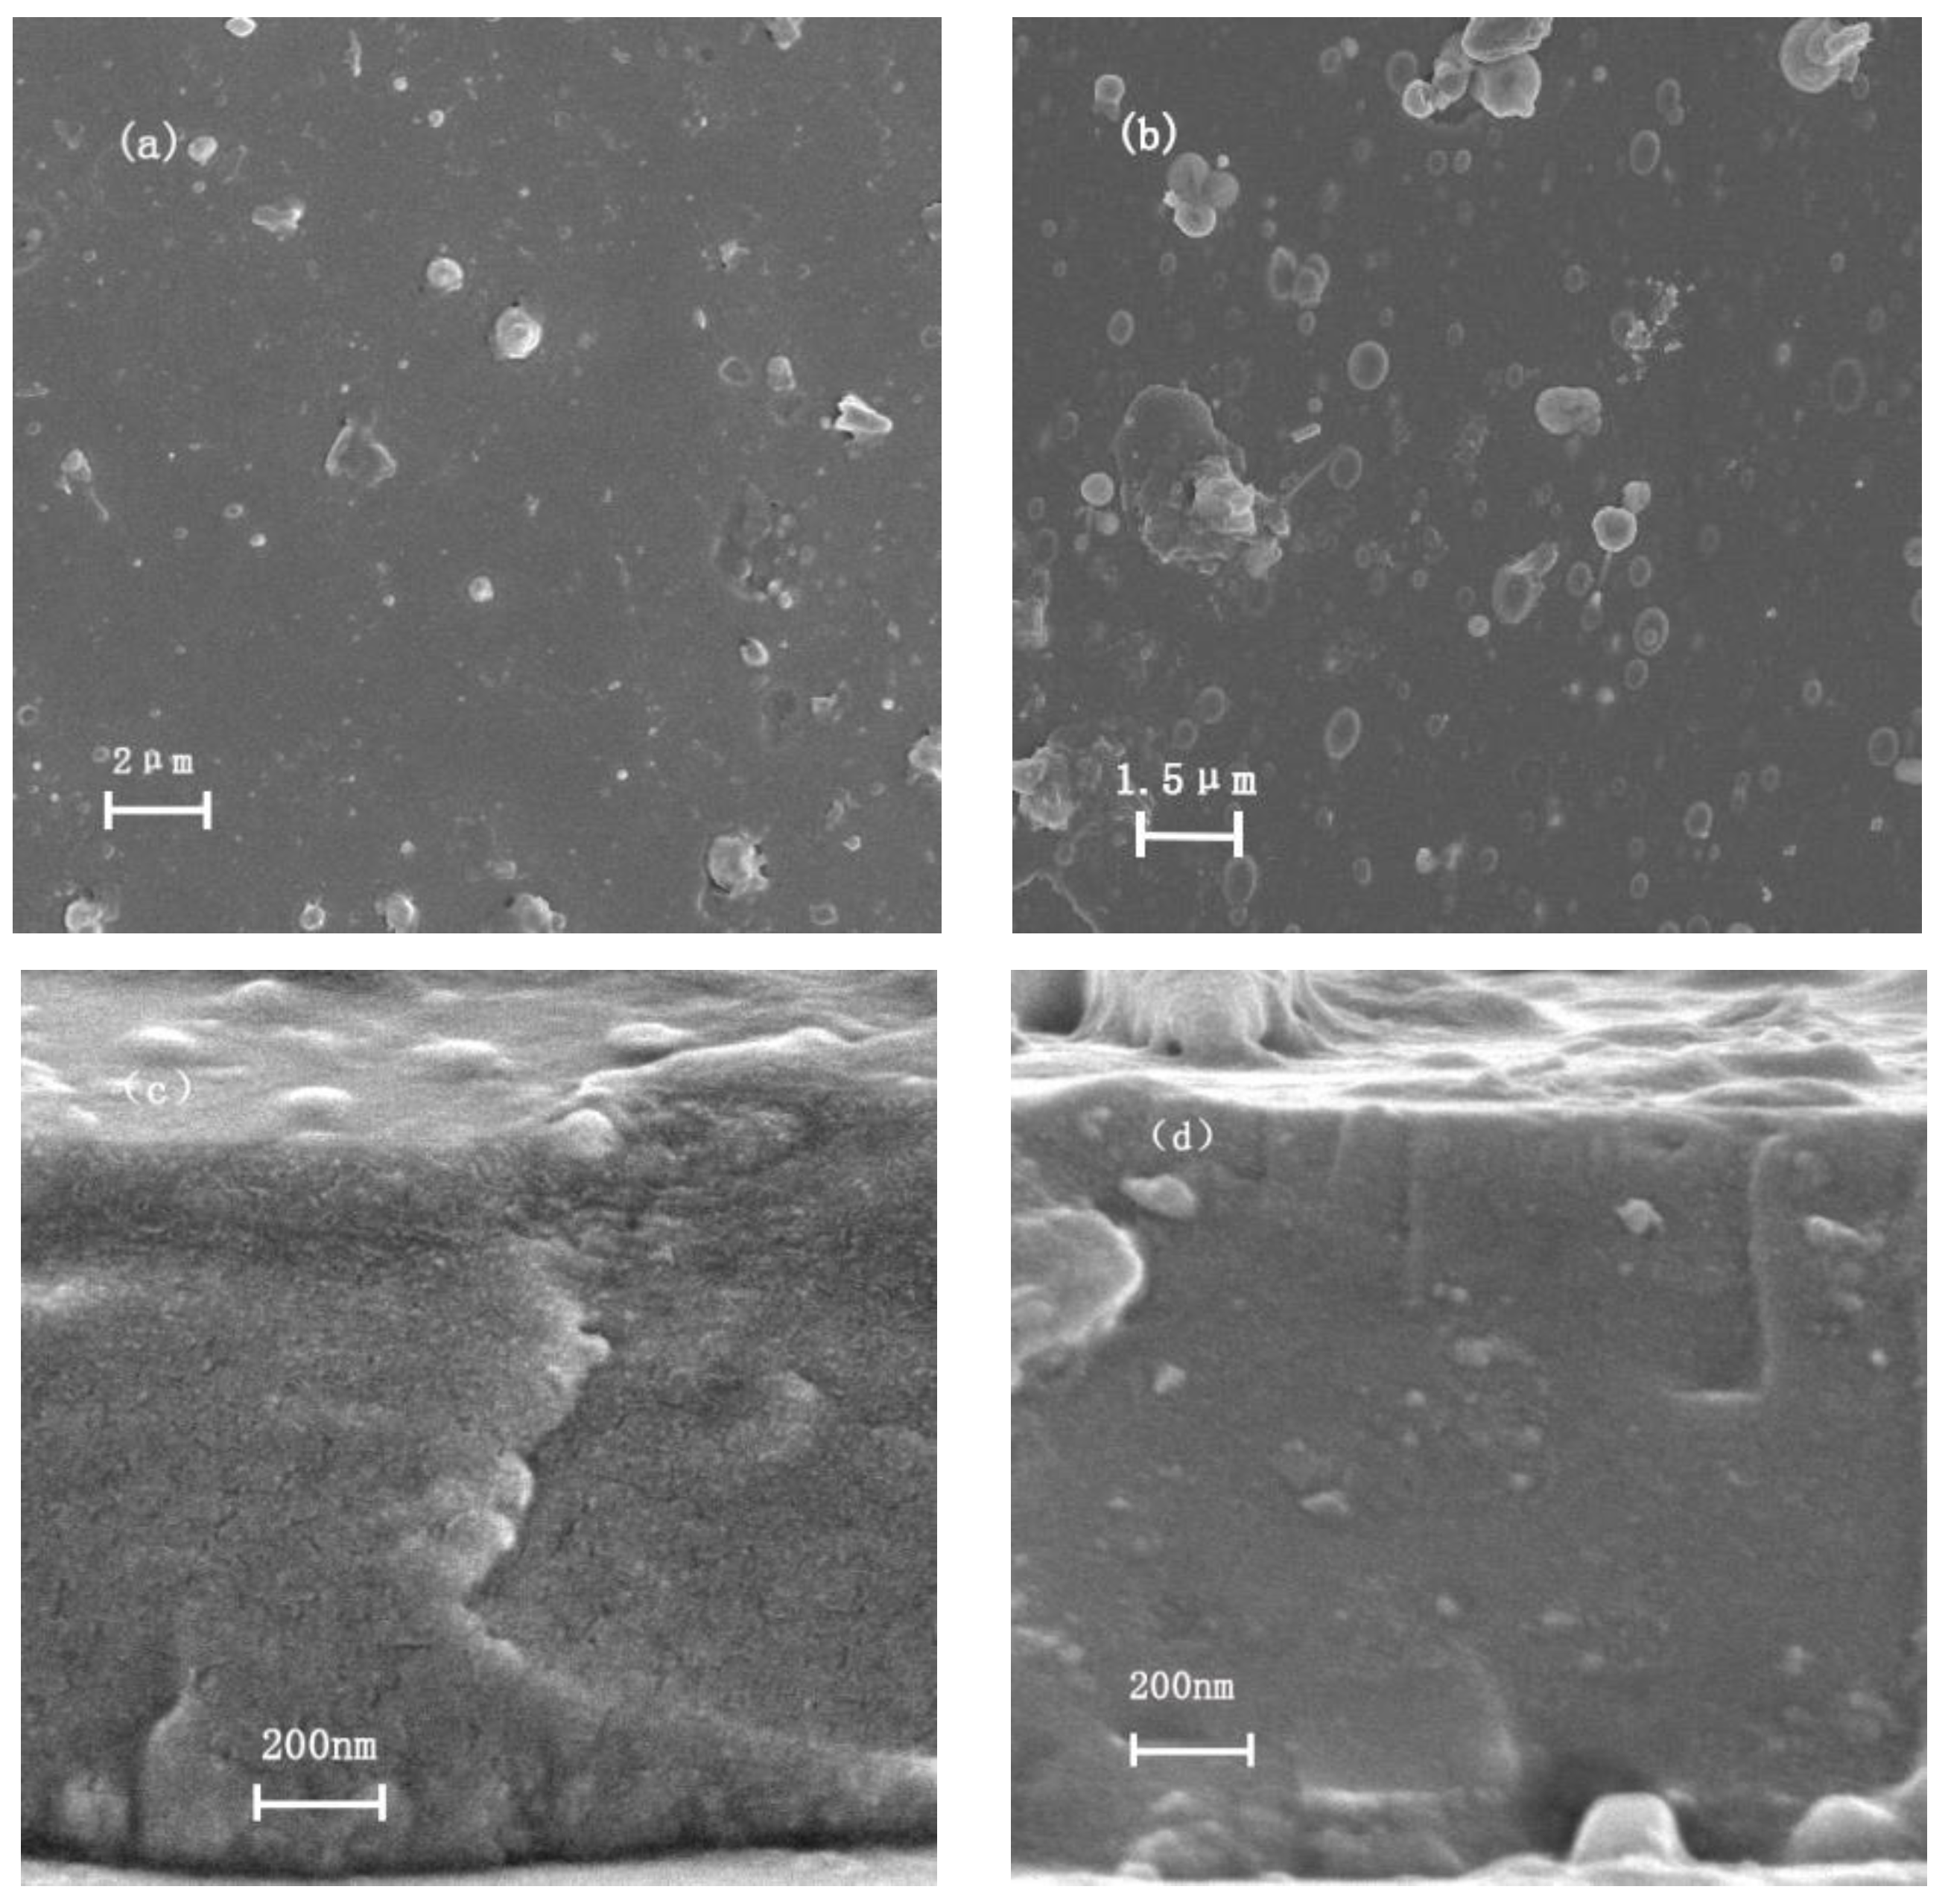
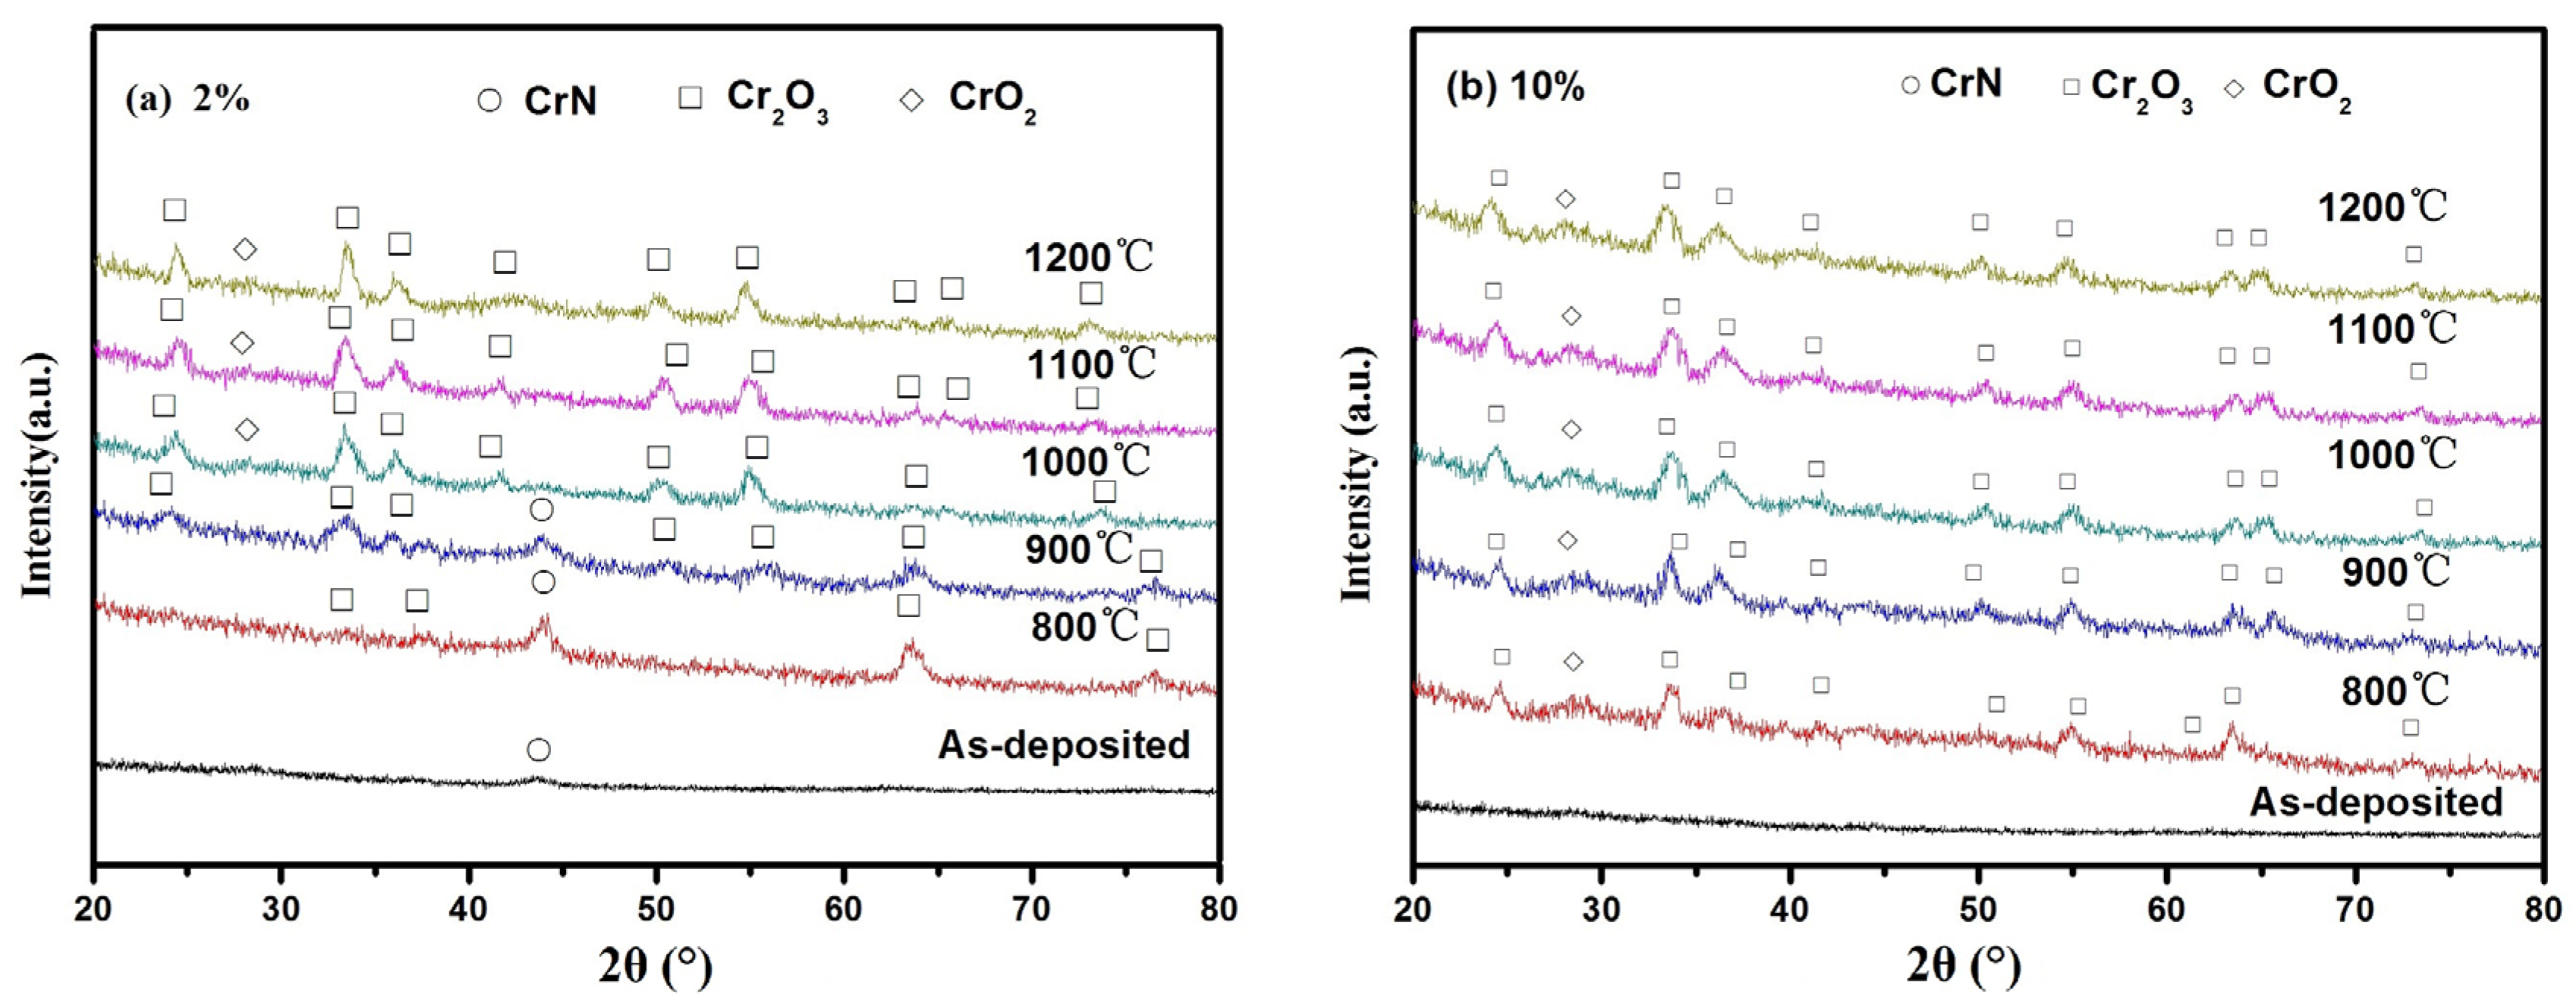
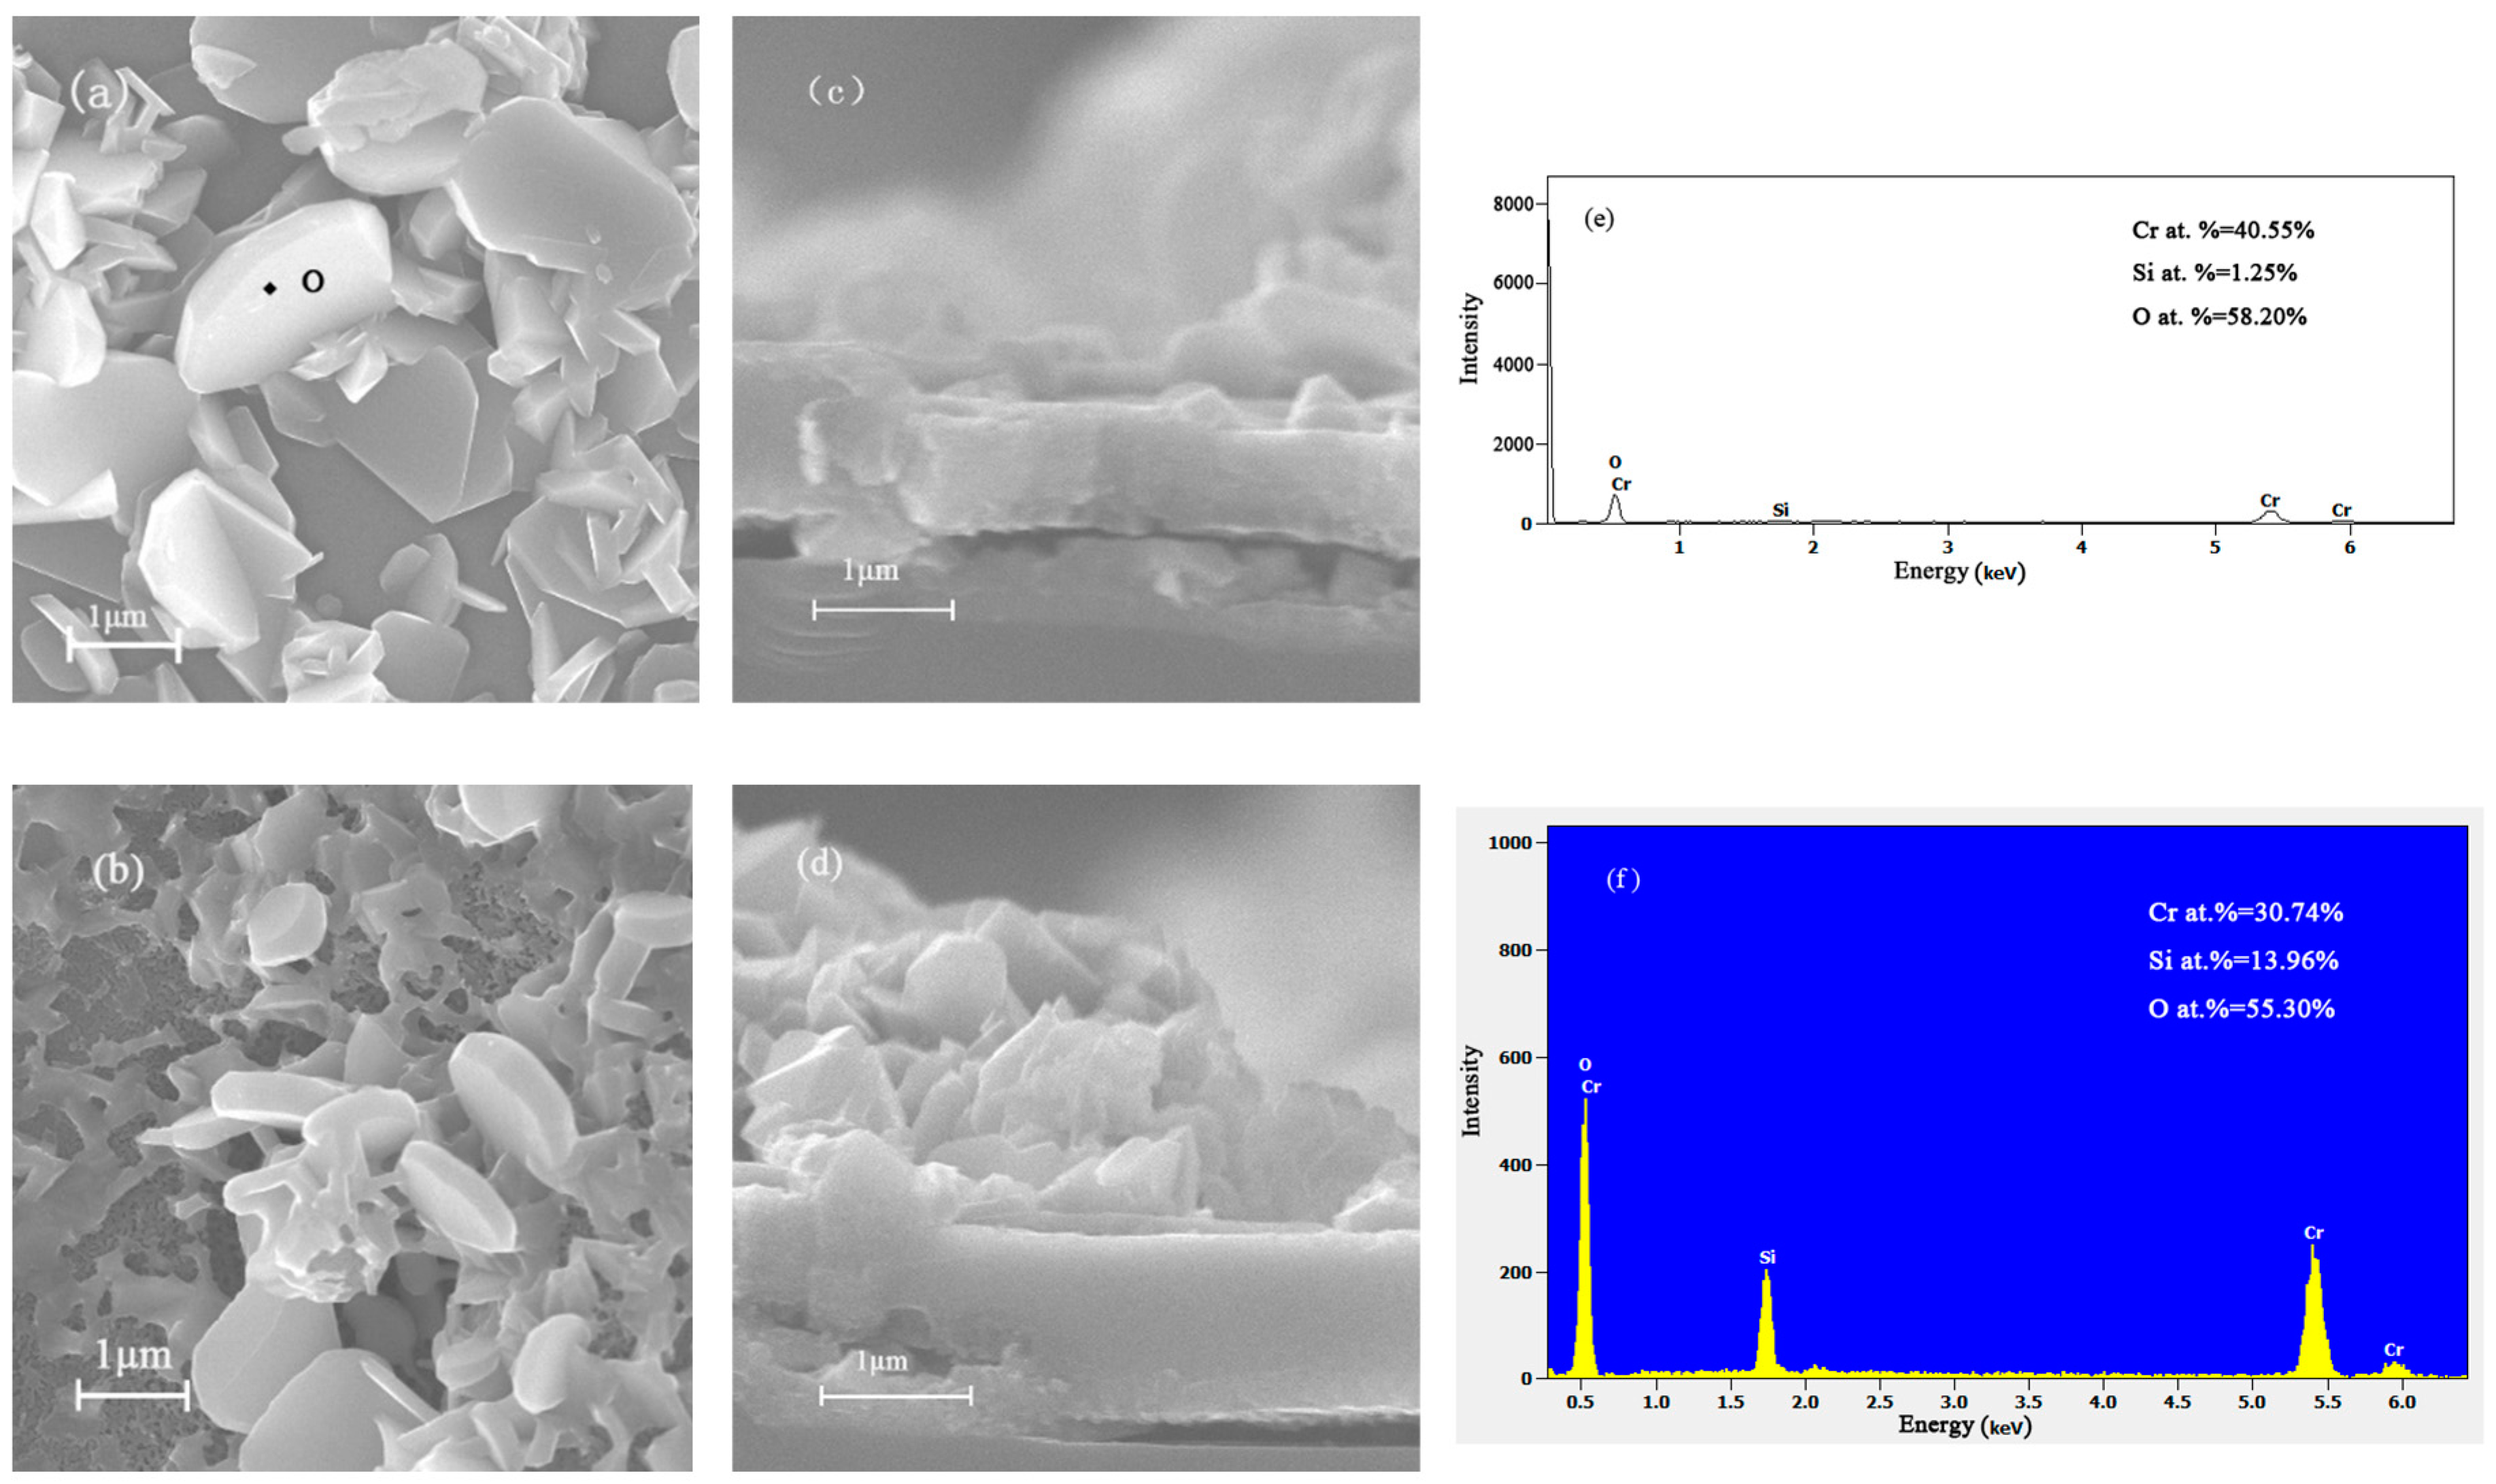
3.1. Composition and Microstructure

Figure 1 shows the chemical composition of the Cr–Si–O–N coatings with different flux rates of O2/(N2 + O2). Since the current of the CrSi target was fixed at 70 A during all of the deposition processes, the Cr and Si contents of the as-deposited coatings were almost constant, being about 51 at.% and 9 at.%, respectively. The oxygen contents of the deposited coatings significantly increased from 0 to 40 at.% and the N contents sharply decreased from 31.5 at.% to 5 at.% when the O2/(N2 + O2) flux rate increased from 0% to 10%. The Gibbs free energy of Cr–O is lower than that of Cr–N [15], so the residual oxygen is more likely to remain in the coatings in the form of CrxOy. However, both the O and N contents remained the same with the further increase of the O2/(N2 + O2) flux rate, which might result from the saturation of the O2 in the chamber.
Figure 2 shows the XRD spectra of Cr–Si–O–N coatings as a function of O2/(N2 + O2) flux rate. It can be seen that only the diffraction peaks of CrN (111) and CrN (200) were detected for the Cr–Si–N coatings. However, with the addition of oxygen, the diffraction peaks became weaker and the diffraction peaks of crystalline phase were no longer recognizable when the O2/(N2 + O2) flux rate above 10%. The more oxygen in the chamber, the more Cr from the CrN was despoiled to form the CrxOy. Unlike the results from other researchers [13], the formed CrxOy in our as-deposited coatings existed in the amorphous phase, which is because the deposition temperature in our system is not high enough to form the crystalline phase. In addition, no crystalline peaks of Si3N4 and SiO2 were detected in the XRD spectra, which can also be attributed to the low temperature deposition process.
Figure 3 presents the Si 2p and N 1s spectra of Cr–Si–O–N coatings deposited under the O2/(N2 + O2) flux rate of 2% and 20%. The binding energy of Si for both coatings appeared at 101.5 eV (Figure 3a), which is in good agreement with that of Si3N4 phase [14]. In addition, little peaks of SiO2 phase appeared at 102.9 eV [13]. In the N 1s spectra, we can find peaks at 396.7 and 397.9 eV, which correspond to CrN [16] and Si3N4 [17], respectively, in the coating with lower O2/(N2 + O2) flux rate. However, when the flux rate increased to 20%, the peak corresponding to CrN disappeared, indicating that there was no crystalline CrN phase existing in the coatings anymore, and the left N in the coatings was all in the amorphous form of Si3N4. This also implied that crystal phase of CrN was present at lower O2/(N2 + O2) flux rate in accordance with XRD results.
The surface and cross-sections SEM images of Cr–Si–O–N coatings deposited under different O2/(N2 + O2) flux rates are shown in Figure 4. Many micro-particles can be seen on the surface of both coatings, which were introduced by the multi-arc ion plating during experiments [18].

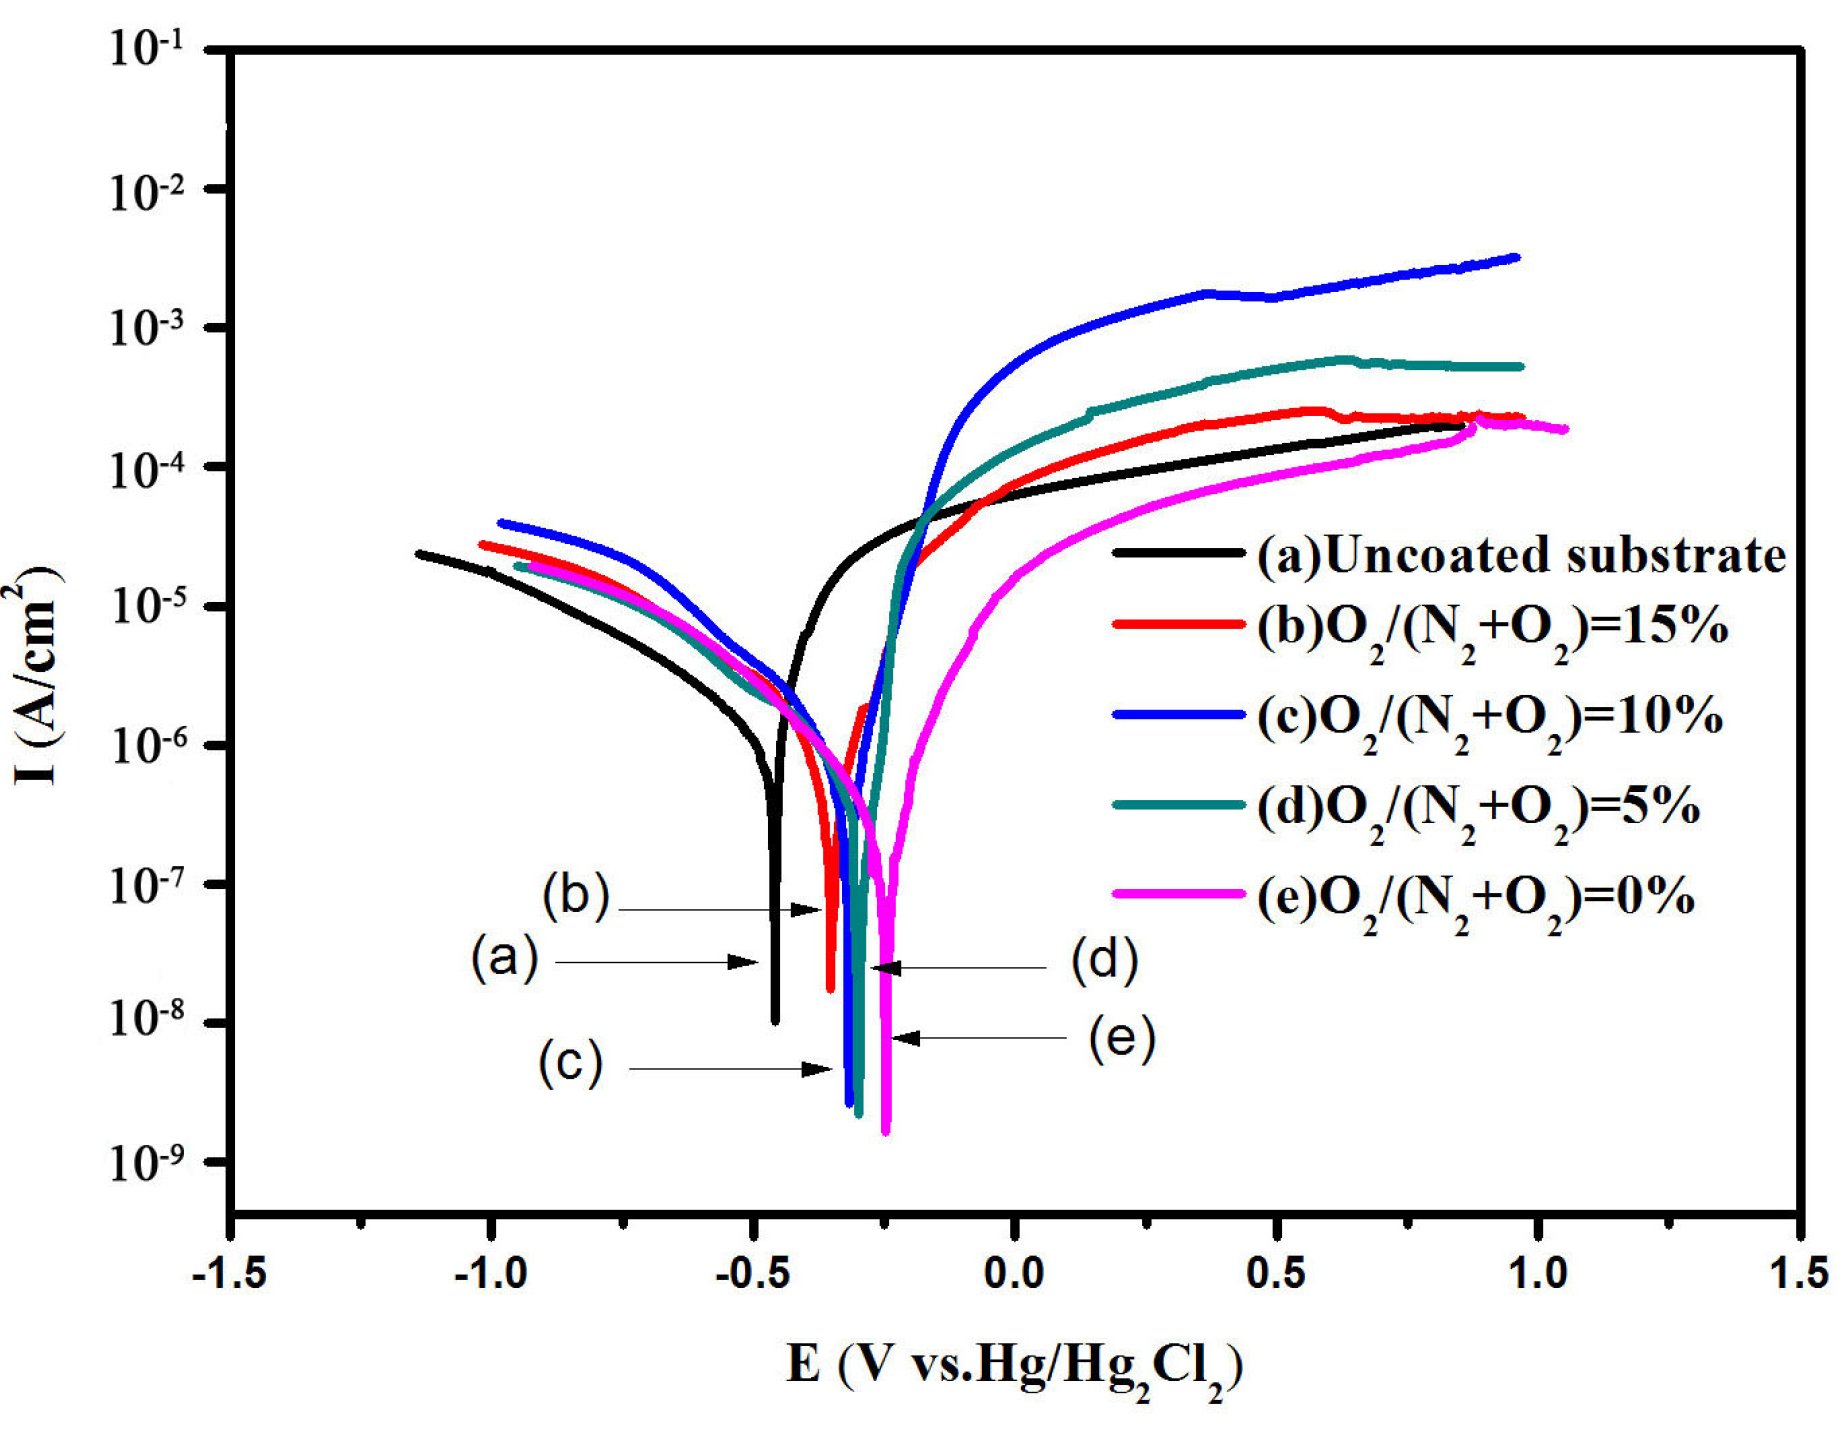
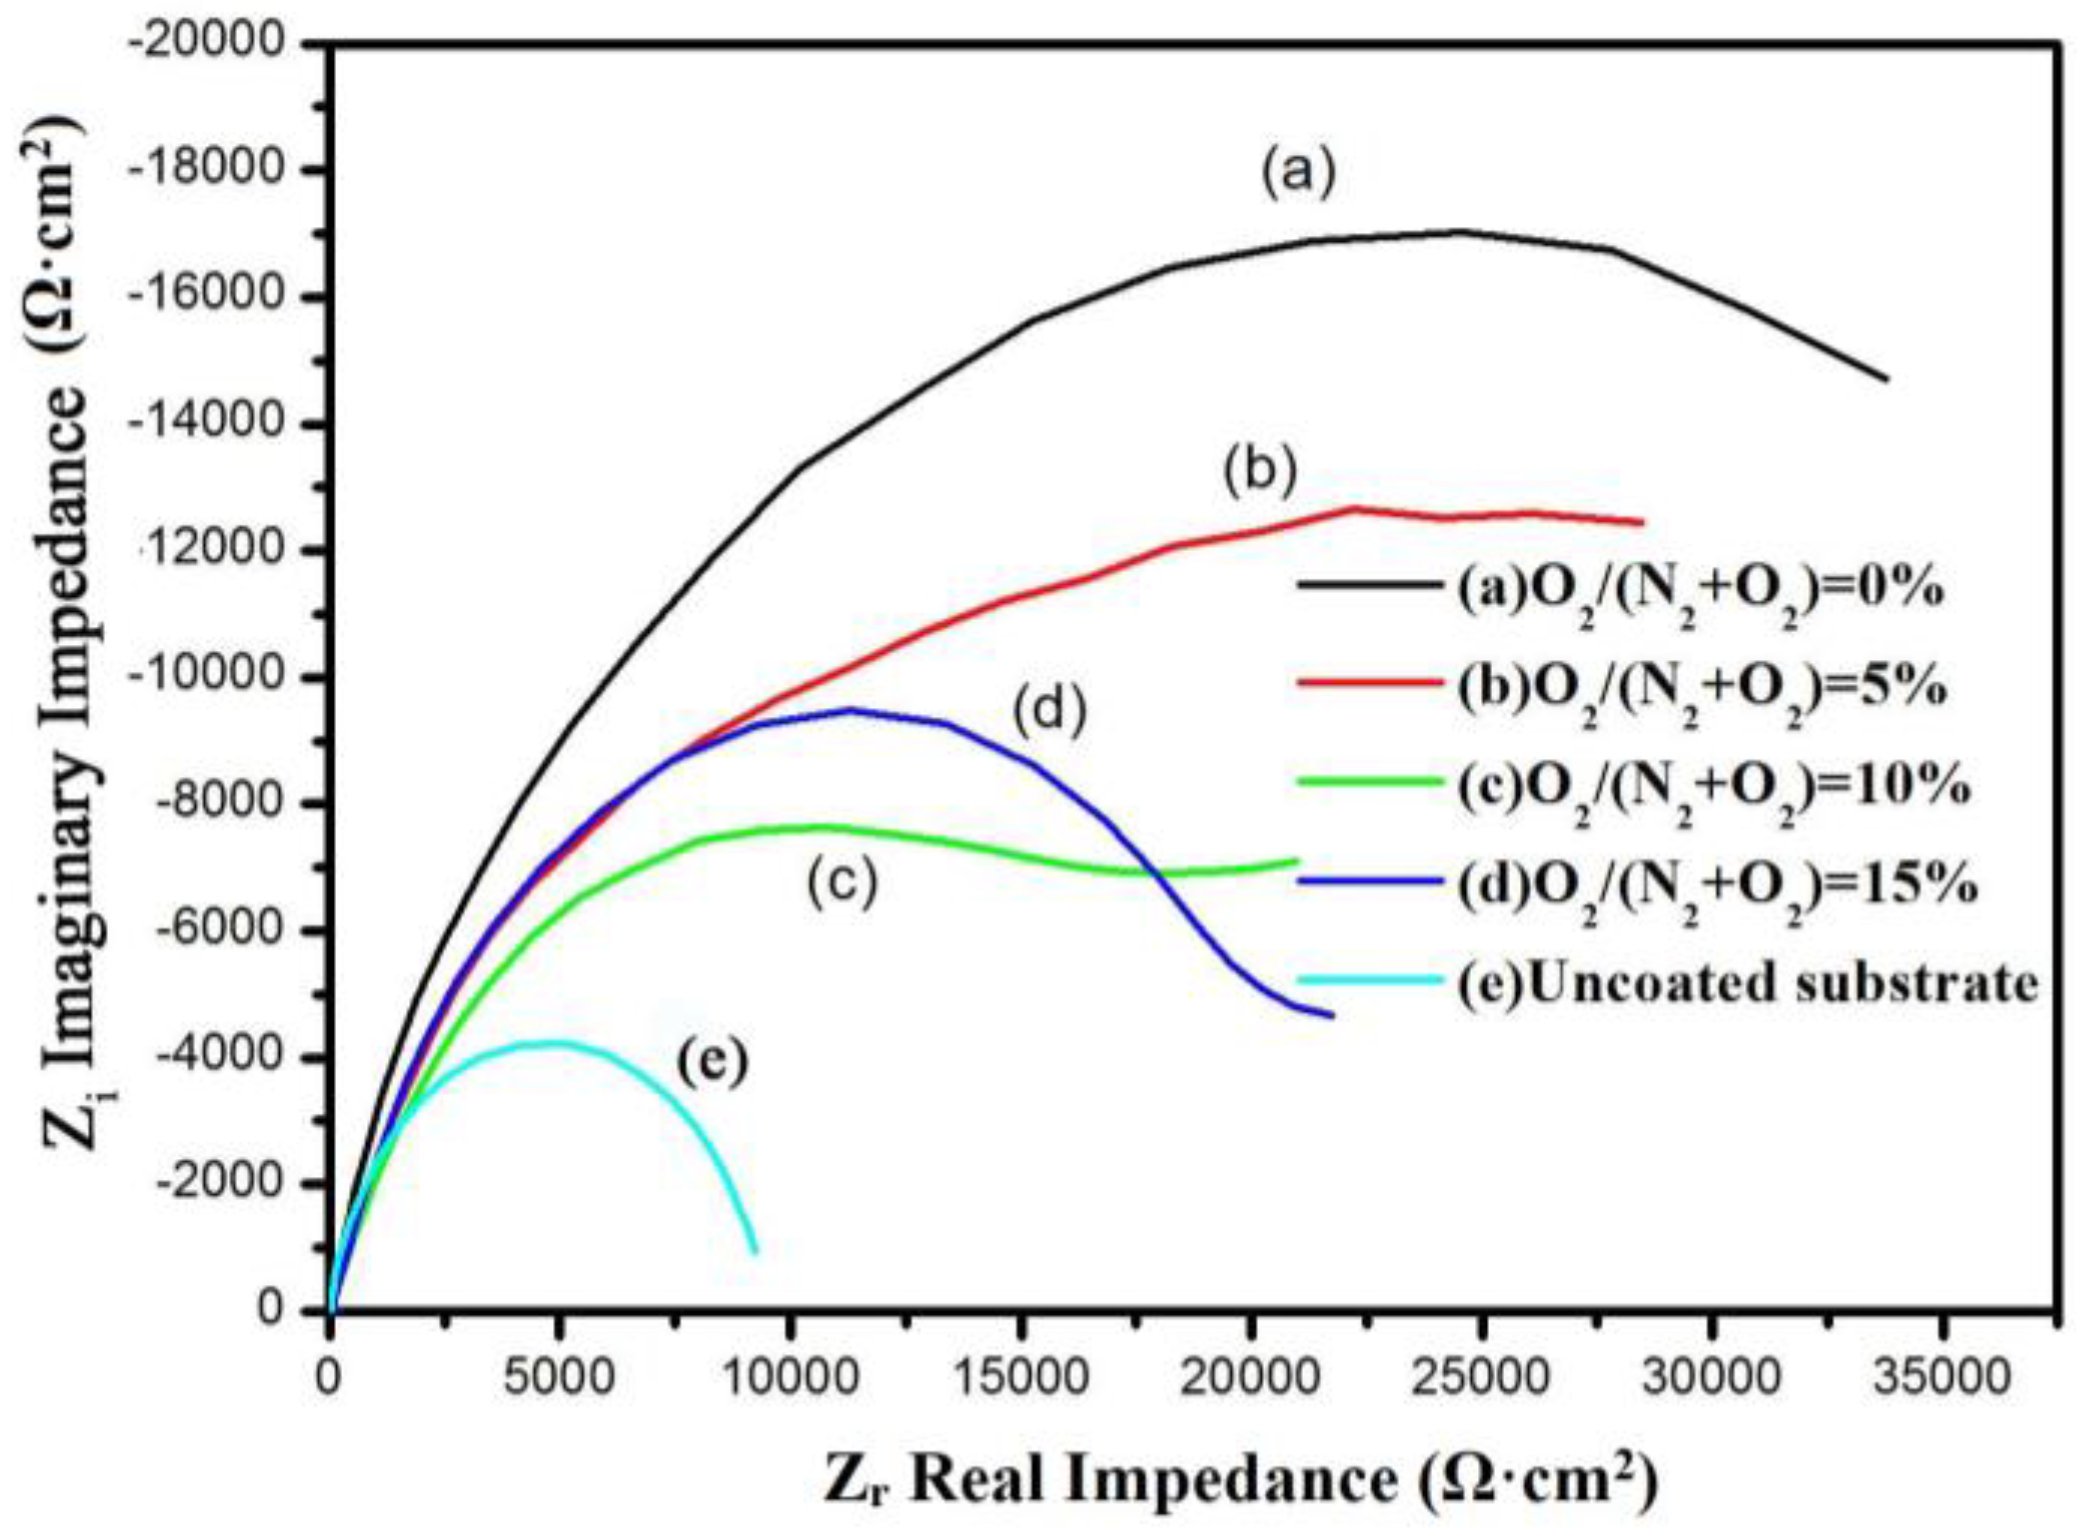
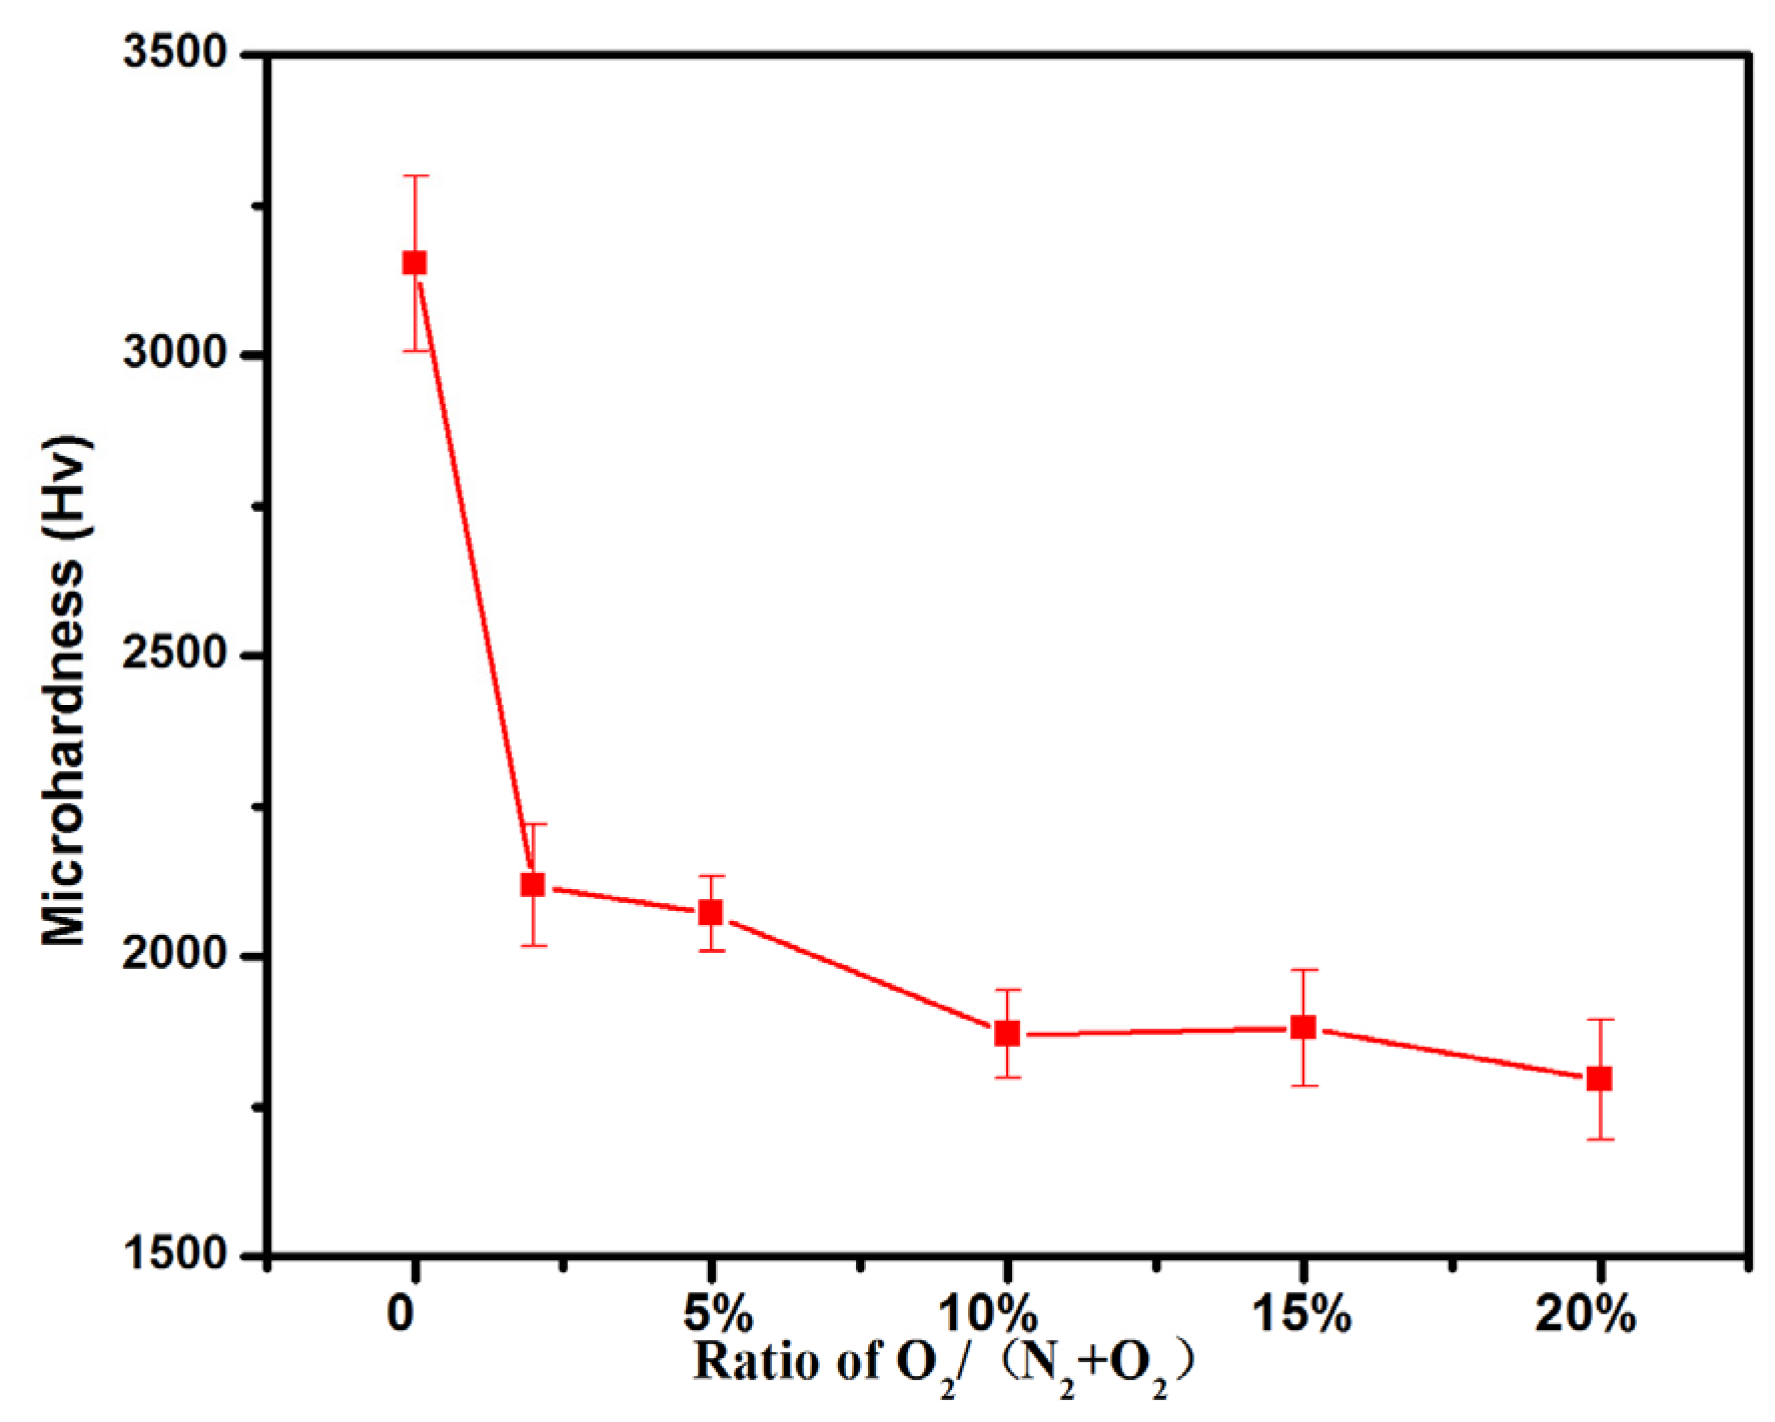
3.2. Microhardness, High Temperature Test and Corrosion Test

Figure 5 shows the hardness value of Cr–Si–O–N coating as a function of O2/(N2 + O2) flux rate. It can be found clearly that the hardness sharply decreased with the addition of the oxygen from 0 to 2 at.% and slightly decreased with the further increase of the oxygen above 5 at.%. The hardness value of cemented carbide substrate is about 1260 Hv0.05, and the hardness of all the Cr–Si–O–N coatings is ranging around 2000 Hv0.05 which is far less than the Cr–Si–N coatings. This phenomenon might be attributed to the formation of a large proportion of the CrxOy amorphous phase in the as-deposited coatings which disrupted the formation of the nanocomposite structure of amorphous matrix and crystalline [19].
The Cr–Si–O–N coatings deposited under O2/(N2 + O2) flux rate of 2% and 10% were chosen to do the high-temperature oxidation treatments. The XRD spectra of the coatings before and after oxidation under 800 °C and 1200 °C in the air were shown in Figure 6. After the coatings were annealed under 800 °C in the air for 2 h, some diffraction patterns of Cr2O3 and CrO2 were detected in both coatings, which suggested that small extent of oxidation behavior might occur on the surface. The number of oxide diffraction patterns in the coatings with lower oxygen was much less than that in the higher one, indicating that the high-temperature oxidation ability of the former might be better. As the oxidation temperature rose to 1200 °C, the diffraction peaks, corresponding to Cr2O3 and CrO2, became stronger, and their number increased, indicating that the oxidation progressed. The crystalline Cr2O3 and CrO2 appear due to oxidation of the coatings and crystallisation of amorphous CrxOy phase during annealing. Owing to SiO2 presents in terms of amorphous [20], it was noted that no diffraction pattern of SiO2 was detected in all the XRD spectra. Meanwhile, Kim et al. proposed that the crystal CrN phase of Cr–Si–N coatings did not disappear thoroughly and maintained good oxidation resistance even the annealing temperature up to 1000 °C [21], which implied that CrN phase included in the coatings was reasonable, as shown in Figure 6a.
The SEM images of the coatings after oxidation are illustrated in Figure 7. There are some chromium oxide crystallites (confirmed by EDS test) covering the surface of the coatings and those oxide crystallites may derive from the outward diffusion of the chromium. The higher the temperature is, the more oxide crystallites there are. The cross-sectional images in Figure 8 show that both of the coatings deposited under O2/(N2 + O2) flux rate of 2% and 10% keep intact after the 800 °C oxidation. However, after the higher temperature oxidation, the destruction occurred. It can be observed clearly that the extent of oxidation destruction are severer in the coatings with higher oxygen content and the coatings tend to be peel off from the substrate. The strong detriment of the high-temperature oxidation resistance of the as-deposited coatings may attribute to the lack of the nanocomposite structure [10,22,23]. Figure 8 shows the SEM images and EDS spectra of Cr–Si–O–N coatings with the oxygen flow ratio of 2% and 10% after annealing. Although a large nubmer of fluffy macroparticles that were chromium oxide detected by EDS spectra were present on the surface of the samples, Figure 8c,f still showed that the coatings have not been damaged completely. Figure 8f also confirmed that the concentration of Si was not large. In other words, the coatings can resist to destruction at 1100 °C. The cross-sectional chemical compositions of the coatings deposited under both the oxygen contents after annealing at 800, 1100 and 1200 °C have been recited in Table 2. It was obvious that the Cr contents reduced, Si and O contents increased when annealing temperature ranged from 800 to 1200 °C, and N contents calculated by subtracting the sum of Cr, Si and O contents from 100% had a decreasing trendency. This revealed that the CrN phase degraded as the annealing temperature rose, which can be in agreement with XRD results.
The electrochemical behavior of corrosion resistance of the deposited Cr–Si–O–N films and cemented carbide substrate was tested by Electrochemical Working Station (CS350) in 3.5% NaCl solution under free air condition at room temperature. The Tafel plots of the base cemented carbide substrate and Cr–Si–O–N coatings with different oxygen contents are shown in Figure 9. The results such as corrosion potential, corrosion current, and polarization resistance fitted from the Tafel plots are listed in Table 3. It can be found that the corrosion potential (Ecorr) of uncoated cemented carbide substrate is about −0.4650 V and the Ecorr of the coated samples shows a shift towards cathodic side compared to the substrate. Moreover, the corrosion current (Icorr) is decreased while the polarization resistance (Rp) is increased with the oxygen content increasing, which indicates the better corrosion resistance of the coated samples. However, the Cr–Si–N coatings have better corrosion rate than that of the Cr–Si–O–N coatings. The Nyquist plots can also be used to evaluate the corrosion resistance performance of the coatings, and the results are shown in Figure 10.
The equivalent circuit for substrate is shown in Figure 11A, and the proposed equivalent circuit for Cr–Si–O–N coatings on the WC–Co cemented carbide substrate with defects (large particles and pinholes) is shown in Figure 11B [24]. Here, Rs is the solution resistance, CPEc represents the constant phase element related to the coatings, CPEdl represents the constant phase element of the electrical double layer, WE is the working electrode, and Rc is the coating resistance [25]. Table 4 shows the fitting results of the equivalent electrical circuit of Figure 11. The fit errors of the values presented in the table are less than 10%. From the table, it can be seen that the Rct which is the charge transfer resistance decreased from 50.15 to 23.48 kΩ·cm2 with the increasing of oxygen contents, which also provides the evidence that the Cr–Si–N coatings have better corrosion resistance than that of Cr–Si–O–N coatings.

4. Conclusions

Cr–Si–O–N coatings with different oxygen contents were deposited by multi-arc ion plating. The oxygen contents of the deposited coatings significantly increased from 0 to 40 at.% and the N contents sharply decreased from 31.5 to 5 at.% when the O2/(N2 + O2) flux rate increased from 0% to 10%. With the addition of oxygen, the diffraction peaks of CrN (111) and CrN (200) became weaker and the diffraction peaks of CrN phases were no longer recognizable when the O2/(N2 + O2) flux rate above 10%. The Cr–Si–O–N coatings remained stable after annealed at 800 °C in the air for 2 h but break appeared in the inner structure after annealing at 1200 °C. The XRD, SEM and electrochemical corrosion resistance results showed that the Cr–Si–N coatings have better oxidation and corrosion resistance properties than that of Cr–Si–O–N coatings with various oxygen contents.

Acknowledgments

This work was supported by the Natural Science Foundation of Guangdong Province (No. 2014A030307008, 2016A030313670), Project for training high-level talents of “Yangfan Plan” in Guangdong Province, Innovation project of universities in Guangdong Province (2015KTSCX086) and Natural Science Foundation of Lingnan Normal University (LZL1506, QL1512, and ZL1503).

Author Contributions

Jinjue Liang and Changwei Zou conceived and designed the experiments; Jinjue Liang and Shimin Chen performed the experiments; Jinjue Liang; Zesong Wang; Canxin Tian; Changwei Zou and Shijun Liao and analyzed the data; Jinjue Liang and Changwei Zou wrote the paper.

Conflicts of Interest

The authors declare no conflict of interest.

References

  1. Creus, J.; Idrissi, H.; Mazille, H.; Sanchette, F.; Jacquot, P. Improvement of the corrosion resistance of CrN coated steel by an interlayer. Surf. Coat. Technol. 1998, 107, 183–190. [Google Scholar] [CrossRef]
  2. Mercs, D.; Bonasso, N.; Naamane, S.; Bordes, J.-M.; Coddet, C. Mechanical and tribological properties of Cr-N and Cr–Si–N coatings reactively sputter deposited. Surf. Coat. Technol. 2005, 200, 403–407. [Google Scholar] [CrossRef]
  3. Chen, H.-Y.; Lu, F.-H. Oxidation behavior of chromium nitride films. Thin Solid Films 2006, 515, 2179–2184. [Google Scholar] [CrossRef]
  4. Navinšek, B.; Panjan, P.; Milošev, I. Industrial applications of CrN (PVD) coatings, deposited at high and low temperatures. Surf. Coat. Technol. 1997, 97, 182–191. [Google Scholar] [CrossRef]
  5. Veprek, S.; Veprek-Heijman, M.G.J.; Karvankova, P.; Prochazka, J. Different approaches to superhard coatings and nanocomposites. Thin Solid Films 2005, 476, 1–29. [Google Scholar] [CrossRef]
  6. Veprek, S.; Mannling, H.D.; Niederhofer, A.; Ma, D.; Mukherjee, S. Degradation of superhard nanocomposites by built-in impurities. J. Vac. Sci. Technol. 2004, 22, L5–L9. [Google Scholar] [CrossRef]
  7. Veprek, S.; Veprek-Heijman, M.G.J. Limits to the preparation of superhard nanocomposites: Impurities, deposition and annealing temperature. Thin Solid Films 2012, 522, 274–282. [Google Scholar] [CrossRef]
  8. Veprek, S.; Mannling, H.D.; Karvankova, P.; Prochazka, J. The issue of the reproducibility of deposition of superhard nanocomposites with hardness of ≥50 GPa. Surf. Coat. Technol. 2004, 200, 3876–3885. [Google Scholar] [CrossRef]
  9. Camps, I.; Muhl, S.; Camps, E.; Quinones-Galvan, J.G.; Flores, M. Tribological properties of TiSiN thin films deposited by laser ablation. Surf. Coat. Technol. 2014, 255, 74–78. [Google Scholar] [CrossRef]
  10. Xu, Y.; Chen, L.; Liu, Z.; Pei, F.; Du, Y. Improving thermal stability of TiSiN nanocomposite coatings by multilayered epitaxial growth. Surf. Coat. Technol. 2017, 321, 180–185. [Google Scholar] [CrossRef]
  11. Yao, Y.; Li, J.; Wang, Y.; Ye, Y.; Zhu, L. Influence of the negative bias in ion plating on the microstructural and tribological performances of Ti-Si-N coatings in seawater. Surf. Coat. Technol. 2015, 280, 154–162. [Google Scholar] [CrossRef]
  12. Ma, D.; Ma, S.; Xu, K.; Veprek, S. Effecting of oxygen and chlorine on nano-structured TiN/Si3N4 films hardness. Mater. Lett. 2005, 59, 838–841. [Google Scholar]
  13. Lee, J.D.; Wang, Q.M.; Kim, S.-H.; Wang, T.-G.; Shin, D.-W.; Kim, K.H. Microstructure and mechanical properties of quaternary Cr–Si–O–N films by a hybrid coating system. Surf. Coat. Technol. 2012, 206, 3721–3727. [Google Scholar] [CrossRef]
  14. Wang, Q.; Kim, K.H. Microstructural control of Cr–Si–N films by a hybrid arc ion plating and magnetron sputtering process. Acta Mater. 2009, 57, 4974–4987. [Google Scholar] [CrossRef]
  15. Khatibi, A.; Sjolen, J.; Greczynski, G.; Jensen, J.; Eklund, P.; Hultman, L. Structural and mechanical properties of Cr-Al-O-N thin films grown by cathodic arc deposition. Acta Mater. 2012, 60, 6494–6507. [Google Scholar] [CrossRef]
  16. Lee, H.Y.; Jung, W.S.; Han, J.G.; Seo, S.M.; Kim, J.H.; Bae, Y.H. The synthesis of CrSiN film deposited using magnetron sputtering system. Surf. Coat. Technol. 2005, 200, 1026–1030. [Google Scholar] [CrossRef]
  17. Ingo, G.M.; Zacchetti, N. XPS investigation on the growth model of a-SiNx and silicon and nitrogen chemical bondings. High Temp. Sci. 1988, 28, 137–151. [Google Scholar]
  18. Wang, L.; Zhang, S.; Chen, Z.; Li, J.; Li, M. Influence of deposition parameters on hard Cr–Al–N coatings deposited by multi-arc ion plating. Appl. Surf. Sci. 2012, 258, 3629–3636. [Google Scholar] [CrossRef]
  19. Vepřek, S. Conventional and new approaches towards the design of novel superhard materials. Surf. Coat. Technol. 1997, 97, 15–22. [Google Scholar] [CrossRef]
  20. Dong, B.L.; Nguyen, T.D.; Sun, K.K. Air-oxidation of nano-multilayered CrAlSiN thin films between 800 and 1000 °C. J. Nanosci. Nanothchno. 2009, 203, 1199–1204. [Google Scholar]
  21. Kim, J.W.; Kim, K.H.; Lee, D.B.; Moore, J.J. Study on high-temperature oxidation behaviors of Cr–Si–N films. Surf. Coat. Technol. 2006, 200, 6702–6705. [Google Scholar] [CrossRef]
  22. Pshyk, A.V.; Coy, L.E.; Nowaczyk, G.; Kempiński, M.; Peplińska, B.; Pogrebnjak, A.D.; Beresnev, V.M.; Jurga, S. High temperature behavior of functional TiAlBSiN nanocomposite coatings. Surf. Coat. Technol. 2016, 305, 49–60. [Google Scholar] [CrossRef]
  23. Saladukhin, I.A.; Abadias, G.; Uglov, V.V.; Zlotski, S.V.; Michel, A.; van Vuuren, A.J. Thermal stability and oxidation resistance of ZrSiN nanocomposite and ZrN/SiNx multilayered coatings: A comparative study. Surf. Coat. Technol. 2017, 332, 428–439. [Google Scholar] [CrossRef]
  24. Grips, V.K.W.; Barshilia, H.C.; Ezhil Selvi, V.; Kalavati; Rajam, K.S. Electrochemical behavior of single layer CrN, TiN, TiAlN coatings and nanolayered TiAlN/CrN multilayer coatings prepared by reactive direct current magnetron sputtering. Thin Solid Films 2006, 514, 204–211. [Google Scholar]
  25. Zhang, L.J.; Mohammed, E.A.A.; Adriaens, A. Synthesis and electrochemical behavior of a magnesium fluoride-polydopamine-stearic acid composite coating on AZ31 magnesium alloy. Surf. Coat. Technol. 2016, 307, 56–64. [Google Scholar] [CrossRef]
Figure 1. Chemical composition (obtained by EPMA) of Cr–Si–O–N coatings as a function of O2/(N2 + O2) flux rate.
Coatings 08 00019 g001
Figure 2. The XRD spectra of Cr–Si–O–N coatings as a function of O2/(N2 + O2) flux rate.
Coatings 08 00019 g002
Figure 3. The XPS spectra of Cr–Si–O–N coatings deposited under the O2/(N2 + O2) flux rate of 2% and 20%: (a) Si 2p; (b) N 1s.
Coatings 08 00019 g003
Figure 4. The surface and cross-section SEM images of Cr–Si–O–N coatings deposited as a function of O2/(N2 + O2) flux rate: (a,b) surface images, O2/(N2 + O2) = 2%; (c,d) cross-section images, O2/(N2 + O2) = 10%.
Coatings 08 00019 g004
Figure 5. The microhardness values of Cr–Si–O–N coating as a function of O2/(N2 + O2) flux rate.
Coatings 08 00019 g005
Figure 6. The XRD spectra of Cr–Si–O–N coatings deposited under various oxygen contents before and after annealing from 800 to 1200 °C in the air for 2 h: (a) O2/(N2 + O2) = 2%; (b) O2/(N2 + O2) = 10%.
Coatings 08 00019 g006
Figure 7. The cross-sectional images of Cr–Si–O–N coatings after annealing in the air for 2 h: (a) O2/(N2 + O2) = 2%, 800 °C; (b) O2/(N2 + O2) = 2%, 1200 °C; (c) O2/(N2 + O2) = 10%, 800 °C; (d) O2/(N2 + O2) = 10%, 1200 °C.
Coatings 08 00019 g007
Figure 8. The SEM images of Cr–Si–O–N coatings after annealing in the air for 2 h and EDS spectra: (a,c) O2/(N2 + O2) = 2%, 1100 °C; (b,d) O2/(N2 + O2) = 10%, 1100 °C; (e) The EDS spectrum at point “O” in Figure 8a; (f) The EDS spectrum of Figure 8b.
Coatings 08 00019 g008
Figure 9. Potentiodynamic polarization curves of bare steel substrate and Cr–Si–O–N coatings with difference O2/(N2 + O2) flux rate.
Coatings 08 00019 g009
Figure 10. Nyquist plots of bare steel substrate and Cr–Si–O–N coatings with difference O2/(N2 + O2) flux rate.
Coatings 08 00019 g010
Figure 11. (A) Equivalent circuit to fit the electrochemical impedance data of the WC–Co cemented carbide substrate; (B) General Equivalent circuit to fit the electrochemical impedance data of the coated samples.
Coatings 08 00019 g011
Table 1. The parameters for the deposition of Cr–Si–O–N coatings.
Deposition ParametersCr Adhesive LayerCrN Inter LayerCr–Si–O–N
Ar flow rates (sccm)9
N2 flow rates (sccm)6045
O2/(N2 + O2) ratio0–20%
Working pressure (Pa)1.01.01.0
Deposition time (s)3003003000
Cr cathode arc current (A)8080
CrSi cathode arc current (A)70
Negative bias voltage (V)−160−140−100
Table 2. The cross-sectional chemical composition of the coatings after annealing at 800 °C, 1100 °C, 1200 °C.
SamplesCr–Si–O–N (2%)Cr–Si–O–N (10%)
800 °C1100 °C1200 °C800 °C1100 °C1200 °C
Cr39.05%29.70%25.92%34.45%25.01%22.47%
Si9.31%14.05%18.81%13.49%17.23%19.10%
O43.10%54.3%53.84%47.08%56.52%57.33%
N8.54%1.86%1.43%4.98%1.24%1.10%
Table 3. Corrosion potential, corrosion current, polarization resistance and corrosion rate properties got from the Tafel plots.
SamplesEcorr (V)Icorr (μA/cm2)Rp (kΩ·cm2)Corr rate (mm/A)
Substrate−0.46502.6514.9513.46 × 10−3
Cr–Si–N−0.25410.35123.394.02 × 10−3
Cr–Si–O–N (5%)−0.26450.4198.635.94 × 10−3
Cr–Si–O–N (10%)−0.30990.7249.926.25 × 10−3
Cr–Si–O–N (15%)−0.34890.9649.697.01 × 10−3
Table 4. Fitting results of EIS plots in Figure 11.
SamplesRs (Ω·cm2)CPEc-Y0 (μF·cm2)Rc (Ω·cm2)CPEdl-Y0 (μF·cm2)Rct (kΩ·cm2)
Substrate19.1195.559.46
Cr–Si–N19.9125.60257352.3450.15
Cr–Si–O–N (5%)20.2385.61197046.3930.15
Cr–Si–O–N (10%)22.6089.83189862.3322.57
Cr–Si–O–N (15%)20.8287.62185153.0123.48

