
Ammonia Generation via a Graphene-Coated Nickel Catalyst


Center for Electrochemical Engineering Research (CEER), Chemical and Biomolecular Engineering Department, Ohio University, Columbus, OH 43210, USA
*
Author to whom correspondence should be addressed.
Coatings 2017, 7(6), 72; https://doi.org/10.3390/coatings7060072
Submission received: 25 March 2017
/
Revised: 7 May 2017
/
Accepted: 16 May 2017
/
Published: 27 May 2017
(This article belongs to the Special Issue Thin Films and Patterned Structures by Electrochemical Methods)
Abstract
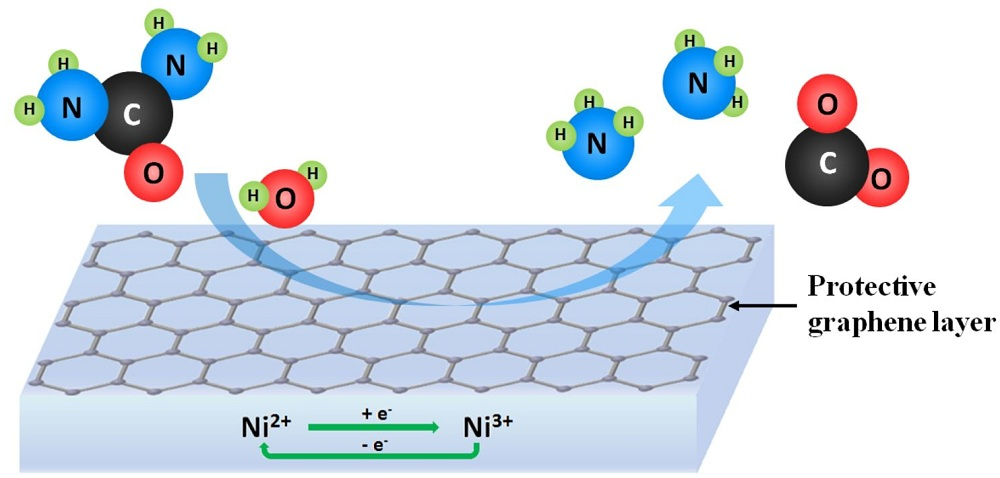
:A novel graphene-coated Ni electrode was developed in this investigation to improve corrosion resistance while unexpectedly enhancing the ammonia generation rate in the electrochemically induced urea to ammonia (eU2A) process, which is an electrochemical onsite ammonia generation method. The development of the electrode is crucial for the eU2A reactions since in the ammonia generation process, the concentration of ammonia is inevitably high on the surface of the electrode, leading to severe corrosion of the electrode and the loss of generated ammonia as well. In this paper, the graphene was derived from raw coal by using the chemical vapor deposition method and self-lifted onto a Ni electrode to form a protective layer for corrosion prevention. Transmission electron microscopy showed the synthesized graphene had few-layers and Raman spectroscopy indicated that the coating of graphene was stable during the eU2A reaction. As a result, the ammonia corrosion of the Ni electrode was dramatically reduced by ~20 times with the graphene coating method. More importantly, a higher ammonia generation rate (~2 times) was achieved using the graphene-coated Ni working electrode compared to a bare Ni electrode in the eU2A process.

1. Introduction
Ammonia is a commonly used reducing agent for selective catalytic reduction of NOx in combustion engines and power generation. Due to safety and environmental concerns, there has been an increased utilization of urea-derived ammonia production [1] based on the chemical hydrolysis of urea at high temperatures. To improve the efficiency of the conversion of urea to ammonia at lower temperatures, Botte proposed a new method that implements nickel based electrodes with the aid of an electric field to convert urea to ammonia [2]. The method is known as the electrochemically induced conversion of urea to ammonia (eU2A, see Equation (1)) and it has been demonstrated to be an effective on-site method for ammonia generation from urea [2,3]
For example, in the eU2A process, by applying a constant potential at 70 °C, urea is converted to ammonia at a higher rate than homogeneous urea hydrolysis at ambient pressure and low temperature [3]. However, the supporting electrolyte, potassium hydroxide (KOH) [3], is neutralized to K2CO3 by CO2 released from urea in the eU2A process. During the reaction, the electrolyte in the eU2A reactor becomes bluish due to the corrosion of the Ni electrode from the formation of the nickel-ammonia complex ion. In addition, part of the ammonia produced reacts with the Ni ions in the electrolyte to form the complex, which causes the decrease of ammonia gas evolution/production in the eU2A process with time.
Graphene is a single atomic monolayer of graphite with excellent thermal and mechanical properties such as incomparable high electron mobility, large specific surface area, and exceptional chemical stability [4,5,6]. Coating with graphene has been proven to be an effective anti-corrosion method for protecting the metals’ surface without altering the intrinsic properties of the protected metals [7,8]. Prasai et al. found that multi-layer graphene coated Ni corroded 20 times less than bare Ni [9]. Furthermore, it has already been proven that graphene–nickel nanocomposites are promising catalysts for urea electrolysis [10,11]. Reactions such as hydrogen production from water can be induced through the interface of graphene/Ni [12]. Graphene has improved the corrosion resistance of stainless steel [8]. Thus, the use of graphene coating to protect a Ni electrode in the eU2A process using K2CO3 as supporting electrolyte was conceived as a method to reduce the ammonia corrosion of nickel from the electrode, to reduce the consumption of ammonia ligands, and to avoid the need of replacing the electrolyte in the eU2A process. In addition, according to cyclic voltammogram (CV) experiments, the peak current of NiOOH (the effective working catalyst for the eU2A process) using graphene-coated Ni electrodes is higher than bare Ni, thus it enables a higher ammonia generation rate on the electrode [11].
In this paper, a graphene coating method was developed for protecting Ni working electrodes from ammonia corrosion. The graphene film was made by chemical vapor deposition (CVD) and self-lifted on Ni foil. The graphene-coated Ni was used as the working electrode for the eU2A reactions using K2CO3 as the supporting electrolyte. The investigation demonstrates that the corrosion rate of graphene coated Ni electrode, in terms of weight loss of Ni per surface area, is dramatically reduced when compared to a bare Ni electrode. In addition, this Ni catalyst with anti-corrosive graphene coating gives a much higher normalized ammonia generation rate (per geometric area of the electrode) than a bare Ni foil electrode.
2. Experimental Methods
2.1. Preparation of Graphene-Coated Ni Electrode
The Ni foils (purity > 99%, Alfa Aesar, Haverhill, MA, USA, 2.0 cm × 3.0 cm) used for making all the electrodes were first polished with sand paper (600 grit) and then sandblasted with alumina powder (27.5 micron, Crystal Mark, Inc., Glendale, CA, USA) for 2 min. The pretreated Ni foils were spot-wired to Ni wires (diameter 1.0 mm, purity 99.5%, Alfa Aesar) for collecting the current. Low sulfur sub-bituminous coal (Wyodak coal seam) was used as a solid carbon source for growing the graphene film on copper substrate using the CVD method [13].
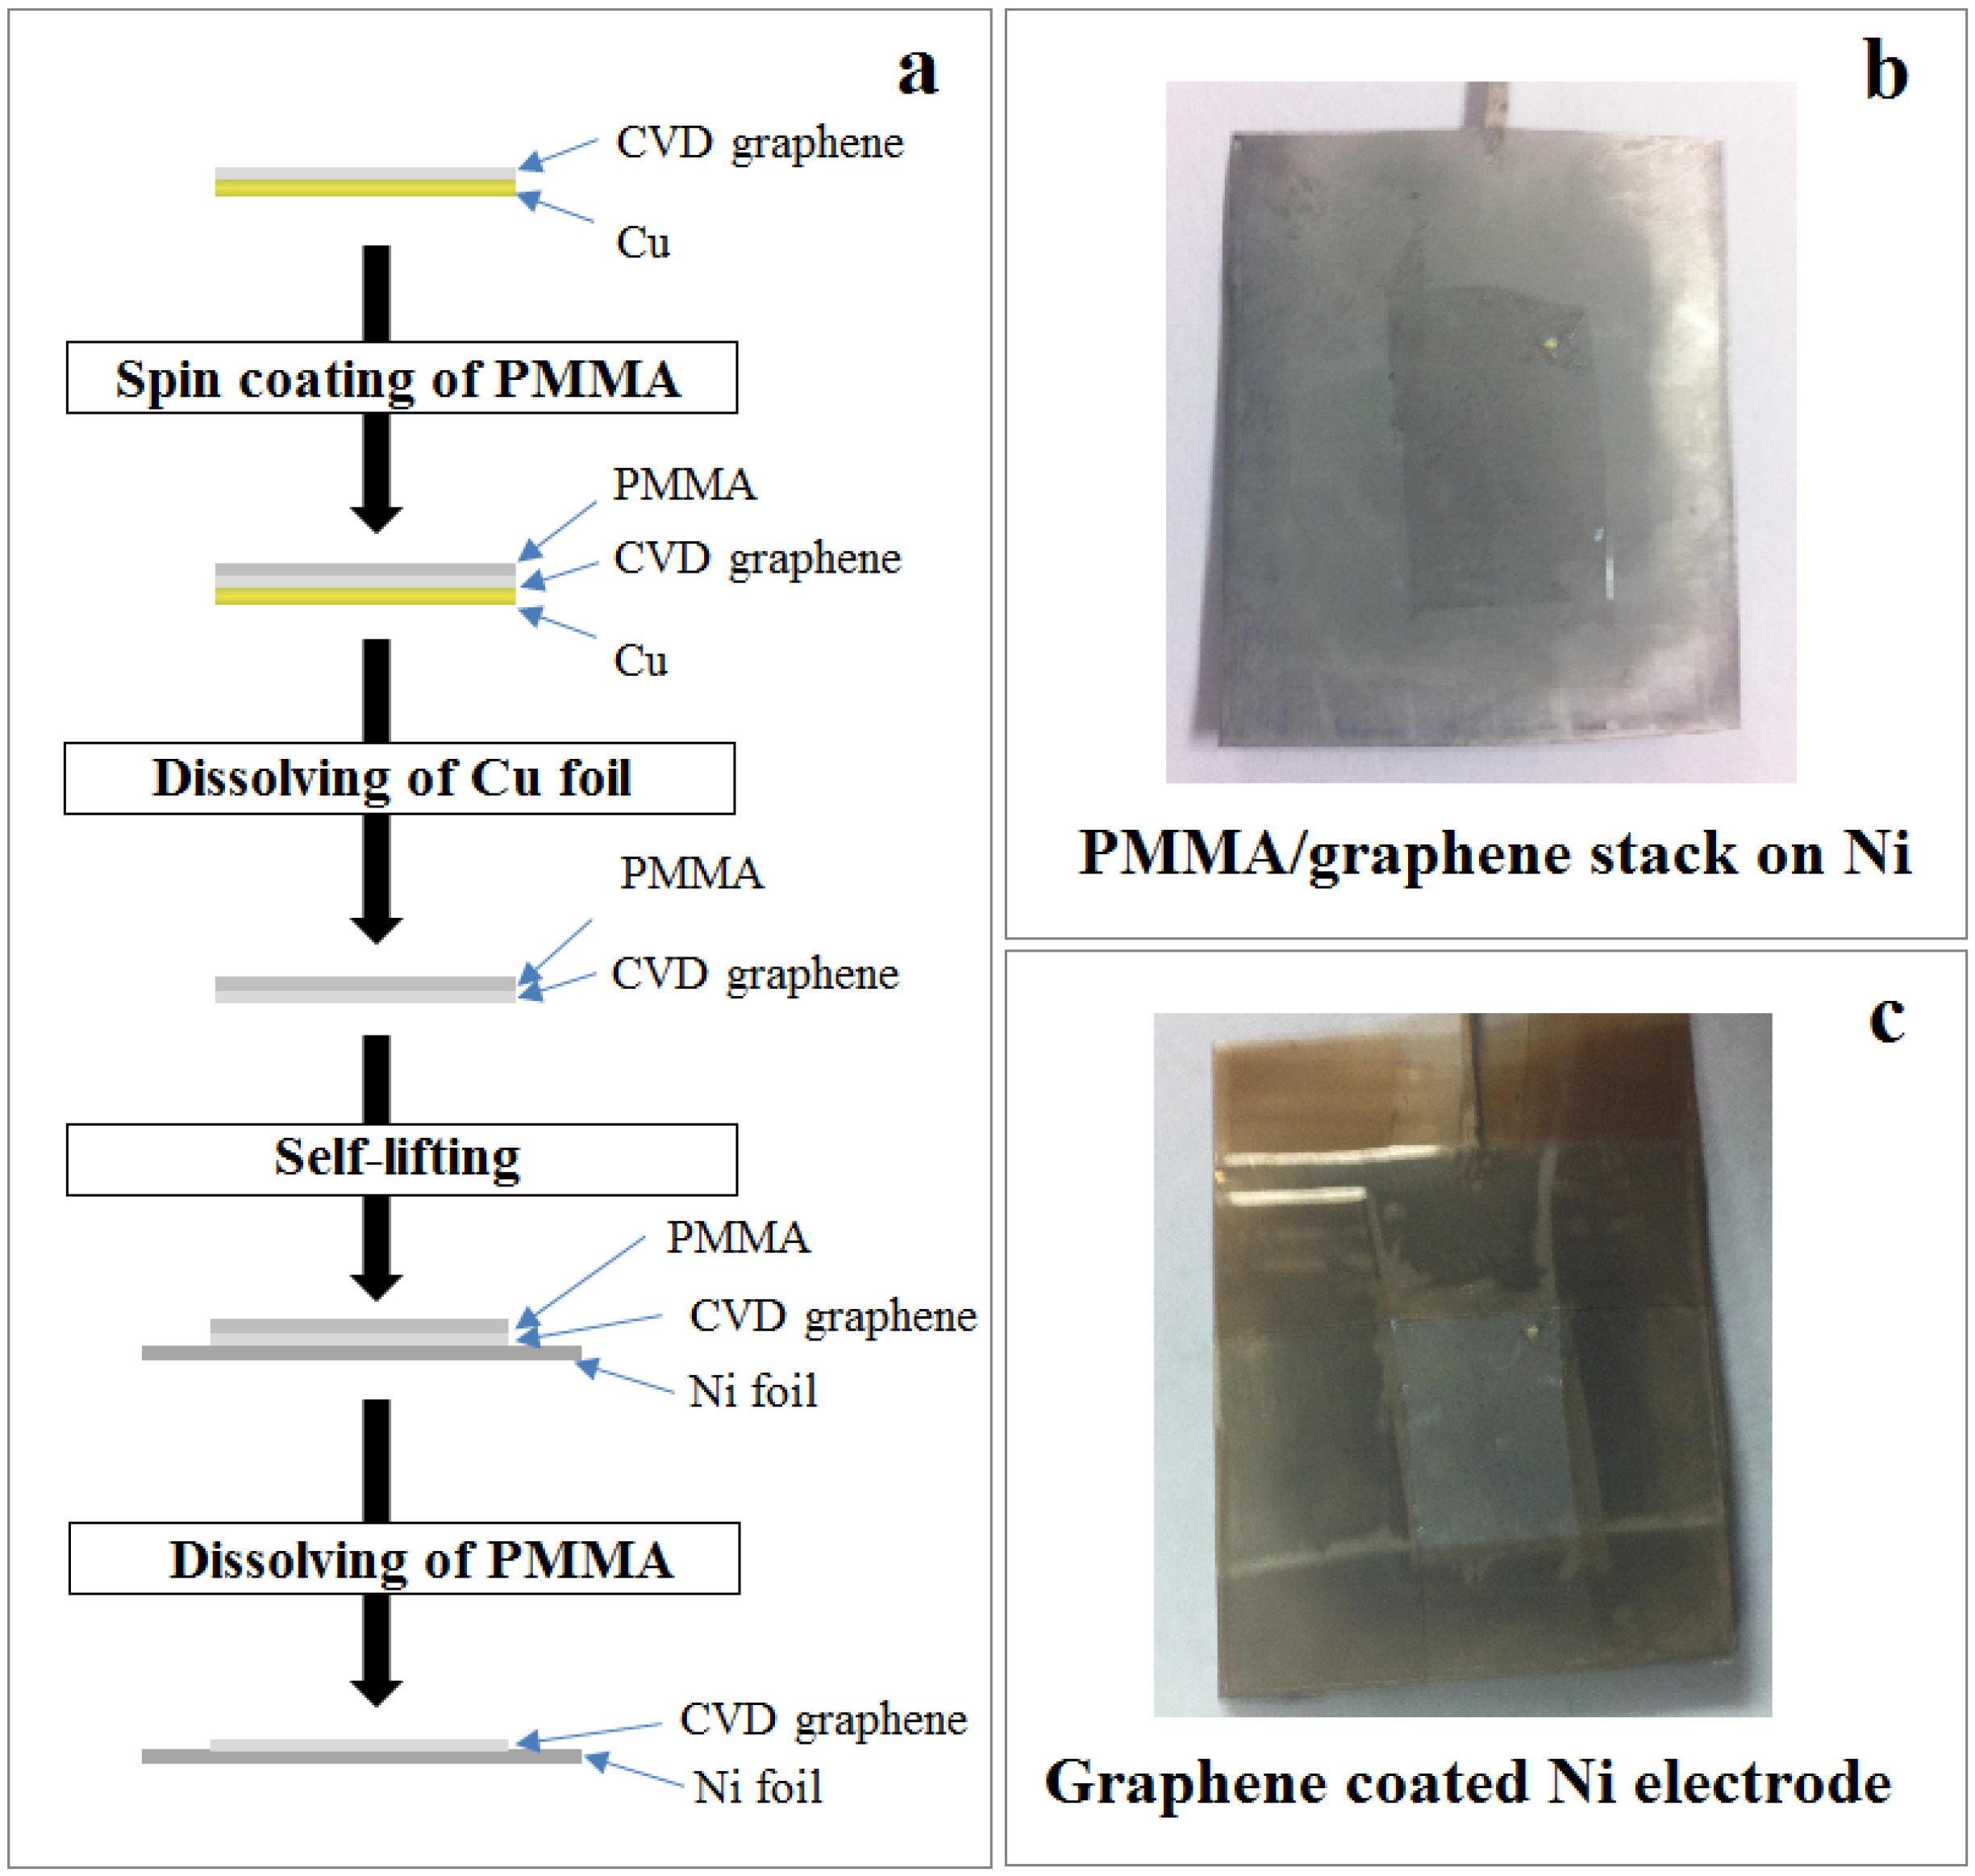
The flow chart of the process for making the graphene-coated Ni is shown in Figure 1a. Once the graphene film was synthesized on a copper substrate, a supportive layer of poly(methyl methacrylate) (PMMA) was spin-coated onto the graphene. After dissolving the copper substrate in the Marbles reagent (10 g CuSO4, 50 mL HCl, 50 mL DI water) [14], the PMMA/graphene stack was transferred to DI water for 3 h for surface cleaning and then self-lifted onto a pretreated Ni foil as shown in Figure 1b. The PMMA was then removed by rinsing the PMMA/graphene stack on the pretreated Ni electrode with acetone to complete the making of the graphene-coated Ni. After drying for 30 min at 70 °C in the oven (Model 30GC Lab Oven, Quincy Lab., Chicago, IL, USA), the edges of the graphene were sealed with Teflon tape to prevent the interference of the uncoated nickel in the evaluation of the catalyst as shown in Figure 1c, therefore, the exposed area (active area) of the graphene-coated Ni was 1.0 cm × 2.0 cm.
2.2. Phsysical Characterization of Graphene
Transmission electron microscopy (TEM) images and selected area electron diffraction (SAED) of the CVD graphene film were obtained using a transmission electron microscope (JEOL JEM 2100F, JEOL Ltd., Tokyo, Japan). The atomic force microscopy (AFM) images were obtained using an Agilent 5500 AFM/STM microscope in AC mode with NSC 15/AlBS probes (resonant frequency of 325 kHz) from MikroMasch USA (Wilsonville, OR, USA) under ambient conditions. The flow chart for preparing the graphene sample for TEM and AFM analysis is shown in Figure 2. After dissolving the copper substrates in the Marbles reagent, the floating CVD graphene film was rinsed with DI water to remove contamination and to clean the surface before transferring it onto a lacey carbon TEM grid (300 mesh, Copper) for TEM analysis and a silicon wafer for AFM analysis.
Raman spectra of the graphene-coated Ni and Ni foil were recorded using a Bruker Senterra Raman spectrometer (equipped with a microscope with a 10× objective lens; Bruker Corporation, Billerica, MA, USA) at 532 nm wavelength laser excitation (20 mW power).
2.3. Cyclic Voltammetry and Urea to Ammonia
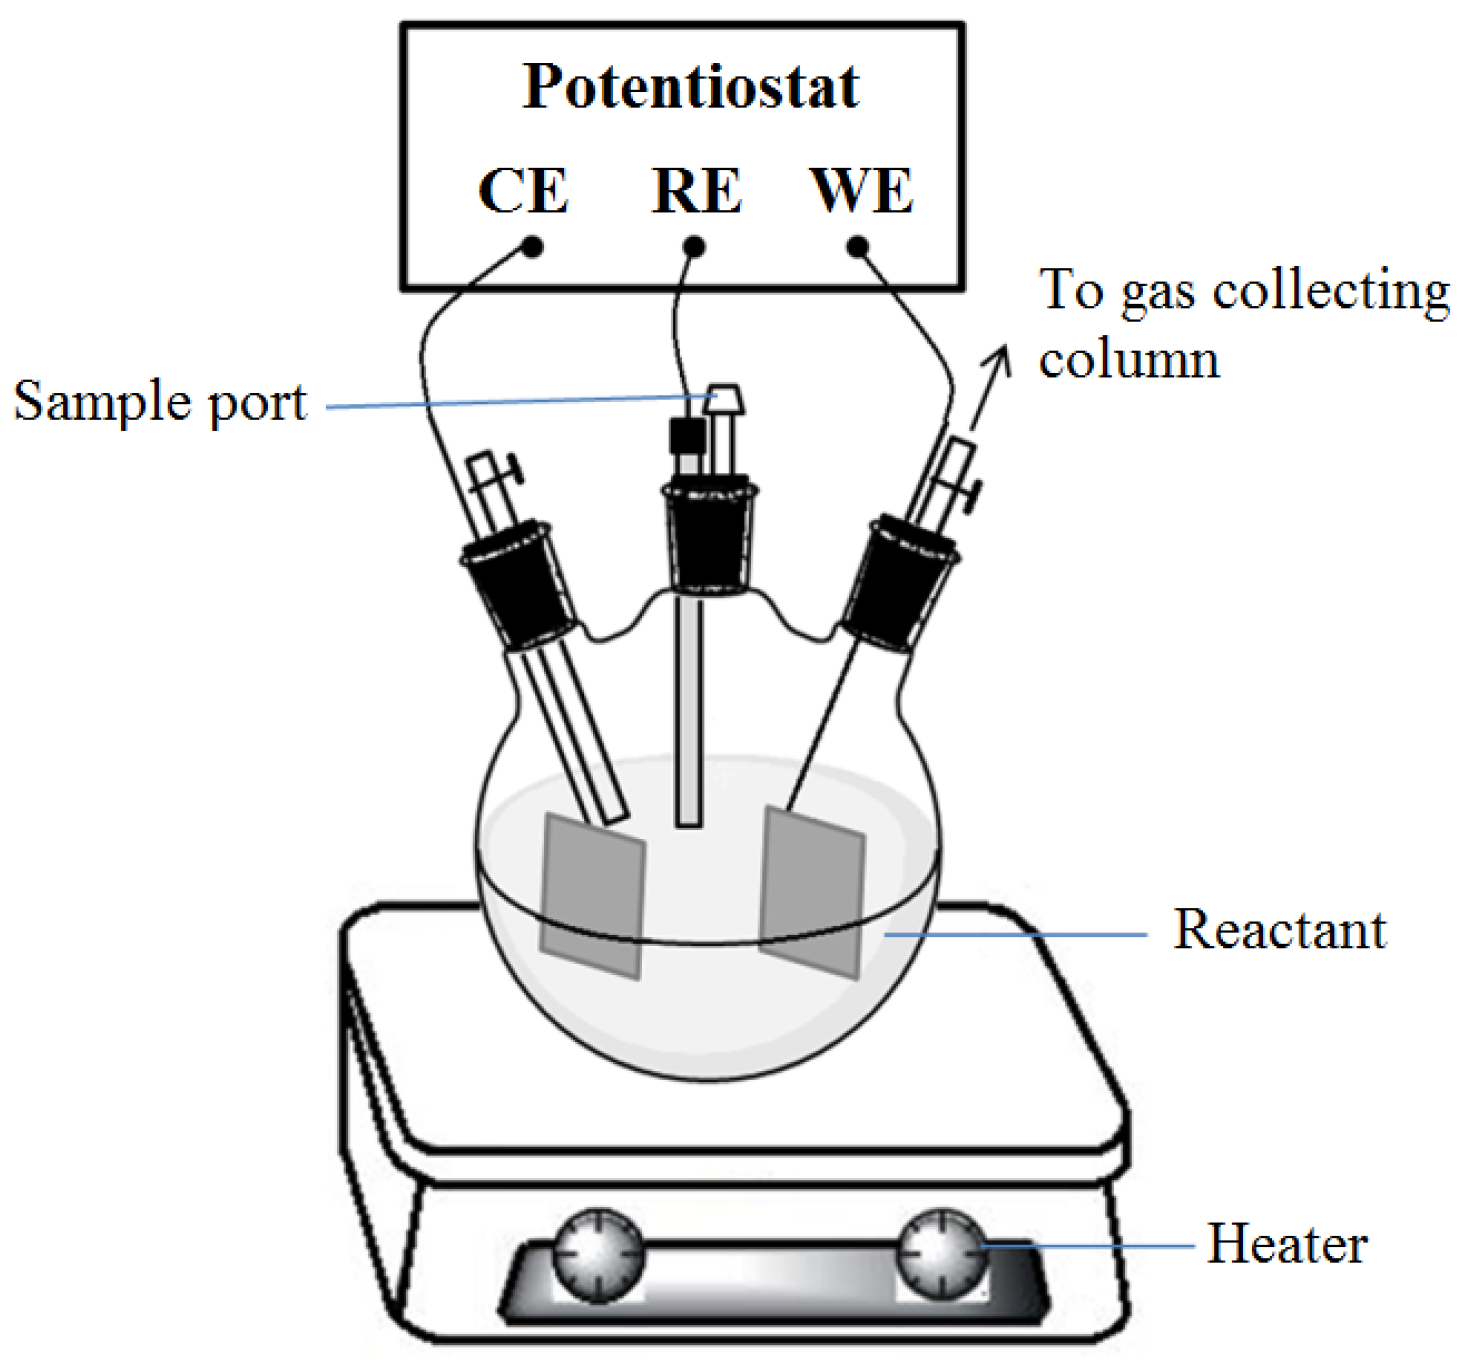
Urea (purity 99.8%) and K2CO3 (purity 99.0%) used in the experiments were purchased from Fisher Scientific (Waltham, MA, USA). Deionized water prepared by EVOQUA deionization system was used throughout the experiments unless otherwise specified. As shown schematically in Figure 3, the electrochemical tests were carried out in a three-neck flask (100 mL) using a Solartron Analytical 1470E CellTest System (Solartron Analytical, Farnborough, UK) with the graphene-Ni as the working electrode (WE), Pt foil (1.0 cm × 2.0 cm, purity > 99.0%, Alfa Aesar) as the counter electrode (CE), and Hg/HgO as the reference electrode (RE). The reference electrode was supported using a Luggin capillary filled with 2.5 M K2CO3. For comparison purposes, pretreated bare Ni foil was also used as a working electrode.
Solutions of 125 mL of 2.5 M K2CO3 in the presence and absence of 5.0 M urea were used for the experiments. All the experiments were performed at 70 °C—heating was provided using a heat mantle (Glas-Col, Glas Col, LLC., Terre Haute, IN, USA) with a temperature controller (Econo Temperature controller 12125-14, VWR International, LLC., Radnor, PA, USA). In all cases, the fifth pseudo-steady state cyclic voltammograms (CVs) between 0.5 V and 1.0 V vs. Hg/HgO, at a scan rate of 10 mV s−1 are reported. The eU2A experiments were performed at a constant potential vs. the reference electrode for a period of 24 h. The applied potential used corresponds with the oxidation peak of the CVs in the absence of urea. In addition, experiments were performed without applying a potential to determine the amount of ammonia produced in the bulk solution due to the thermal hydrolysis of urea (THU) [3]. An ammonia ion selective electrode (ISE) (Orion 710A+, Thermo Electron Corporation, Waltham, MA, USA) was used to measure the concentration of ammonia in the reactor (see Supplementary Materials Section S1). The pH change of the solution was monitored using a pH meter (OAKTON Acorn pH 5 meter, OAKTON Instruments, Vernon Hills, IL, USA).
2.4. Quatification of Corrosion
The corrosion of Ni was quantified as the concentration of Ni ions in the solution. Atomic absorption spectroscopy (AAS) was employed to measure the concentration of Ni ions in the solution (see Supplementary Materials Section S2).
3. Results
3.1. Physical Chracterization
The nature of the graphene film is shown by TEM in Figure 4. The image (Figure 4a) represents a continuous graphene film over a large area on the TEM grid with wrinkles and overlapping which were introduced due to the transfer process. The SAED image (inset in Figure 4a) reveals the six diffraction spots depicting the hexagonal diffraction pattern and the crystalline structure of the coal derived graphene films. Two or more layers of graphene are shown (Figure 4b,c) on the edge of the film.
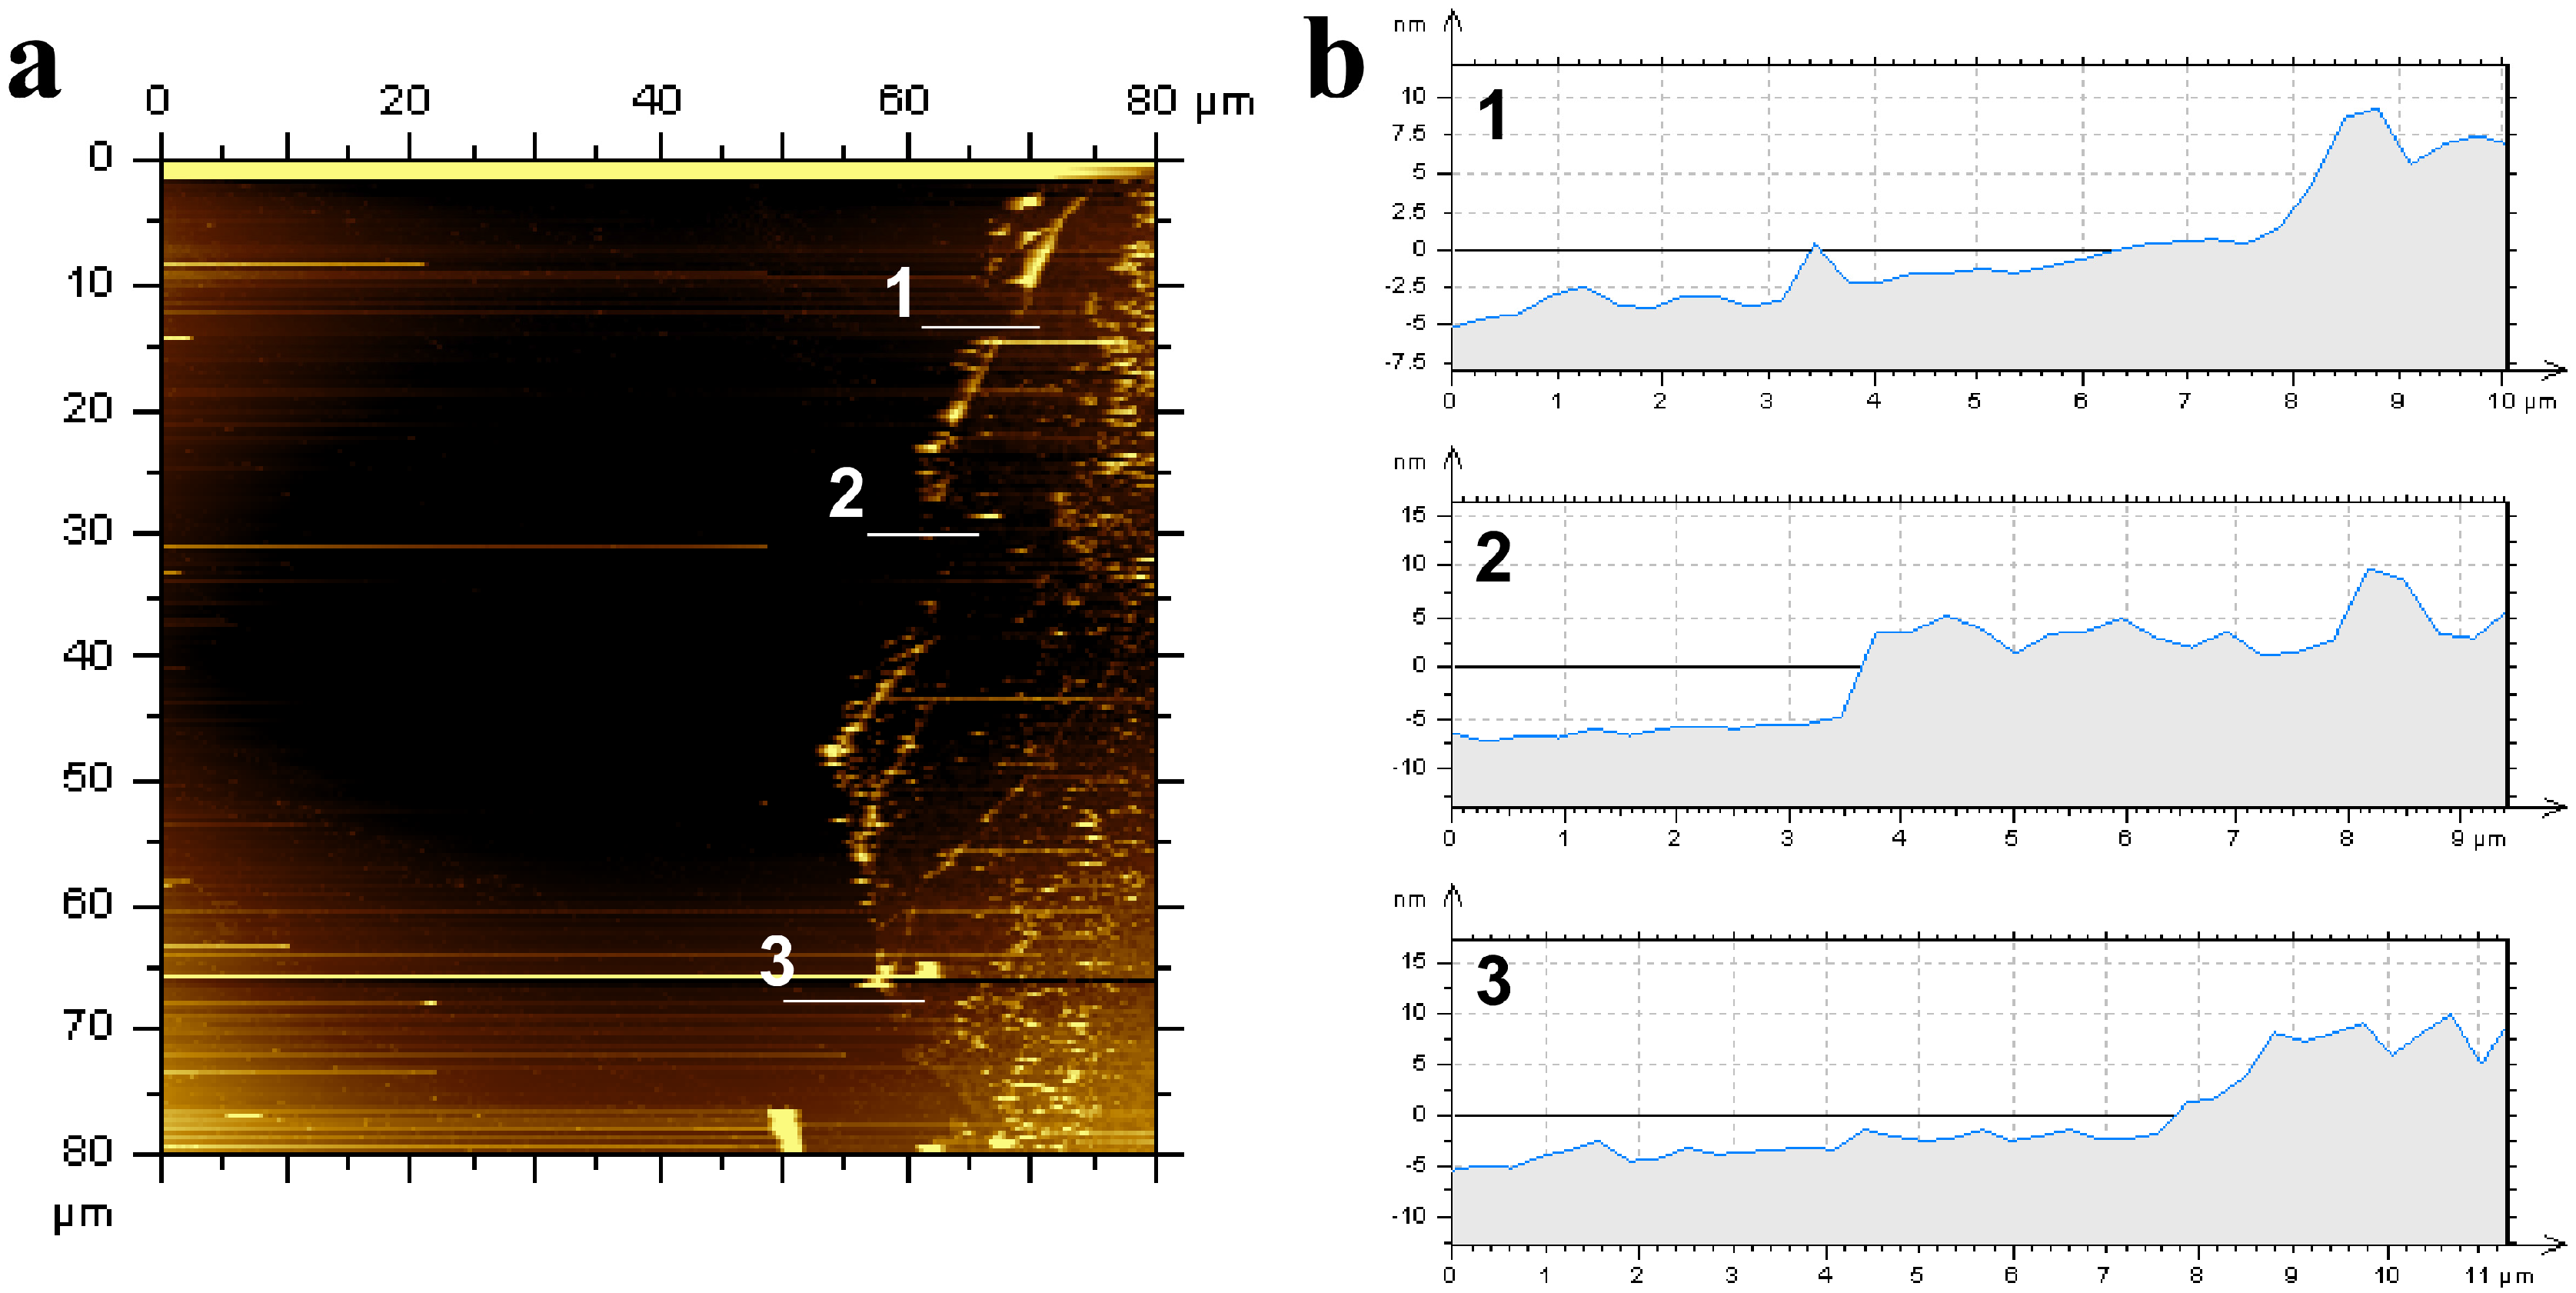
The AFM image (Figure 5a) shows the continuous graphene film on silicon substrate. Line scans were performed on the various regions of graphene films to determine the thickness, as depicted in the AFM image (Figure 5a). The corresponding height profiles (Figure 5b) show that the thickness is ~5–15 nm across the line scans, suggesting the formation of few layer graphene films. The brighter areas (with greater thickness) in the AFM image are caused by back-folding and/or overlapping which can be clearly observed in the TEM analysis.
The Raman spectra of the graphene on the surface of the Ni electrode were obtained before and after the eU2A experiments (Figure 6, curves I and II). In both cases, the Raman spectra exhibited a D band at 1360 cm−1, a zone-boundary phonon mode in first order Raman spectra attributed to the defects in the graphene films [13]; a G band at 1585 cm−1, assigned to the tangential vibrations of sp2 bonded carbon atoms [13]; and a 2D band at 2700 cm−1, a boundary phonon mode in second order Raman spectra associated with graphene [13]. The ratio of the intensity of the 2D band to the G band (I2D/IG) is approximately 1, indicating that the coated graphene is bi-layered to few-layered graphene films [15,16,17,18,19], which is in agreement with the TEM and AFM analysis. The consistency of the Raman spectra of the coated graphene before and after the experiments implies that the graphene coating is stable during the eU2A process. In contrast, no D, G, and 2D bands are found in the Raman spectrum of the bare Ni electrode (Figure 6 curve III).
3.2. Cyclic Voltammetry
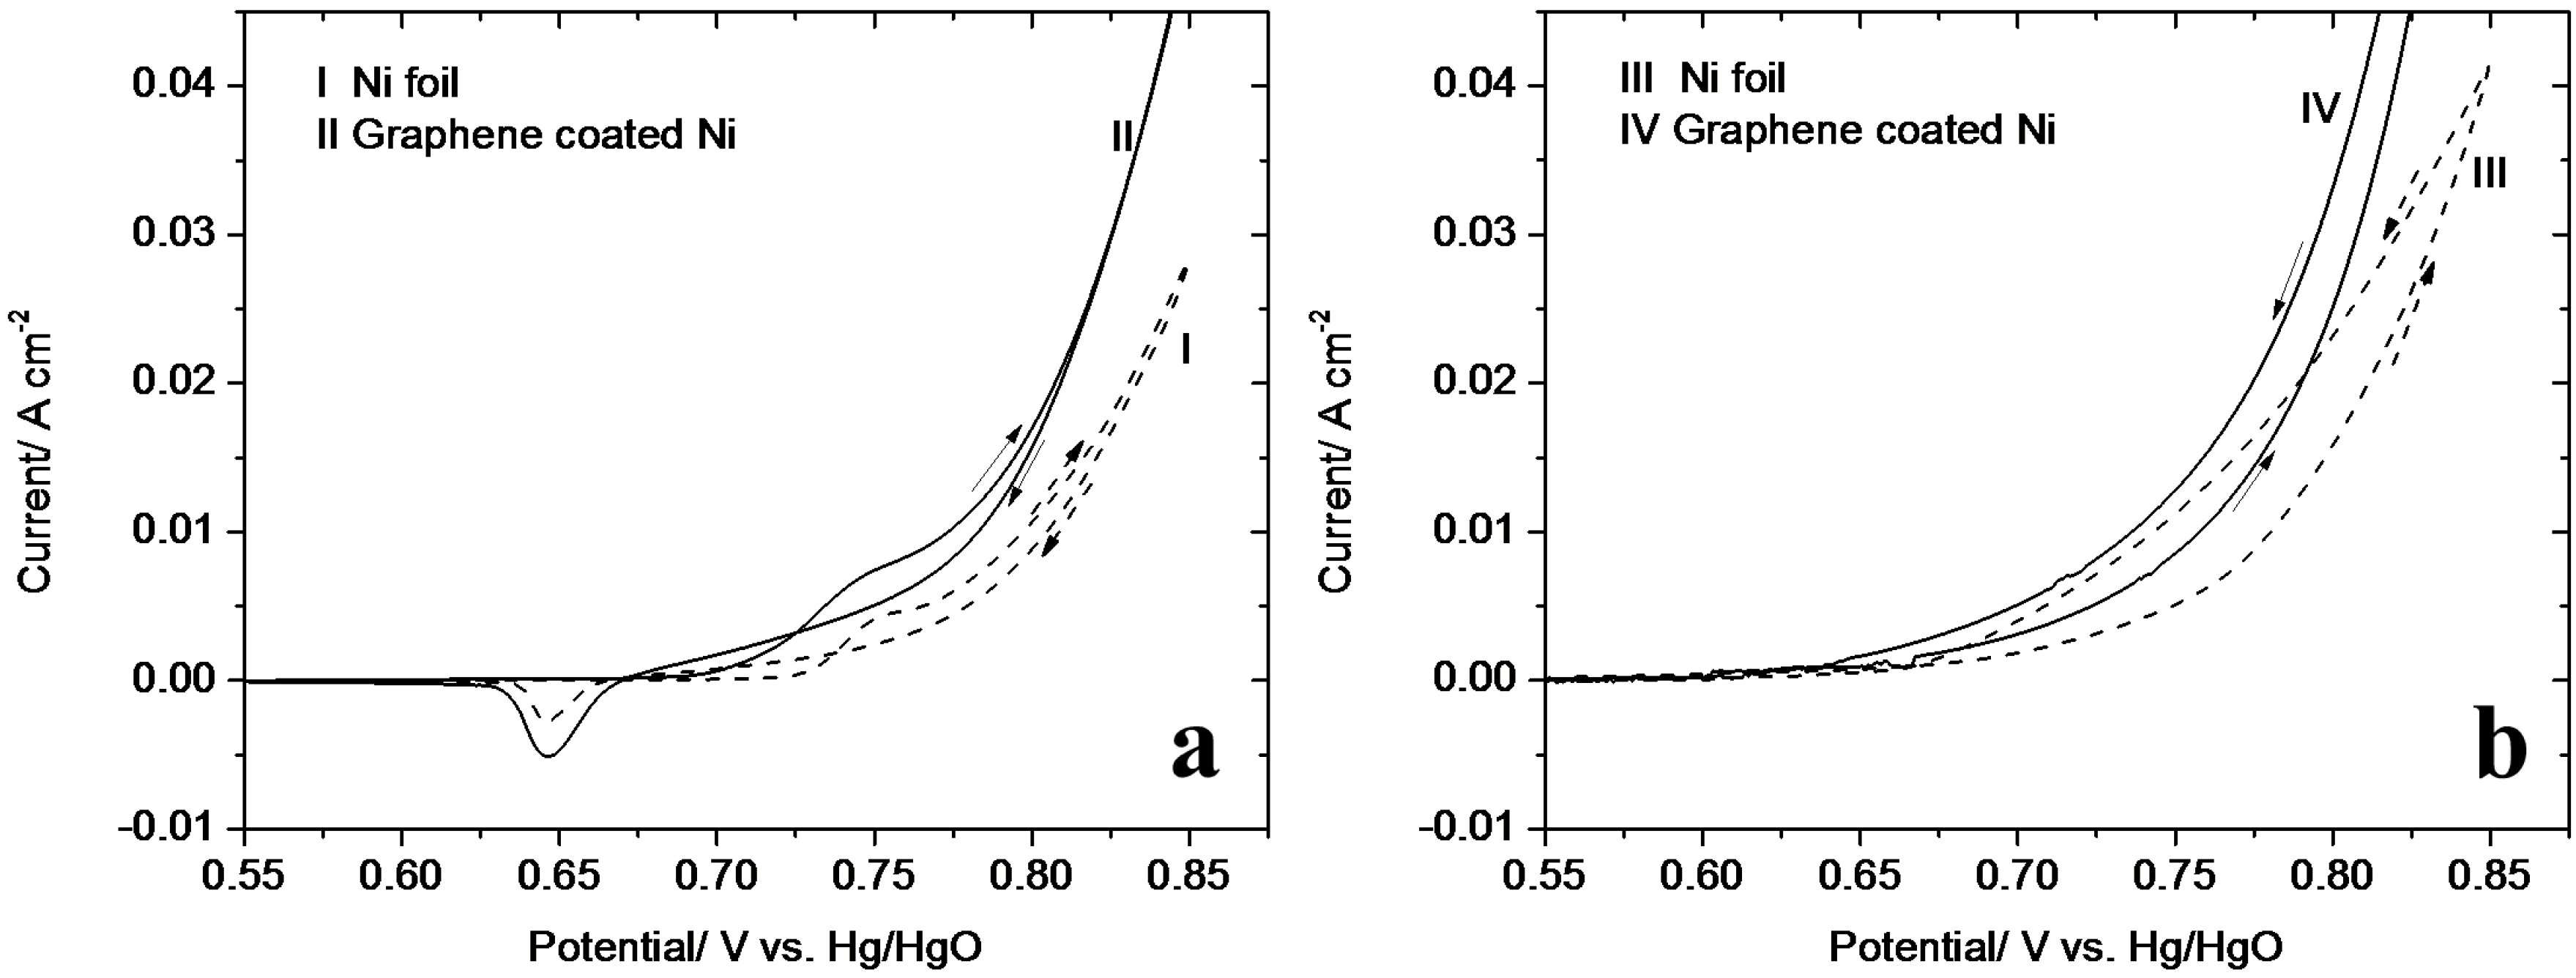
The normalized (by active geometric area of the electrodes) cyclic voltammograms (CVs) of 2.5 M K2CO3 in the absence and presence of 5.0 M urea at 70 °C using Ni foil and graphene-coated Ni, at a scan rate of 10 mV s−1, are shown in Figure 7. The CVs illustrate an anodic and cathodic peak in relation to the NiOOH/Ni(OH)2 redox couple (Equation (2)) for both working electrodes.
In the forward scan of the CVs in Figure 7a, an anodic peak is observed at 0.750 V vs. Hg/HgO corresponding to the oxidation of Ni(OH)2 to NiOOH. In the reverse scan, a cathodic peak is seen at 0.645 V vs. Hg/HgO due to the reduction of NiOOH to Ni(OH)2. The CVs also demonstrate that the redox current of NiOOH is enhanced after graphene coating. That is, in the same geometric area, the graphene-coated Ni enables more active sites of NiOOH for the eU2A reaction. When adding 5.0 M urea, the anodic current density increased, indicating that urea starts to be electrolyzed to N2 as proposed by Vedharathinam and Botte [20]. The disappearance of the cathodic peak (see Figure 7b) means that in the eU2A process, NiOOH is consumed, and thus no cathodic current could be observed.
3.3. Generation of Ammonia in eU2A and THU Processes
The generated ammonia during 24 h eU2A (0.750 V vs. Hg/HgO) using graphene-coated Ni and bare Ni working electrodes and THU experiment is shown in Figure 8a. The generated ammonia on the electrode surface in the eU2A experiments is the total ammonia produced excluding the ammonia produced in the bulk solution (THU) as calculated by Equation (3). The normalized generated ammonia per surface area of the electrode is then calculated according to Equation (4) and the results are shown in Figure 8b.
where, CTHU,i, the concentration of ammonia at sample point i in the THU experiment, M; CeU2A,i, the concentration of ammonia at sample point i in the eU2A experiment, M; i, number of the sample point; , the additional ammonia generated on the surface of the working electrode, M; A, geometric area of the working electrode, cm2; , normalized generated ammonia on the surface of the working electrode, M cm−2.
In the eU2A process, 0.0181 M cm−2 ammonia is produced on the Ni foil electrode and 0.0402 M cm−2 on the graphene-coated Ni electrode (Figure 8b). That is, the generated ammonia rate—per active area of the electrode—in the eU2A process using the graphene-coated Ni is more than two times higher than that using the bare Ni foil. The graphene coating enhanced the eU2A reaction, which facilitated a higher ammonia generation rate. The enhancement possibly comes from the intrinsic properties of graphene and/or from a change in the electric-double layer, however, such a mechanism was not explored in this paper.
3.4. Ammonia Corrosion on Graphene-Coated Ni Electrode
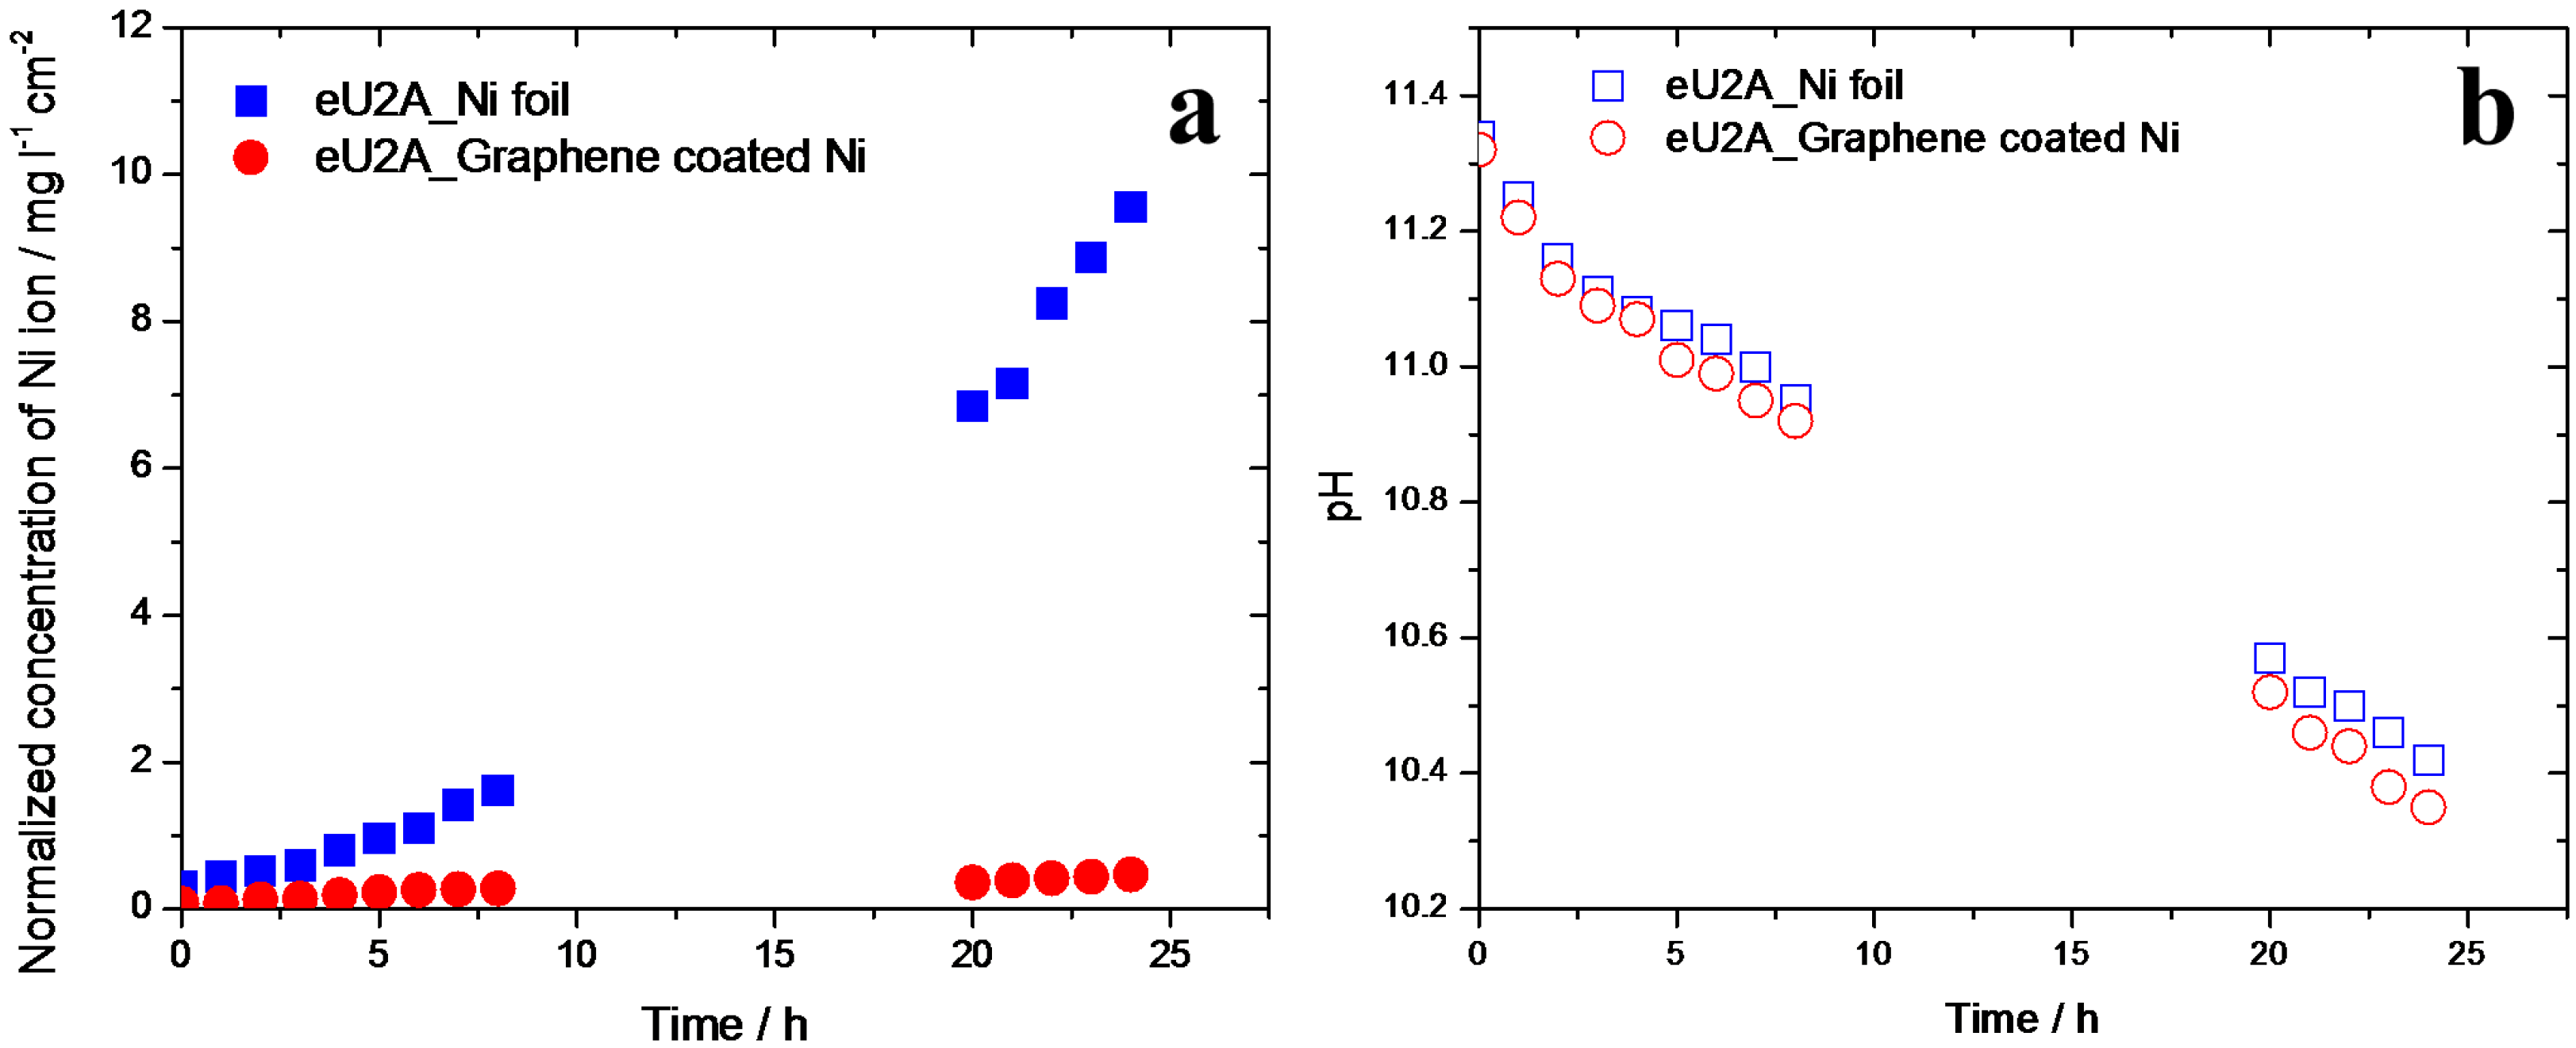
During the eU2A experiment, ammonia is generated on the surface of the Ni electrode and it would cause corrosion of the electrode to form [Ni(NH3)n]2+ complexes [21,22]. The electrolyte in the eU2A experiment using Ni foil as working electrode became bluish while, in contrast, the electrolyte was colorless when using the graphene-coated Ni. This indicates that graphene coating helped reduce the corrosion of Ni in the eU2A process. The change of the concentration of Ni ion during the experiments was measured by AAS and shown in Figure 9a.
As shown in Figure 9a, the gradient of the normalized concentration of Ni ion increased due to the generation of ammonia in the electrolyte, which causes severe corrosion. The pH value of the electrolyte during the eU2A experiments decreased as a function of time (as shown in Figure 9b). A series of nickel–ammonia complexes ([Ni(NH3)n]2+) have been reported in the pH region from 8 to 12, where the number n increases when the pH increases [22]. The pH value of the electrolyte decreased from 11.4 to 10.4 (Figure 9b) due to the conversion of K2CO3 to KHCO3 by the generated CO2 from the eU2A reaction (Equation (1)). The pH value in the eU2A experiment using the graphene-coated Ni electrode is slightly lower due to the enhanced urea to ammonia conversion rate, which generates more CO2 (see Equation (1)). In this pH range, the number of incorporated ammonia ligands for the nickel–ammonia complexes is 5 or 6 [22], therefore a large amount of ammonia is lost due to the complexation on the bare Ni working electrode. In addition, the eU2A process is a heterogeneous reaction and the ammonia generated from the electrode surface causes the localized concentration of ammonia to be higher at the surface of the electrode than at the bulk solution. This explains why the bare Ni electrode was easily attacked in the region near the surface of the electrode. In contrast, the protective graphene layer could be explained by two hypothesized mechanisms: (1) blocking the ammonia from touching the Ni ion, thus reducing the nickel dissolution (corrosion) rate dramatically as shown in Figure 9a and (2) creating a localized high concentration of OH− ions on the surface of the Ni as reported by Botte [11]. It is most likely that there is small amount of Ni lost from the graphene coated Ni due to the structure defects of the graphene film, which exposes the bare Ni surface to the electrolyte. Therefore, it is expected that graphene films with fewer defects would be more favorable for anti-corrosion coating of the electrodes in the eU2A process.
4. Discussion and Conclusion
Ni is corrosion-resistant in many applications, including diluted ammonium hydroxide solution, but the rapid attack on Ni still occurs especially when the concentration of ammonia is higher than 1% (or 0.588 M) [23]. Even though the generated ammonia is less than 0.588 M in the bulk (Figure 8a), because the generation comes from the surface of the electrode, the localized ammonia would be higher than 1 %, which will initiate the corrosion of Ni. When the Ni electrode works in the eU2A process using 1.0–7.0 M KOH supporting solution as described in previous investigation [3], the pH of the solution is beyond 14, therefore, no nickel-ammonia complex can be formed. However, as the supporting electrolyte is converted to K2CO3, ~70% of it will be transformed to KHCO3 at equilibrium state with the continuously released CO2 from the urea hydrolysis [24], making the pH of the electrolyte fall into a region where nickel-ammonia complexes ([Ni(NH3)n]2+, n = 2–6) form on the surface of the Ni electrode [22]. The complexes are soluble in the electrolyte dragging Ni from the surface of the working electrode, which propagates ammonia corrosion.
Graphene coating effectively inhibits the complexation-dragging process and therefore becomes a promising anti-corrosion method for protecting the Ni electrode from ammonia corrosion in the eU2A process. The CVD synthesized graphene was successfully transferred onto the Ni working electrode with the help of PMMA, which ensured its continuous integrity and homogeneity (the coverage and homogeneity can be seen in scanning electron microscopy (SEM) images in Supplementary Material Section S3). The coating of graphene is bi-layered to few-layered as demonstrated by the TEM analysis, AFM analysis, and the Raman spectra. It was proven by Raman spectra that the coating of graphene on the Ni electrode is longstanding during the eU2A reaction. However, some defects were noticed on the surface of the graphene, therefore it is hypothesized that better corrosion resistance could be achieved if the Ni electrode was coated with defect-free graphene.
Surprisingly, the graphene coating did not inhibit the eU2A reaction; instead a higher ammonia generation rate was achieved using the graphene-coated Ni electrode. In 24 hours of eU2A reaction, the loss of Ni was reduced by 9.09 mg L−1 cm−2 or 0.155 mM cm−2 (Figure 9a) after graphene coating, therefore, it is estimated that the produced ammonia could be, at best, increased by 0.930 mM cm−2 assuming the number of incorporated ammonia ligands is 6. However, the generated ammonia increased by 0.0221 M cm−2 (Figure 8b). This means that the increased ammonia generation not only comes from the corrosion minimization, but also from a mechanism by which the graphene coating enhanced the catalytic effect of Ni on the eU2A reaction. It is recommended to investigate the performance of graphene-coated Ni electrodes with the direct CVD growth of graphene on Ni foil since it has its own peculiarities [25,26] and provides a more firmed attachment which can help with the elucidation of the mechanism. Also, the effect of monolayer and defect free graphene-coated Ni electrodes should be investigated in the future. Furthermore, the OH− concentration in the reactor is crucial for eU2A reactions, thus the ammonia generation rate is decaying due to the reducing pH. However, the reaction rate will become stable after the equilibrium of K2CO3/KHCO3/NH3/H2O is reached. With this consideration, long term experiments should be conducted in the future.
Supplementary Materials
The following are available online at https://www.mdpi.com/2079-6412/7/6/72/s1. Section S1, Determination of Produced Ammonia Using Ion Selective Electrode; Section S2, Determination of Ni Loss Using Atomic Absorption Spectrometry; Section S3, Scanning Electron Microscopy.
Acknowledgments
This work was financially supported by the Center for Electrochemical Engineering Research (CEER) at Ohio University.
Author Contributions
Gerardine G. Botte conceived the idea of the graphene-coated electrode. Fei Lu designed and performed the experiments. Gerardine G. Botte and Fei Lu analyzed the data and wrote the paper.
Conflicts of Interest
The authors declare no conflict of interest.
References
- Cichanowicz, J.E.; Muzio, L.J.; Hein, M.C. The First 100 GW of SCR in the U.S.—What Have We Learned? In Proceedings of the Mega Symposium, Baltimore, MD, USA, 28–31 August 2006. [Google Scholar]
- Botte, G.G. Electrolytic Cells and Methods for the Production of Ammonia and Hydrogen. U.S. Patent 9062382 B2, 2007. [Google Scholar]
- Lu, F.; Botte, G.G. Electrochemically Induced Conversion of Urea to Ammonia. ECS Electrochem. Lett. 2015, 4, E5–E7. [Google Scholar] [CrossRef]
- Geim, A.K.; Novoselov, K.S. The rise of graphene. Nat. Mater. 2007, 6, 183–191. [Google Scholar] [CrossRef] [PubMed]
- Zhu, Y.; Murali, S.; Cai, W.; Li, X.; Suk, J.W.; Potts, J.R.; Ruoff, R.S. Graphene and Graphene Oxide: Synthesis, Properties, and Applications. Adv. Mater. 2010, 22, 3906–3924. [Google Scholar] [CrossRef] [PubMed]
- Singh, V.; Joung, D.; Zhai, L.; Das, S.; Khondaker, S.I.; Seal, S. Graphene based materials: Past, present and future. Prog. Mater. Sci. 2011, 56, 1178–1271. [Google Scholar] [CrossRef]
- Hu, J.; Ji, Y.; Shi, Y.; Hui, F.; Duan, H.; Lanza, M. A Review on the use of Graphene as a Protective Coating Against Corrosion. Ann. J. Mater. Sci. Eng. 2014, 1, 1–16. [Google Scholar] [CrossRef] [PubMed]
- Dumée, L.F.; He, L.; Wang, Z.; Sheath, P.; Xiong, J.; Feng, C.; Tan, M.Y.; She, F.; Duke, M.; Gray, S.; et al. Growth of nano-textured graphene coatings across highly porous stainless steel supports towards corrosion resistant coatings. Carbon 2015, 87, 395–408. [Google Scholar] [CrossRef]
- Prasai, D.; Tuberquia, J.C.; Harl, R.R.; Jennings, G.K.; Bolotin, K.I. Graphene: Corrosion-Inhibiting Coating. ACS Nano 2012, 6, 1102–1108. [Google Scholar] [CrossRef] [PubMed]
- Wang, D.; Yan, W.; Vijapur, S.H.; Botte, G.G. Electrochemically reduced graphene oxide–nickel nanocomposites for urea electrolysis. Electrochim. Acta 2013, 89, 732–736. [Google Scholar] [CrossRef]
- Botte, G.G. Electrochemical Cell Containing a Graphene Coated Electrode. U.S. Patent 20160251765 A1, 2016. [Google Scholar]
- Politano, A.; Cattelan, M.; Boukhvalov, D.W.; Campi, D.; Cupolillo, A.; Agnoli, S.; Apostol, N.G.; Lacovig, P.; Lizzit, S.; Farías, D.; et al. Unveiling the Mechanisms Leading to H2 Production Promoted by Water Decomposition on Epitaxial Graphene at Room Temperature. ACS Nano 2016, 10, 4543–4549. [Google Scholar] [CrossRef] [PubMed]
- Vijapur, S.H.; Wang, D.; Botte, G.G. Raw Coal Derived Large Area and Transparent Graphene Films. ECS Solid State Lett. 2013, 2, M45–M47. [Google Scholar] [CrossRef]
- Sun, Z.; Yan, Z.; Yao, J.; Beitler, E.; Zhu, Y.; Tour, J.M. Growth of graphene from solid carbon sources. Nature 2010, 468, 549–552. [Google Scholar] [CrossRef] [PubMed]
- Reina, A.; Jia, X.; Ho, J.; Nezich, D.; Son, H.; Bulovic, V.; Dresselhaus, M.S.; Kong, J. Large Area, Few-Layer Graphene Films on Arbitrary Substrates by Chemical Vapor Deposition. Nano Lett. 2009, 9, 30–35. [Google Scholar] [CrossRef] [PubMed]
- Tiwari, R.N.; Ishihara, M.; Tiwari, J.N.; Yoshimura, M. Synthesis of graphene film from fullerene rods. Chem. Commun. 2012, 48, 3003–3005. [Google Scholar] [CrossRef] [PubMed]
- Sun, W.H.; Boyle, J.M.; Carmignani, P.G. Small Scale Test Results From New Selective Catalytic NOx Reduction Process Using Urea. In Proceedings of the MEGA Symposium, Chicago, IL, USA, 20–23 August 2001. [Google Scholar]
- Li, X.; Cai, W.; An, J.; Kim, S.; Nah, J.; Yang, D.; Piner, R.; Velamakanni, A.; Jung, I.; Tutuc, E.; et al. Large-Area Synthesis of High-Quality and Uniform Graphene Films on Copper Foils. Science 2009, 324, 1312–1314. [Google Scholar] [CrossRef] [PubMed]
- Ni, Z.; Wang, Y.; Yu, T.; Shen, Z. Raman spectroscopy and imaging of graphene. Nano Res. 2008, 1, 273–291. [Google Scholar] [CrossRef]
- Vedharathinam, V.; Botte, G.G. Direct evidence of the mechanism for the electro-oxidation of urea on Ni(OH)2 catalyst in alkaline medium. Electrochim. Acta 2013, 108, 660–665. [Google Scholar] [CrossRef]
- Scridhar, N.; Hodge, F.G. Nickel and High Nickel Alloys. In Corrosion and Corrosion Protection Handbook, 2nd ed.; Schweitzer, P.A., Ed.; CRC Press: Chester, NJ, USA, 1989; p. 95. [Google Scholar]
- Grujicic, D.; Pesic, B. Electrochemical and AFM study of nickel nucleation mechanisms on vitreous carbon from ammonium sulfate solutions. Electrochim. Acta 2006, 51, 2678–2690. [Google Scholar] [CrossRef]
- Drodten, P. Ammonia and Ammonium Hydroxide. In Corrosion Resistance of Nickel and Nickel Alloys Against Acids and Lyes, 1st ed.; Schutze, M., Rebak, R.B., Bender, R., Eds.; Wiley-VCH: Weinheim, Germany, 2014; pp. 249–250. [Google Scholar]
- Haynes, W.P.; Benson, H.E.; Field, J.H.; Tosh, J.S. Equilibrium Study of the System Potassium Carbonate, Potassium Biocarbonate, Carbon Dioxide, and Water; U.S. Dept. of the Interior, Bureau of Mines: Washington, DC, USA, 1959; pp. 13–15.
- Dahal, A.; Batzill, M. Graphene-nickel interfaces: A review. Nanoscale 2014, 6, 2548–2562. [Google Scholar] [CrossRef] [PubMed]
- Politano, A. Quasi-freestanding graphene on Ni(110): A graphene/metal contact with suppressed interface states. Nano Res. 2016, 9, 1795–1800. [Google Scholar] [CrossRef]
Figure 1.
(a) Flow chart for making the graphene-coated Ni electrode; (b) Photograph of PMMA/graphene stack self-lifted onto the Ni foil; (c) Photograph of finalized graphene-coated Ni working electrode with edges sealed with Teflon tape.
Figure 1.
(a) Flow chart for making the graphene-coated Ni electrode; (b) Photograph of PMMA/graphene stack self-lifted onto the Ni foil; (c) Photograph of finalized graphene-coated Ni working electrode with edges sealed with Teflon tape.

Figure 2.
Flow chart for transferring graphene on the TEM grid and silicon wafer for TEM and AFM analysis.
Figure 2.
Flow chart for transferring graphene on the TEM grid and silicon wafer for TEM and AFM analysis.
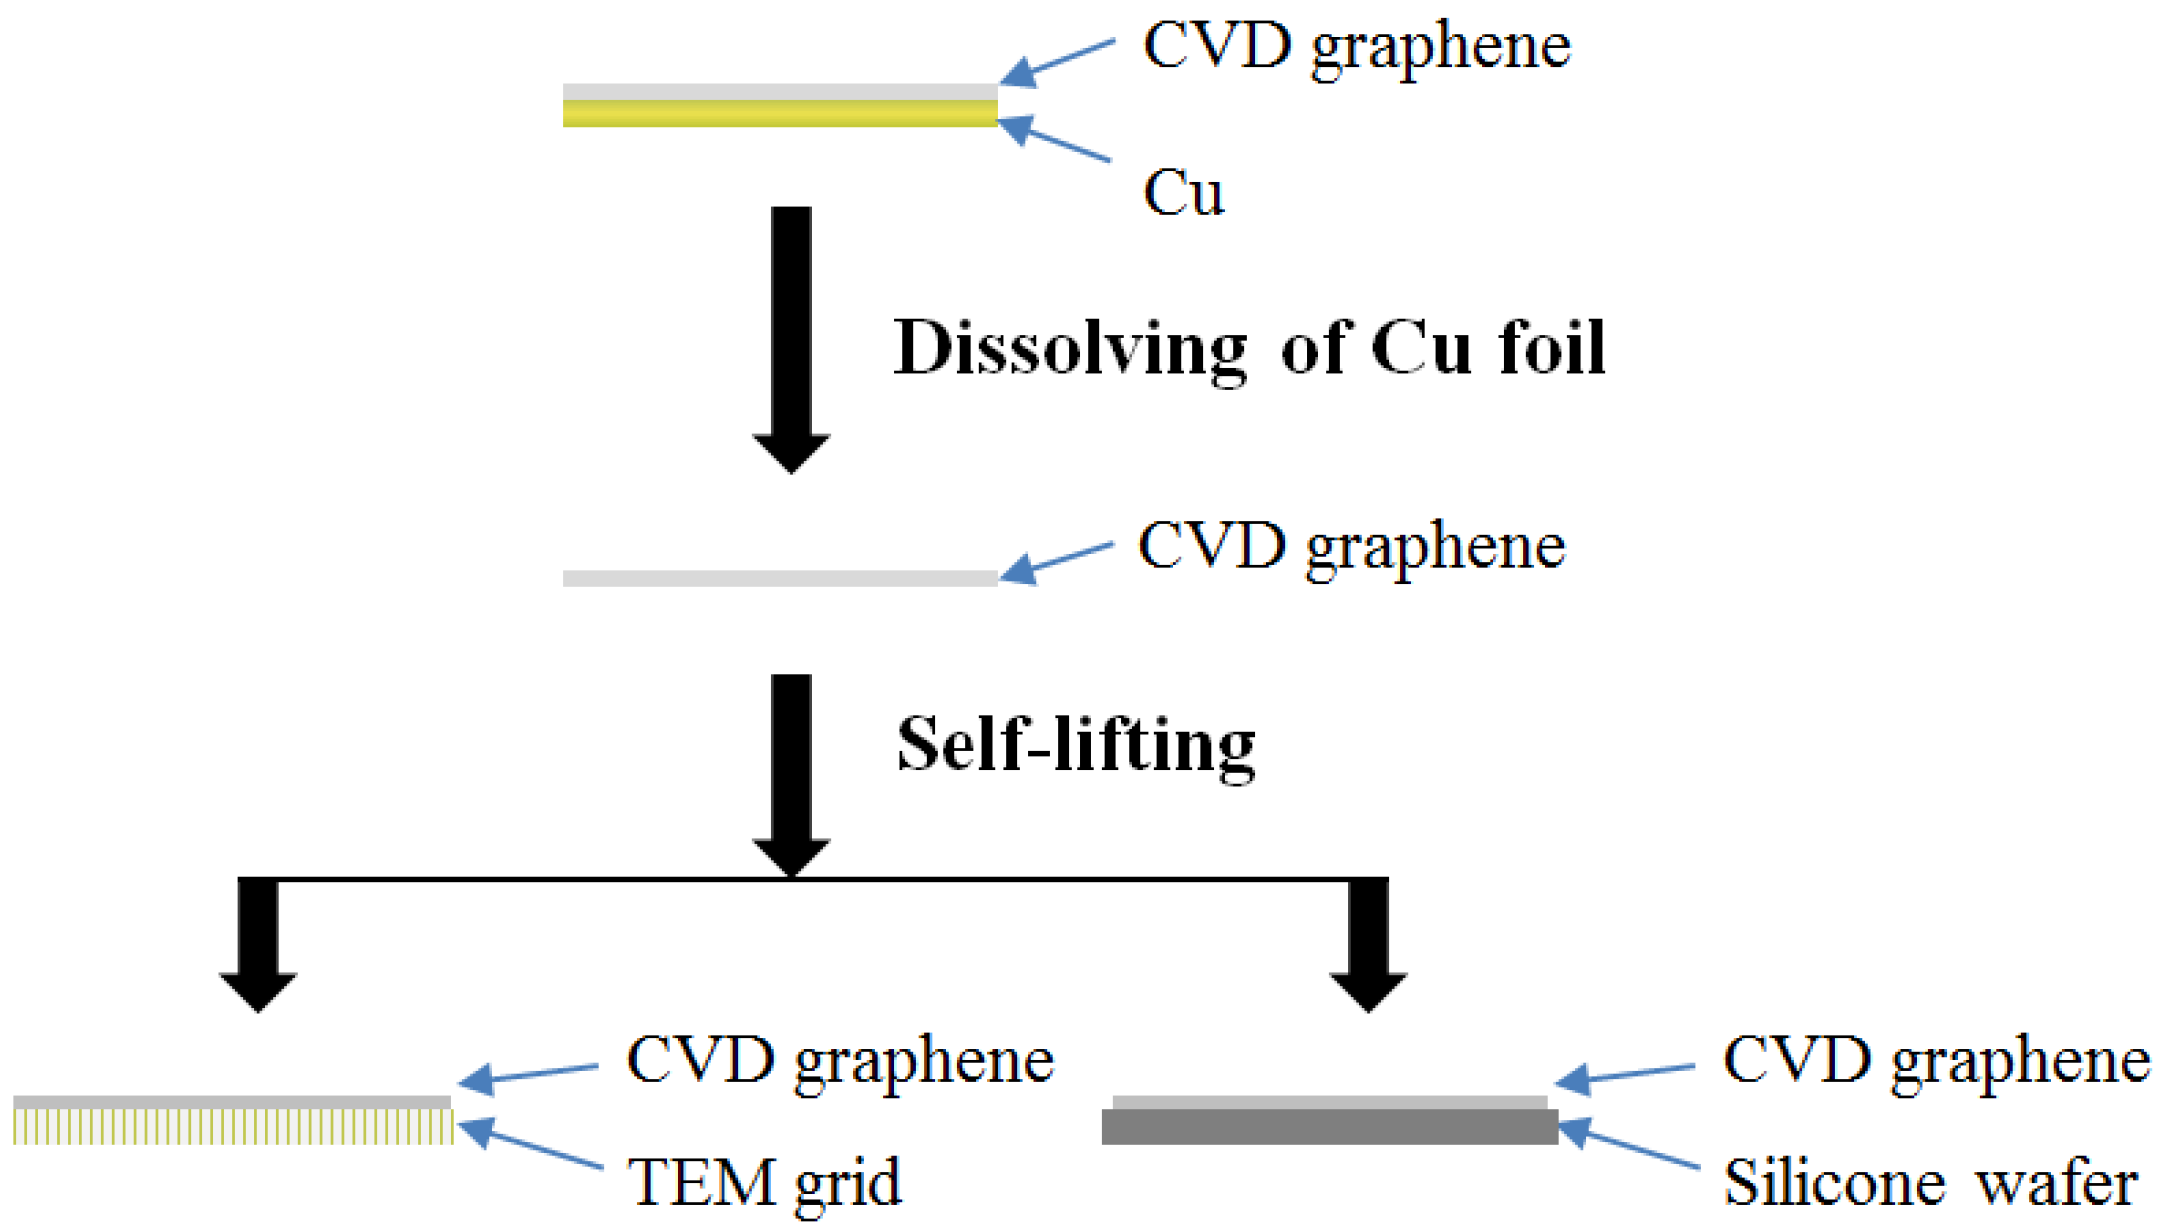
Figure 3.
Schematic of the three-neck eU2A reactor. The working electrodes are Ni foil and graphene-coated Ni and the counter electrode is Pt foil, while the reference electrode is Hg/HgO. Temperature was set at 70 °C. The sample port allowed collecting liquid samples and determining pH of the electrolyte in the reactor.

Figure 4.
(a) TEM image of large area and continuous coal derived graphene film; Inset: SAED with six diffraction spots demonstrating the crystalline nature of the coal derived graphene film. (b,c) High magnification TEM image with the edge of the coal derived graphene film exhibiting bi-layers to few layers of the film.
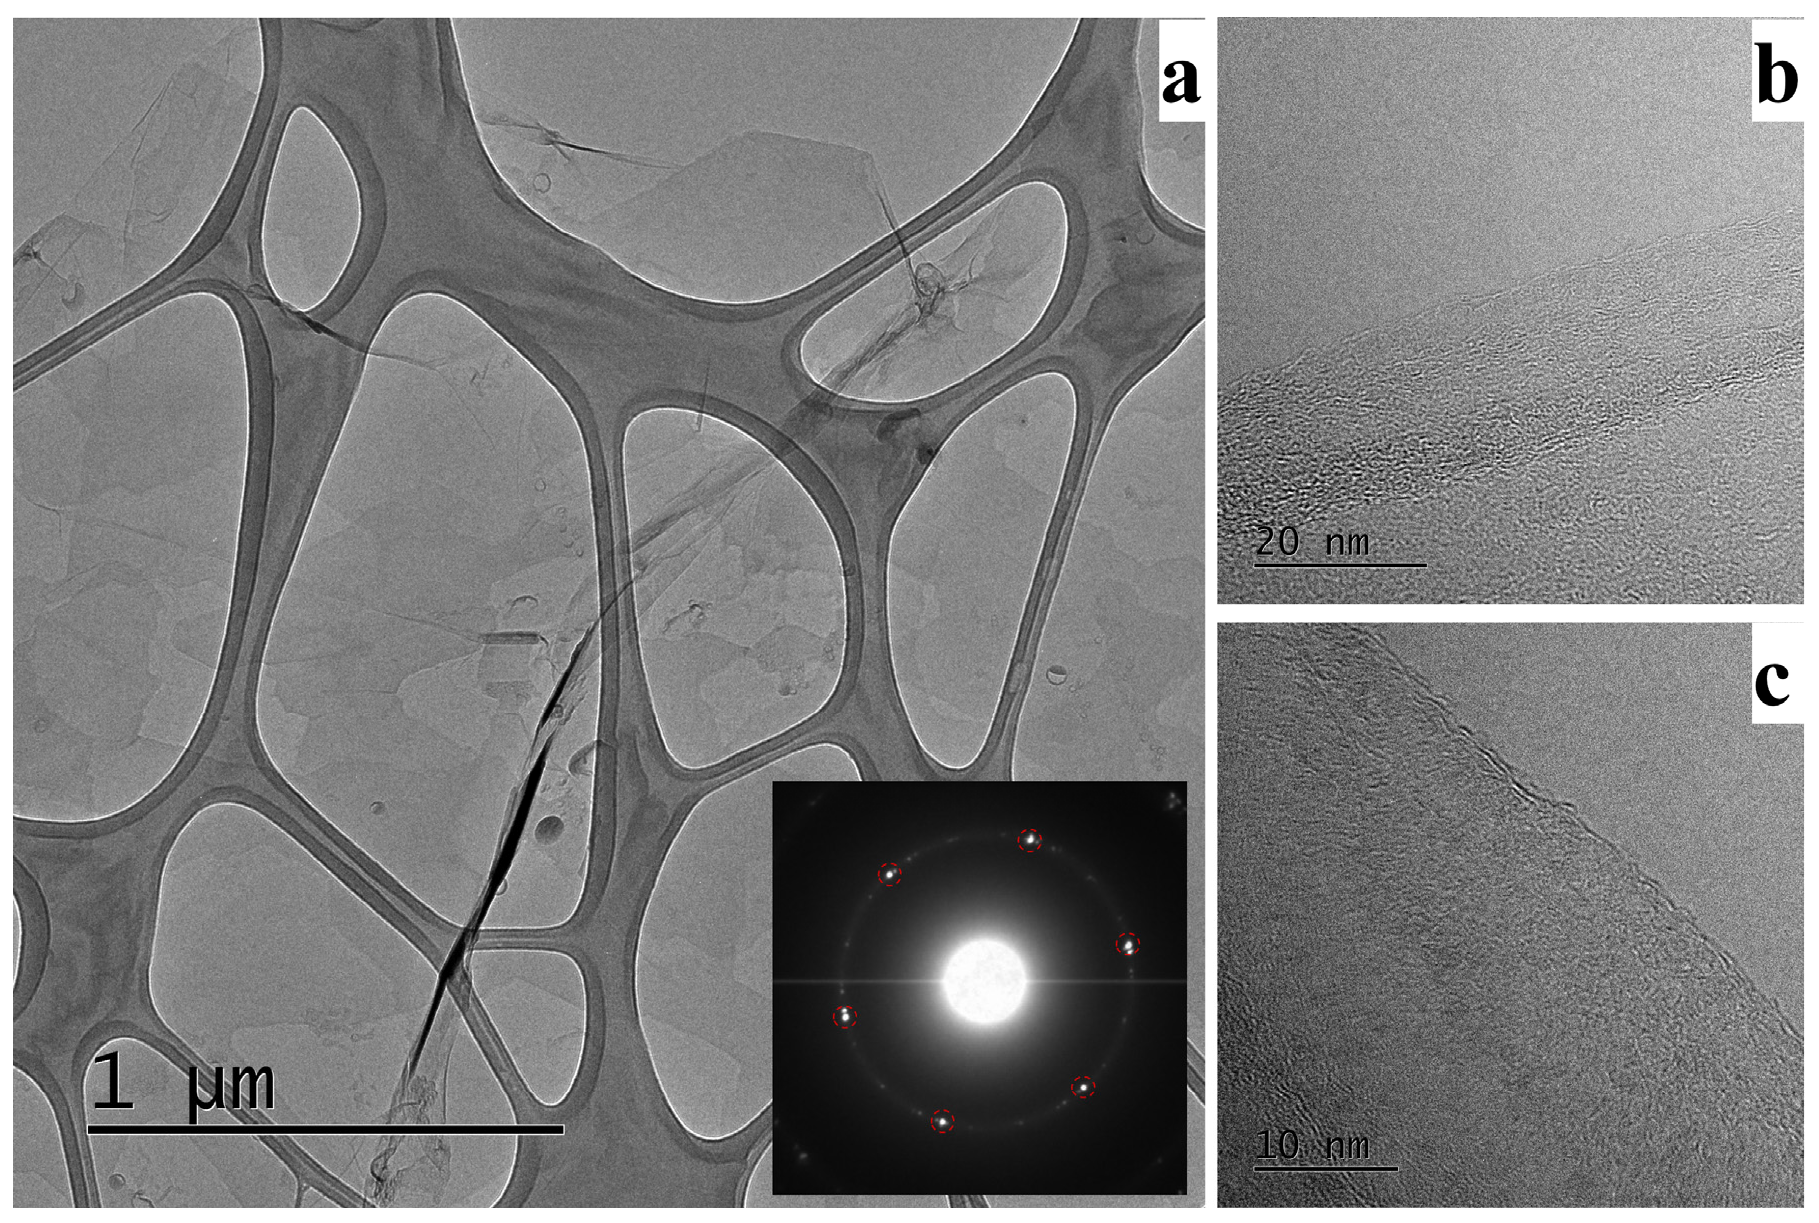
Figure 5.
(a) AFM image of a continuous graphene film on silicon wafer with some brighter spots exhibiting wrinkles and overlapping. Line scans were performed to determine the thickness of the graphene films. (b) Corresponding height profile of the various line scans revealing the thickness of graphene film to be ~5–15 nm demonstrating formation of few layer graphene films.

Figure 6.
Raman spectra of graphene-coated Ni before (curve I) and after (curve II) 24 hours’ eU2A experiment and bare Ni foil (curve III).
Figure 6.
Raman spectra of graphene-coated Ni before (curve I) and after (curve II) 24 hours’ eU2A experiment and bare Ni foil (curve III).
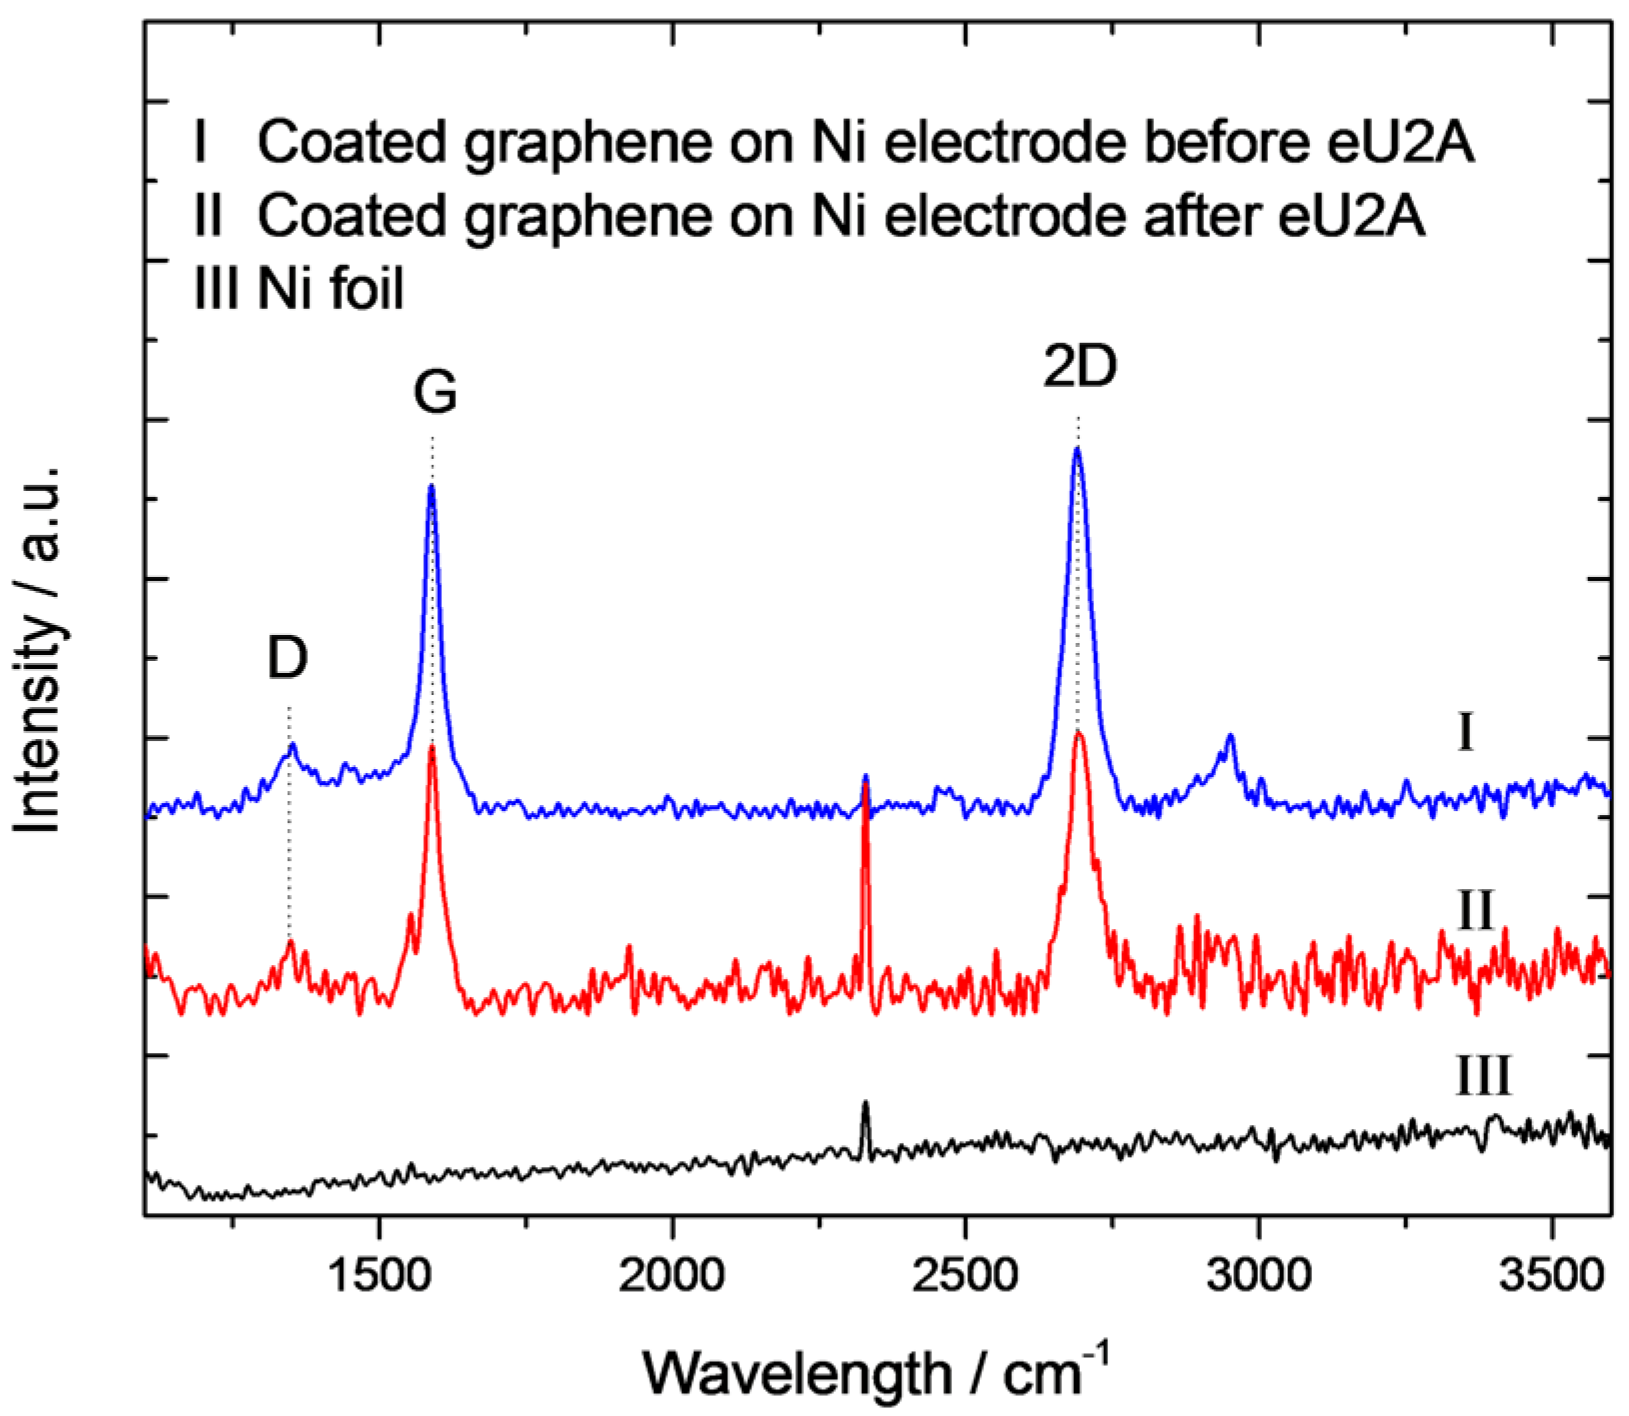
Figure 7.
Normalized—by active geometric area of the electrodes—cyclic voltammograms of 2.5 M K2CO3 in the (a) absence and (b) presence of 5.0 M urea at 70 °C using Ni foil and graphene-coated Ni, at a scan rate of 10 mV s−1.
Figure 7.
Normalized—by active geometric area of the electrodes—cyclic voltammograms of 2.5 M K2CO3 in the (a) absence and (b) presence of 5.0 M urea at 70 °C using Ni foil and graphene-coated Ni, at a scan rate of 10 mV s−1.

Figure 8.
(a) Concentration of generated ammonia in the electrolyte during the eU2A (70 °C, 0.750 V vs. Hg/HgO) process using Ni foil (6.0 cm2) and graphene-coated Ni (2.0 cm2) and its comparison with the THU (70 °C) process in a period of 24 h using 5.0 M urea in the presence of 2.5 M K2CO3. (b) Normalized concentration (per cm2 of the working electrode) of generated ammonia on the electrode surface during eU2A (70 °C, 0.750 V vs. Hg/HgO) process using Ni foil and graphene-coated Ni. Ammonia generation increased in the eU2A compared to the THU process and the generated ammonia per surface area is higher using the graphene-coated Ni than using the Ni foil.
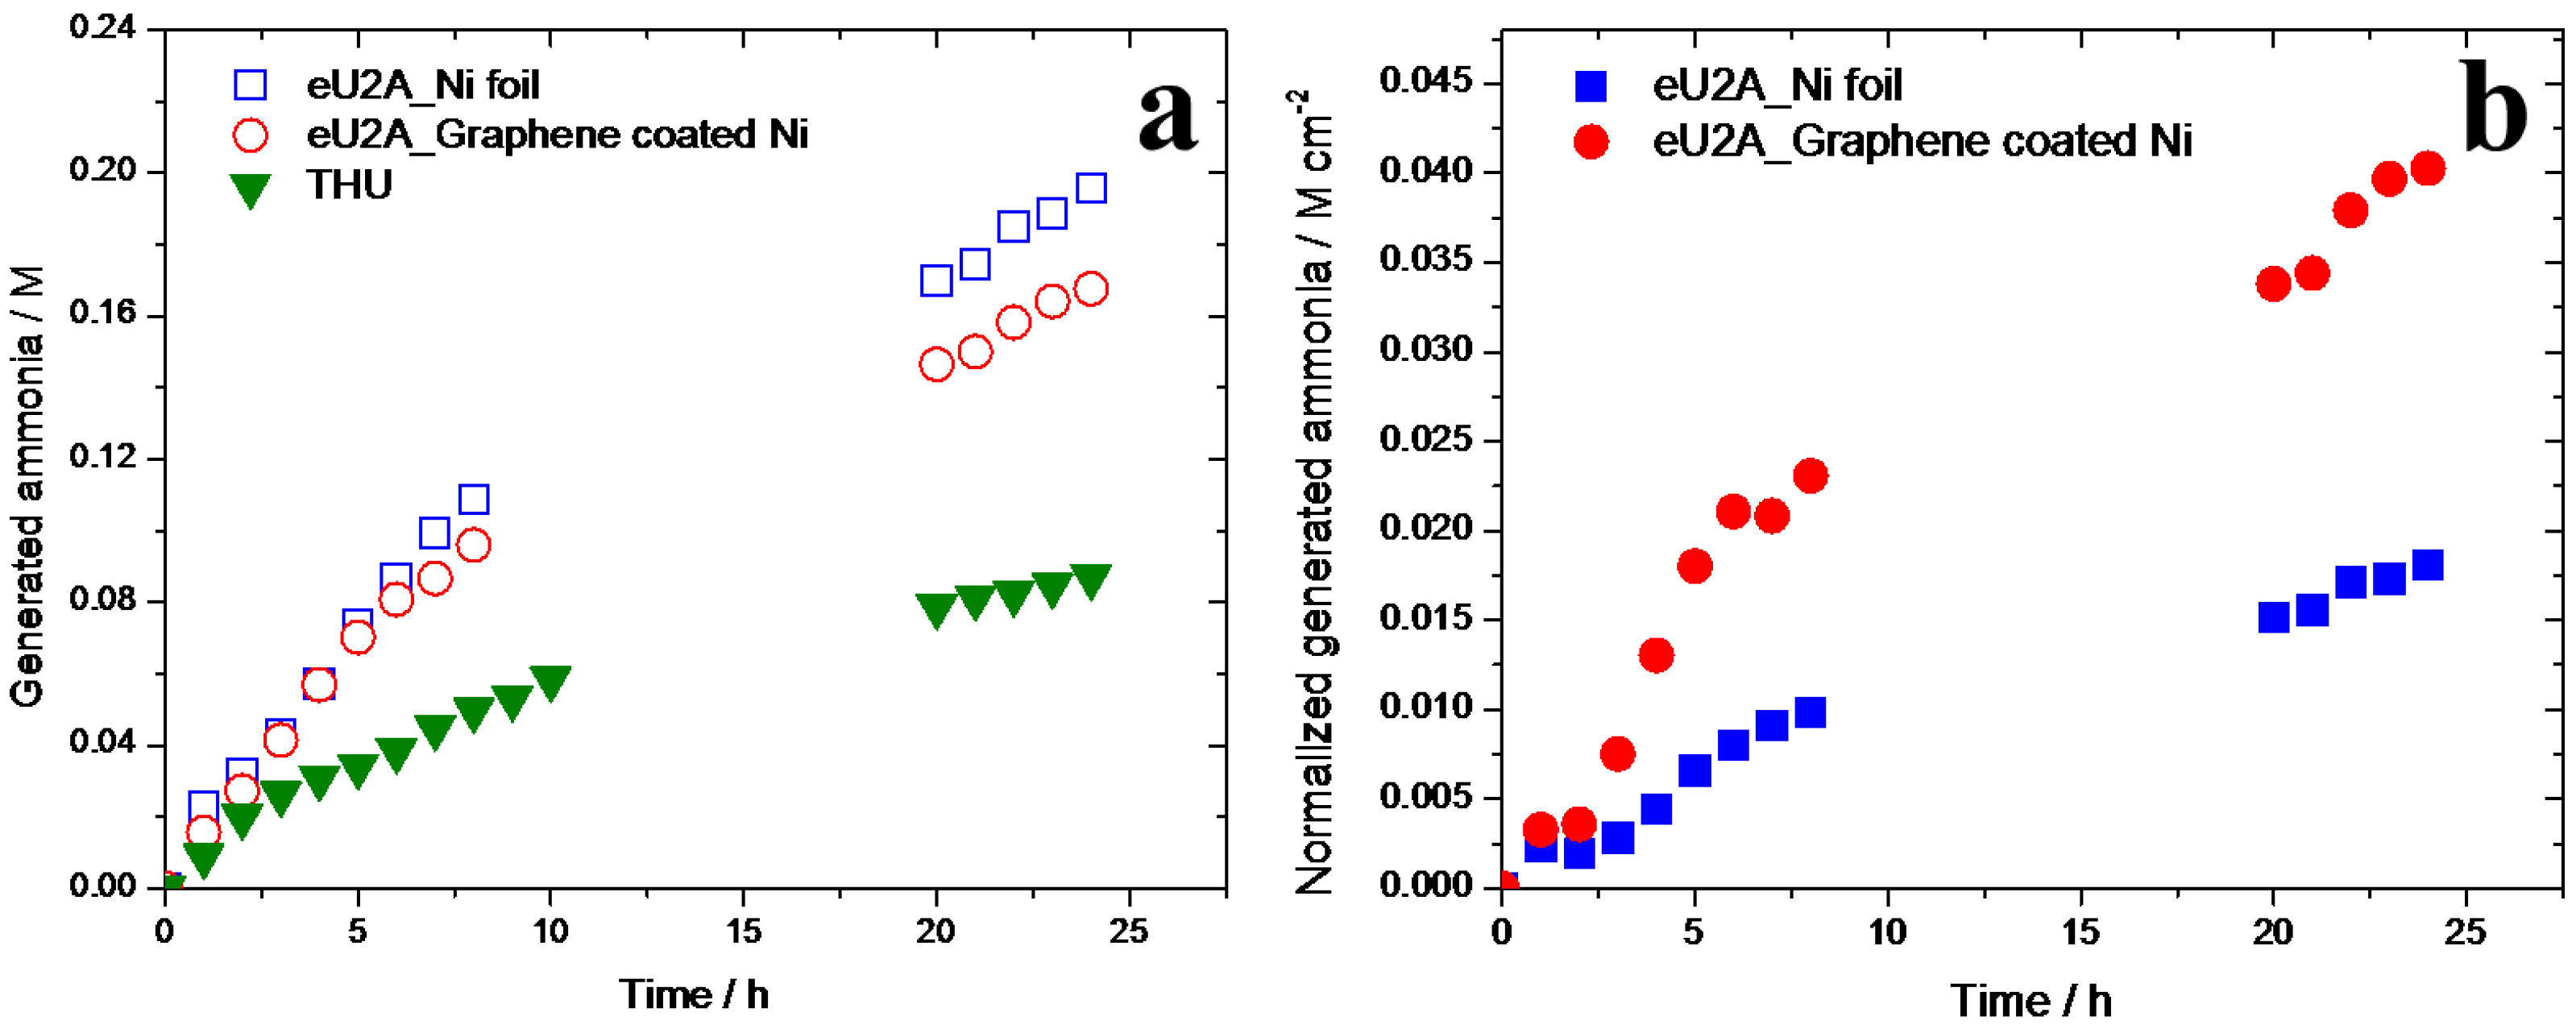
Figure 9.
(a) Normalized concentration of Ni ion (per cm2 of the working electrode) in the electrolyte during 24 h eU2A experiments using Ni foil and graphene-coated Ni working electrodes. (b) pH change during eU2A reactions using Ni foil and graphene-coated Ni. The pH value of the electrolyte is time dependent; pH value is reduced in the eU2A process due to the transformation of K2CO3 to KHCO3 by the generated CO2 from eU2A reaction. With the help of graphene coating, the normalized Ni loss per surface area was reduced by ~20 times.
© 2017 by the authors. Licensee MDPI, Basel, Switzerland. This article is an open access article distributed under the terms and conditions of the Creative Commons Attribution (CC BY) license (http://creativecommons.org/licenses/by/4.0/).
Share and Cite
MDPI and ACS Style
Lu, F.; Botte, G.G. Ammonia Generation via a Graphene-Coated Nickel Catalyst. Coatings 2017, 7, 72. https://doi.org/10.3390/coatings7060072
AMA Style
Lu F, Botte GG. Ammonia Generation via a Graphene-Coated Nickel Catalyst. Coatings. 2017; 7(6):72. https://doi.org/10.3390/coatings7060072
Chicago/Turabian StyleLu, Fei, and Gerardine G. Botte. 2017. "Ammonia Generation via a Graphene-Coated Nickel Catalyst" Coatings 7, no. 6: 72. https://doi.org/10.3390/coatings7060072
Note that from the first issue of 2016, this journal uses article numbers instead of page numbers. See further details here.