Article

Thermal Conductivity Analysis and Lifetime Testing of Suspension Plasma-Sprayed Thermal Barrier Coatings

1
Department of Engineering Science, University West, Gustava Melins Gata 2, Trollhattan 461 86, Sweden
2
Progressive Surface, Grand Rapids, MI 49512, USA
*
Author to whom correspondence should be addressed.
Coatings 2014, 4(3), 630-650; https://doi.org/10.3390/coatings4030630
Submission received: 20 July 2014 / Revised: 7 August 2014 / Accepted: 11 August 2014 / Published: 15 August 2014
(This article belongs to the Special Issue High Temperature Coatings)

Abstract

:
Suspension plasma spraying (SPS) has become an interesting method for the production of thermal barrier coatings for gas turbine components. The development of the SPS process has led to structures with segmented vertical cracks or column-like structures that can imitate strain-tolerant air plasma spraying (APS) or electron beam physical vapor deposition (EB-PVD) coatings. Additionally, SPS coatings can have lower thermal conductivity than EB-PVD coatings, while also being easier to produce. The combination of similar or improved properties with a potential for lower production costs makes SPS of great interest to the gas turbine industry. This study compares a number of SPS thermal barrier coatings (TBCs) with vertical cracks or column-like structures with the reference of segmented APS coatings. The primary focus has been on lifetime testing of these new coating systems. Samples were tested in thermo-cyclic fatigue at temperatures of 1100 °C for 1 h cycles. Additional testing was performed to assess thermal shock performance and erosion resistance. Thermal conductivity was also assessed for samples in their as-sprayed state, and the microstructures were investigated using SEM.

Graphical Abstract

1. Introduction

The development of the gas turbine for propulsion and power generation is pushing the evolution of new materials and processes to allow for greater performance and efficiency [1]. In the hot section of the engine, demands for higher operating temperatures have led to the need for thermal protection for both rotating and non-rotating parts [1,2]. The thermal barrier coating (TBC) allows the operating temperature of the engine to be increased without increasing the operating temperature for the metallic components [1,3].
Traditionally, TBC ceramics have been applied either by air plasma spraying (APS) or electron beam physical vapor deposition (EB-PVD) [4]. APS has the advantage of lower overall cost, higher process flexibility, lower as-sprayed thermal conductivity and long lifetimes [5,6]. However, APS coatings are highly susceptible to sintering, which degrades the mechanical and thermal properties of the coatings [7,8,9]. On the other hand, the EB-PVD process can produce columnar structures that can tolerate larger amounts of expansion and contraction [10], but these coatings tend to be more thermally conductive than APS coatings. Additionally, compared to APS, EB-PVD production requires higher costs and involves more technical limitations. Consequently, EB-PVD coatings are preferred for smaller critical components in the turbine section that experiences centrifugal loading and the highest levels of thermal shock; while, because of the superior thermal insulation properties, APS is commonly used to coat combustor liners.
Strain-tolerant microstructures, known as dense vertically cracked (DVC) or segmented coatings, can be produced with APS by controlling the deposition parameters [11,12,13]. However, achieving this type of microstructure can be more difficult than with the EB-PVD process [11]. Furthermore, DVC coatings typically have a lower porosity content than traditional, non-segmented APS coatings. Therefore, the increased strain tolerance of DVC coatings is accompanied by a decreased thermal insulating ability in comparison to traditional APS coatings.
Suspension plasma spraying has become a promising contender for the production of high performance thermal barrier coating systems, as vertically cracked [14,15], columnar [16] or highly porous coatings [17] are possible to manufacture. Suspension plasma spraying (SPS) coatings can be produced with high levels of porosity that are not normally achievable with APS or EB-PVD coatings [18]. The amount and size of the SPS porosity allows for the reduction in coating thermal conductivity through decreased phonon transport and decreased IR radiation transmittance. As IR radiation is an important contributor to the total heat flux in a combustion environment; the ability to reduce the radiative contribution has an advantage for increased engine performance [19].
This study aims to outline some developments of SPS ceramic coatings in combination with bond coats produced via different thermal spray routes. The lifetime in both thermal fatigue and thermal shock are shown together with the coating thermal properties.

2. Theory of Suspension Fragmentation and Deposition

As with conventional powder thermal spray processes, particle treatment history will directly influence coating morphology and properties. SPS is a far more complicated process, as the particle size on coating deposition is not pre-determined, as it is with powder processes. When injecting a suspension as a solid stream into a DC arc plasma gun jet, the fragmentation of the suspension stream occurs roughly two orders of magnitude faster than the vaporization of the solvent [20]. It is therefore important to consider first the influence of the various conditions on the fragmentation of the suspension and the resulting droplet size.
The droplet sizes generated in the SPS process are a function of two opposing forces: suspension surface tension and viscosity, reducing droplet fragmentation, and shear force exerted by the plasma jet, which acts to further fragment the droplets [21,22]. The balance in these effects will determine the final suspension fragment size in the plasma jet. Such a final fragment may contain one or several solid primary particles depending on the powder size distribution and concentration used to manufacture the suspension [23].
After solvent evaporation, the powder mass in the final suspension fragment determines the size of the depositing molten particle. Therefore, controlling deposition particle size in SPS involves adjusting the fundamental suspension properties of surface tension and viscosity that help govern suspension fragmentation in the plasma jet [24]. Surface tension is controlled by the solvent used in the suspension and is difficult to influence. Viscosity is a function of several parameters, such as solids load, powder size distribution and the addition of any dispersants to the suspension.
The depositing particle size plays an important role in SPS, because it determines the overall characteristics of the coating microstructure. Berghaus et al. demonstrated how, in plasma spraying, decreasing the particle mass at a fixed velocity leads to increasing changes in particle velocity by the drag from the plasma jet flow as it interacts with the substrate [25]. Specifically, zirconia particles with diameters <5 μm tend to follow the flow of the plasma as it changes direction and moves parallel to the substrate. These dynamics can be related to the Stokes number of such particles in the boundary layer close to the substrate. Such small particles having a Stokes number smaller than one, the particle trajectory is expected to be strongly influenced of the plasma drag [21]. Under these conditions, deposition occurs when a particle encounters an asperity on the substrate surface. As the particle size reduces, then the trajectory before deposition becomes increasingly parallel to the substrate. VanEvery et al. proposed differing deposition regimes depending on the particle size and, therefore, impact trajectory [16]. When particles are sufficiently small, the shallow angle at which the particle will come into contact with the substrate results in the generation of columnar structures. If the particle size is increased, then the influence in the plasma stream drops, and the trajectory becomes more normal to the substrate. This change results in the intermediate cracked-columnar structure. If the particles are sufficiently large, then their momentum is not influenced significantly by the plasma flow, and deposition occurs in the same fashion as in conventional APS deposition. Therefore, columnar structures suitable for thermal barrier coatings can be generated though the control of both suspension and plasma conditions.

3. Experimental Procedures

3.1. Suspension Parameters

The suspension used in this study was an 8 wt% yttria-stabilized zirconia (YSZ) material produced by Treibacher Industrie AG (Althofen, Austria). Due to the complexity of the SPS process, a number of factors will be held constant within this study. The suspensions used ethanol as a solvent; therefore, surface tension can be ignored as a factor. Suspensions contained the same solids loading of 25% by weight. Two size distributions were used for this study: a nano-suspension with a median particle size of approximately 50 nm and a sub-micron suspension with a median particle size of 500 nm. Rheology measurements at a shear rate of 1000 (1/s) for the two suspensions show that the nano-suspension had a viscosity of 5.9 mPa·s compared to 1.73 mPa·s for the sub-micron suspension. The nano-suspension displays a viscosity roughly 3-times greater than the sub-micron suspension, due to the smaller particle size in the suspension [22].

3.2. Sample Production

In combination with the two suspensions, three bond coat application techniques were used in order to produce a total of 5 experimental SPS TBC systems together with one reference TBC system. The samples in this study are summarized in Table 1, with each row representing one of the 6 coating types. For bond coat application, two well-established methods—high velocity oxy-fuel spraying (HVOF) and air plasma spraying (APS)—were used for producing the first two bond coat types. The third type was produced using the more recently developed high-velocity air-fuel (HVAF) technique; effectively a development of the HVOF process in which compressed air is utilized instead of oxygen gas.
Table 1. Experimental coatings and their respective production routes. HVOF, high velocity oxy-fuel spraying; HVAF, high-velocity air-fuel; SPS, suspension plasma spraying; DVC, dense vertically cracked; APS, air plasma spraying.
CoatingIDBond coat methodBond coat feedstockBond coat thickness (µm)Top coat feedstockTop coat conditionTop coat thickness (µm)
H1HVOFAMDRY 365-1161Nano suspensionType 1 SPS339
H2HVOF161Type 2 SPS320
P1PlasmaAMDRY 365-2186Type 1 SPS325
P2Plasma186Type 2 SPS275
A3HVAFAMDRY 386-2220Sub-micron suspensionType 3 SPS303
DVCPlasmaAMDRY 386-4168PowderDVC-APS444
The HVOF samples were sprayed using the gas-fuelled DJ-2600 hybrid gun (Sulzer Metco, Wohlen, Switzerland), and the air plasma spray coatings were produced with a F4-MB gun (Sulzer Metco, Wohlen, Switzerland). The HVOF and APS bond coats were both produced using a proprietary NiCoCrAlY alloy powder, AMDRY 365 (Sulzer Metco, Wohlen, Switzerland), with powder cuts selected appropriately for deposition technique. These samples are labeled “H” and “P”, respectively. The HVAF bond coat type was sprayed using the Uniquecoat M3 gun (Uniquecoat, Richmond, VA, USA). The powder used in this case was the proprietary NiCoCrAlY, AMDRY 386-2 powder. AMDRY 386 differs by having additions of <1% Hf and <0.7% Si. These samples are labeled “A”.
As a reference sample for the study, DVC coatings were also produced via APS using the 100HE plasma spray system (Progressive Surface, Grand Rapids, MI, USA). Bond coats were produced using a proprietary NiCoCrAlY AMDRY 386-4 (Sulzer Metco, Wohlen, Switzerland) material. This powder differs from AMDRY 386-2 only in the powder size distribution chosen to be more suitable for plasma spraying. Top coats were produced using a proprietary 8 wt% YSZ powder; SPM-2000 (Sulzer Metco, Wohlen, Switzerland). These DVC coatings represent the state-of-the-art when discussing strain-tolerant APS coatings.
The substrates used for thermo-cyclic fatigue testing samples in this study were Haynes 230 alloy with a size of 50 mm × 30 mm × 5 mm. All other samples used Hastelloy-X as a substrate material. The plates for microstructural analysis were 25 mm × 25 mm × 1.6 mm. Test buttons for thermal shock testing were 25 mm in diameter and 6 mm thick.

3.3. SPS-Specific Coating Deposition Conditions

SPS coatings were deposited using the 100HE Plasma system and the LiquifeederHE suspension feed system (Progressive Surface, Grand Rapids, MI, USA). For illustration purposes, a close up image of the spray process is shown in Figure 1. The suspension stream can be observed entering the plasma jet, after which, it is atomized in the jet. For all SPS coatings in this study, the plasma gun conditions were the same, consisting of a power level of 105 kW and a stand-off distance of 70 mm. The suspension was fed into the plasma jet using a solid stream nozzle mounted orthogonal to the plasma flow at a flow rate of 45 mL/min.
Figure 1. Suspension plasma spraying using the 100HE plasma system.
Coatings 04 00630 g001
In order to produce different coating structures, the surface speed of the samples relative to the torch was varied by increasing the rotational speed of the sample holder during spray deposition. Type 1 coatings were produced with a surface speed of 380 mm/s. Type 2 coatings were produced with a surface speed of 600 mm/s. Both Type 1 and 2 samples utilize the nano-suspension, as shown in Table 1. Type 3 coatings were produced using the sub-micron suspension and a surface speed of 1015 mm/s. For each coating type, the top coat was applied to all sample substrates during a single SPS experiment, e.g., the H1 and P1 samples were coated together. Again, the summary of coatings can be seen in Table 1.
Specimens for SEM analysis were sectioned using a diamond cutting blade and mounted in low viscosity epoxy-based resin using a vacuum impregnation technique. Samples were subsequently polished using well-established methods for TBC specimens. Gold sputtering was used to allow the ceramic layers to be observed in the SEM.

3.4. Thermo-Cyclic Fatigue

Thermo-cyclic fatigue (TCF) testing was performed primarily to study the ability of a coating to resist high temperature oxidation and the stress of oxide growth at high temperature. While failure in TCF testing is driven by bond coat oxidation, the ability of the top coat to survive thermal shock and the stress of oxide growth will also determine the final lifetime of the coating [5]. The TCF test is a simplification of a real exposure test in that once the sample has passed its transient heating period, there is no thermal gradient present across the coating system. As such, the choice of testing temperature is dictated by the upper operating limit for the substrate and NiCoCrAlY bond coat used in the coating system.
For each coating group, four samples were prepared for testing. TCF testing involved placing samples in an automated cycling furnace at 1100 °C for a period of 1 h. After the heating period, the samples moved from the hot zone to a cool zone, where they were immediately photographed. The samples were then force-cooled with compressed air at 25 °C. Cooling resulted in a sample temperature of no more than 100 °C within 10 min of the cooling cycle start. After the cooling cycle was completed, the samples were returned to the hot zone for another heating cycle. Failure was considered to have occurred when 20% of the ceramic surface de-bonded. Failed TCF samples were mounted in low viscosity epoxy-based resin and prepared for microscopic analysis to assess the coating microstructure at failure.

3.5. Thermal Shock Testing

Thermal shock testing investigates the ability of coatings to survive very rapid heating and cooling events. Such testing primarily checks the ability of the coating to cope with the stress of thermal expansion mismatch, sintering and thermal gradients. Unlike TCF testing, the influence of the oxidation of the bond coat is of less importance, as the exposure time at elevated temperatures is short and the bond coat/ceramic interface temperature is some 100 °C lower.
Thermal shock samples were prepared from 25 mm-diameter, 6 mm-thick buttons coated with the complete TBC system. Before testing, overspray was ground away from the edge of the sample and the button mounted to a carrier plate using a single spot weld. Thermal shock testing was conducted using a burner rig at GKN Aerospace (Trollhättan, Sweden) [26]. Samples were subjected to 75-s cycles with heating to surface temperatures of 1200 °C, bond coat temperatures of approximately 1000 °C and rear face temperatures of between 960 and 980 °C. Samples were preheated before the test start to 600 °C from the rear face of the sample with hot air guns. The fuel gas used in the combustion burners was propane. Samples were monitored once per revolution of the test fixture using a video recording system and pyrometer measurements. Failure was deemed to have occurred when 20% of the ceramic surface had spalled from the test sample. The results are accurate to within the nearest 4 cycles of failure.

3.6. Thermal Conductivity Analysis

The thermal conductivity of the coating systems was determined using the laser flash method that has been long accepted for the analysis of coating thermal properties and has been discussed in detail by Taylor [27]. Ten millimeter-diameter samples for thermal property evaluation were water-jet cut from coated plates of 25 mm × 25 mm. For each coating group, a minimum of four samples were measured. The thermal diffusivity for the complete coating system was measured using a Netzsch LFA 247 (Netzsch Gerätebau GmbH, Selb, Germany). During thermal diffusivity measurements, a laser pulse of known pulse width is fired at the sample rear face. An infra-red detector above the front face of the sample records the temperature increase on the front face due to the laser energy. In order to minimize the radiation effects and maximize heat absorption, the sample is commonly placed with the substrate face towards the laser. Because a YSZ coating is transparent to IR radiation, a thin film of carbon or gold was applied to the top coat surface; this layer prevents direct detection of heat radiating from the bond coat. Measurements at room temperature were performed in an air atmosphere. High temperature measurements (>30 °C) were performed under a dynamic argon atmosphere at atmospheric pressure. Argon gas is used to prevent oxidation of the sample at high temperatures.
The thermal diffusivity of the sample can be calculated using the formula:
α = (0.1388 × L2)/(t (0.5))
where α is the thermal diffusivity (m2·s−1); L is the thickness of the sample; and t (0.5) is the half time taken for the total temperature rise. For this study, the various coatings were measured as a complete TBC system (ceramic, bond coat and substrate). In this case, the ceramic layer is treated as an unknown within a three-layer system, where the thickness, thermal diffusivity, density and specific heat capacity for the substrate and bond coat have been measured previously.
The specific heat capacity of the YSZ material was measured using a DSC 404C differential scanning calorimeter (Netzsch Gerätebau GmbH, Selb, Germany). Measurements of both the bond coat and substrate materials had been completed previously [9]. The density of the ceramic coatings was measured using Archimedes displacement. The thickness of the layers within the coating system was evaluated from microstructural cross-sections using an average of more than 25 measurements of layer thickness along the cross-section of the sample. Finally, calculation of the thermal conductivity was performed using the Proteus thermal analysis software (Netzsch Gerätebau GmbH, Selb, Germany) using the three-layer model according to Clark-Taylor, which accounts for heat loss with pulse correction.

3.7. Erosion Testing

Erosion testing was performed at GKN Aerospace Engine Systems according to a standard erosion test procedure. Erosion testing involves feeding of alumina powder though a blast feeding nozzle at 60 degrees to the sample surface at a distance of 10 cm. The test uses alumina grit-blast media of a median particle size 50 µm. The calibration of the erosion rate is first accomplished using a polycarbonate reference piece. The test is run for 40 s, after which the sample is removed. The depth of the erosion pit generated during the test is then measured using a micrometer gauge. The erosion test is repeated on a minimum of 3 samples in order to evaluate erosion resistance.

4. Results and Discussion

4.1. Microstructure

When discussing the microstructures of the SPS layers produced in this study, it is important to mention that differences in microstructure relate to three possible changes in the experimental set-up:
  • Bond coat surface roughness;
  • Suspension properties;
  • Surface speed during coating deposition.
Example microstructures for Type 1 and 2 coatings are displayed for HVOF and APS bond coats in Figure 2 and 
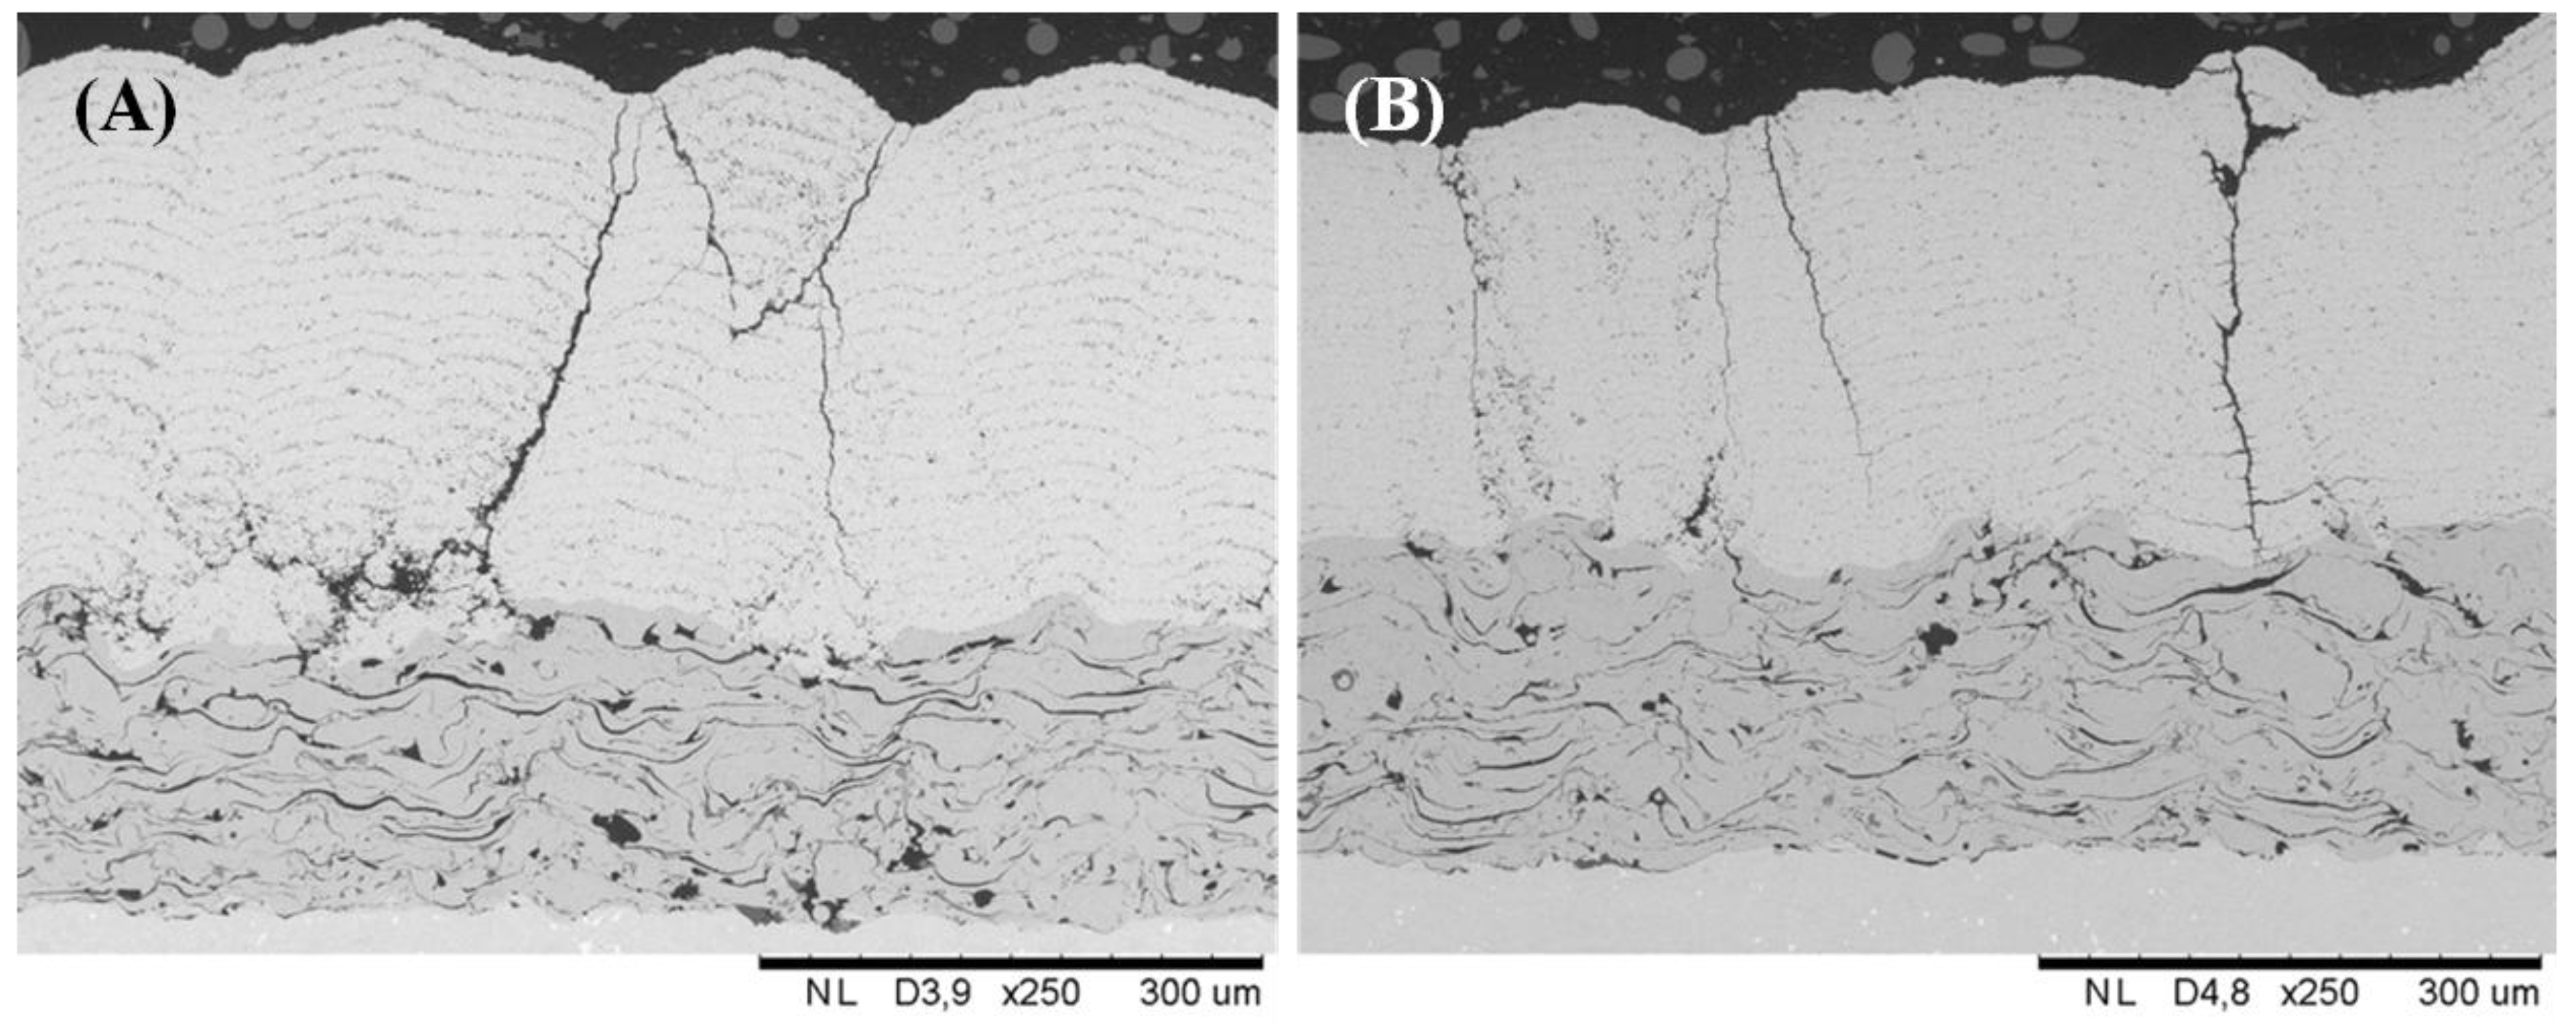
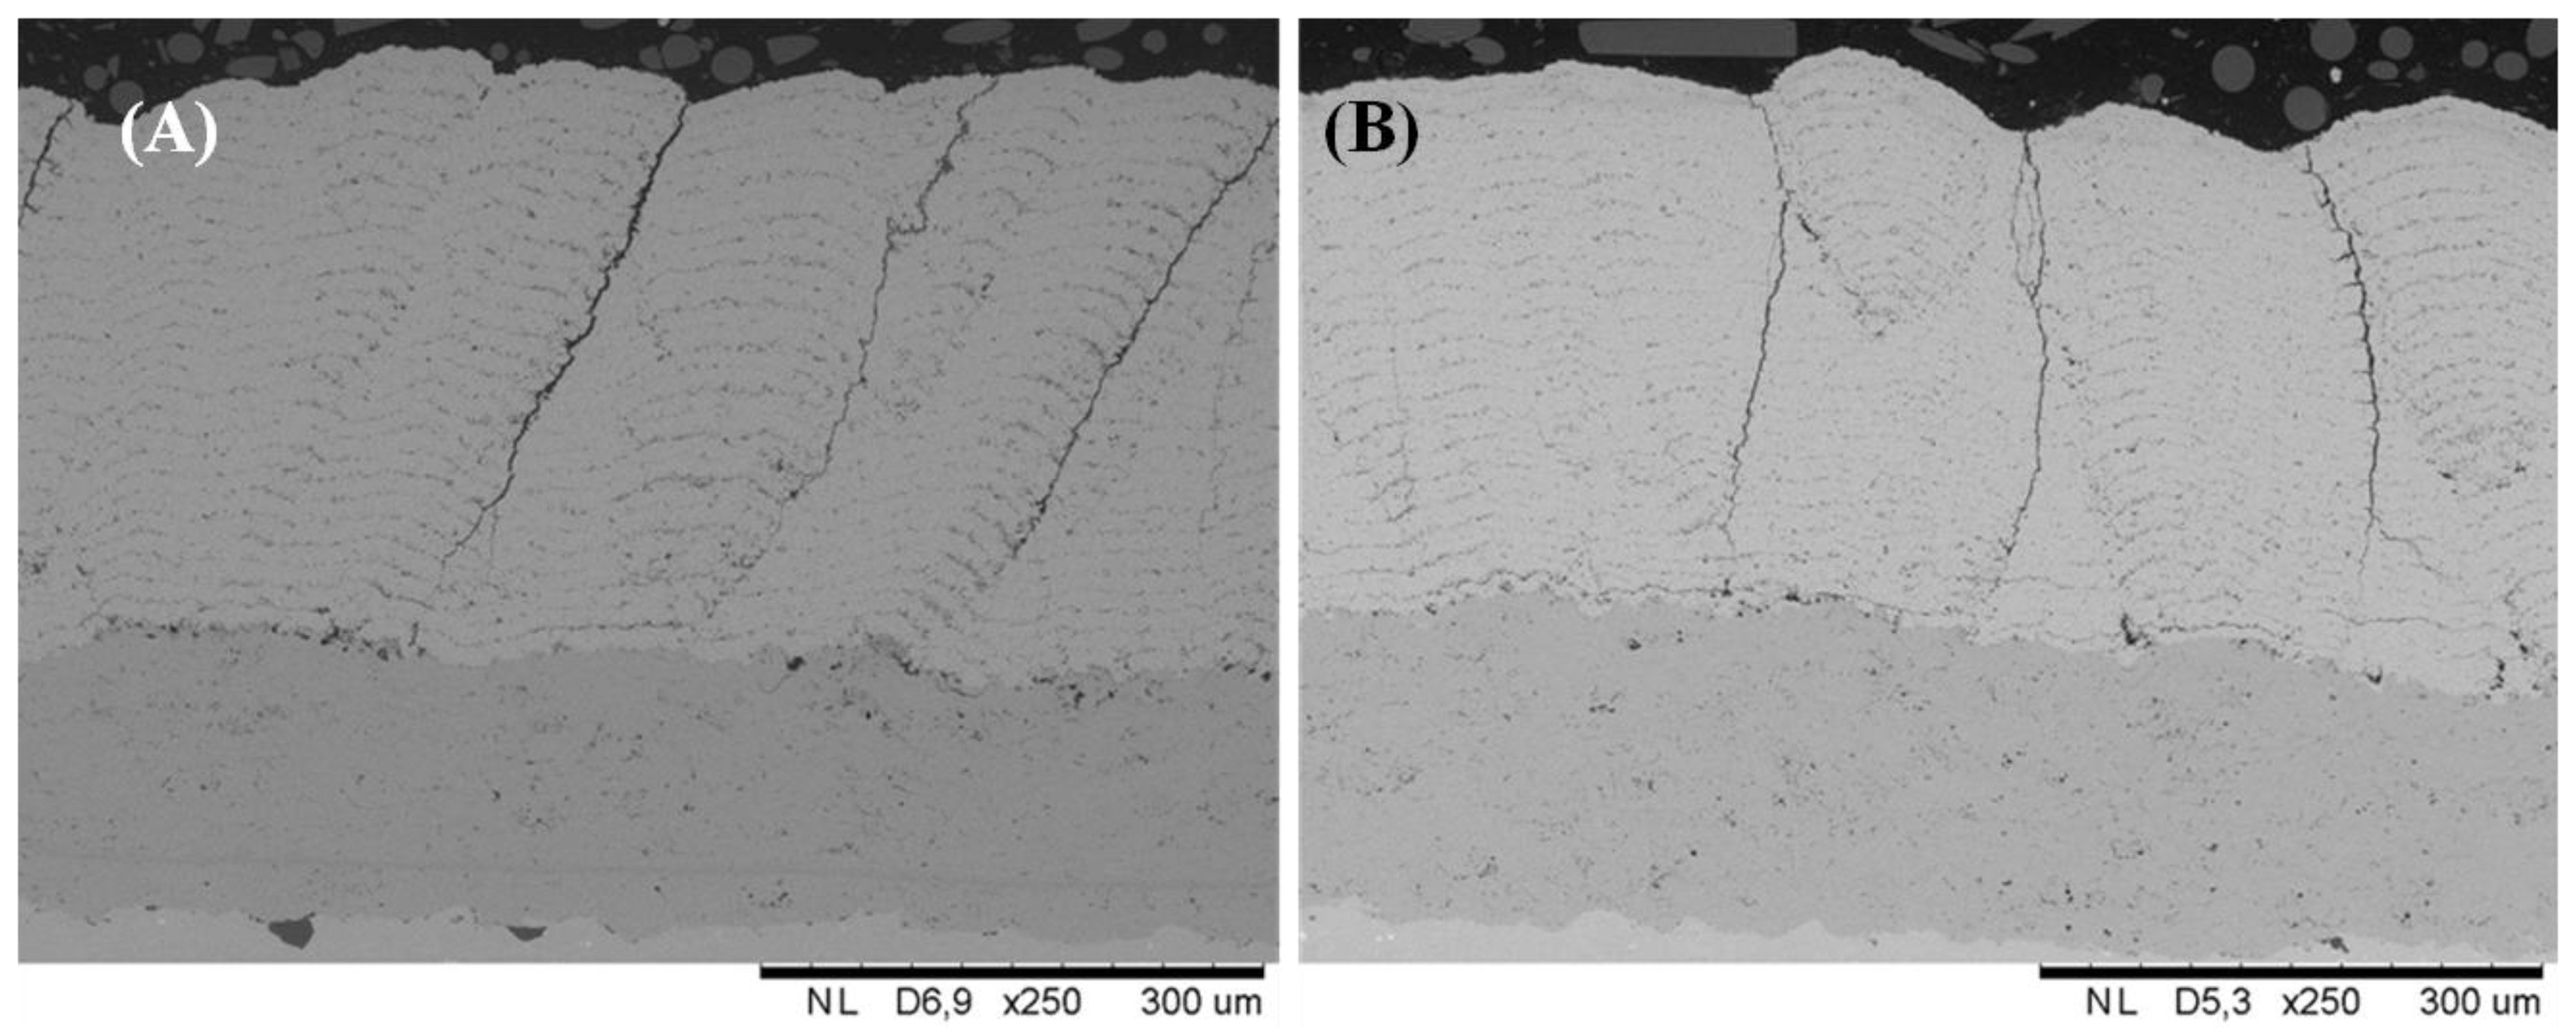
Figure 3, respectively. In the case of the Type 1 and 2 coatings, a nano-suspension was used for spraying. Due to its higher viscosity, the nano-suspension leads to larger fragmented suspension droplets, generating larger spray particles that results in what shall be referred to as a cracked-columnar structure.
Figure 2. HVOF bond coat with Type 1 SPS coating (H1) (A); HVOF bond coat with Type 2 SPS coating (H2) (B).
Coatings 04 00630 g002
Figure 3. Plasma bond coat with Type 1 SPS coating, (P1) (A); plasma bond coat with Type 2 SPS coating (P2) (B).
Coatings 04 00630 g003
The differences in microstructure between coatings deposited on HVOF bond coats (see Figure 2) versus APS bond coats (see Figure 3) are due to the surface roughness differences of the bond coats. As coating build-up is influenced by the asperities on the substrate, coatings (P1 or P2) that formed on a rough surface, such as a plasma-sprayed bond coat, will form wider and less uniform columns than those (H1 and H2) on a smoother surface, such as an HVOF bond coat. It can be observed that the Type 1 coatings (H1 and P1) have more pronounced layers within the cross-section that are separated by zones of higher porosity, which are attributed to the overspray between deposited layers. This overspray results from the deposition of particles treated in the plasma periphery that land ahead of and behind the material within the plume core as the plasma moves over the substrate. Because the particles in the plume periphery experience less heating from the plasma and more cooling from the atmosphere, they tend to deposit in a partially-molten or solid state, which reduces spreading during impact and produces higher porosity zones. Hence, the lower surface speed during deposition is primarily responsible for the presence of more distinct inter-pass porosity layers in the Type 1 coatings, as compared to the Type 2 coatings, which were produced with roughly twice the surface speed.
The microstructure of a Type 3 (A3) coating produced with the sub-micron suspension is shown in 
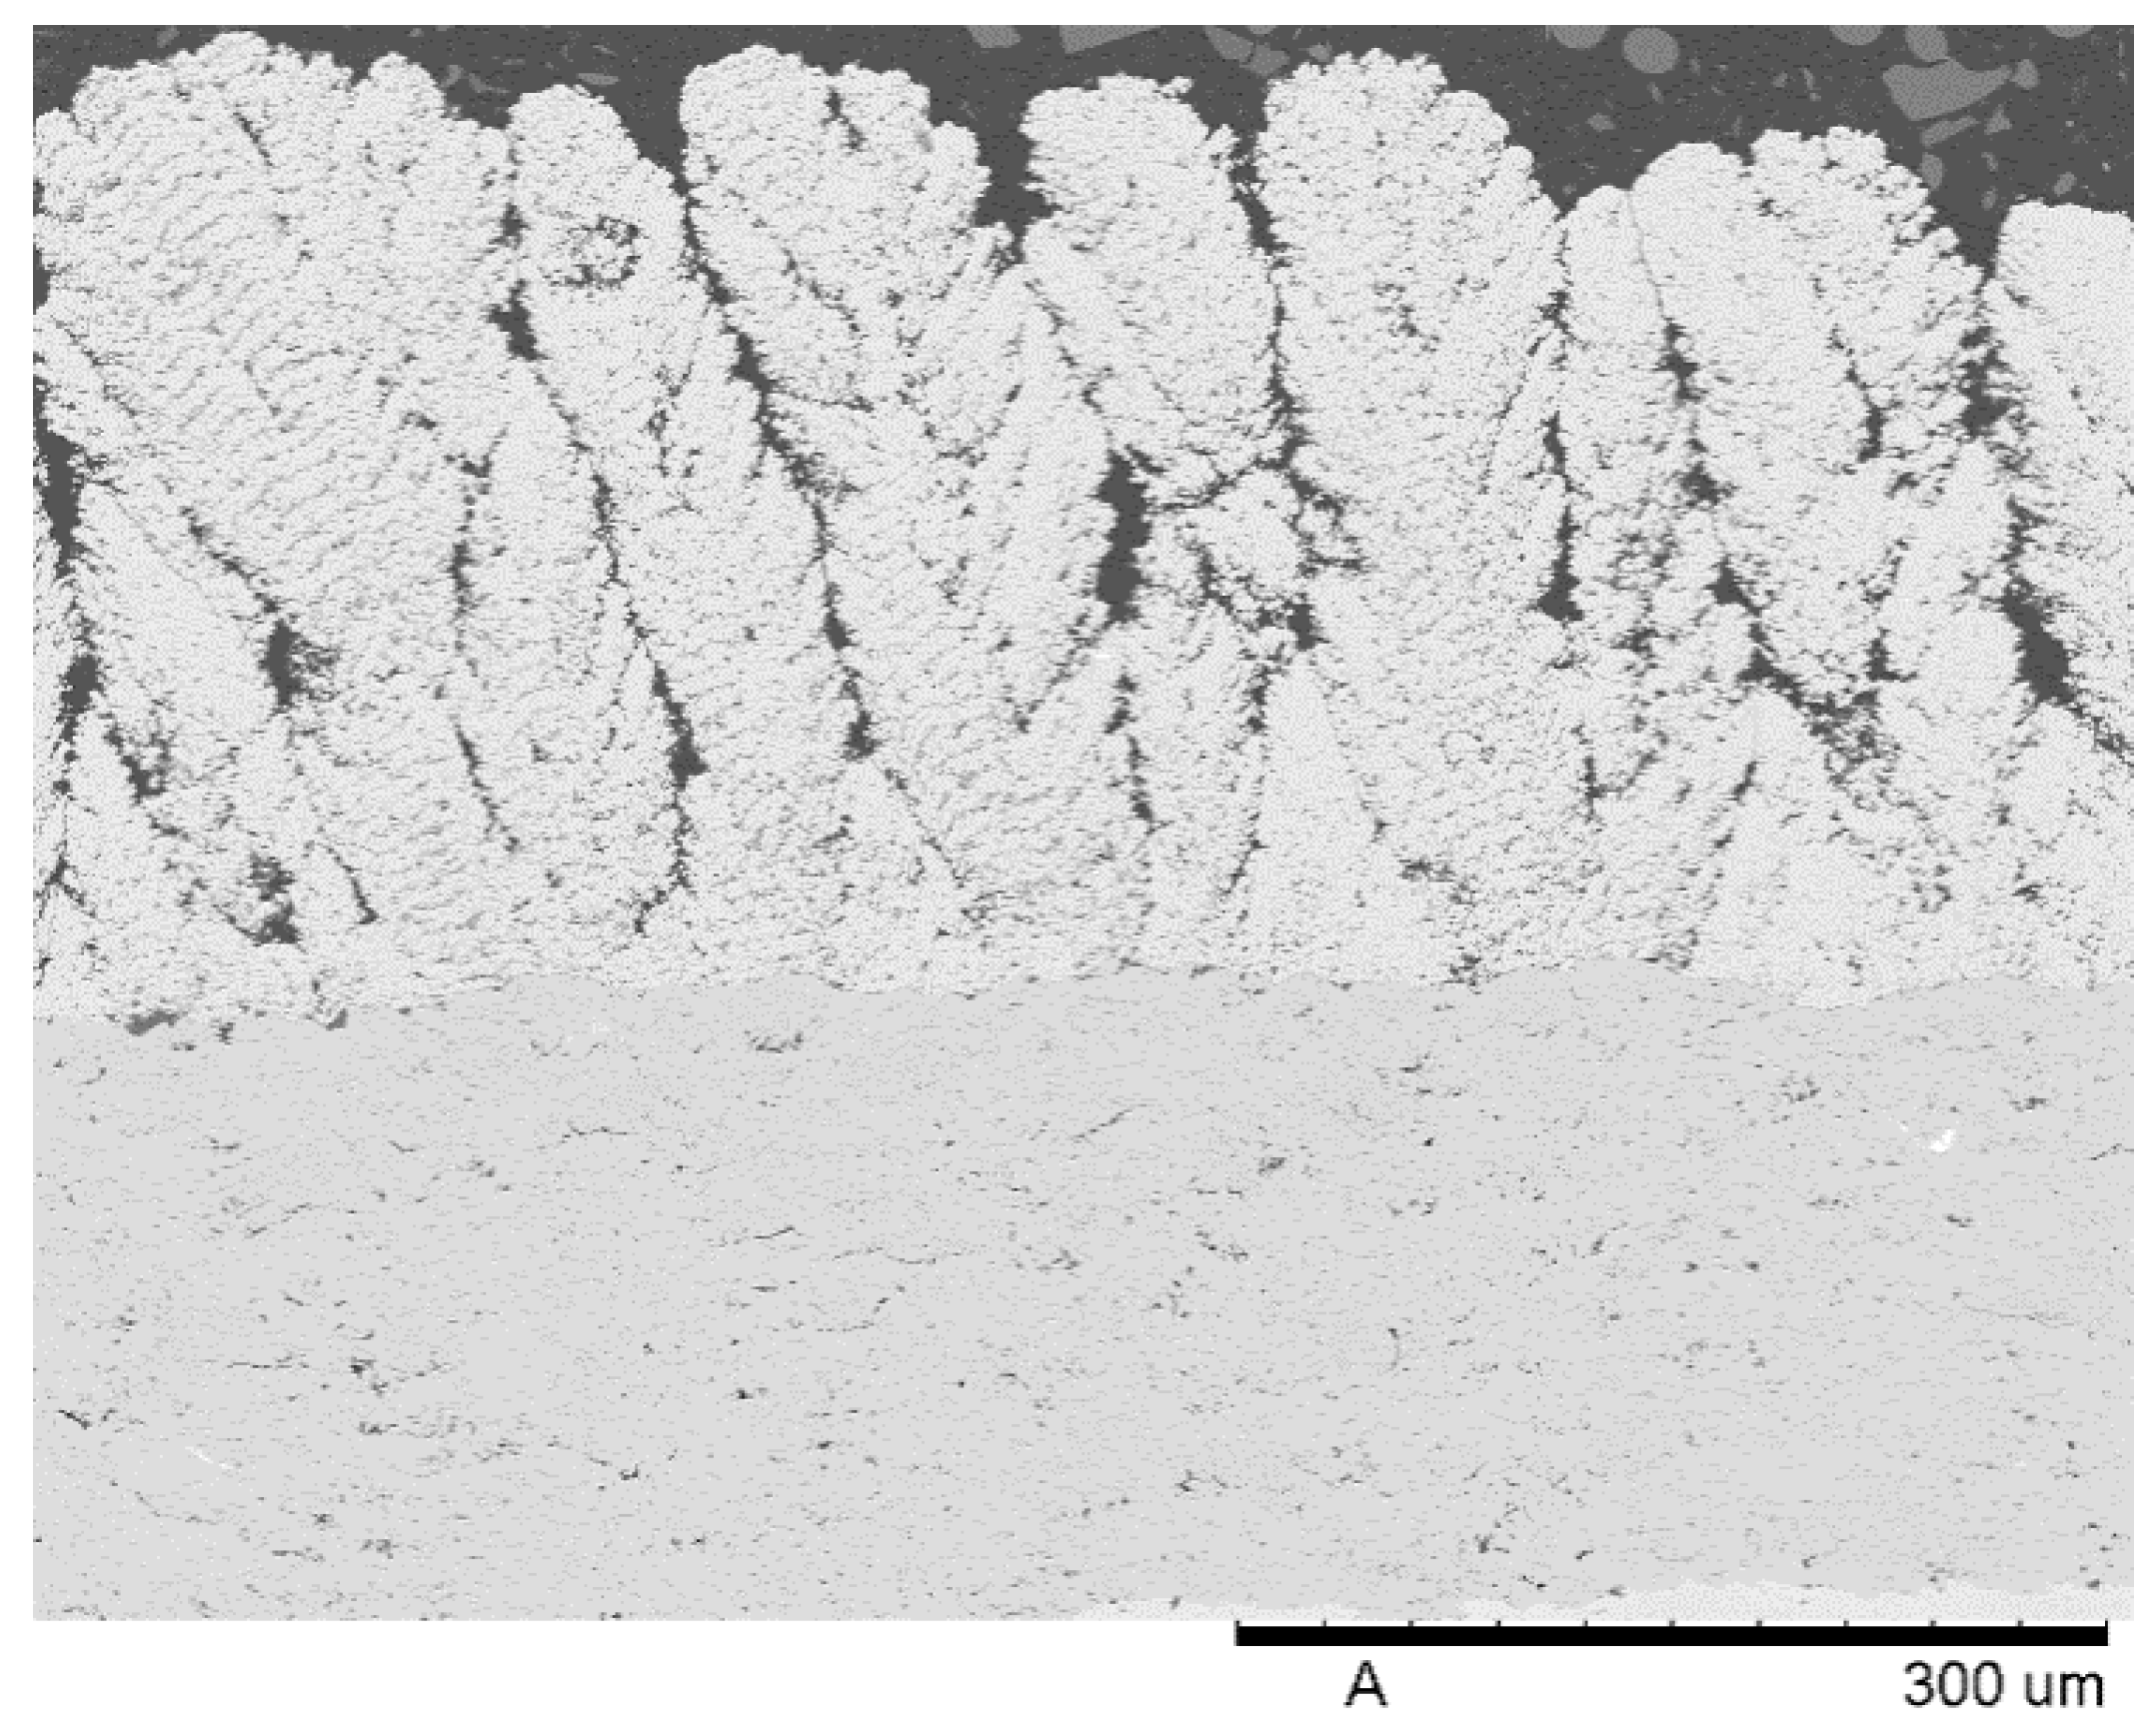
Figure 4. Compared to the nano-suspension coatings, the samples were composed of significantly narrower columns with a higher degree of branching along their length. The sub-micron suspension displays a lower viscosity than the nano-suspension used for the Type 1 and 2 samples. This fact results in smaller droplets generated during suspension break-up. The resulting smaller spray particles are more susceptible to plasma flow changes close to the substrate surface, which enhances the formation of columnar structures in the coating. Furthermore, like the Type 1 and 2 coatings, the A3 coatings were influenced by the surface topography of the substrate due to the build-up of material on asperities. The HVAF bond coat used for the A3 coatings has a lower roughness than either the HVOF or APS bond coats, meaning that the surface asperities are more closely spaced, which results in more columns per unit surface area relative to the other coatings.
Figure 4. HVAF bond coat with Type 3 SPS coating (A3).
Coatings 04 00630 g004
The reference APS DVC microstructure can be seen in 
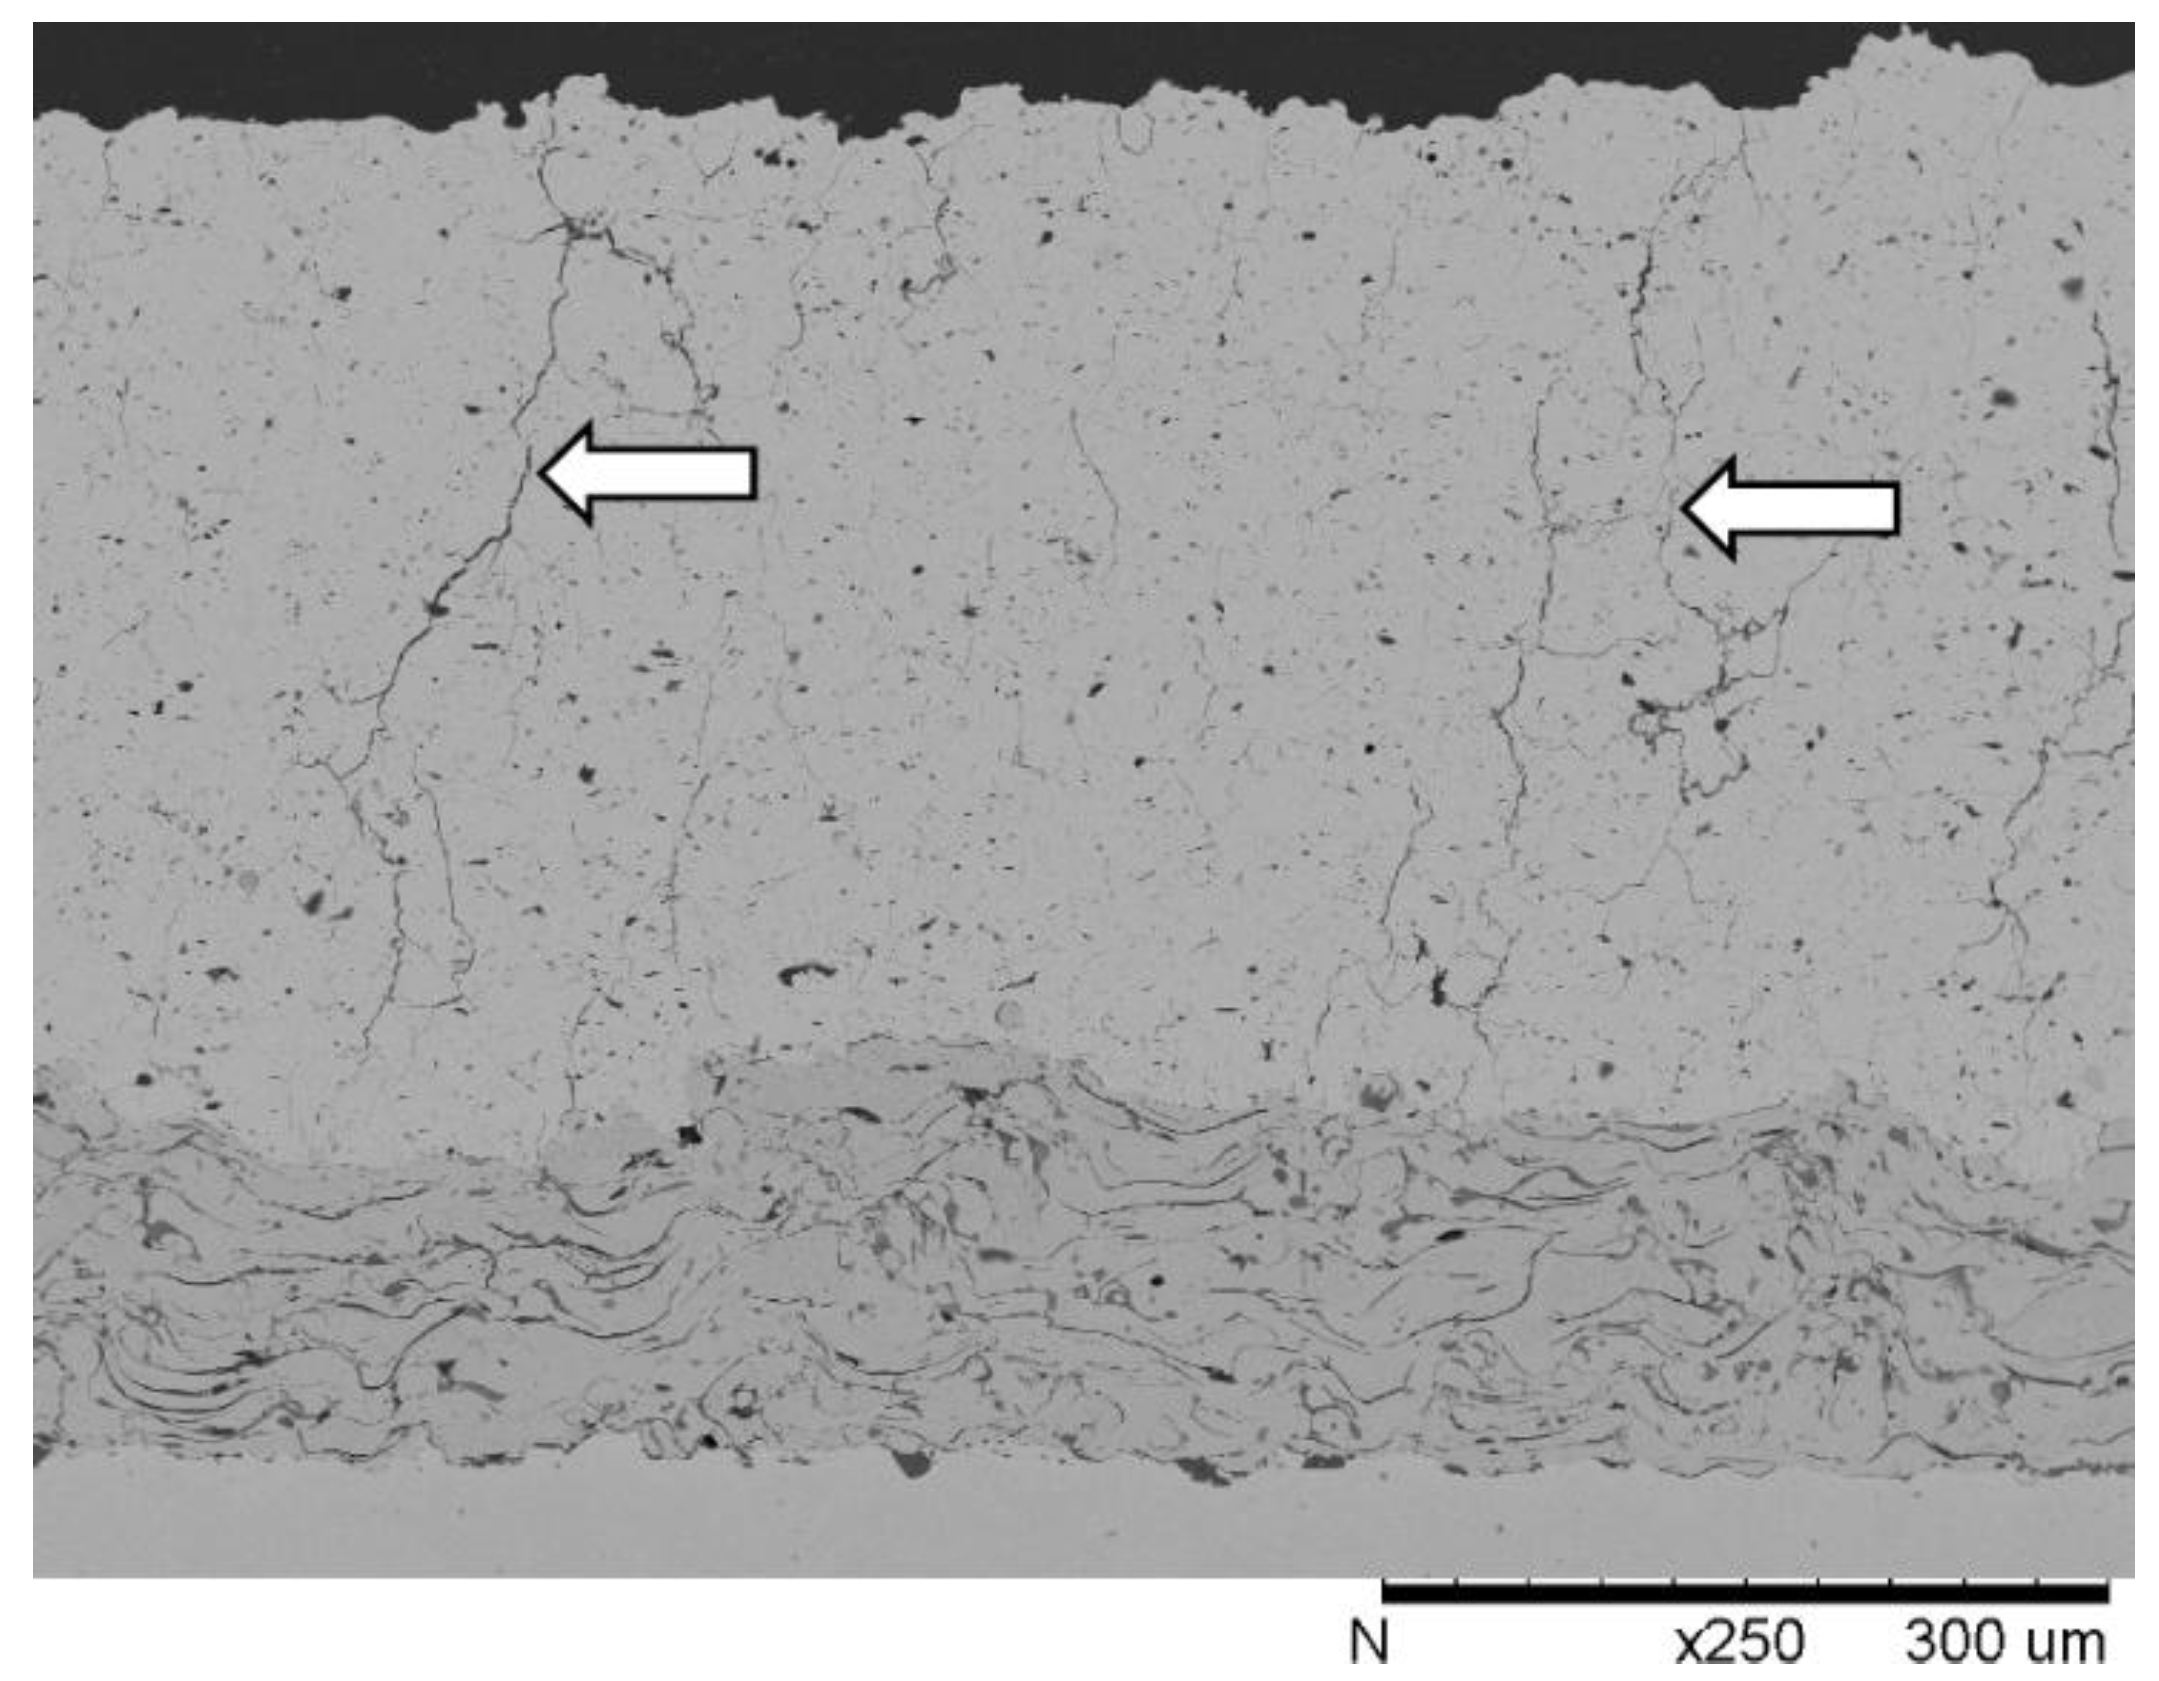
Figure 5. As is common within these coatings, vertical cracks (indicated by arrows) are shown along the length within the coating cross-section. Additionally, the area between the cracks is characterized by isolated pores and regions of dense microstructure.
Figure 5. Dense vertically cracked APS coating with vertical cracks arrowed.
Coatings 04 00630 g005

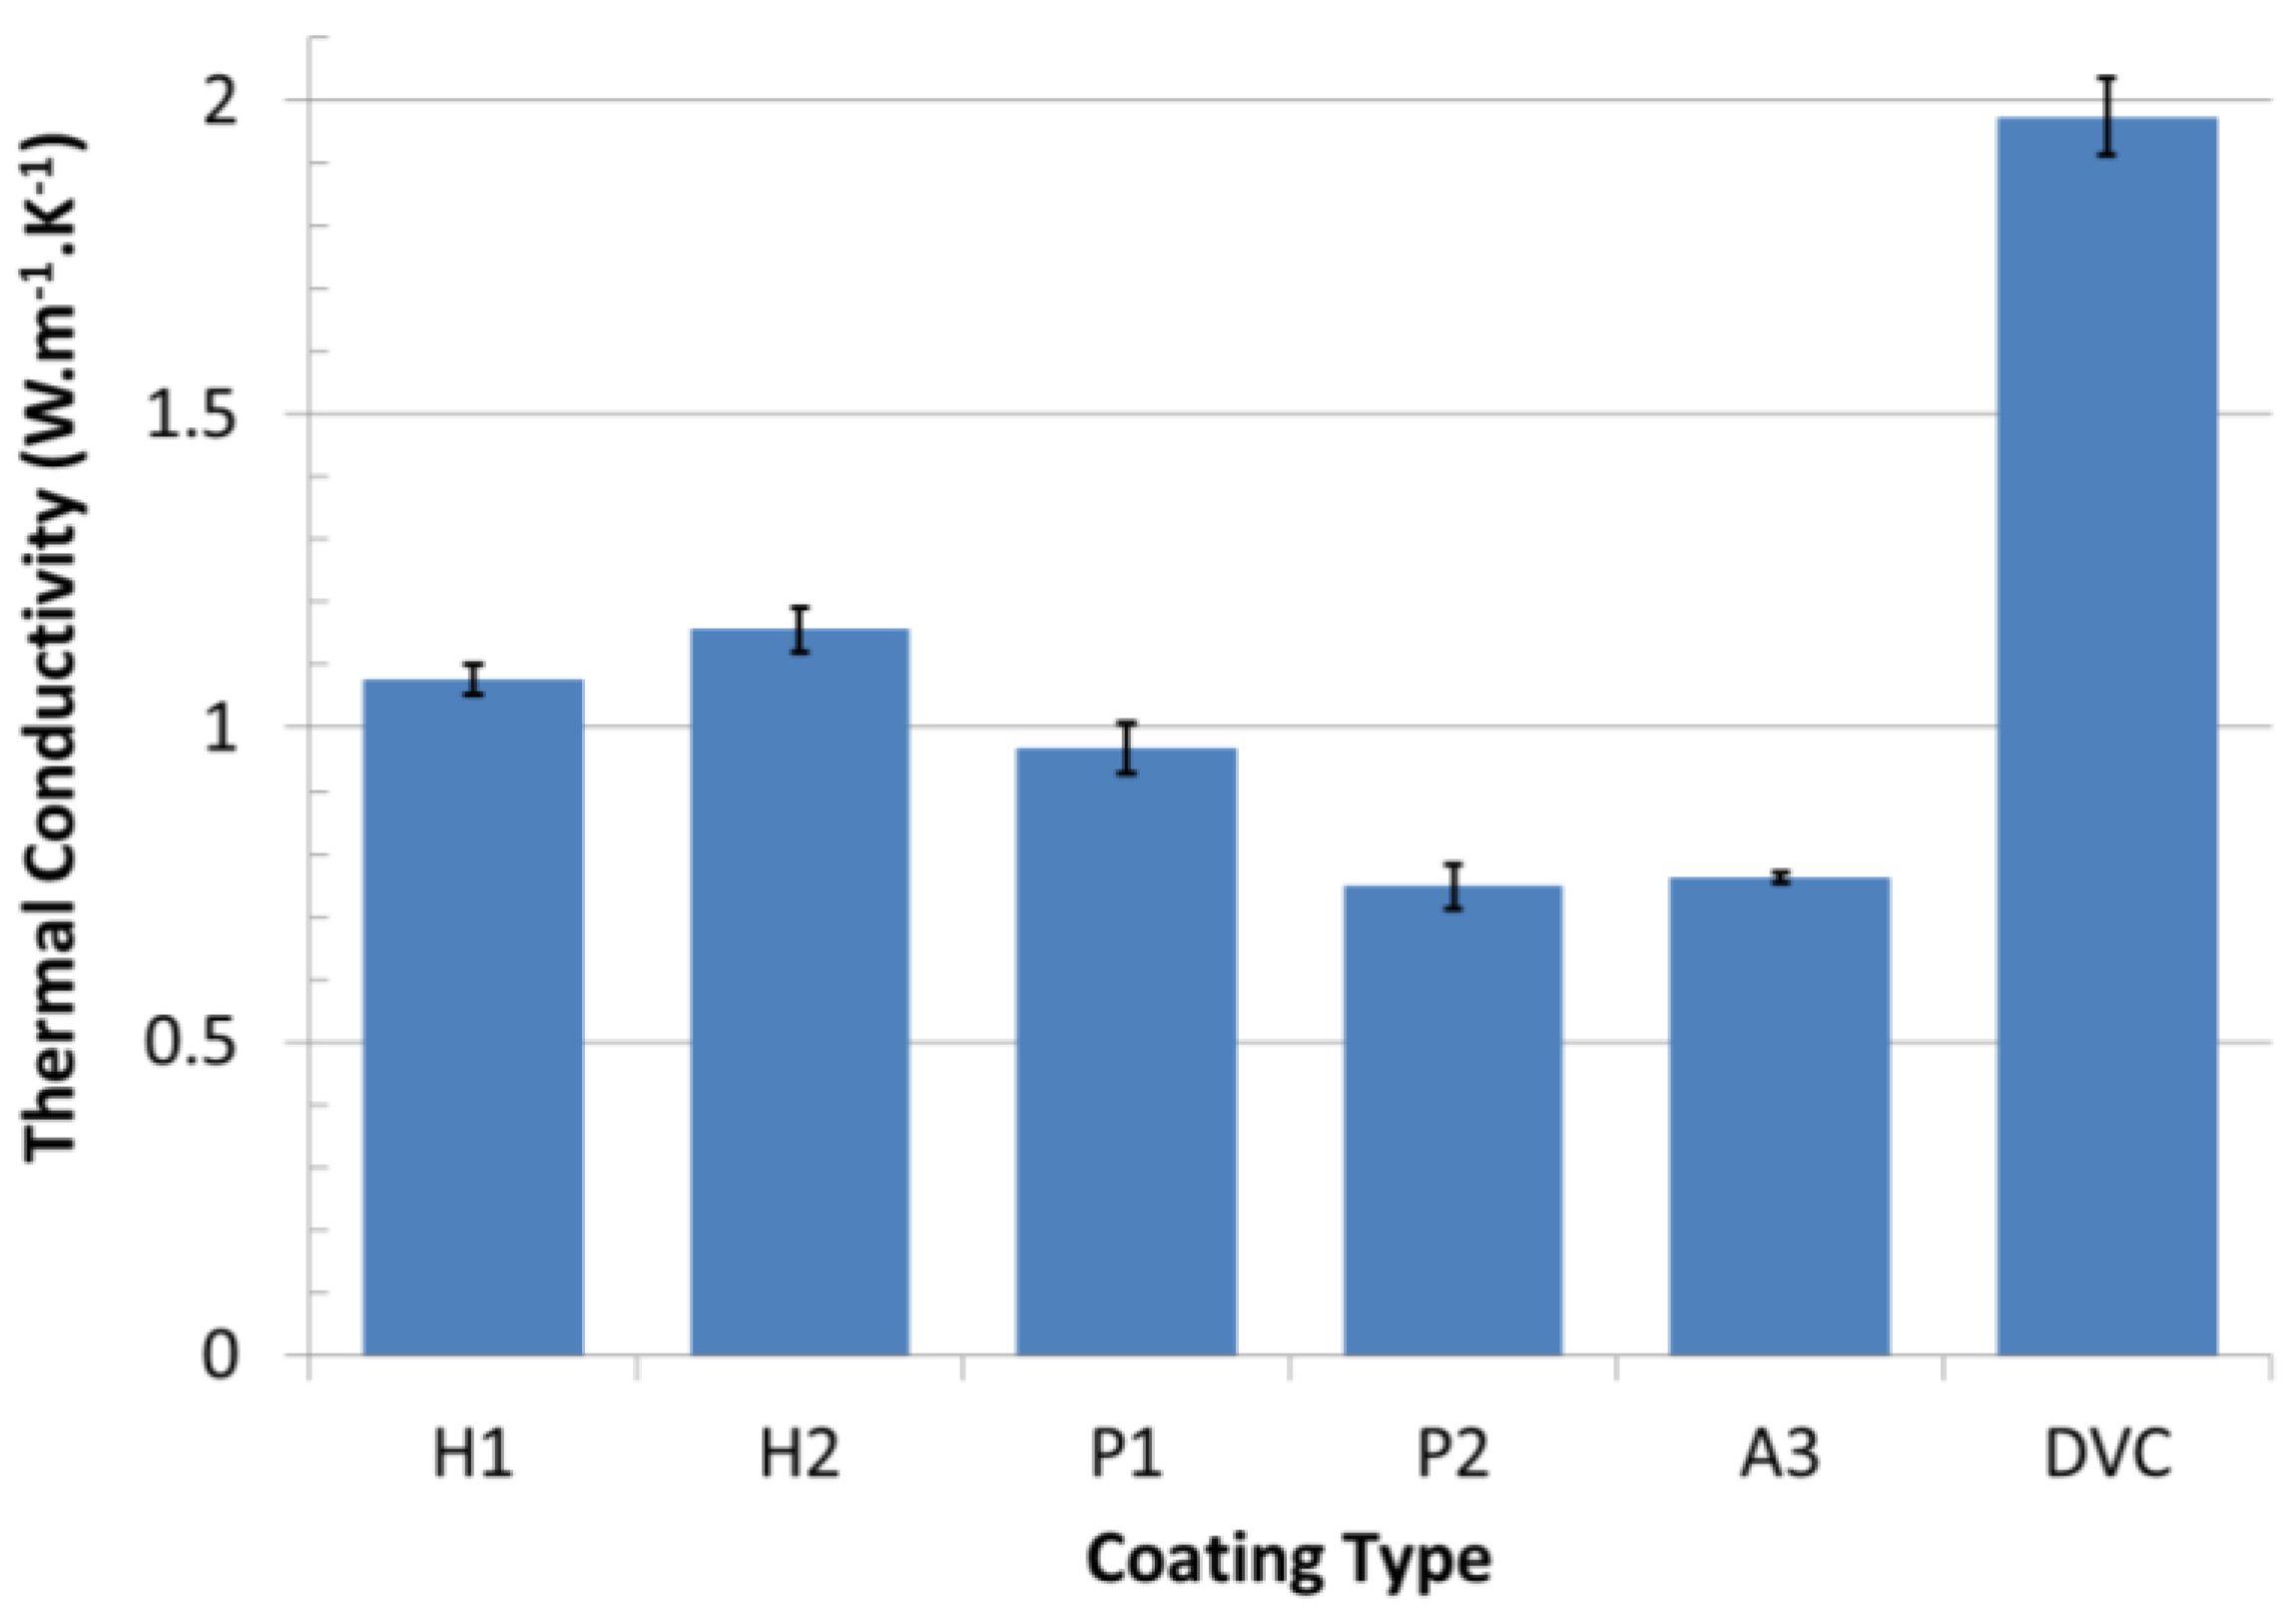
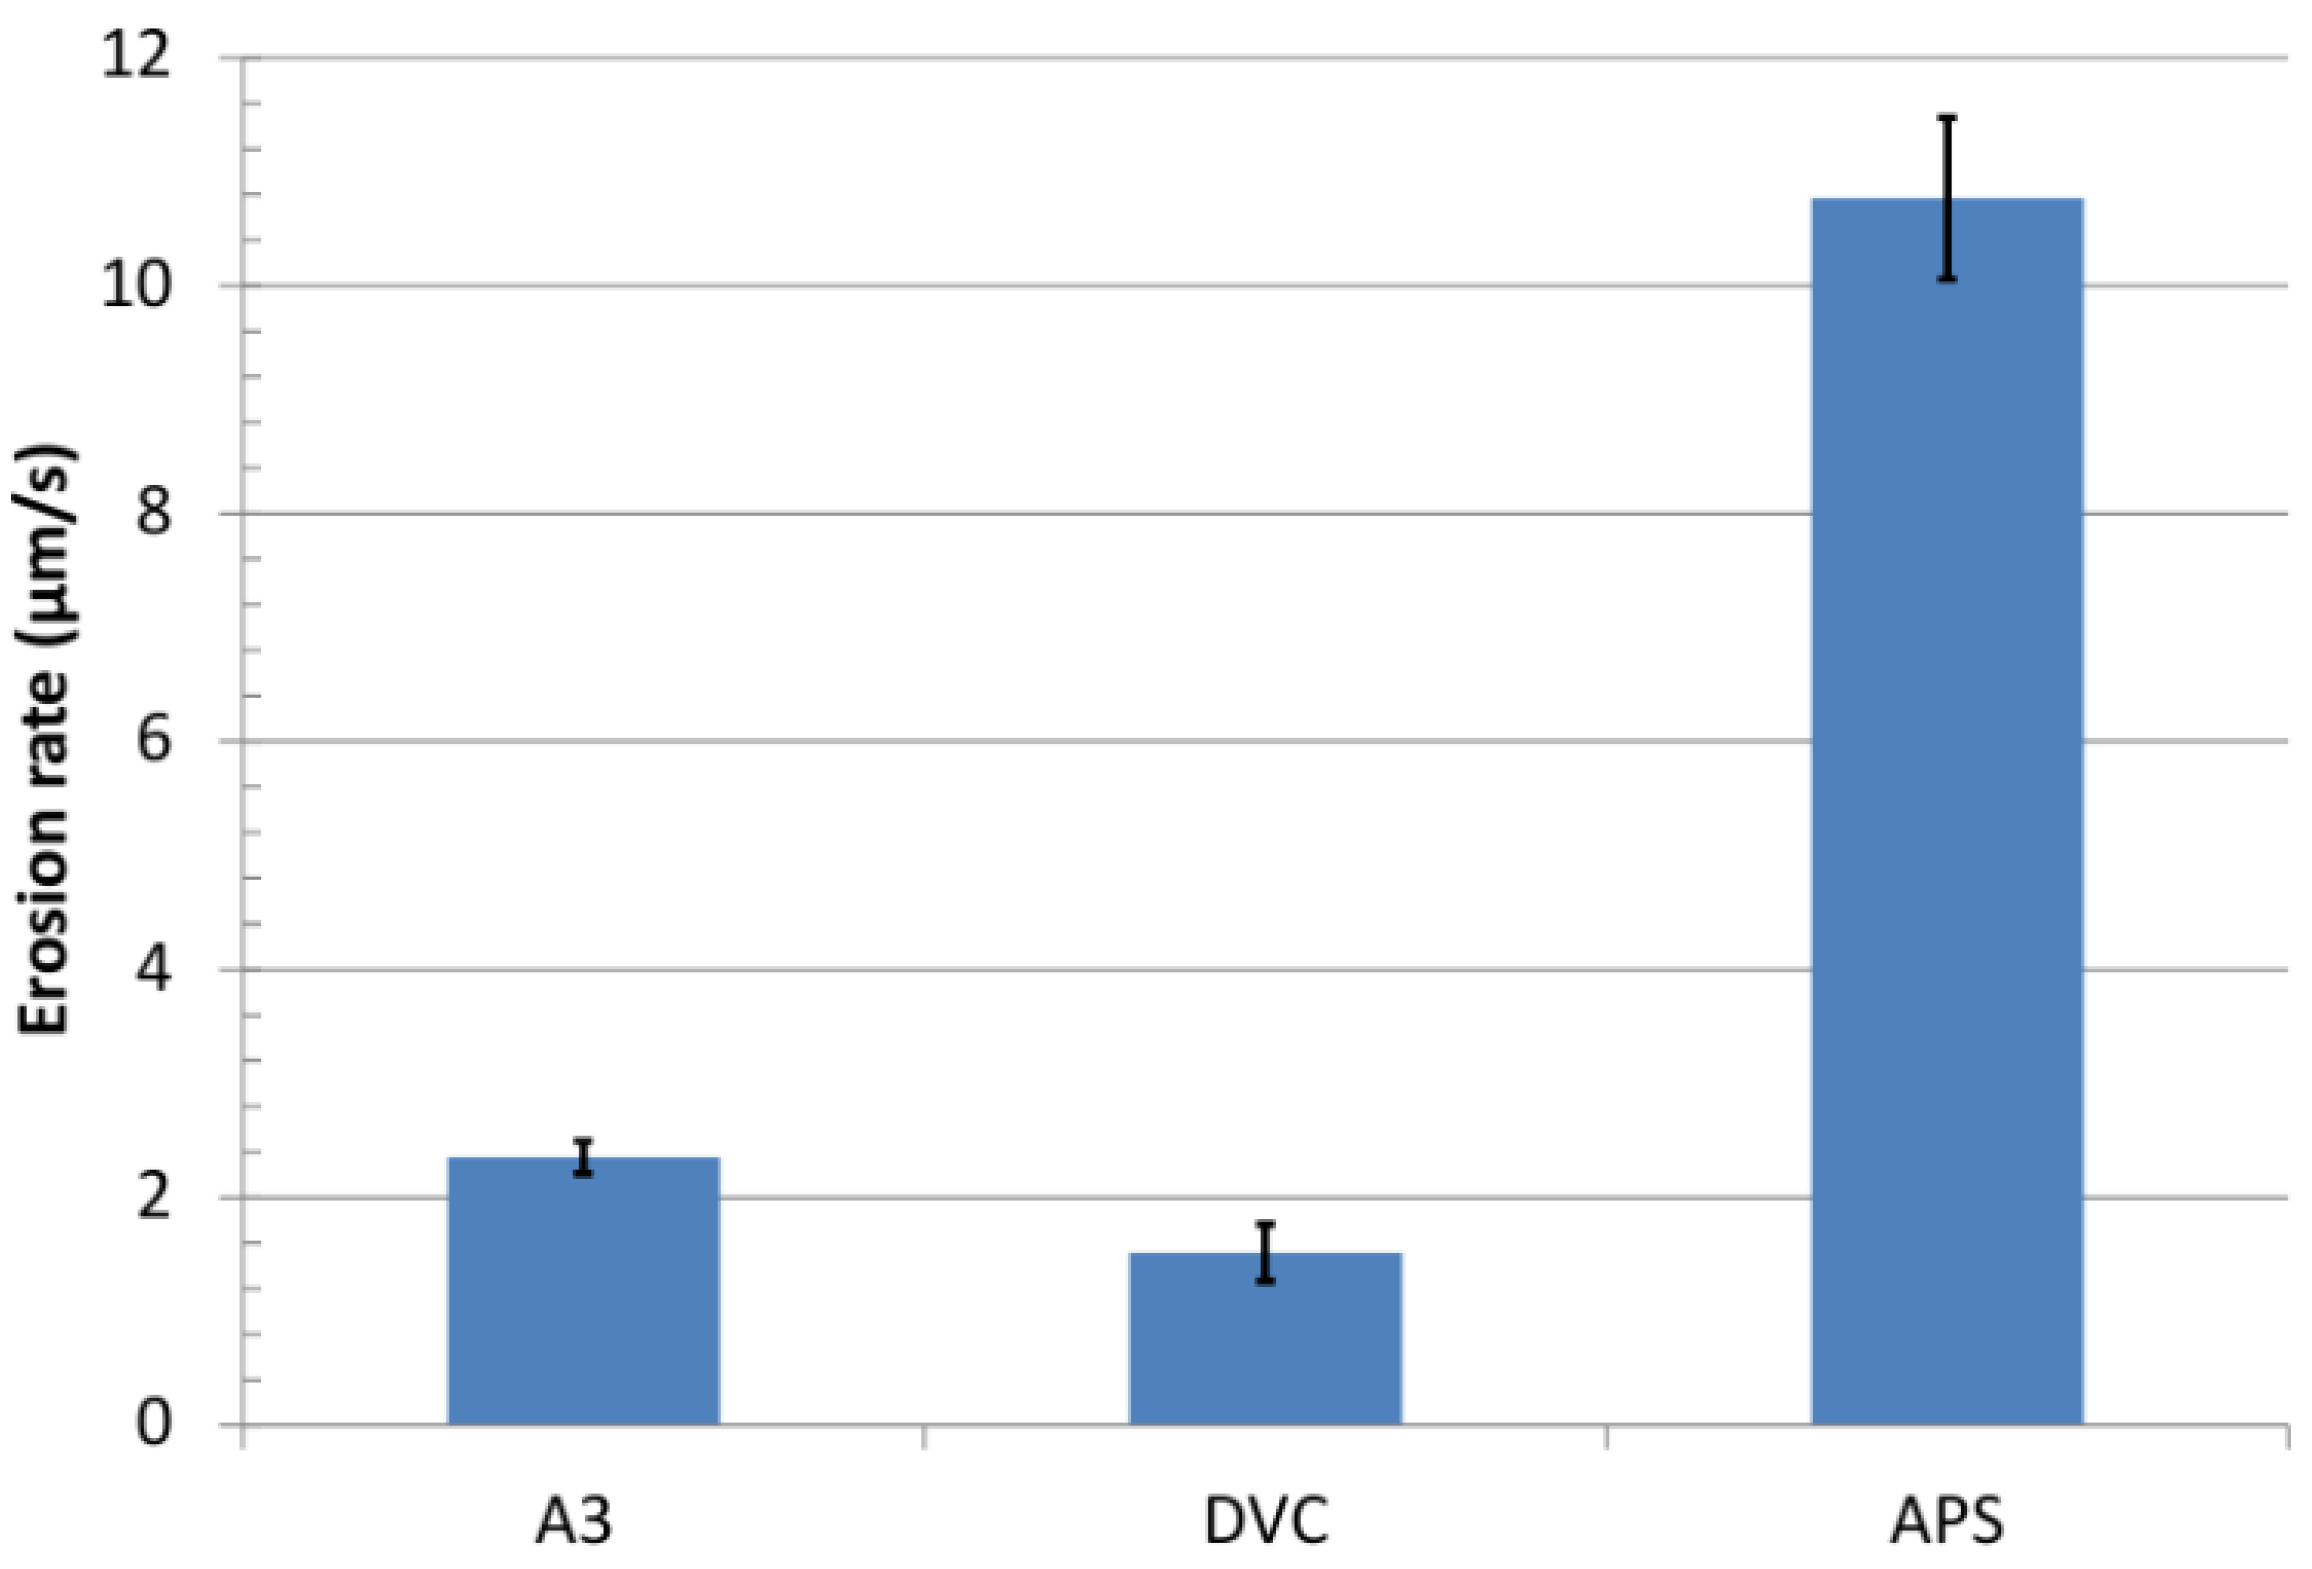
4.2. Thermal Conductivity

Thermal conductivity results are shown in Figure 6. Trends in the coating thermal conductivity can be related to the microstructures shown in Figure 2, Figure 3, Figure 4 and Figure 5. In comparison with the more porous SPS coatings, the APS DVC coating displays a higher thermal conductivity in the as-sprayed state. While a porous APS coating may have an as-produced thermal conductivity in the region 0.5–1.0 (W·m−1·K−1) depending on the microstructure [5], the thermal conductivity of a DVC coating is 2–4-times higher due to its more dense structure. This conductivity increase displays the trade-off required in conventional APS spraying in order to produce a strain-tolerant coating.
Figure 6. Thermal conductivity of the coating systems.
Coatings 04 00630 g006
The difference in thermal properties amongst the SPS samples with different bond coats can also be connected to expected and observable microstructural differences. The coatings on plasma-sprayed bond coat (P1 and P2) show lower thermal conductivity than their HVOF counterparts (H1 and H2). This difference is consistent with the more irregular structure of the SPS YSZ on the rougher plasma-sprayed bond coat surface, increasing the coating porosity. However, because the nano-suspension was used for both the H and P coatings, the depositing particle sizes were comparable, which resulted in a similar porosity orientation between these sample sets (Figure 2 and Figure 3). The thermal conductivity of the P2 samples was lower than that of the P1 samples. The P2 samples were comprised of more layers than the P1 samples, due to the 1.6-times faster surface speed relative to that used for the P1 samples. Therefore, the P2 samples contained more overspray porosity zones, which were oriented roughly perpendicular to the heat flow during the laser flash testing, which would act as barriers to heat transport. The same trend is not observed in the H1 and H2 samples, though there is no statistically significant difference in thermal conductivity between the two coating types. The lack of expected variation may again be related to the bond coat influence on the microstructure. The smoother HVOF interface produces less variability in coating porosity due to the different surface speeds used for spraying.
The sub-micron suspension used for the A3 samples produced a porosity distribution that differed from that of the Type 1 and 2 samples. The A3 samples exhibited wider inter-columnar gaps and a higher number of these gaps per cross-sectional area. This porosity, which is orientated parallel to the primary direction of heat flow, does not lower the thermal conductivity as significantly as that which is oriented perpendicular to the heat flow. Consequently, although the A3 coatings contained a significantly higher amount of porosity, these samples display the same level of thermal conductivity as the P2 coatings.
Thermal conductivity 
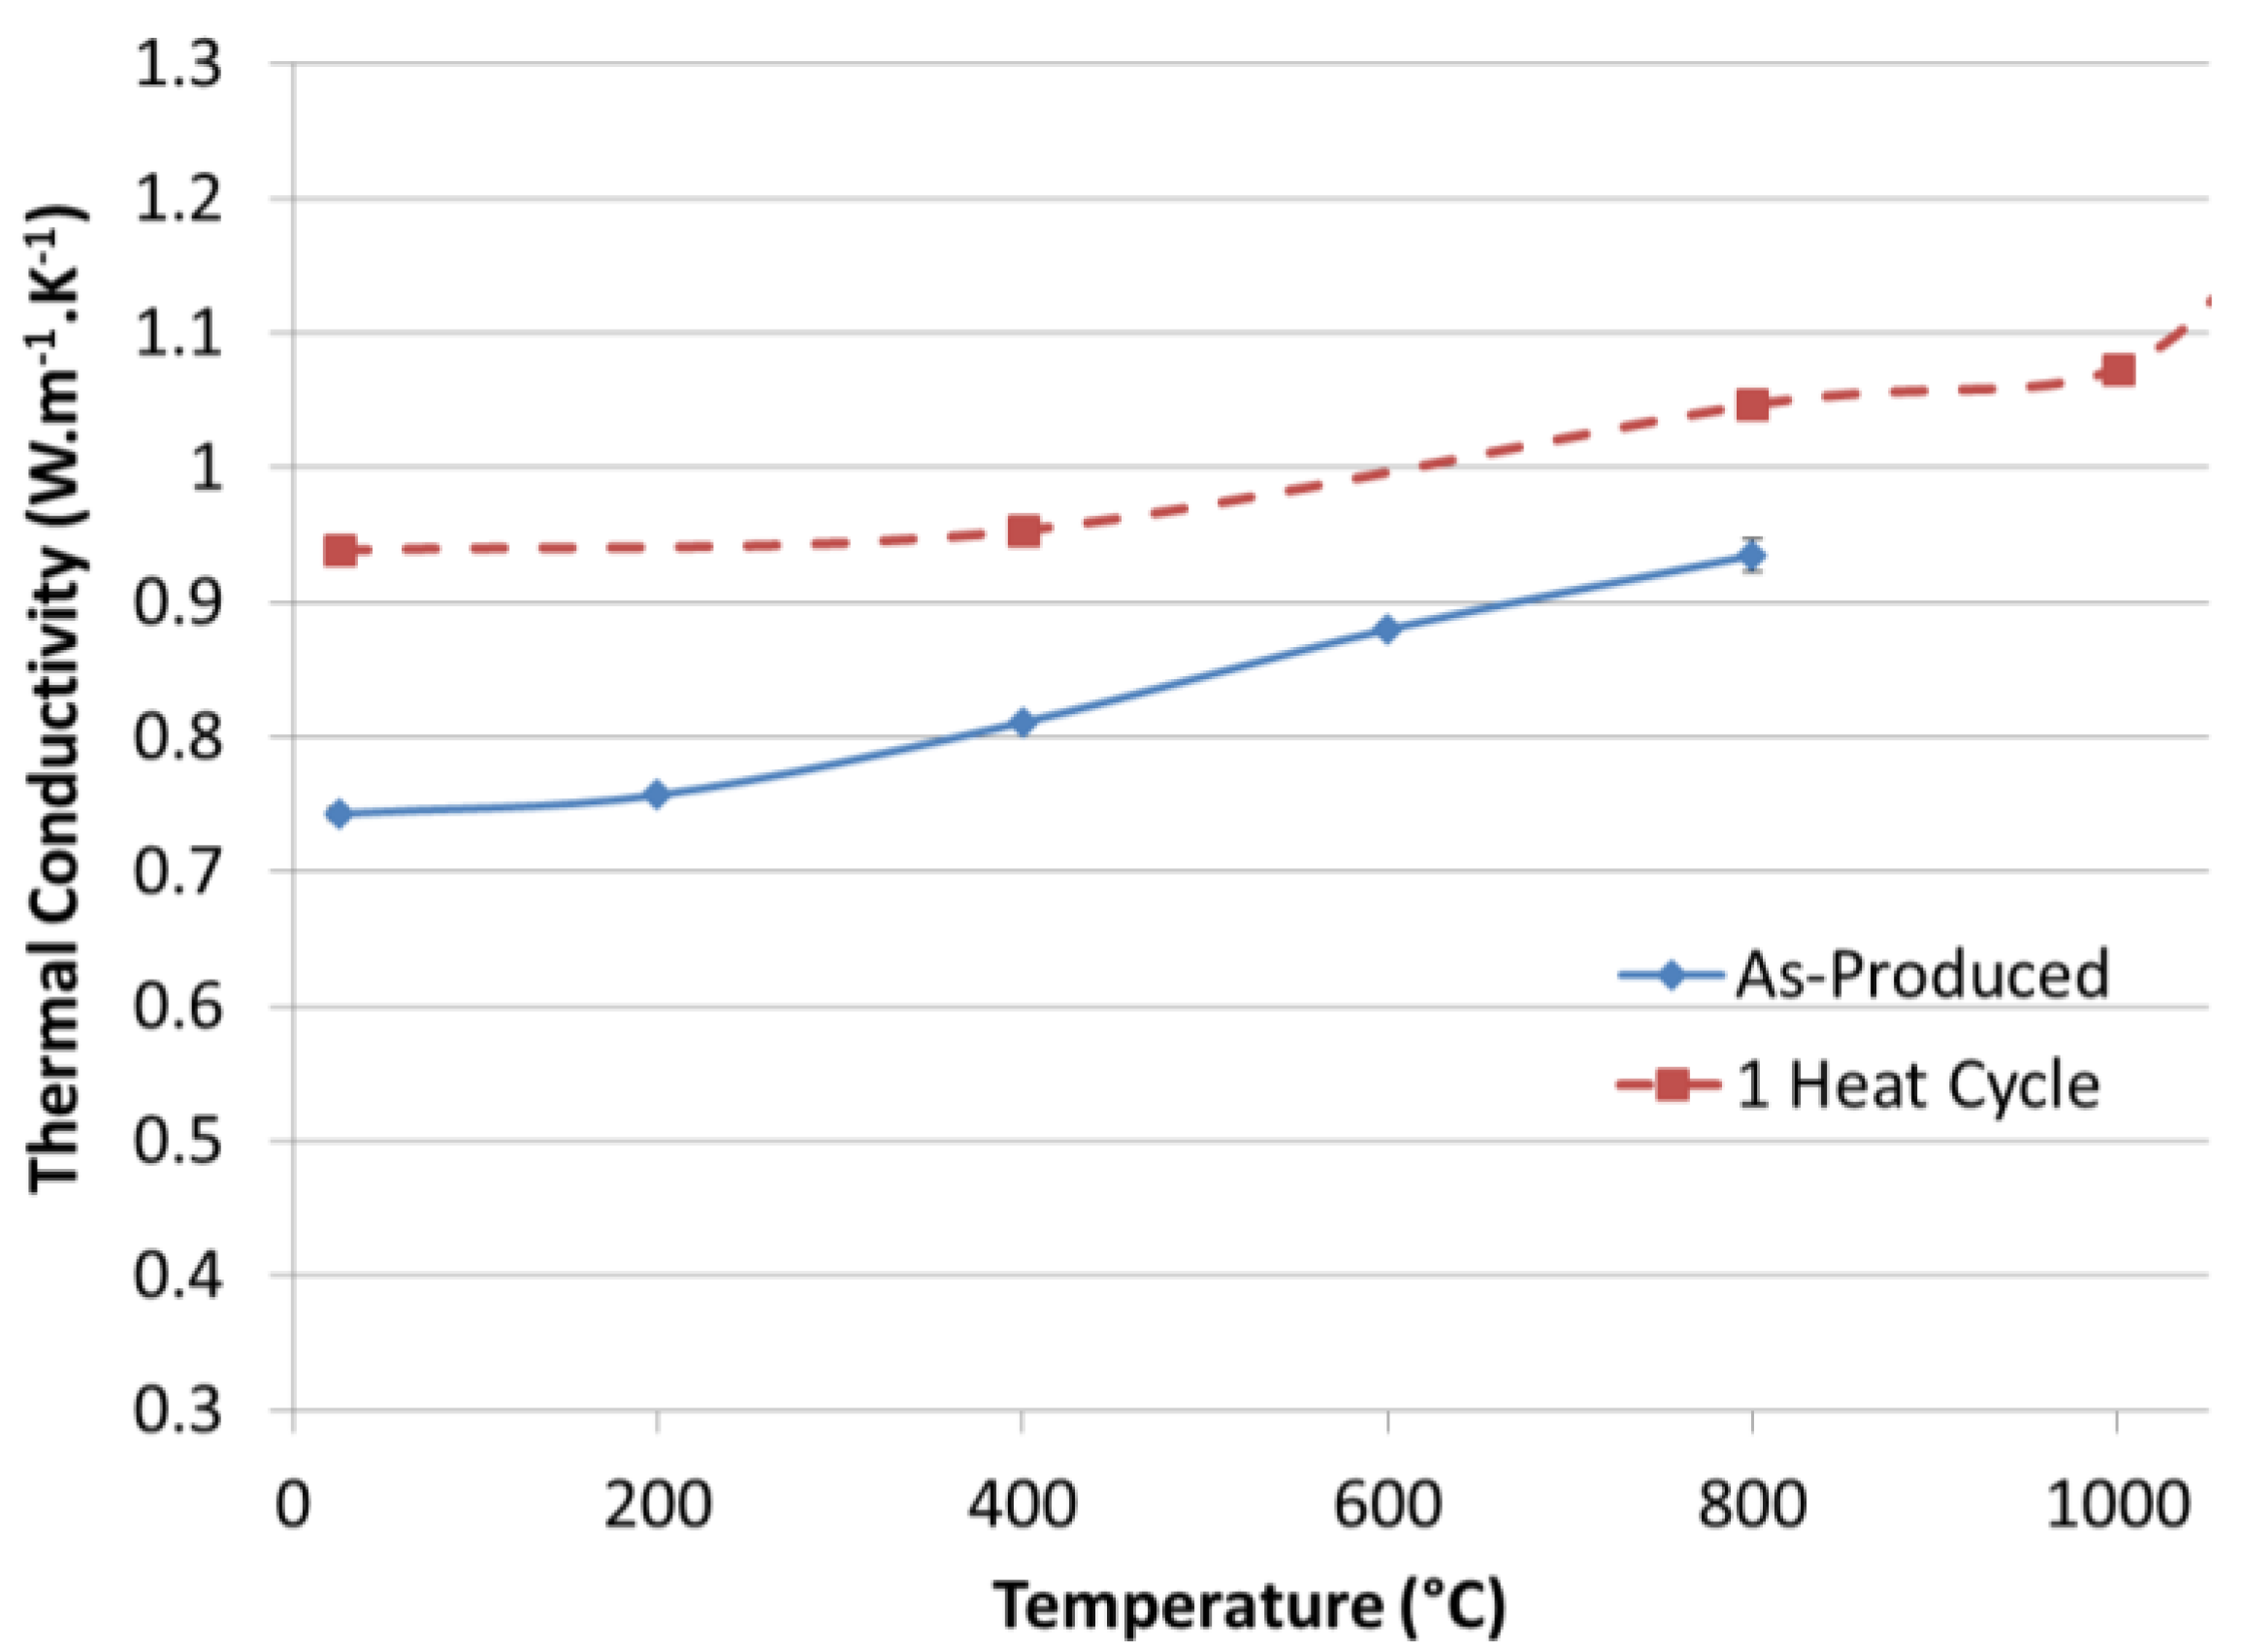
versus temperature data is displayed in Figure 7 for the A3 sample. The full line represents the as-sprayed thermal properties; whereas the dashed line represents the thermal properties after several hours at high temperature. It can be noted that, as with an APS coating, there is some increase in thermal conductivity after high temperature exposure, due to sintering of the microstructure after several hours at high temperature [9]. The degree of microstructural change is expected to be consistent with Stage 1 sintering, as defined by Cernuschi et al. [7], which occurs during the first hours of exposure at high temperatures. During this time, crack healing and bridging of the microstructure occurs, resulting in improved thermal conduction through the coating.

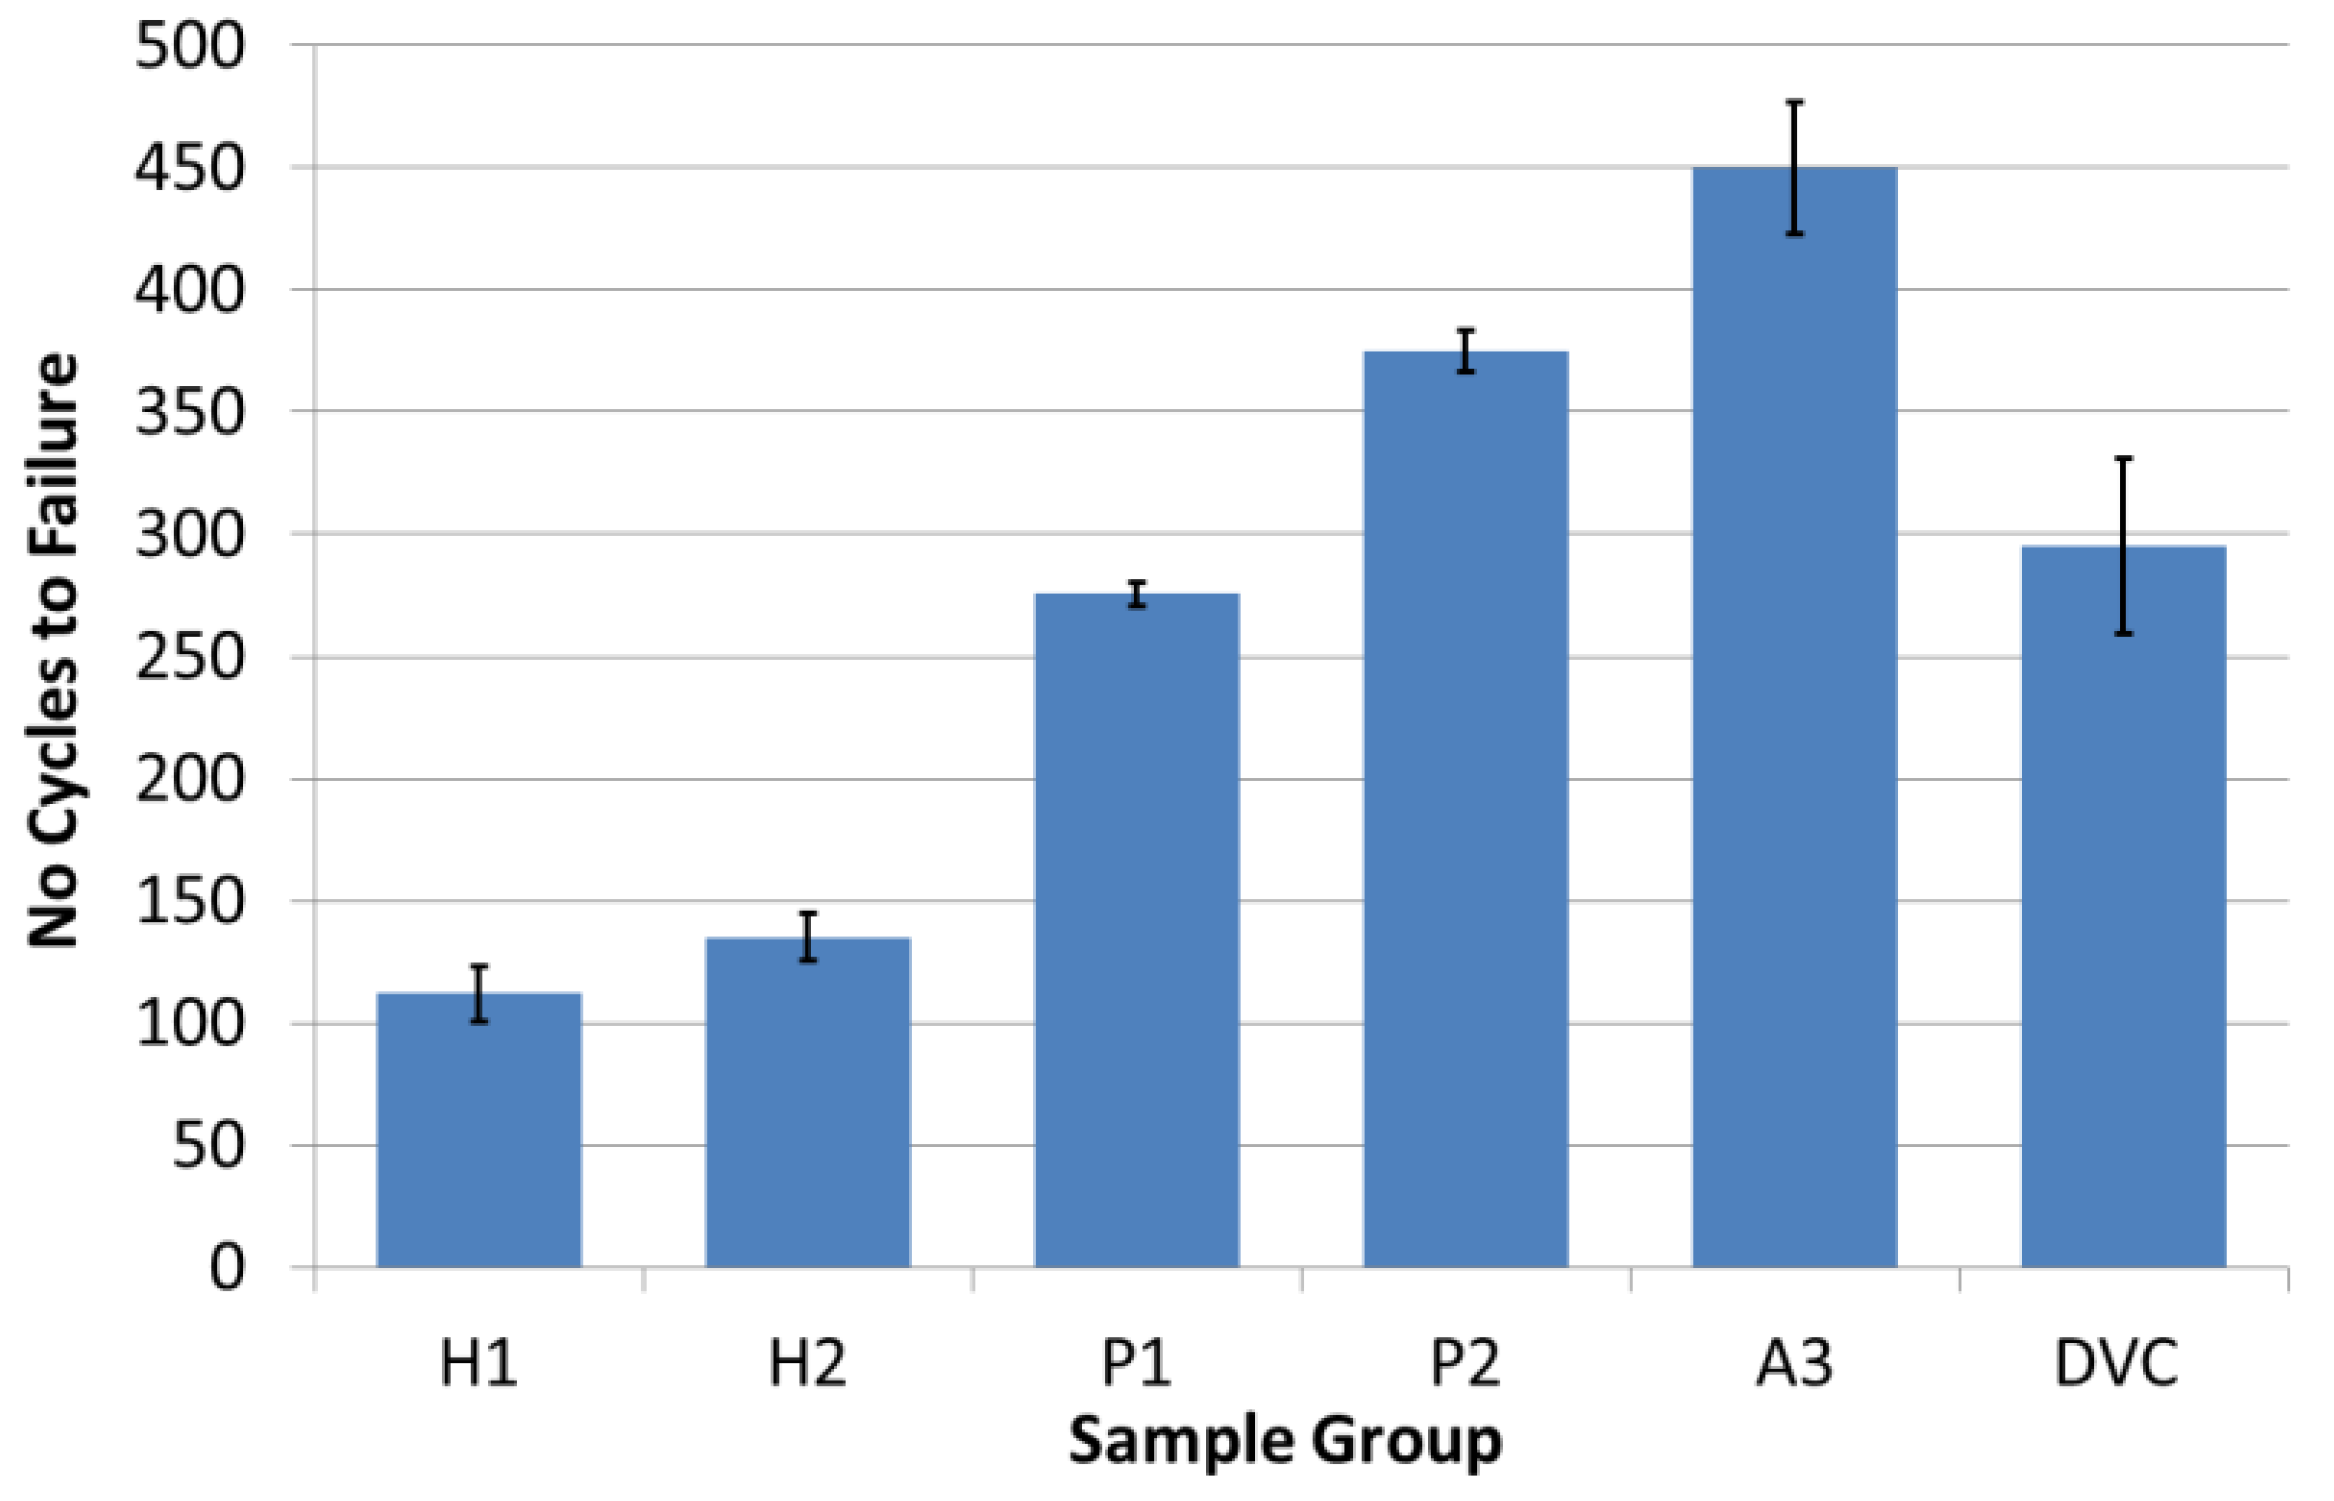
4.3. Thermo-Cyclic Fatigue Lifetime and Failure Microstructures

The results of TCF sample testing are shown in Figure 8. The standard deviation of each sample set is shown by the error bars. It can be seen that large differences in thermal fatigue life were achieved with different bond coat systems. Samples with HVOF bond coats (H1 and H2) exhibited less than half the lifetime of samples with the same top coat type on air plasma-sprayed bond coats (P1 and P2). Similar results for APS versus HVOF bond coats have been reported previously with conventional APS top coats [6].
Figure 7. Thermal conductivity versus temperature for coating A3 in the as-produced state and after one heat cycle.
Coatings 04 00630 g007
Figure 8. Thermo-cyclic fatigue lifetime of experimental coatings.
Coatings 04 00630 g008
For all of the coating combinations tested, failure resulted from transverse crack propagation that could be connected to stress produced by a thermally-grown oxide (TGO) layer at the bond coat-top coat interface [28,29]. This layer is an unavoidable by-product during the high temperature exposure of YSZ-MCrAlY TBCs in atmospheric conditions and results from oxygen diffusing to and reacting with the bond coat material. Thus, the lifetime of a YSZ-MCrAlY system in TCF testing was determined by a combination of the oxygen diffusion rate to the bond coat, the reaction rate at the bond coat, the top coat strain tolerance and the ease of crack propagation along the top coat-TGO interface.
Initially, the rate of oxygen reaching the bond coat is determined by gas infiltration into the cracks and pores of and lattice diffusion through the YSZ top coat. As the TGO develops, oxygen must then diffuse through this layer to react with the bond coat; thus, the TGO composition can affect bond coat oxidation. For example, a reaction between the diffusing oxygen and the aluminum of the bond coat can form an alumina layer that produces a slower growing oxide layer than reactions yielding mixed oxides consisting of nickel, chromia spinels, which are considered highly detrimental to coating lifetime [28]. Hence, the bond coat chemistry also influences TGO development by determining which oxides form. For instance, a β Ni-Al phase in the bond coat acts as an aluminum reservoir that promotes the formation of a passivating alumina layer, so that the beta phase content can be tracked and used to determine the degree of bond coat oxidation and the remaining chemical life of the bond coat [28]. A slower growing, passivating oxide is preferred, because the formation of any TGO introduces stress into the TBC system. The greater the capacity of the top coat to accommodate this stress, the better the TCF performance of the TBC tends to be [6]. Once the TGO-induced stress exceeds a critical level, cracks will be initiated and propagate along the lowest energy pathway. The planarity of the interface may influence the rate of propagation; less planar interfaces generate higher total stresses, but make crack propagation more difficult.
Considering the above factors, the lifetime disparity between H and P samples was likely to have resulted mainly from bond coat topography differences. As mentioned previously, the P samples contained more porosity than the H samples, but, given the similarities in the coating cross-sections, the higher porosity in the P samples would not be expected to improve the strain tolerance enough to account for the majority of the ~2.5 increase in the average TCF lifetime when comparing the H samples to the P samples. Therefore, while porosity may have contributed to the TCF lifetime differences between the H and P samples, the dominant factor was most probably that the TGO-induced cracking required more energy to propagate along the interface structure produced by the plasma-sprayed bond coat (P samples), because it was significantly rougher than the interface structure producing the HVOF bond coat (H samples).
The plasma-sprayed bond coat data also show a larger difference in lifetime between the Type 1 and Type 2 SPS top coats. This can be explained firstly by the greater difference in microstructure generated by changing surface speed when depositing coatings on an APS bond coat. Additionally, the P2 coatings have exhibited lower thermal properties than P1 coatings; this could insulate the P2 samples further during thermal transient stages in the TCF cycle. The lack of a significant lifetime difference between the H1 and H2 samples is again related to the influence of the bond coat on the coating microstructure. As the HVOF bond coat induces little variability in microstructure between Type 1 and 2 coatings, there is similarly little difference in their TCF lifetimes.
The TCF lifetime of A3 samples with a HVAF bond coat are also shown on the right of the graph in Figure 8. The A3 samples featured a different powder composition (AMDRY 386) for the HVAF bond coat than that used for the HVOF and plasma spray bond coats (AMDRY 365). The suspension used for the A3 top coat utilized a different particle size distribution than that sprayed to produce the H and P samples. Both of these changes likely helped to improve the TCF lifetime. As stated above, the AMDRY 386 bond coat chemistry may reduce the oxidation rate and formation of spinel oxides relative to the AMDRY 365 bond coats. Additionally, the sub-micron suspension used for the A3 top coat produced a more porous columnar and, thus, strain-tolerant microstructure than that resulting from the nano-suspension used to generate the H and P samples.
The TCF results for the reference DVC APS samples are shown on the far right of the graph in Figure 8. The DVC samples used the same AMDRY 386 bond coat composition as was used for the A3 samples, but the bond coat was applied via plasma spray instead of HVAF. The TCF lifetime of the DVC samples was on par with that of the P1 samples and gives a useful benchmark for the TCF performance of current industry standard strain-tolerant plasma spray coatings.
The cross-section of a failed H1 sample is shown in Figure 9. This figure shows that failure was connected to cracks (labeled A) propagating along the interface between the thermally-grown oxide (TGO) layer and the bases of the columnar structures forming the top coat. In addition to this cracking, propagation also occurred through the inter-pass porosity at some locations. Due to the higher porosity of the inter-pass layers, they represent a low energy pathway for crack propagation.
The TGO layer consists of a dark alumina oxide layer (labeled B) at the bond coat interface that acts to prevent further oxidation. There is, however, a large amount of lighter colored mixed oxide regions above the alumina layer (labeled C). The mixed oxide consists of nickel, chromia spinels, and due to its faster growth, it is considered highly detrimental to coating lifetime [28]. Investigation of the HVOF bond coat after 100–140 cycles reveals that a substantial amount of the beta phase (β Ni-Al) remained within the bond coat. This phase can be seen in Figure 9 as the darker regions within the bond coat layer indicated by the dashed lines and double arrow.
Figure 9. Microstructure of an H1 sample after approximately 120 thermo-cyclic fatigue cycles. A: Interface cracking; B: alumina thermally-grown oxide; C: mixed oxide.
Coatings 04 00630 g009
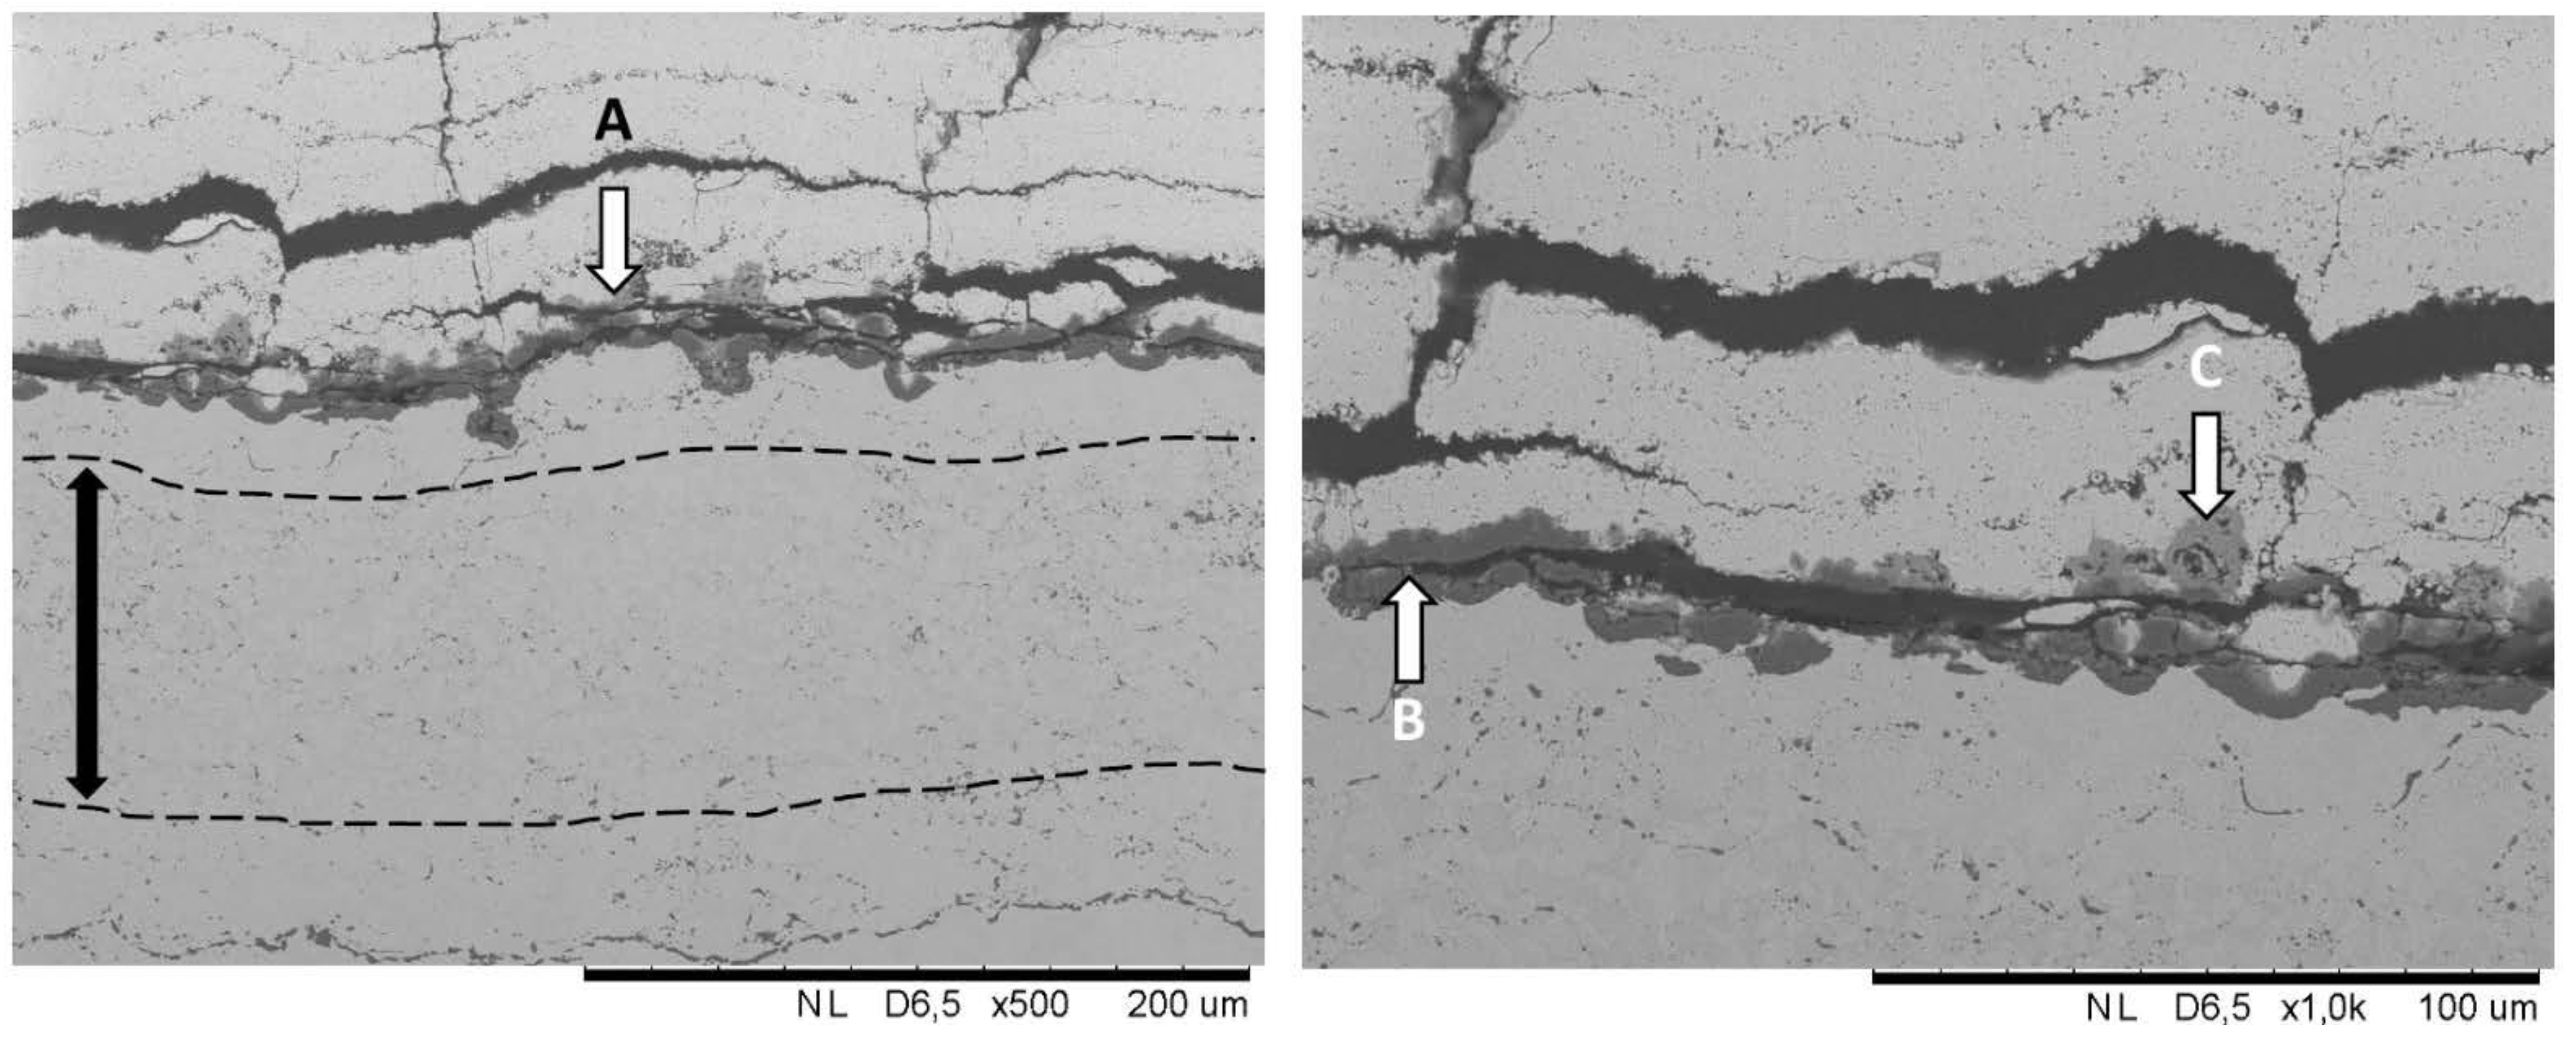
A cross-sectioned HVAF bond coat sample after failure is displayed in Figure 10. Like the HVOF bond coat samples, failure resulted from cracking at the TGO-top coat interface; though cracks propagating through inter-pass porosity were not observed, cracking within the ceramic layer above the TGO is indicated by the white arrow (labeled A). The remaining beta phase region is denoted by a double-headed arrow, with an approximate width of the region being 45 µm. As expected, there is less beta phase remaining compared to the HVOF bond coat sample; this decreased beta content is due to the four-times longer exposure time at high temperatures. Unlike the TGO layer in the HVOF coating, the HVAF TGO layer is denser in structure and contains very little of the mixed oxides found within the HVOF or plasma bond coats. In some locations, rumpling of the oxide layer has been observed (labeled B); this may contribute to crack initiation and failure [28]. The improved oxidation performance in TCF testing explains the longer cyclic lifetime. The reason for the improved performance may be related to the HVAF deposition itself or the different chemistry of the starting powder.
Figure 10. Failure microstructure of an A3 coating system after approximately 450 thermo-cyclic fatigue cycles. A: Interface cracking; B: Oxide rumpling.
Coatings 04 00630 g010

4.4. Thermal Shock Testing

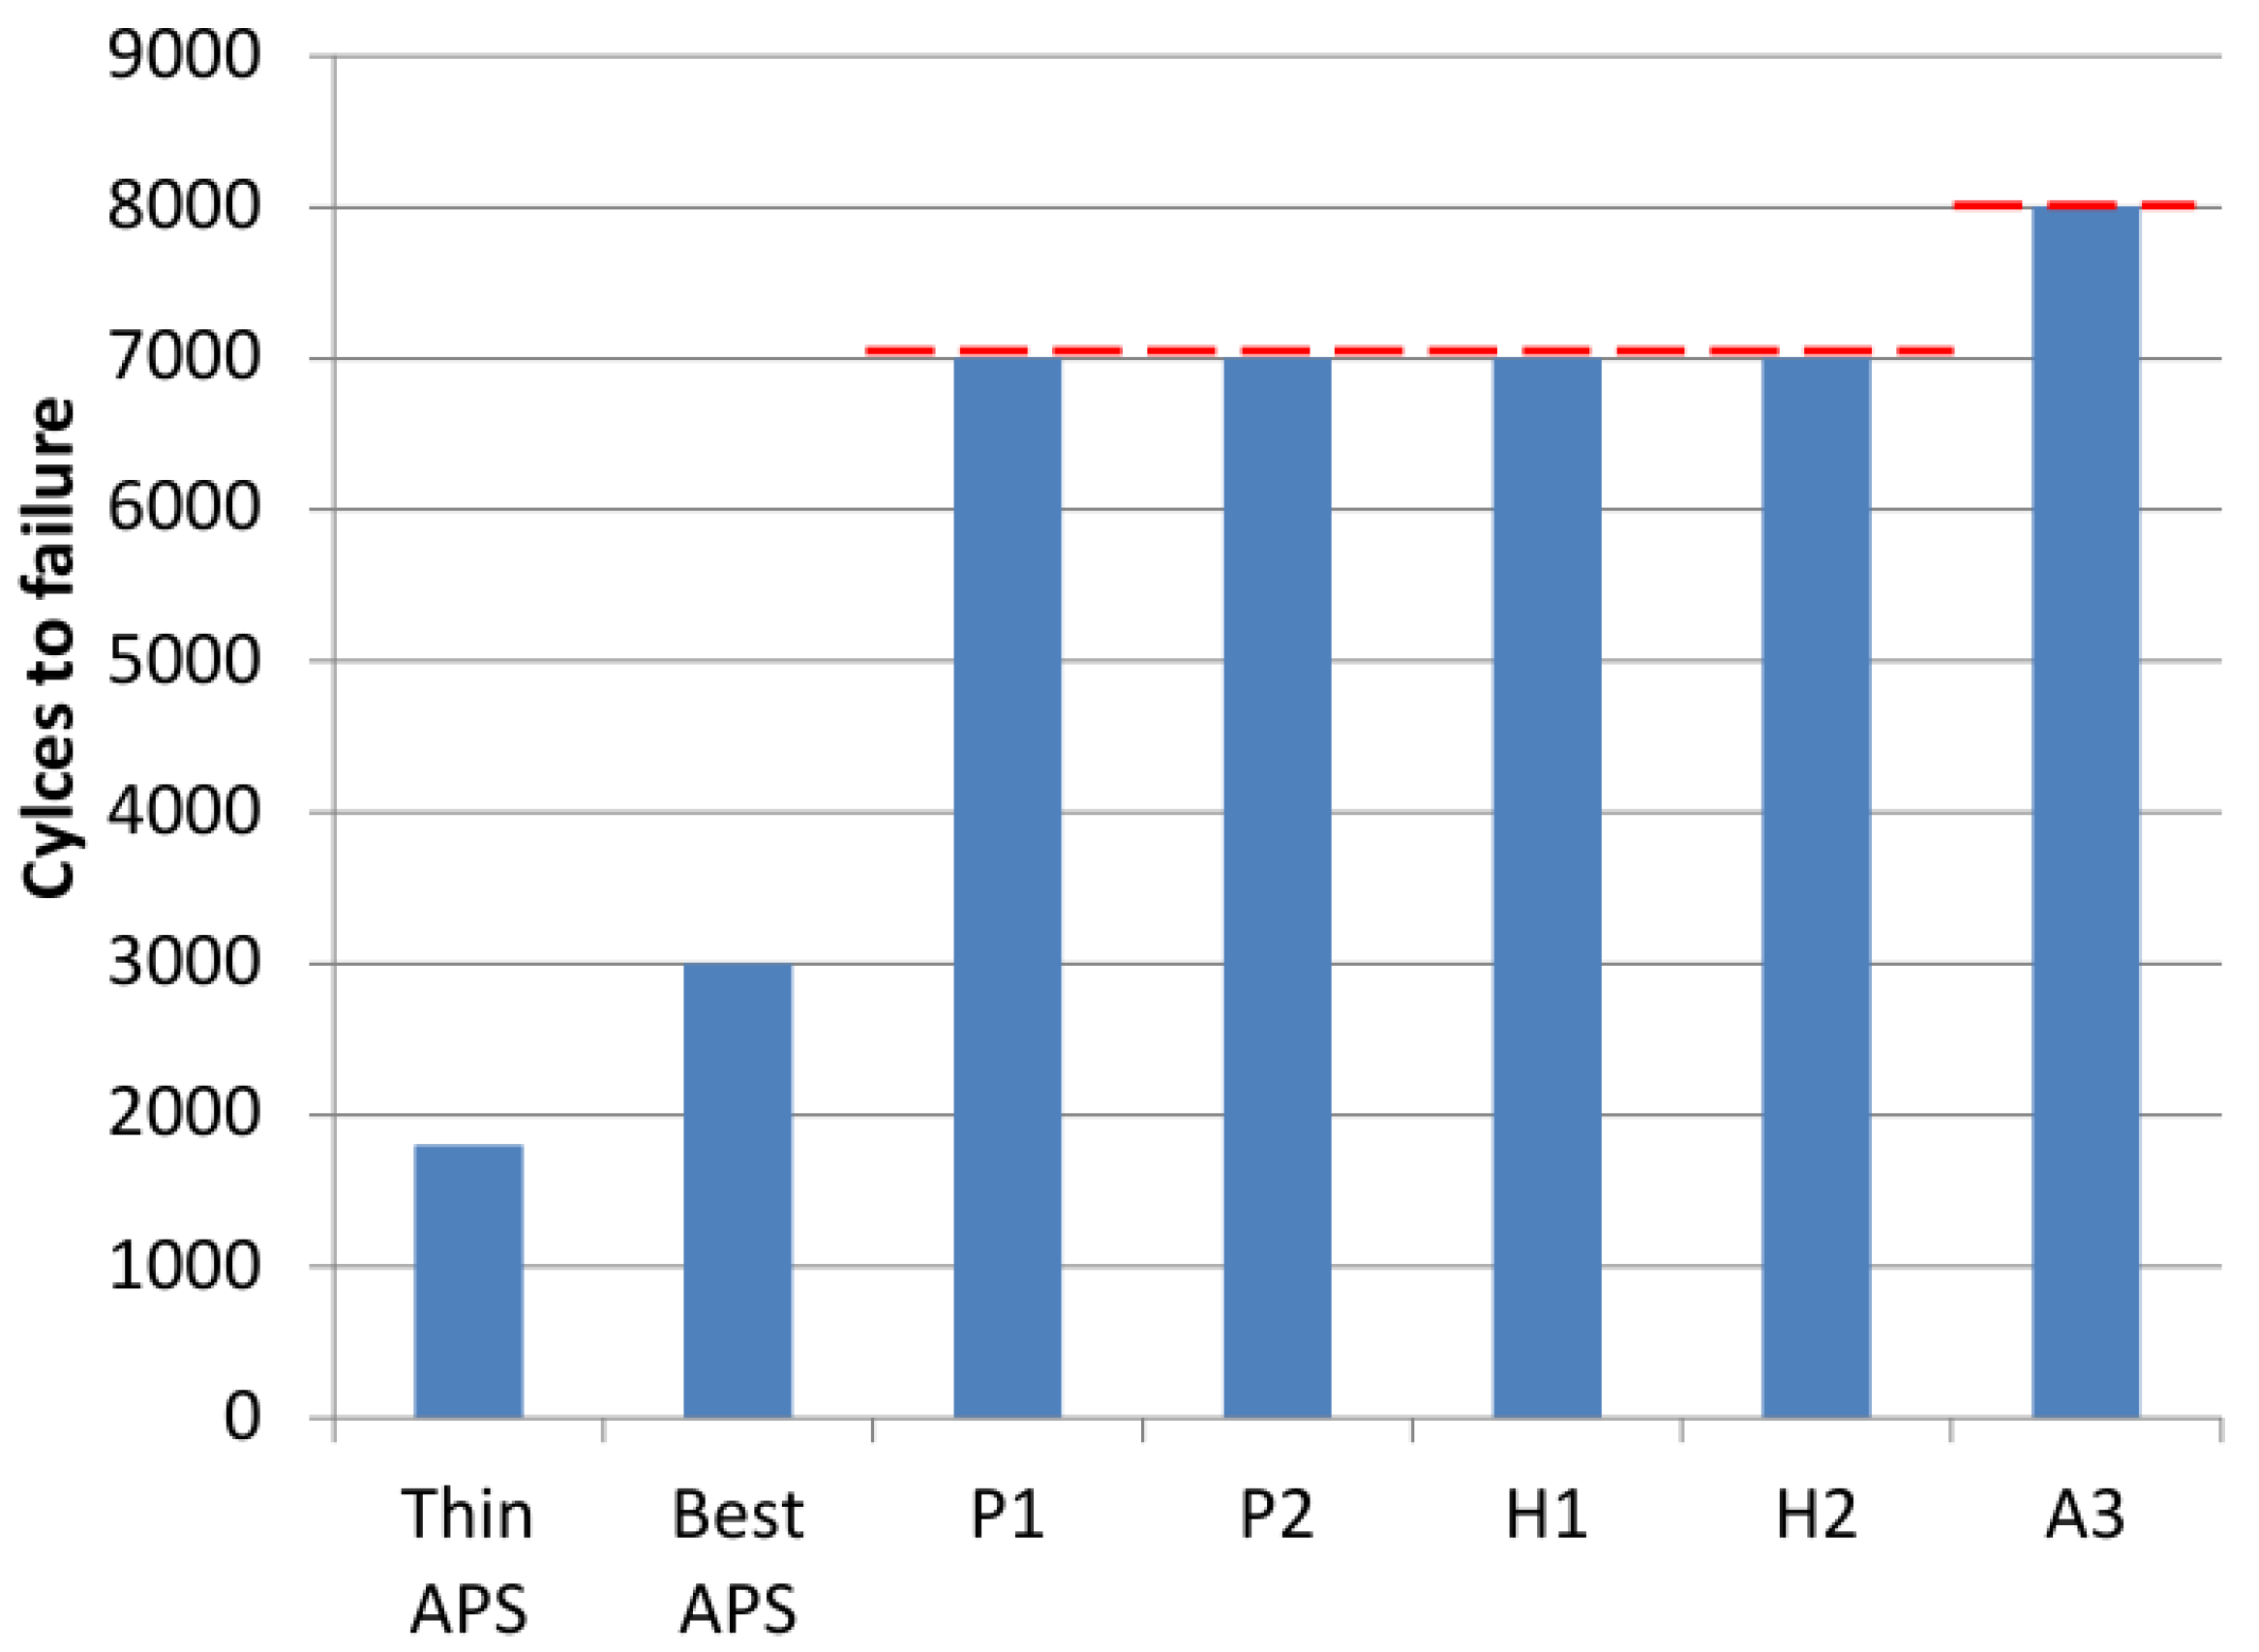
The results for the thermal shock testing of the coatings are shown in Figure 11. It should be noted that in the case of all SPS coatings, the thermal shock test was discontinued with no observed failures, due to limitations on testing time. Previous testing experience with this thermal shock rig over several decades has shown an “average” lifetime for thin (~300 µm) TBC to be 1800 cycles. The maximum lifetime achieved has been 3000 cycles, though without the ability to replicate the result. As Figure 11 shows, the SPS coatings of this study have significantly greater thermal shock life than exhibited by APS systems tested on this rig. Long thermal shock lifetimes are corroborated by Guignard et al. [15] for vertically cracked SPS coatings at similar temperature levels. The results indicate that the structures produced by SPS praying are highly strain tolerant. Further testing against EB-PVD coatings would be required to show their ultimate performance.
Figure 11. Thermal shock testing data. The red dashed line indicates the number of cycles at which the test was halted.
Coatings 04 00630 g011
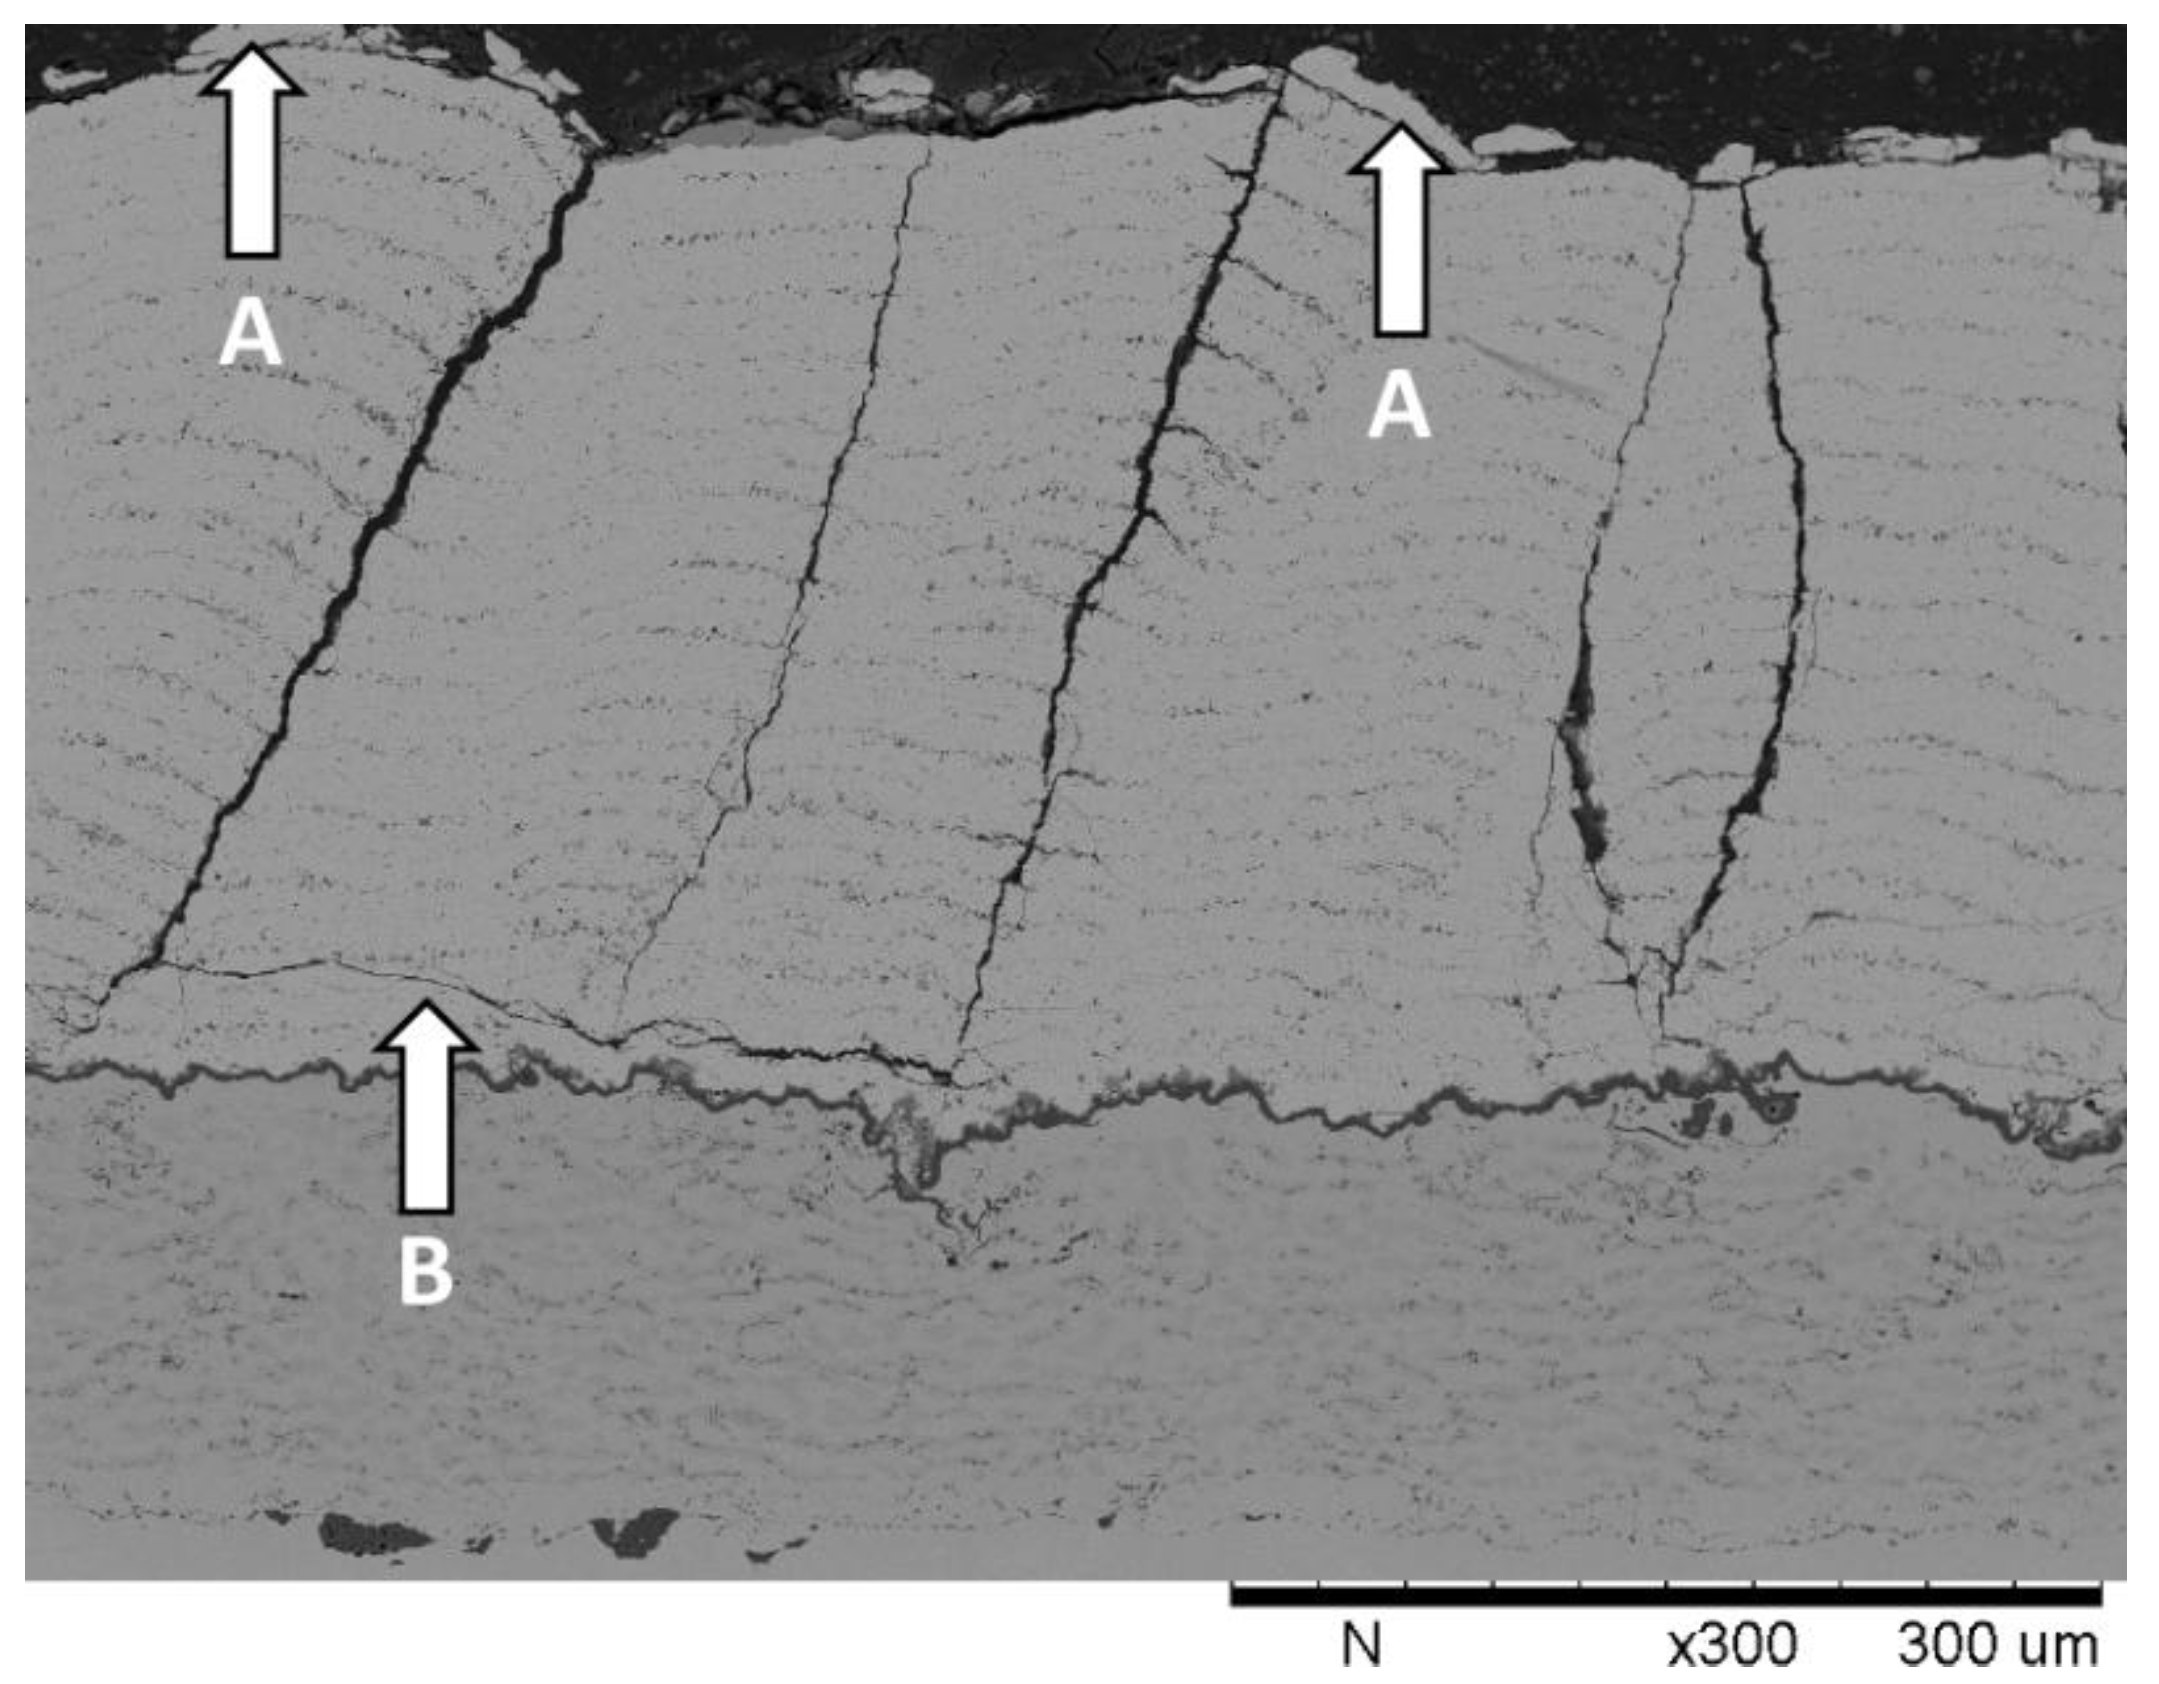
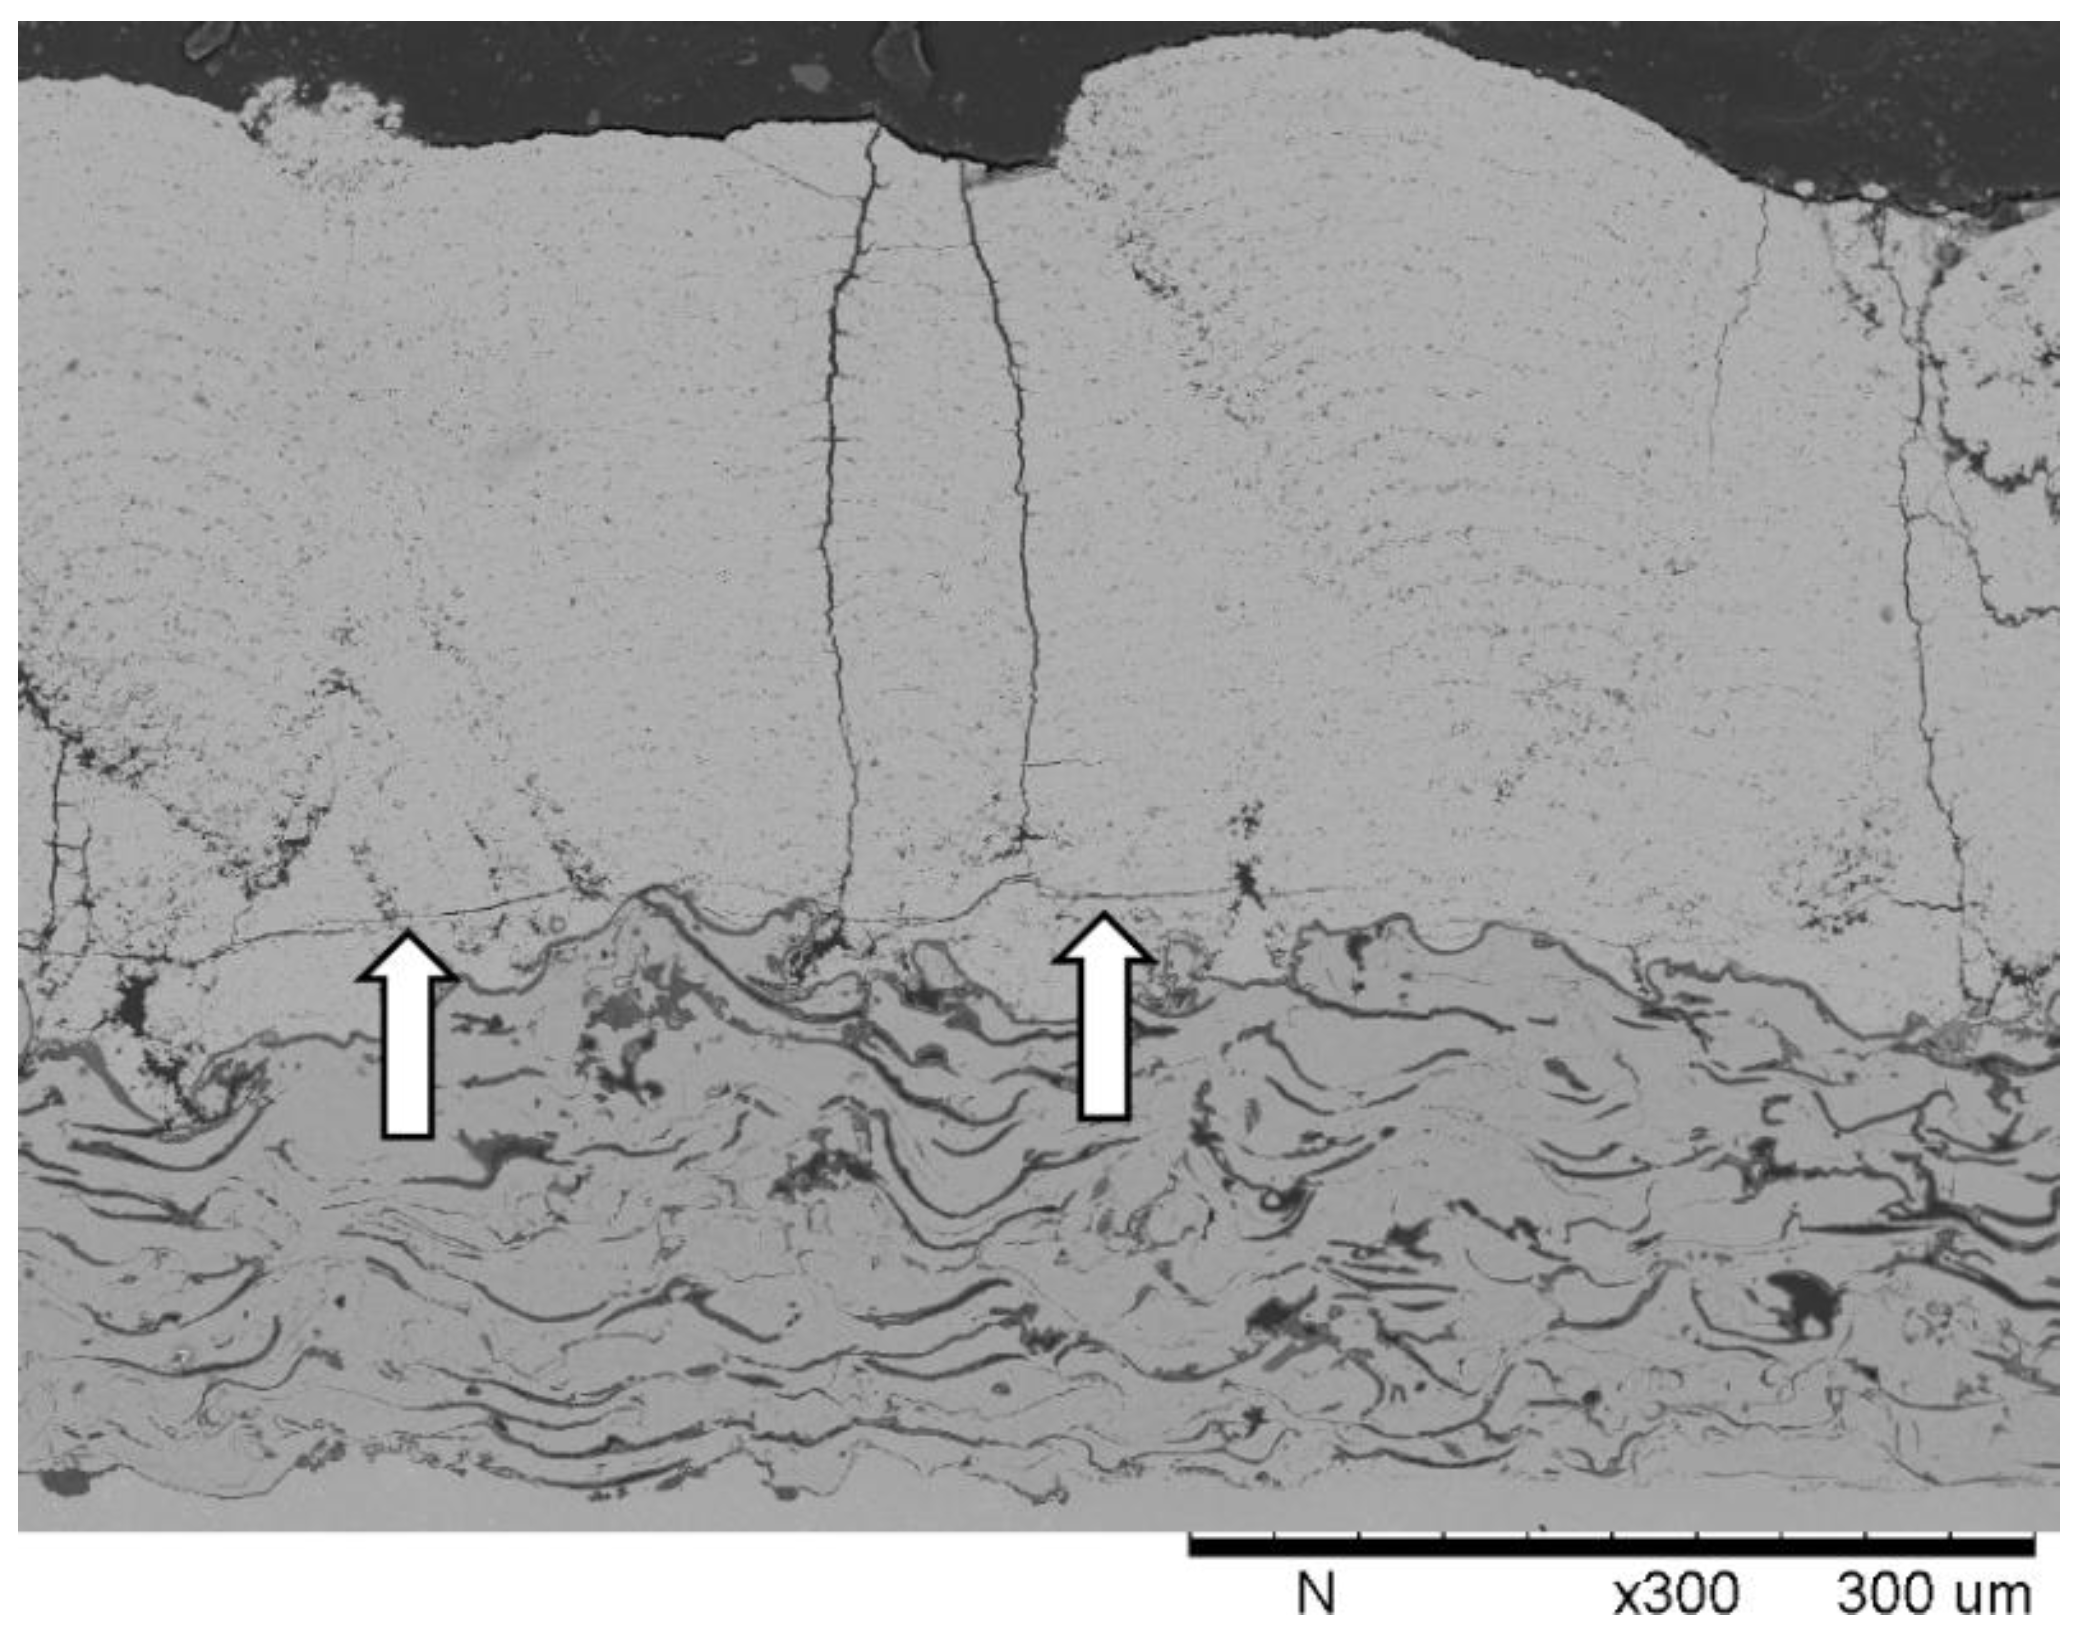
After testing was discontinued, exposed samples were sectioned and prepared for microstructural investigation. A cross-section of an H1 sample is displayed in Figure 12. The H1 microstructure can be considered representative of the H2 sample after the same amount of cyclic exposure. Deposits labeled A in the micrograph are not part of the coating and are in fact transferred iron-chrome oxides from the test rig fixture. The bond coat can be observed to contain two phases: the darker beta-phase and the lighter gamma phase. There is also a thin TGO layer at the bond coat-top coat interface that contains both an alumina layer (dark) and regions of mixed oxides (light). There is some evidence of cracking (labeled B) close to the TGO layer and at the edges of the columns/segments, though this cracking had yet to be significant enough after the 7000 cycles to produce any spallation. Furthermore, it cannot be discounted that cracking may have been induced during microstructural preparation. The minimal depletion of the beta-phase and relatively thin TGO suggest that many more hours of exposure at high temperatures would be possible before failure would occur.
Figure 12. H1 coating microstructure after 7000 thermal shock cycles. Deposits from A: the combustor burner; B: interface cracking.
Coatings 04 00630 g012
Figure 13 displays the microstructure of a P2 sample after approximately 7000 cycles. The sample is also representative of the P1 samples after the same number of test cycles. The growth of a thin TGO layer at the interface between bond coat and top coat can be observed. Additionally there has been growth of TGO along the inter-splat boundaries or delaminations internally within the bond coat. This P2 sample likewise shows evidence of some cracking (arrowed) in the inter-pass porosity layers at the edges of the columns/segments, which again may have occurred during metallographic preparation.
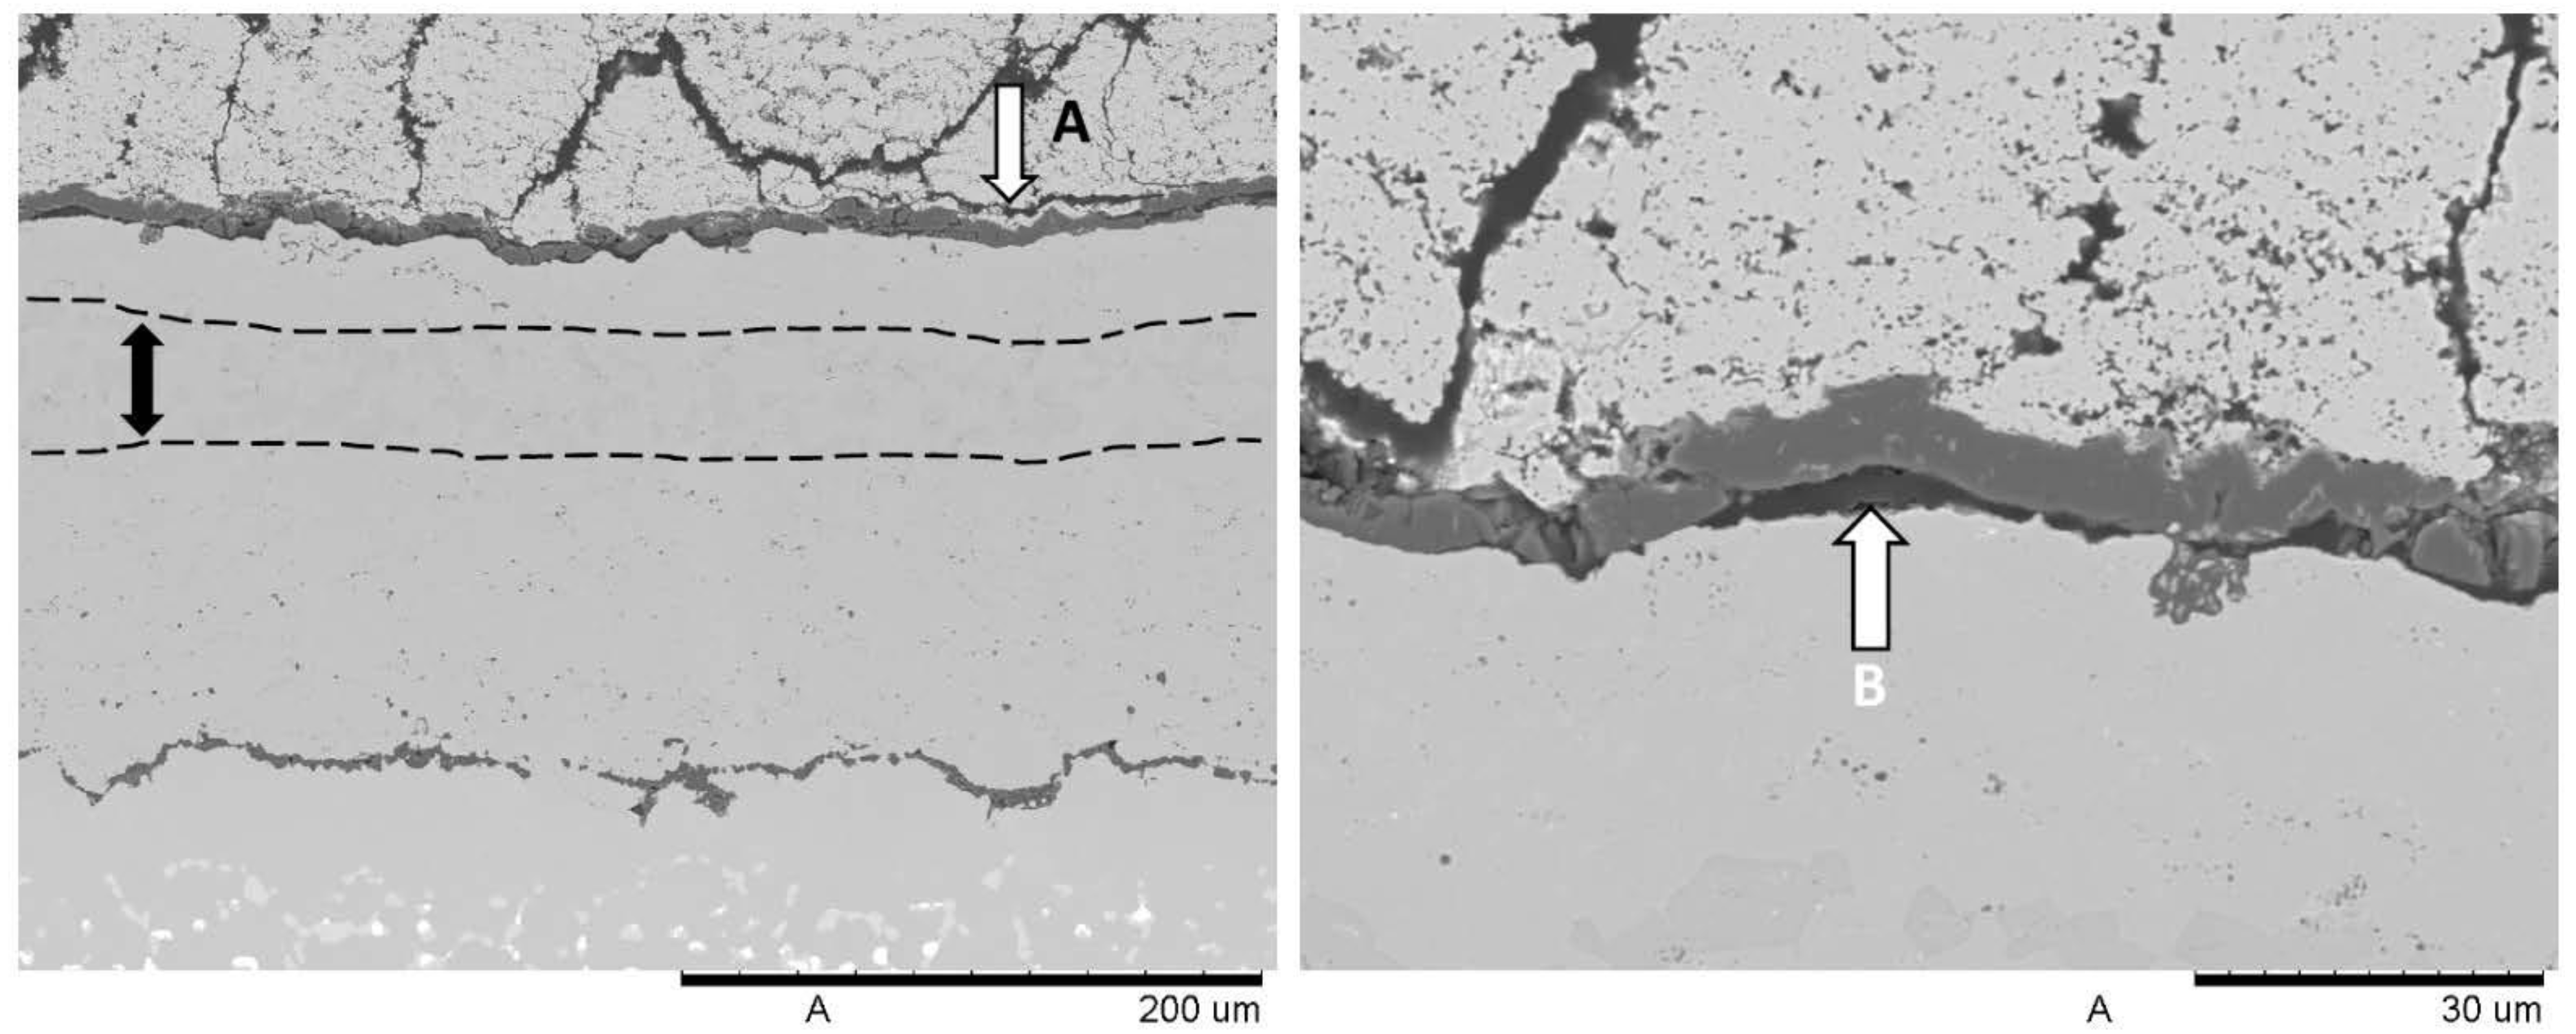
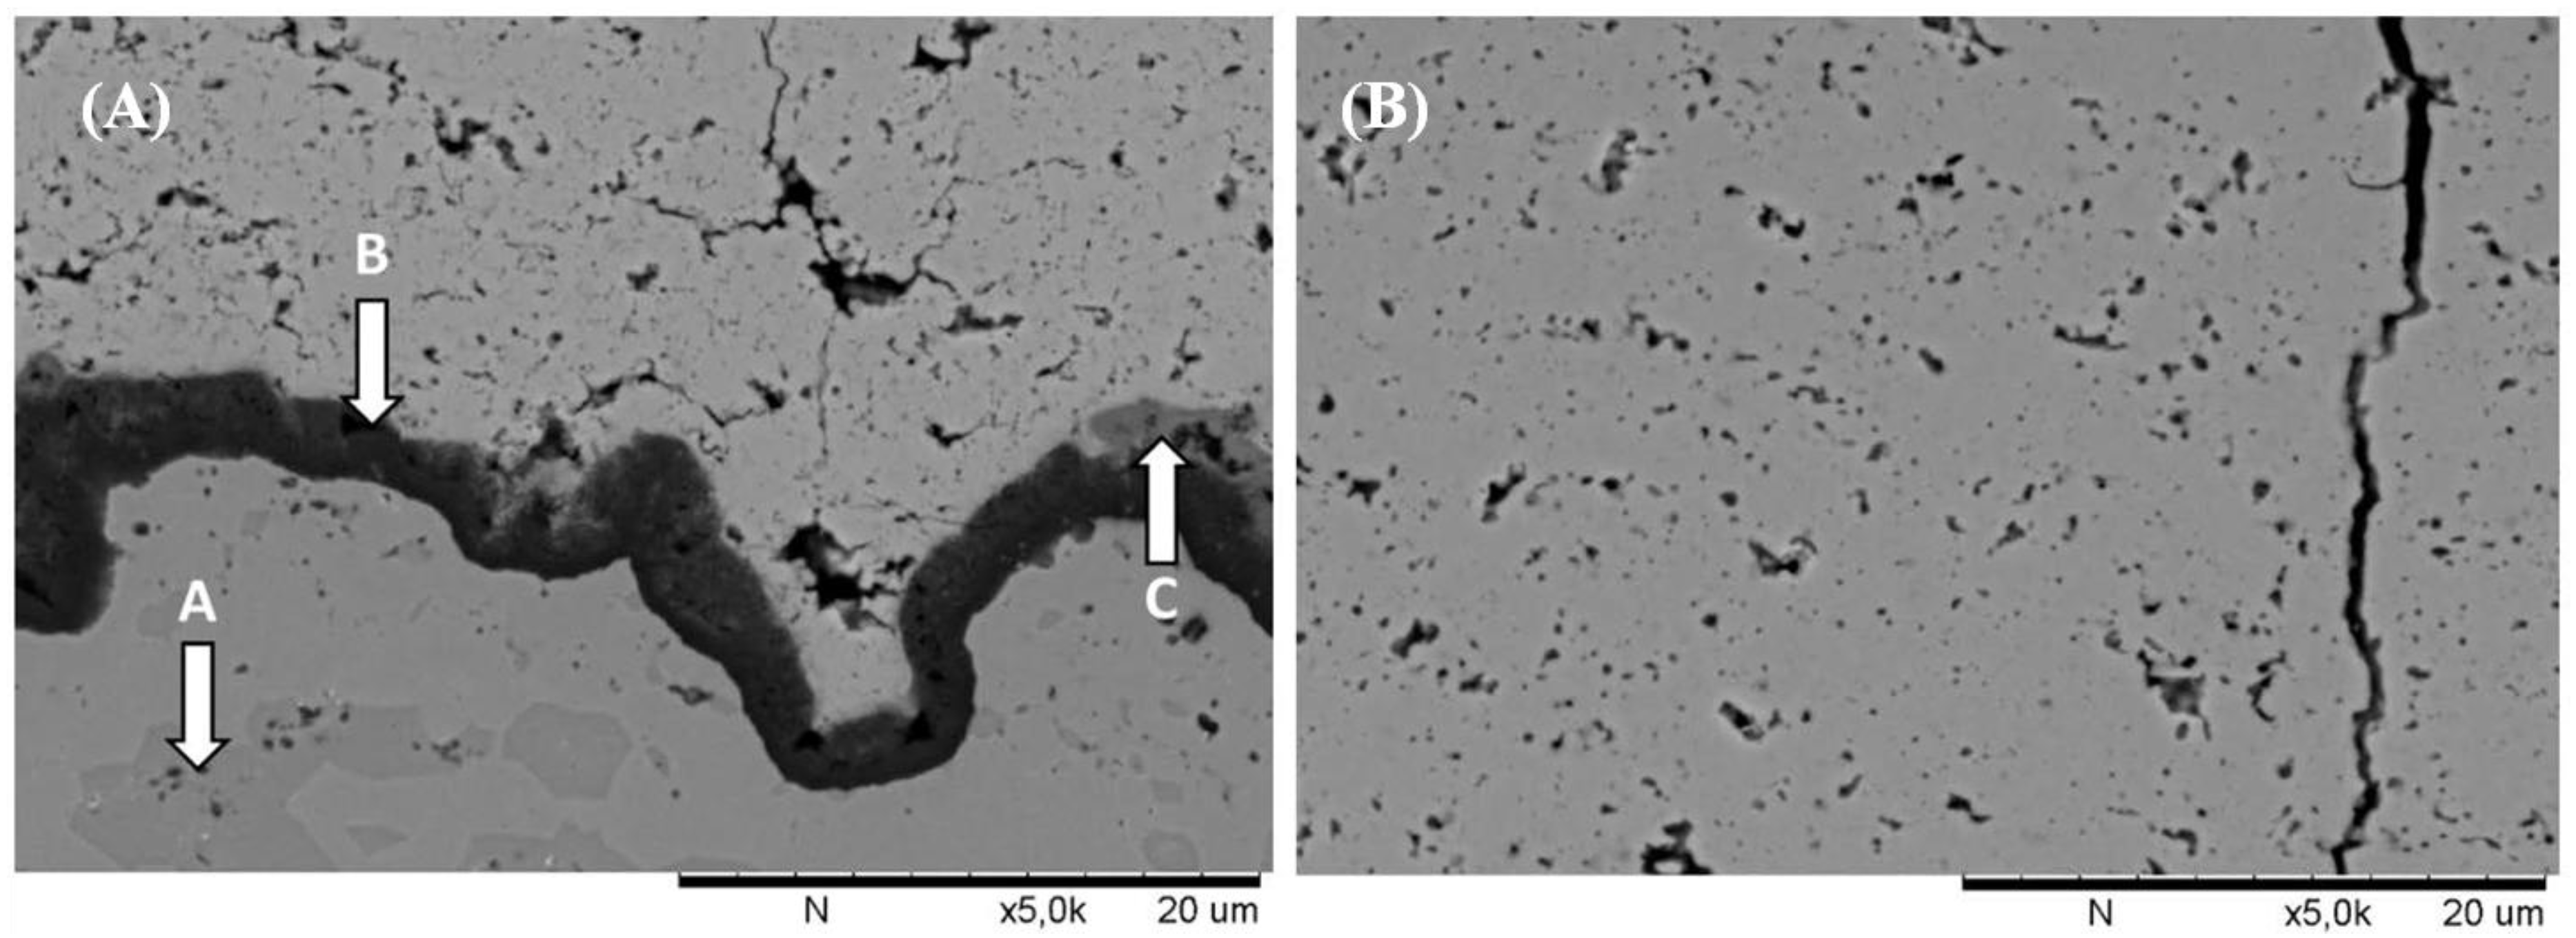
Figure 14 shows a comparison of the SPS coating close to the bond coat interface (left) and close to the top surface (right) for A3 coating after 8000 cycles. Beta phase zones are present within the HVAF bond coat close to the interface, (labeled A). The thin alumina layer can be seen at the interface between bond coat and top coat (labeled B). Unlike in in A3 TCF testing samples, the presence of mixed oxides (labeled C) was found above the alumina layer. These mixed oxides likely grow during early cycling of the coating before the alumina layer has a chance to completely form. Comparing the left and right images of Figure 14 shows that a difference in morphology exists between SPS coating porosity near the bond coat and that near the top surface. Pores close to the bond coat interface are irregularly shaped, while those close to the interface show a more rounded shape. This difference results from the temperatures close to the top surface being high enough to enable sintering. However, sintering in SPS coatings results in only minor changes in pore structure, primarily spheroidization of the pores and healing of boundaries and cracks. As the microstructure changes are not uniform throughout the coating, it can be expected that the impact of this sintering will be lower than that suggested in the thermal conductivity data of Figure 7, which corresponds to an isothermally exposed sample. The lower thermal conductivity increase for samples subjected to thermal gradient conditions indicates that the degradation in performance for real applications within a gas turbine will not be as severe as isothermal testing would suggest.
Figure 13. P2 coating after 7000 thermal shock cycles. Interface cracking arrowed.
Coatings 04 00630 g013
Figure 14. A3 coating microstructure after 8000 thermal shock cycles. (A) The bond coat interface is shown with: A: beta phase; B: alumina oxide TGO; C: mixed oxide; (B) The microstructure close to the surface is shown.
Coatings 04 00630 g014

4.5. Erosion Test Results

Erosion test data is shown in Figure 15. Due to a limited number of samples, only A3 specimens were tested from amongst the SPS samples in this study. As a reference, the erosion rate of a porous APS coating is shown along with the test data for an APS DVC sample. It can be seen that the SPS sample A3 erosion rate is over four-times lower than that of the porous APS coating. The erosion rate of the DVC coating is lower still, at approximately 60% of the A3 value. The microstructure of the coating A3 suggests it to be the most porous of the SPS coatings investigated here; thus, it is feasible that a denser SPS coating could have an erosion rate on par with a DVC coating. Cernuschi et al. [30] conducted a more detailed study comparing DVC structured APS coatings with EB-PVD coatings. Their work suggests that the erosion rates of EB-PVD and DVC structures are similar.
Figure 15. Erosion rate of coating A3 compared to dense vertically cracked and conventional porous APS ceramic thermal barrier coating (TBC) systems.
Coatings 04 00630 g015

5. Conclusions

Dense vertically cracked coatings, as the existing “state-of-the-art” in strain-tolerant TBCs that can be applied under atmospheric conditions, were compared to YSZ samples produced by the emerging atmospheric coating technology: suspension plasma spray. The suspension plasma spray YSZ coatings demonstrated a number of important improvements over established plasma spray coatings in the tests of this study:
  • The thermal conductivity of SPS coatings is in a similar range as that of conventional porous APS coatings and much lower than the competing DVC coatings;
  • The thermo-cyclic fatigue lifetime for SPS coatings is greater than for conventional strain-tolerant coatings, and their thermal shock lifetime is an order of magnitude greater than conventional APS;
  • The erosion resistance of the best performing SPS coating was only 40% lower than a DVC coating, bringing SPS into the same erosion rate as EB-PVD coating.
Overall, the performance of the SPS YSZ coatings shows promise as top coats in the thermal barrier systems for gas turbines. However the coatings presented in this article are presently still at the experimental stage. Further development is still required to gain better properties for SPS TBC as a whole system. In particular, more work is necessary to determine the appropriate bond coat for these SPS top coats. Furthermore, the correct balance of microstructural features (column morphology, column uniformity, intra-columnar porosity, etc.) in SPS coatings is not presently known. Lastly, confirmation of their viability as replacements to current TBC top coats requires directly comparing SPS TBC coatings to systems with EB-PVD ceramic layers.

Acknowledgments

Special thanks are given to Stefan Björklund for assistance with the HVAF bond coat production. Thanks are also given to Lars Östergren and Nicholas Erb at GKN Aerospace Engine Systems for help with the thermal shock rig and access to the HVOF production equipment. Further thanks are given to Wyszomir Janikowski for assisting with sample testing and evaluation. Additional thanks are given to Toni Bogdanoff, Jönköping University, for assistance with the thermal property evaluation.

Author Contributions

Nicholas Curry and Nicolaie Markocsan designed the experiments. Bond coat deposition was supervised by Nicholas Curry. Kent VanEvery and Todd Snyder performed the SPS coating experiments. The microstructure preparation, thermo-cyclic fatigue testing, SEM analysis, thermal diffusivity measurement and data analysis was carried out by Nicholas Curry. The paper was written by Nicholas Curry and Kent VanEvery.

Conflicts of Interest

The authors declare no conflict of interest.

References

  1. Soechting, F.O. A design perspective on thermal barrier coatings. J. Therm. Spray Technol. 1999, 8, 505–511. [Google Scholar] [CrossRef]
  2. Mutasim, Z.; Brentnall, W. Thermal barrier coatings for industrial gas turbine applications: An industrial note. J. Therm. Spray Technol. 1997, 6, 105–108. [Google Scholar] [CrossRef]
  3. Miller, R. Thermal barrier coatings for aircraft engines: History and directions. J. Therm. Spray Technol. 1997, 6, 35–42. [Google Scholar] [CrossRef]
  4. Schulz, U.; Leyens, C.; Fritscher, K.; Peters, M.; Saruhan-Brings, B.; Lavigne, O.; Dorvaux, J.-M.; Poulain, M.; Mévrel, R.; Caliez, M. Some recent trends in research and technology of advanced thermal barrier coatings. Aerosp. Sci. Technol. 2003, 7, 73–80. [Google Scholar] [CrossRef]
  5. Curry, N.; Markocsan, N.; Li, X.-H.; Tricoire, A.; Dorfman, M. Next generation thermal barrier coatings for the gas turbine industry. J. Therm. Spray Technol. 2010, 20, 108–115. [Google Scholar]
  6. Curry, N.; Markocsan, N.; Östergren, L.; Li, X.-H.; Dorfman, M. Evaluation of the lifetime and thermal conductivity of dysprosia-stabilized thermal barrier coating systems. J. Therm. Spray Technol. 2013, 22, 864–872. [Google Scholar] [CrossRef]
  7. Cernuschi, F.; Lorenzoni, L.; Ahmaniemi, S.; Vuoristo, P.; Mäntylä, T. Studies of the sintering kinetics of thick thermal barrier coatings by thermal diffusivity measurements. J. Eur. Ceram. Soc. 2005, 25, 393–400. [Google Scholar] [CrossRef]
  8. Golosnoy, I.; Cipitria, A.; Clyne, T. Heat transfer through plasma-sprayed thermal barrier coatings in gas turbines: a review of recent work. J. Therm. Spray Technol. 2009, 18, 809–821. [Google Scholar] [CrossRef]
  9. Curry, N.; Donoghue, J. Evolution of thermal conductivity of dysprosia stabilised thermal barrier coating systems during heat treatment. Surf. Coat. Technol. 2012, 209, 38–43. [Google Scholar] [CrossRef]
  10. Schulz, U.; Bernardi, O.; Ebach-Stahl, A.; Vaßen, R.; Sebold, D. Improvement of EB-PVD thermal barrier coatings by treatments of a vacuum plasma-sprayed bond coat. Surf. Coat. Technol. 2008, 203, 160–170. [Google Scholar] [CrossRef]
  11. Karger, M.; Vaßen, R.; Stöver, D. Atmospheric plasma sprayed thermal barrier coatings with high segmentation crack densities: Spraying process, microstructure and thermal cycling behavior. Surf. Coat. Technol. 2011, 206, 16–23. [Google Scholar] [CrossRef]
  12. Bengtsson, P.; Ericsson, T.; Wigren, J. Thermal shock testing of burner cans coated with a thick thermal barrier coating. J. Therm. Spray Technol. 1998, 7, 340–348. [Google Scholar] [CrossRef]
  13. Guo, H.B.; Kuroda, S.; Murakami, H. Segmented thermal barrier coatings produced by atmospheric plasma spraying hollow powders. Thin Solid Films 2006, 506–507, 136–139. [Google Scholar] [CrossRef]
  14. Kaßner, H.; Siegert, R.; Hathiramani, D.; Vaßen, R.; Stoever, D. Application of Suspension Plasma Spraying (SPS) for manufacture of ceramic coatings. J. Therm. Spray Technol. 2007, 17, 115–123. [Google Scholar]
  15. Guignard, A.; Mauer, G.; Vaßen, R.; Stöver, D. Deposition and characteristics of submicrometer-structured thermal barrier coatings by suspension plasma spraying. J. Therm. Spray Technol. 2012, 21, 416–424. [Google Scholar] [CrossRef]
  16. VanEvery, K.; Krane, M.; Trice, R.; Wang, H.; Porter, W.; Besser, M.; Sordelet, D.; Ilavsky, J.; Almer, J. Column formation in suspension plasma-sprayed coatings and resultant thermal properties. J. Therm. Spray Technol. 2011, 20, 817–828. [Google Scholar] [CrossRef]
  17. Killinger, A.; Gadow, R.; Mauer, G.; Guignard, A.; Vaßen, R.; Stöver, D. Review of new developments in suspension and solution precursor thermal spray processes. J. Therm. Spray Technol. 2011, 20, 677–695. [Google Scholar] [CrossRef]
  18. Bacciochini, A.; Ilavsky, J.; Montavon, G.; Denoirjean, A.; F, B.; Valette, S.; Fauchais, P.; Wittmann-teneze, K. Quantification of void network architectures of suspension plasma-sprayed (SPS) yttria-stabilized zirconia (YSZ) coatings using Ultra-small-angle X-ray scattering (USAXS). Mater. Sci. Eng. A 2010, 528, 91–102. [Google Scholar] [CrossRef]
  19. Stuke, A.; Kaßner, H.; Marqués, J.-L.; Vaßen, R.; Stöver, D.; Carius, R. Suspension and air plasma-sprayed ceramic thermal barrier coatings with high infrared reflectance. Int. J. Appl. Ceram. Technol. 2012, 9, 561–574. [Google Scholar] [CrossRef]
  20. Fazilleau, J.; Delbos, C.; Rat, V.; Coudert, J.F.; Fauchais, P.; Pateyron, B. Phenomena involved in suspension plasma spraying part 1: Suspension injection and behavior. Plasma Chem. Plasma Process. 2006, 26, 371–391. [Google Scholar] [CrossRef]
  21. Fauchais, P.; Rat, V.; Coudert, J.-F.; Etchart-Salas, R.; Montavon, G. Operating parameters for suspension and solution plasma-spray coatings. Surf. Coat. Technol. 2008, 202, 4309–4317. [Google Scholar] [CrossRef]
  22. Pawlowski, L. Suspension and solution thermal spray coatings. Surf. Coat. Technol. 2009, 203, 2807–2829. [Google Scholar] [CrossRef]
  23. Delbos, C.; Fazilleau, J.; Rat, V.; Coudert, J.F.; Fauchais, P.; Pateyron, B. Phenomena involved in suspension plasma spraying. Part 2: Zirconia particle treatment and coating formation. Plasma Chem. Plasma Process 2006, 26, 393–414. [Google Scholar] [CrossRef]
  24. Rampon, R.; Marchand, O.; Filiatre, C.; Bertrand, G. Influence of suspension characteristics on coatings microstructure obtained by suspension plasma spraying. Surf. Coat. Technol. 2008, 202, 4337–4342. [Google Scholar] [CrossRef]
  25. Berghaus, J.O.; Bouaricha, S.; Legoux, J.-G.; Moreau, C.; Chráska, T. Suspension Plasma Spraying of Nano-Ceramics using and Axial Injection Torch. In Proceedings of the International Thermal Spray Conference, Basel, Switzerland, 2–4 May 2005.
  26. Vaßen, R.; Cernuschi, F.; Rizzi, G.; Scrivani, A.; Markocsan, N.; Östergren, L.; Kloosterman, A.; Mevrel, R.; Feist, J.; Nicholls, J. Recent activities in the field of thermal barrier coatings including burner rig testing in the European Union. Adv. Eng. Mater. 2008, 10, 907–921. [Google Scholar] [CrossRef]
  27. Taylor, R.E. Thermal conductivity determinations of thermal barrier coatings. Mater. Sci. Eng. A 1998, 245, 160–167. [Google Scholar] [CrossRef]
  28. Evans, H.E. Oxidation-induced stresses in thermal barrier coating systems. In Advanced Ceramic Coatings and Interfaces V: Ceramic Engineering and Science Proceedings; Zhu, D., Lin, H.-T., Mathur, S., Ohji, T., Eds.; John Wiley & Sons, Inc.: Hoboken, NJ, USA, 2010; Volume 31. [Google Scholar] [CrossRef]
  29. Hille, T.S.; Turteltaub, S.; Suiker, A.S.J. Oxide growth and damage evolution in thermal barrier coatings. Eng. Fract. Mech. 2011, 78, 2139–2152. [Google Scholar] [CrossRef]
  30. Cernuschi, F.; Lorenzoni, L.; Capelli, S.; Guardamagna, C.; Karger, M.; Vaßen, R.; von Niessen, K.; Markocsan, N.; Menuey, J.; Giolli, C. Solid particle erosion of thermal spray and physical vapour deposition thermal barrier coatings. Wear 2011, 271, 2909–2918. [Google Scholar] [CrossRef]

