
Study of Toner Penetration in Papers by Laser Induced Plasma Spectroscopy and Optical Profilometry
1
Department of Chemistry, Nanoscience Center, University of Jyväskylä, P.O. Box 35, 40014 Jyväskylä, Finland
2
Stora Enso Oyj, Imatra Research Centre, 55800 Imatra, Finland
*
Author to whom correspondence should be addressed.
Coatings 2023, 13(2), 346; https://doi.org/10.3390/coatings13020346
Submission received: 29 December 2022
/
Revised: 27 January 2023
/
Accepted: 31 January 2023
/
Published: 2 February 2023
Abstract
:Four major toners are used in the printing industry, cyan, magenta, yellow and black (Key) for making color images on paper. Paper brands suitable for printing have thin mineral/latex coatings, and toners are applied on top of the coating in the printing process. Chemical compositions from toner to toner, as well as from coating to coating, vary according to the needs of the end user. Interactions between the toner and the coating define the final color formation of the images in printing. Hence, it is important to study characteristics and dynamics of toners on coated papers. In this paper, we have used laser-induced plasma spectroscopy (LIBS) to provide information on elemental distributions of the toner and the coating layers on three coated papers and the base paper at a sub-micrometer resolution. Ablation crater depth profiles in the three different material layers were converted into metric scale by combining elemental information from the LIBS measurements and optical profilometry. Ablation efficiencies for a toner of 150 nm/pulse, for a coating of approximately 350 nm/pulse and for a base paper of approximately 1 μm at a fluence of 0.6 J/cm2 of an ArF excimer laser were determined. Using these results, the average layer thicknesses of the toner and the coating layers were evaluated. The detailed analysis of the elemental profiles of the two cyan toners studied revealed strong accumulation of silicon and titanium compounds of the toner on the toner–air interface but also on the toner–coating interface, but to a much smaller extent. The observation reveals the significance of toner component diffusion due to substrate–machine interaction in the printing process. Such diffusion processes must have an important role in final color formation of the images in printing. The method developed provides a unique and accurate means to study toner diffusion processes in coated papers under printing conditions.
1. Introduction
Laser induced plasma spectroscopy (LIPS or LIBS) has become a commonly used method to study material distributions on surfaces [1]. A variety of promising applications have been demonstrated, e.g., identifying ores [2], analyzing inclusions in metals [3,4], mapping thickness variations of thin coatings [5,6] and the analysis of organic films prepared on inert substrates [7]. The analysis of paper, paper coatings and printed papers by the LIBS method was pioneered in our laboratory [8,9,10]. It was demonstrated that the pigment distribution of a coating can be determined at 0.1 mm lateral resolution and 0.5 μm depth resolution in minutes by recording the LIBS spectra of the macroscopic region of interest [2,8,10]. The method is applicable to the analysis of any coating used by the paper industry. By removing the entire coating with repetitive 2D ablation cycles, we can determine variations in coating thickness in an area of, typically, 1 cm2. Important information may be obtained on interfaces in multiple coatings, including the interface between the coating and the base paper. The first study on the variation of ink thickness on printed paper was published by Kansanaho et.al. [11] In this study, ink was removed by laser ablation, and the ablated areas were imaged using a microscope to reveal ink distribution after each ablation cycle. More specialized LIBS studies of paper include analysis of contaminants in papers with historical value [12] and removal of multilayer colors to obtain desired color patterns on ordinary paper [13]. In a recent paper by Leal-Ayala and Allwood (2010), laser ablation was used to de-ink laser printed paper [14].
In the present study, our intention was to study electrophotographic dry toner penetration in coated papers. The method developed is a general approach and applicable for the study of any toner or ink penetration in coated papers. A dry toner was deposited on coated substrates and coalesced or fused to finally form text and images on a paper substrate. A toner particle consists of pigments (3%–5%, particle sizes vary from 5 to 30 μm), resins (~90%–95%), charging compounds (1%–3%) and occasionally other additives such as waxes. The quality of a toner is related to the dispersion of these components in the particle and their diffusion in the printing process. Properties such as fixation of the toner on paper, charging efficiency in the printing process, color and gloss depend on toner quality. While the chemical component distributions in individual toner particles were analyzed by Iwata et al. by using scanning transmission X-ray microscopy [15], the component distribution is less reported to our understanding. Dot formation and spreading of individual toner particles on various types of substrates were studied by using optical microscopy [16]. The cross section analysis of printed toner was used, but such studies provided limited information that was mainly related to the impact of toner particles on substrate morphology [17]. Vikman and Sipi used FTIR and Raman spectroscopy to reveal information about the interface characteristics between toner layer and paper, with an attempt to determine component distribution and toner–paper interaction mechanisms [18]. However, these spectroscopic methods are normally limited to approximately 1 to 5 mm lateral resolution. FTIR measurements suffer from multiple component absorbency. Severe scattering and fluorescence from paper surfaces in Raman measurements result in a poor signal-to-noise ratio, and quantitative analysis becomes difficult.
Our method provides information on internal elemental distribution of the toner layer printed on coated paper or on base paper. The lateral resolution obtained in the present study approaches the printing resolution limit of 0.1 mm. Sub micrometer resolution, at best 150 nm, obtained in the z-direction is superior to what can be obtained by any other spectroscopic method. One of the goals of the present study was to determine characteristic single shot ablation depths in the toner, in the coating and in the base paper and to calibrate depth profiles in these layers into metric scale by using optical profilometry. With the calibrations in hand, depth profiles and local elemental concentrations in toner layers and toner–coating interfaces on three coated papers and a base paper could be determined. Unknown diffusion processes of the toner components could be traced and related to toner–coating–machine interactions taking place in the printing process.
2. Experimental
An ArF excimer laser (OPTex, Lambda physik GmbH) operating at 193 nm with a pulse duration of 8 ns was used to ablate the toner and the coating from the paper substrates. Measurement parameters were optimized to obtain a clear elemental signal from a toner layer as thin as possible. In order to obtain a flat-top beam profile, a 3 mm aperture was used to allow only the center part of the original laser beam to be focused to a spot size of 300 μm in diameter at the sample (determined from microscope images of the craters created). The focal waist of the laser beam was positioned in front of the sample surface to allow for smooth ablation. Laser pulse energy was measured by a joule meter (3A-P, Ophir Optronics Solutions Ltd., Jerusalem, Israel) and adjusted to 0.4 mJ, which provides a fluence of 0.6 Jcm−2 at the sample. The light emitted from the plasma was collected into an optical fiber and detected in an ICCD detector (InstaspecTM V, ICCD Detection System, Oriel Instruments, Stratford, CT, USA) through a 150 mm spectrograph (Acton SP-150, Princeton Instruments, Acton, MA, USA) with a 2400 grooves/mm grating. The time delay and the detection gate width were set to 50 and 300 ns, respectively. The setup used in the experiments is shown in Figure 1.
The ablation matrix used for evaluation of ablation efficiencies of the toner, the coating and the base paper is shown in Figure 2. Depths of the craters were measured by using optical profilometry (Rodenstock RM-600 white-light laser profilometer, Mahr Corp., Cincinnati, OH, USA) at StoraEnso Research Centre.
The LIBS measurement, after removal of the toner layer, was continued through the underlying paper coating and further into the base paper. Surface topography of the samples was measured by optical profilometry before and after ablation. Samples were marked into the corners by pinholes to allow for correct positioning before and after ablation. Ablation depths were determined from differences obtained by subtracting the profile images before and after ablation. The mean ablation efficiency was evaluated by dividing crater depths by the number of pulses used to create the crater. The results of ablation efficiencies for the tree studied domains in the z-direction, the toner layer, the coating layer and base paper are summarized in Figure 3. Using linear extrapolations for each layer domain mean ablation efficiencies for the toner, the coating and the base paper of 150, 350 and 1000 nm/pulse, respectively, were determined (Figure 3).
For all samples, a typical base paper (80 g/m2) was used as substrate and coated using a standard coating recipe containing 100 parts of calcium carbonate, 10 parts of styrene/butadiene latex and 1 part of sodium carboxymethyl cellulose. Contributions from the coating layer then could be identified by monitoring the calcium signal in the LIBS spectrum. Uncoated paper, 0 g/m2, was used as reference and three different coatings, 5 g/m2, 10 g/m2 and 15 g/m2 (coat weight term used in paper industry), with toner prints were studied. The samples were printed with an electrophotographic printer using chemical toners based on styrene/acrylate chemistry. Up to 60 laser pulses were needed to remove the toner, the coating layers and part of the base paper. Fifteen parallel determinations for each depth were made, and the results were averaged.
3. Results and Discussion
Elemental components of the toners, as well as the coatings, could be immediately identified in the LIPS spectrum. A few nanograms of material were needed for qualitative and quantitative analysis of elements at each ablation site. The chemical composition of a toner defines its color and several other functional properties. The most commonly used toners consist of resins, pigments and charging agents. In Figure 4, LIPS spectra of the four most commonly used toners are shown. Toner elements that can be identified with certainty in the spectra are carbon, copper, magnesium, titanium and silicon. It is noted that the black toner has the highest carbon content and a small amount of copper, the cyan toner is richest in copper, while the yellow and magenta toners do not contain copper. Emissions from diatomic molecules due to secondary reactions in the hot atmospheric plasma such as CN and C2 (not shown) could also be seen in the spectra. The iron spectrum was observed in toner powders that contained carrier particles. No iron was detected in the printed samples.
Toner spectra at different ablation depths revealed dramatic changes. Figure 5 shows LIPS spectra of two cyan toners, toner 1 (Figure 5a) and toner 2 (Figure 5b) printed on one of the coated papers. Both toners seem to have a very thin material layer (approximately 150 nm thick) on top of the print containing titanium and silicon (blue spectra). The accumulation of these constituents of the toner must be due to diffusion during the printing process. The LIBS spectra of the surface layer of toner 2 contains more silicon and titanium than toner 2 with respect to the carbon content. When going deeper into the print (at 150 nm steps) silicon and titanium signals are dramatically reduced and attain more or less a constant level. The carbon signal in toner 2 remains high and constant throughout the five ablated toner layers, but in toner 1, the carbon signal is almost two times stronger in layers than under the topmost layer, an observation that suggests that diffusion processes during printing process are characteristic of each toner. In these examples the coatings and the base paper were identical; only the cyan toners were different.
When approaching the toner–coating interface, the titanium and silicon signals increase again. Observation indicates that the silicon and titanium containing constituents of the toner accumulate to some extent also on the toner-coating interface. The two cyan toners show copper and carbon signals at depths far below 150 nm. The decays of these signals were chosen then to serve as a measure of average toner layer thickness. The depth profiles of five elements on one of the printed papers are shown in Figure 6. The calcium signal was used as a measure of coating thickness since it is present in neither the toner nor the base paper. In the creation of the elemental depth profiles, a constant ablation efficiency for each material layer was assumed, which means that each laser pulse removes the same amount of material over the thickness of the layer in question.
To obtain information on toner penetration in coatings, toner depth profiles in three coated papers with varying coat weights but with the same coating were recorded. To estimate the average toner thicknesses in the metric scale, the calibration of Figure 3 was used. Copper and calcium lines were used as indicators of the cyan toner layer and the coating layer, respectively. When entering the toner layer, the copper signal rises rapidly and afterwards experiences a decay, a characteristic of the underlying substrate. When entering the toner–coating interface, a rise in the calcium signal is observed, which is followed by a decay when reaching the coating–base-paper interface. In the experiment, 60 pulses per site were used and measurements were repeated in ten locations. Toner and coating thickness profiles for a cyan toner on base paper (0 g/m2) and three coated papers (5, 10,15 g/m2) are shown in Figure 7.
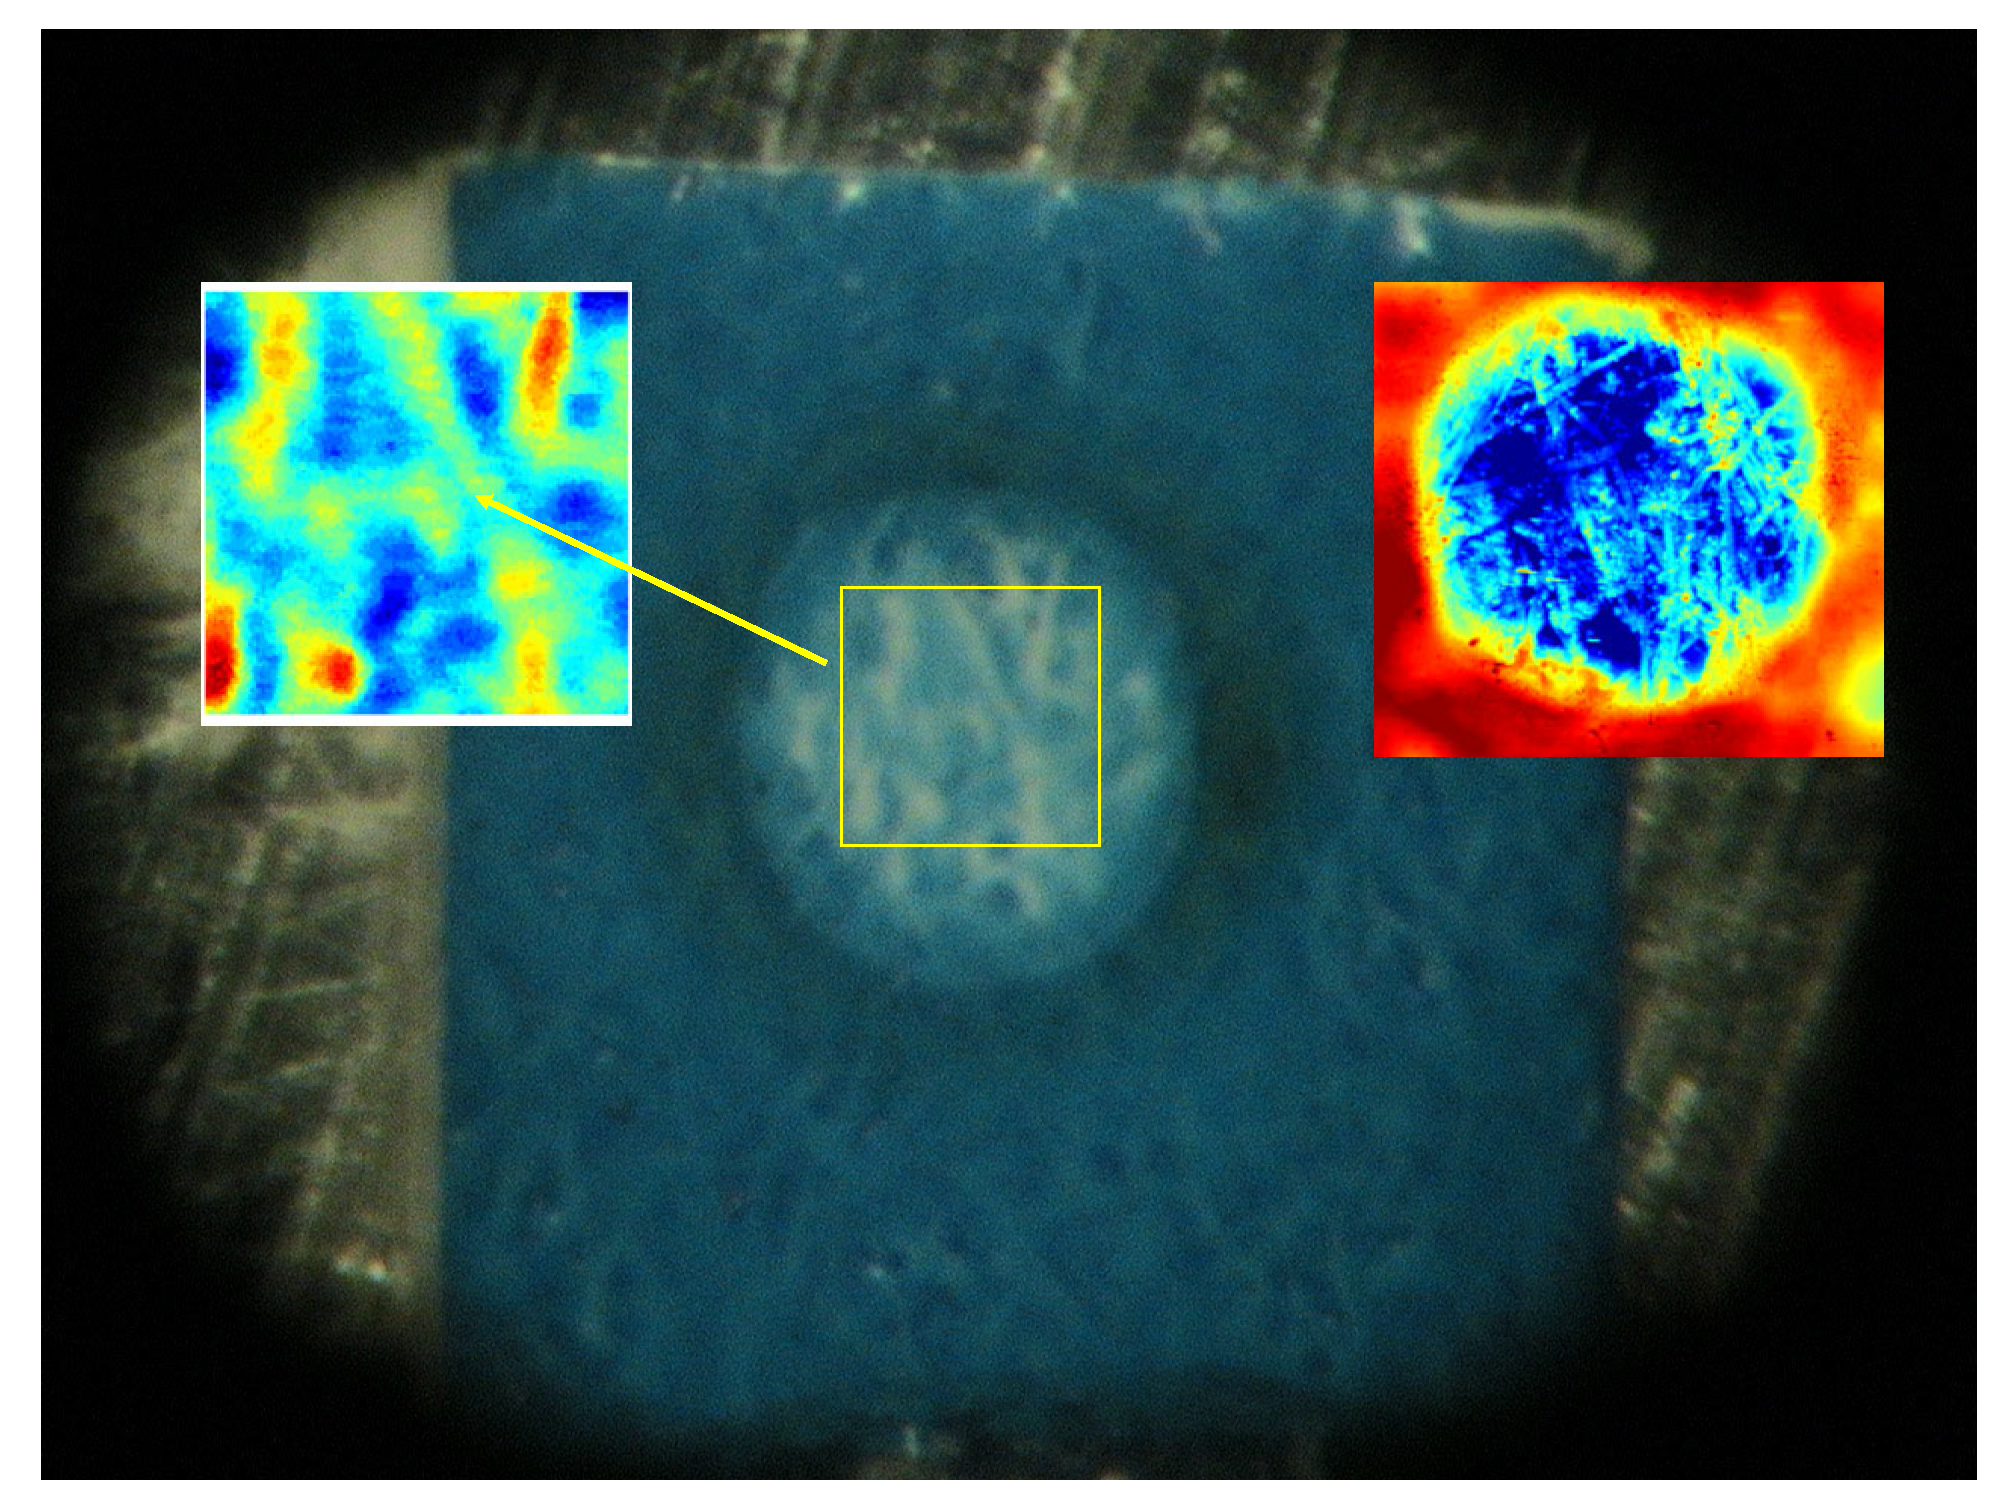
It can be seen that toner penetration into base paper is much less than in the coated papers. Toner thickness is nearly 50% thinner (approximately 2.5 μm) when printed on base paper than when printed on papers with coat weights higher than 10 g/m2 (Figure 7). This observation confirms the results from our earlier imaging studies that the toner is poorly attached to wood fibers exposed to toner in base paper and thinly coated papers [19]. In Figure 8, an optical microscopic image and toner distribution image of an ablated crater after almost full removal of the toner is shown, demonstrating the role of fibers in toner penetration. From Figure 7, it can be estimated that coating thicknesses for 5, 10 and 15 g/m2 coatings were approximately 4, 6 and 7 μm, respectively, measured at half maximum height. The onset of the coating after the toner layer seems to begin approximately 3.5 μm below the air–toner surface (Figure 7).
4. Conclusions
We were able to determine average toner penetration depths in printed papers by analyzing elemental profiles of the relevant layers, the toner and the coating layers by laser induced breakdown spectroscopy. To obtain the layer thicknesses in metric scale the ablation crater depths were analyzed by optical profilometry by determining the surface profile first and then repeating the analysis after laser ablation. It was found that cyan toner layer thickness on printed papers with coat weights higher than 10 g/m2 was approximately 5 μm, while in the non-coated reference paper, toner penetration was only 50% of that found in coated papers. This clearly demonstrates higher penetration of the toner in the coated papers, a prerequisite for a high quality print. One of the major findings of the present study was that titanium and silicon containing compounds present in the cyan toner strongly accumulate onto approximately 150 nm of the top layer at the air–toner interface. This unexpectedly thin layer is formed under printing conditions. Accumulation was also found to occur near the toner–coating interface, but to a much lower extent. The variation in the elemental constitution in the toner layer, especially at the air–toner and toner–coating interfaces, suggests significant diffusion of toner constituents during the printing process. Such diffusion processes, as far as we know, have not been reported at sub-micrometer resolution before, and such diffusion processes must have an important role in the final color formation of the images in printing and should be further studied for a number of paper coatings and toners used in printing.
Author Contributions
Spectroscopic measurements and the graphical presentations were made at the University of Jyväskylä laser laboratory, H.H.; profilometric measurements were made at StoraEnso research laboratory in Imatra, K.B. and P.S., original draft preparation and further revisions of the manuscript were done by H.H., K.B., P.S. and J.K.-T. All authors have read and agreed to the published version of the manuscript.
Funding
Research was funded by the Finnish Government Centre for Advancement of Technology (TEKES, project No 3113/31/04).
Institutional Review Board Statement
Not applicable.
Informed Consent Statement
Not applicable.
Data Availability Statement
Original data is not available due to privacy restrictions.
Acknowledgments
The Finnish Industrial Funding Agency Tekes is acknowledged for financial support and the University of Jyväskylä for providing the laser lab environment.
Conflicts of Interest
The authors declare no conflict of interest.
References
- Vadillo, J.M.; Laserna, J. Laser-induced plasma spectrometry: Truly a surface analytical tool. Spectrochim. Acta Part B At. Spectrosc. 2004, 59, 147–161. [Google Scholar] [CrossRef]
- Kaski, S.; Häkkänen, H.; Korppi-Tommola, J. Sulfide mineral identification using laser-induced plasma spectroscopy. Miner. Eng. 2003, 16, 1239–1243. [Google Scholar] [CrossRef]
- Rieger, G.; Taschuk, M.; Tsui, Y.; Fedosejevs, R. Laser-Induced Breakdown Spectroscopy for Two-Dimensional Microanalysis of using sub-millijoule UV laser pulses. Appl. Spectrosc. 2002, 56, 689–698. [Google Scholar] [CrossRef]
- Romero, D.; Romero, J.M.F.; Laserna, J.J. Distribution of metal impurities in silicon wafers using imaging-mode multi-elemental laser-induced breakdown spectrometry. J. Anal. At. Spectrom. 1999, 14, 199–204. [Google Scholar] [CrossRef]
- Vadillo, J.M.; Garcıa, C.C.; Palanco, S.; Laserna, J.J. Nanometric range depth-resolved analysis of coated-steels using laser-induced breakdown spectrometr y with a 308 nm collimated beam. J. Anal. At. Spectrom. 1998, 13, 793–797. [Google Scholar] [CrossRef]
- Papazoglou, D.G.; Papadakis, V.; Anglos, D. In situ interferometric depth and topography monitoring in LIBS elemental profiling of multi-layer structures. J. Anal. At. Spectrom. 2004, 19, 483–488. [Google Scholar] [CrossRef]
- Hedwig, R.; Budi, W.S.; Abdulmadjid, S.N.; Pardede, M.; Suliyanti, M.M.; Lie, T.J.; Kurniawan, D.P.; Kurniawan, K.H.; Kagawa, K.; Tjia, M.O. Film analysis employing subtarget effect using 355 nm Nd-YAG laser-induced plasma at low pressure. Spectrochim. Acta B 2006, 61, 1285–1293. [Google Scholar] [CrossRef]
- Häkkänen, H.J.; Korppi-Tommola, J.E.I. UV-Laser Plasma Study of Elemental Distributions of Paper Coatings. Appl. Spectrosc. 1995, 49, 1721–1728. [Google Scholar] [CrossRef]
- Häkkänen, H.J.; Jouko, E.I.; Tommola, K. Laser–Induced Plasma Emission Spectrometric Study of Pigments and Binders in Paper Coatings: Matrix Effects. Anal. Chem. 1998, 70, 472–4729. [Google Scholar] [CrossRef]
- Häkkänen, H.; Houni, J.; Kaski, S.; Korppi-Tommola, J. Analysis of paper by laser-induced plasma spectroscopy. Spectrochim. Acta Part B At. Spectrosc. 2001, 56, 737–742. [Google Scholar] [CrossRef]
- Kansanaho, J.; Korppi-Tommola, J.I.; Hakkanen, H. Print quality vs. coat weight and binder distribution in coated paper. In Proceedings of the Advanced Coating Fundamentals Symposium, San Diego, CA, USA, 4–5 May 2001; pp. 47–52. [Google Scholar]
- Ochocińska, K.; Sawczak, M.; Martin, M.; Jorgensen, J.; Kaminska, A.; Śliwiński, G. LIPS spectroscopy for the contamination analysis and laser cleaning diagnostics of historical paper documents. Radiat. Phys. Chem. 2003, 68, 227–232. [Google Scholar] [CrossRef]
- Stewart, R.; Li, L.; Thomas, D. Laser ablation of multilayers of ink from a paper substrate for tactile printing. Opt. Laser Technol. 2000, 32, 301–305. [Google Scholar] [CrossRef]
- Leal-Ayala, D.R.; Allwood, J.M.; Counsell, T.A.M. Paper un-printing: Using lasers to remove toner-print in order to reuse office paper. Appl. Phys. A 2011, 105, 801–818. [Google Scholar] [CrossRef]
- Iwata, N.; Tani, K.; Watada, A.; Ikeura-Sekiguchi, H.; Araki, T.; Hitchcock, A.P. Chemical component mapping of pulverized toner by scanning transmission X-ray microscopy. Micron 2006, 37, 290–295. [Google Scholar] [CrossRef] [PubMed]
- Pettersson, T.; Fogden, A. Spreading of individual toner particles studied using in situ optical microscopy. J. Colloid Interface Sci. 2005, 287, 249–260. [Google Scholar] [CrossRef] [PubMed]
- Hakola, E.; Koskinen, J.; Forsström, U.; Oittinen, P. Toner Penetration into Porous Substrates. J. Imaging Sci. Technol. 2008, 52, 40501. [Google Scholar] [CrossRef]
- Vikman, K.; Sipi, K. Application of FTIR and Raman spectroscopic methods to the study of paper-ink interactions in digital prints. J. Imaging Sci. Technol. 2003, 47, 139–148. [Google Scholar]
- Myllys, M.; Häkkänen, H.; Korppi-Tommola, J.; Backfolk, K.; Sirviö, P.; Timonen, J. X-ray microtomography and laser ablation in the analysis of ink distribution in coated paper. J. Appl. Phys. 2015, 117, 144902. [Google Scholar] [CrossRef] [Green Version]
Figure 1.
The LIPS setup used in the toner analysis.

Figure 2.
A microscopic image of a matrix of craters generated for evaluation of ablation efficiencies in the layers studied. The craters were 0.3 mm in diameter and the laser fluence per pulse was 0.6 Jcm−2. A computer controlled translational stage was used to laterally move the sample with respect to the laser focus and to generate the grid shown. The number of laser shots used for ablation increases from 5 to 55 at 5 shot increments from left to right. The spot column on the far left represents completely removed coating after 60 UV laser shots.

Figure 3.
Calibration of ablation depths of eight printed papers. In the figure, the number of laser pulses, shown along the x-axis, and penetration depths in μm, along the y-axis, obtained from optical profilometry are depicted. For each material layer, the toner (dark green), the coating (light green) and the base paper (dark red) characteristic ablation efficiency was evaluated (see text). Each experimental point represents an average from 15 independent measurements. Standard errors were determined to be below 10% at each depth point.

Figure 4.
LIPS spectra of the four conventional toners, cyan, magenta, yellow and key (black), (CMYK), used in the printing industry in the wavelength region from 200 nm to 400 nm. The carbon signal arises from carbon black, latex or cellulose constituents of a toner. Silicon and titanium are present in all toners. The copper signal is indicative of a cyan dye and is seen also in the black toner as a small signal.
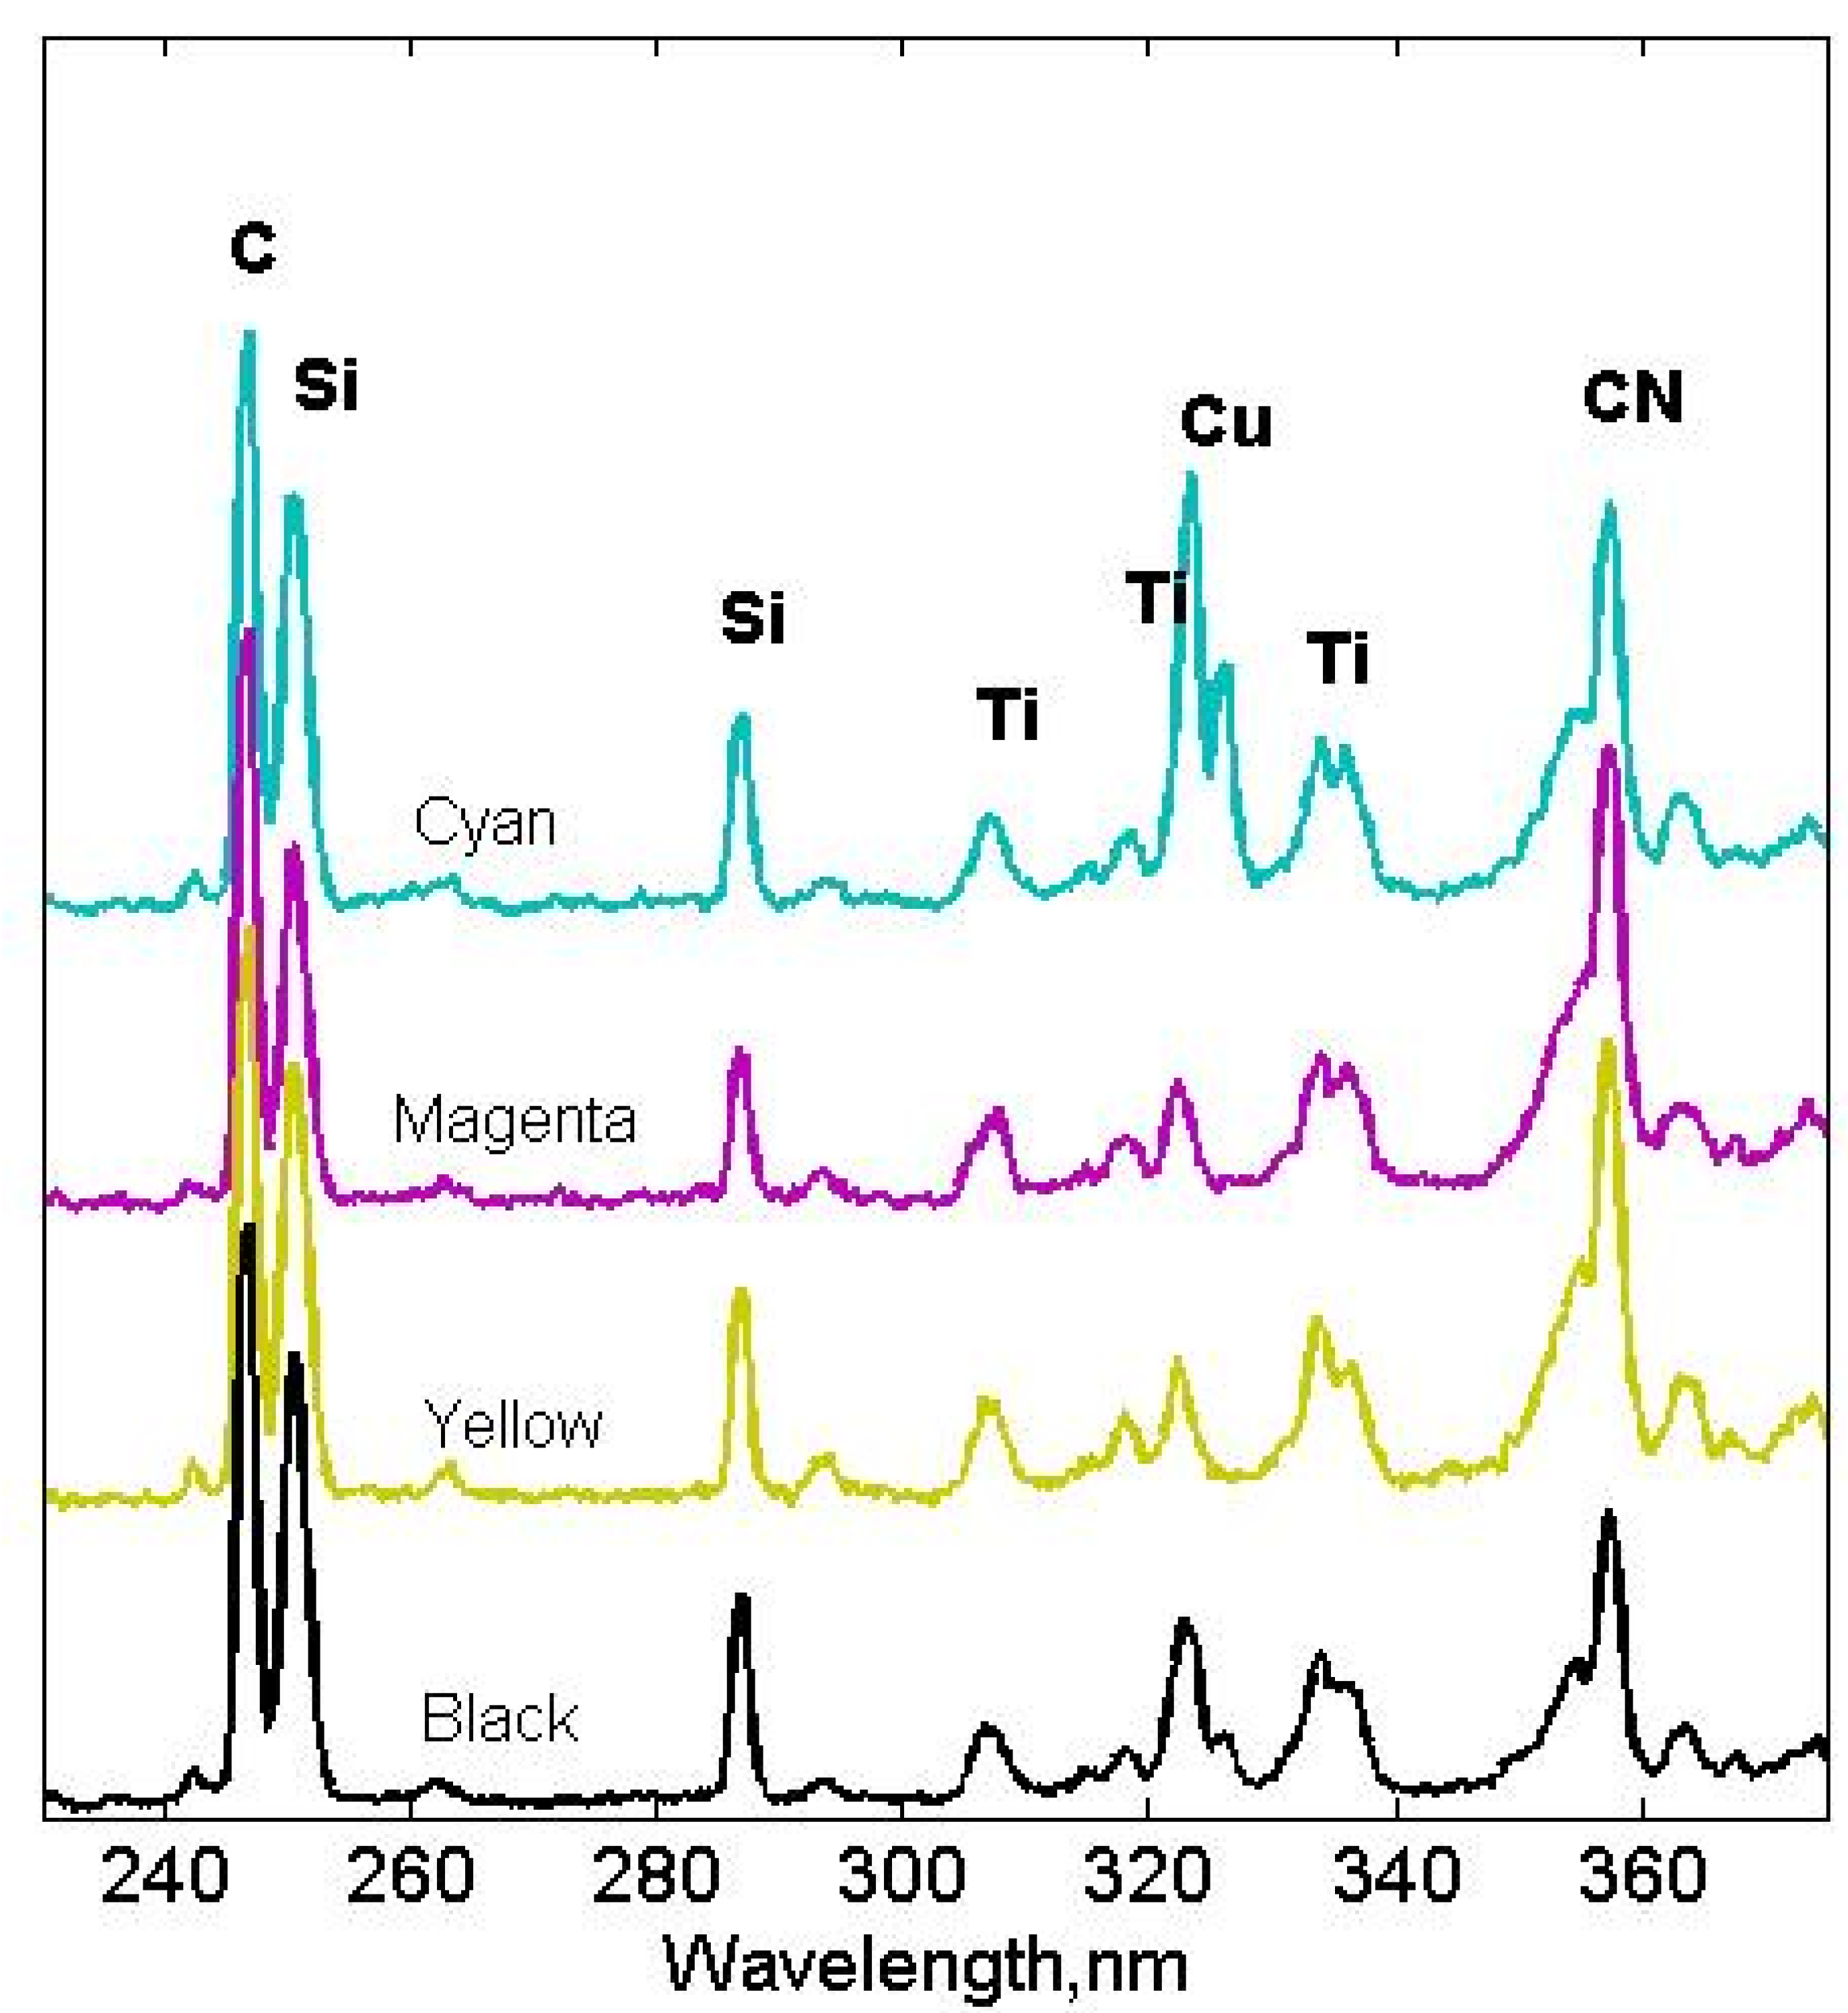
Figure 5.
LIBS spectra of five consecutively removed ablated toner layers approximately 150 nm in thickness from two cyan toners printed on coated paper. (a) Spectra from toner 1 and (b) the spectra from toner 2. Exceptionally strong signals at 252 nm and 288 nm (silicon) and at 325 nm and 335 nm (titanium) from the first ablated toner layers (blue spectra) clearly indicate diffusion of silicon and titanium toner constituents to the air–toner interface during printing.
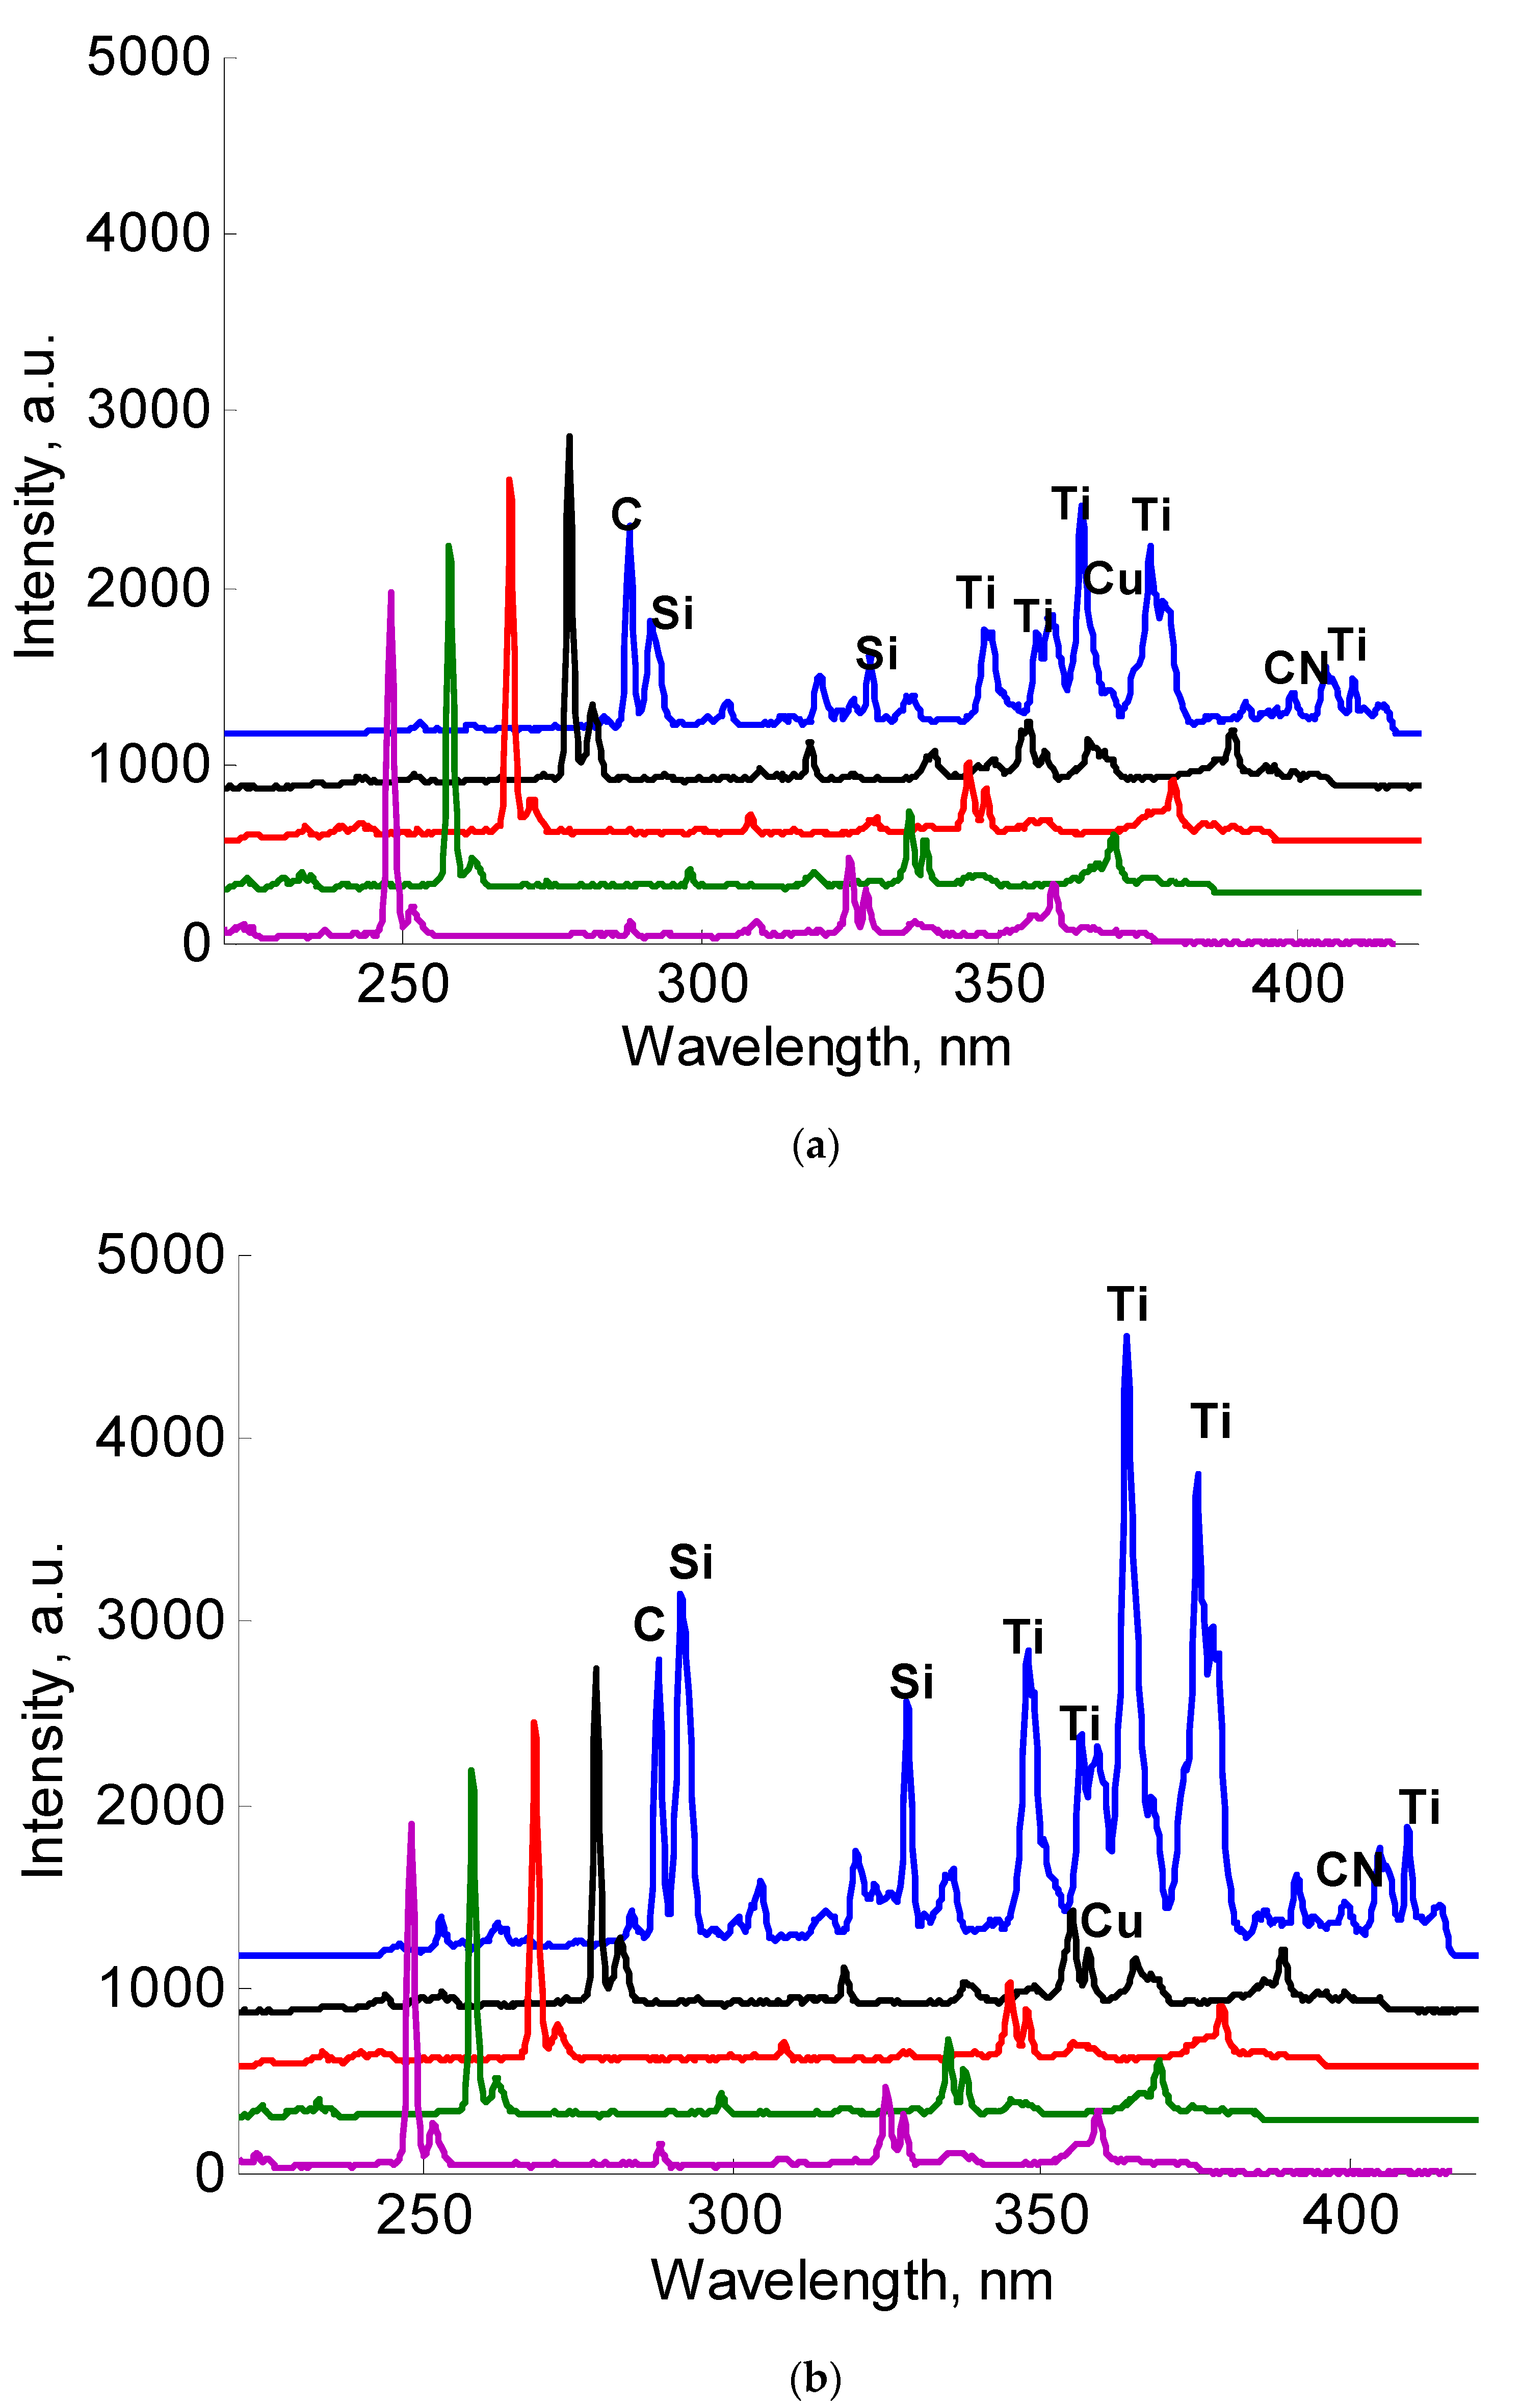
Figure 6.
Normalized elemental concentration profiles of a toner print as a function of depth in a printed paper. Silicon and titanium exhibited very strong signals at the air–toner interface (not used in normalization) but the elements also accumulated in the toner–coating interface, as shown in the figure. Observe that the horizontal axis provides the mean of the number of laser pulses used to remove the toner.
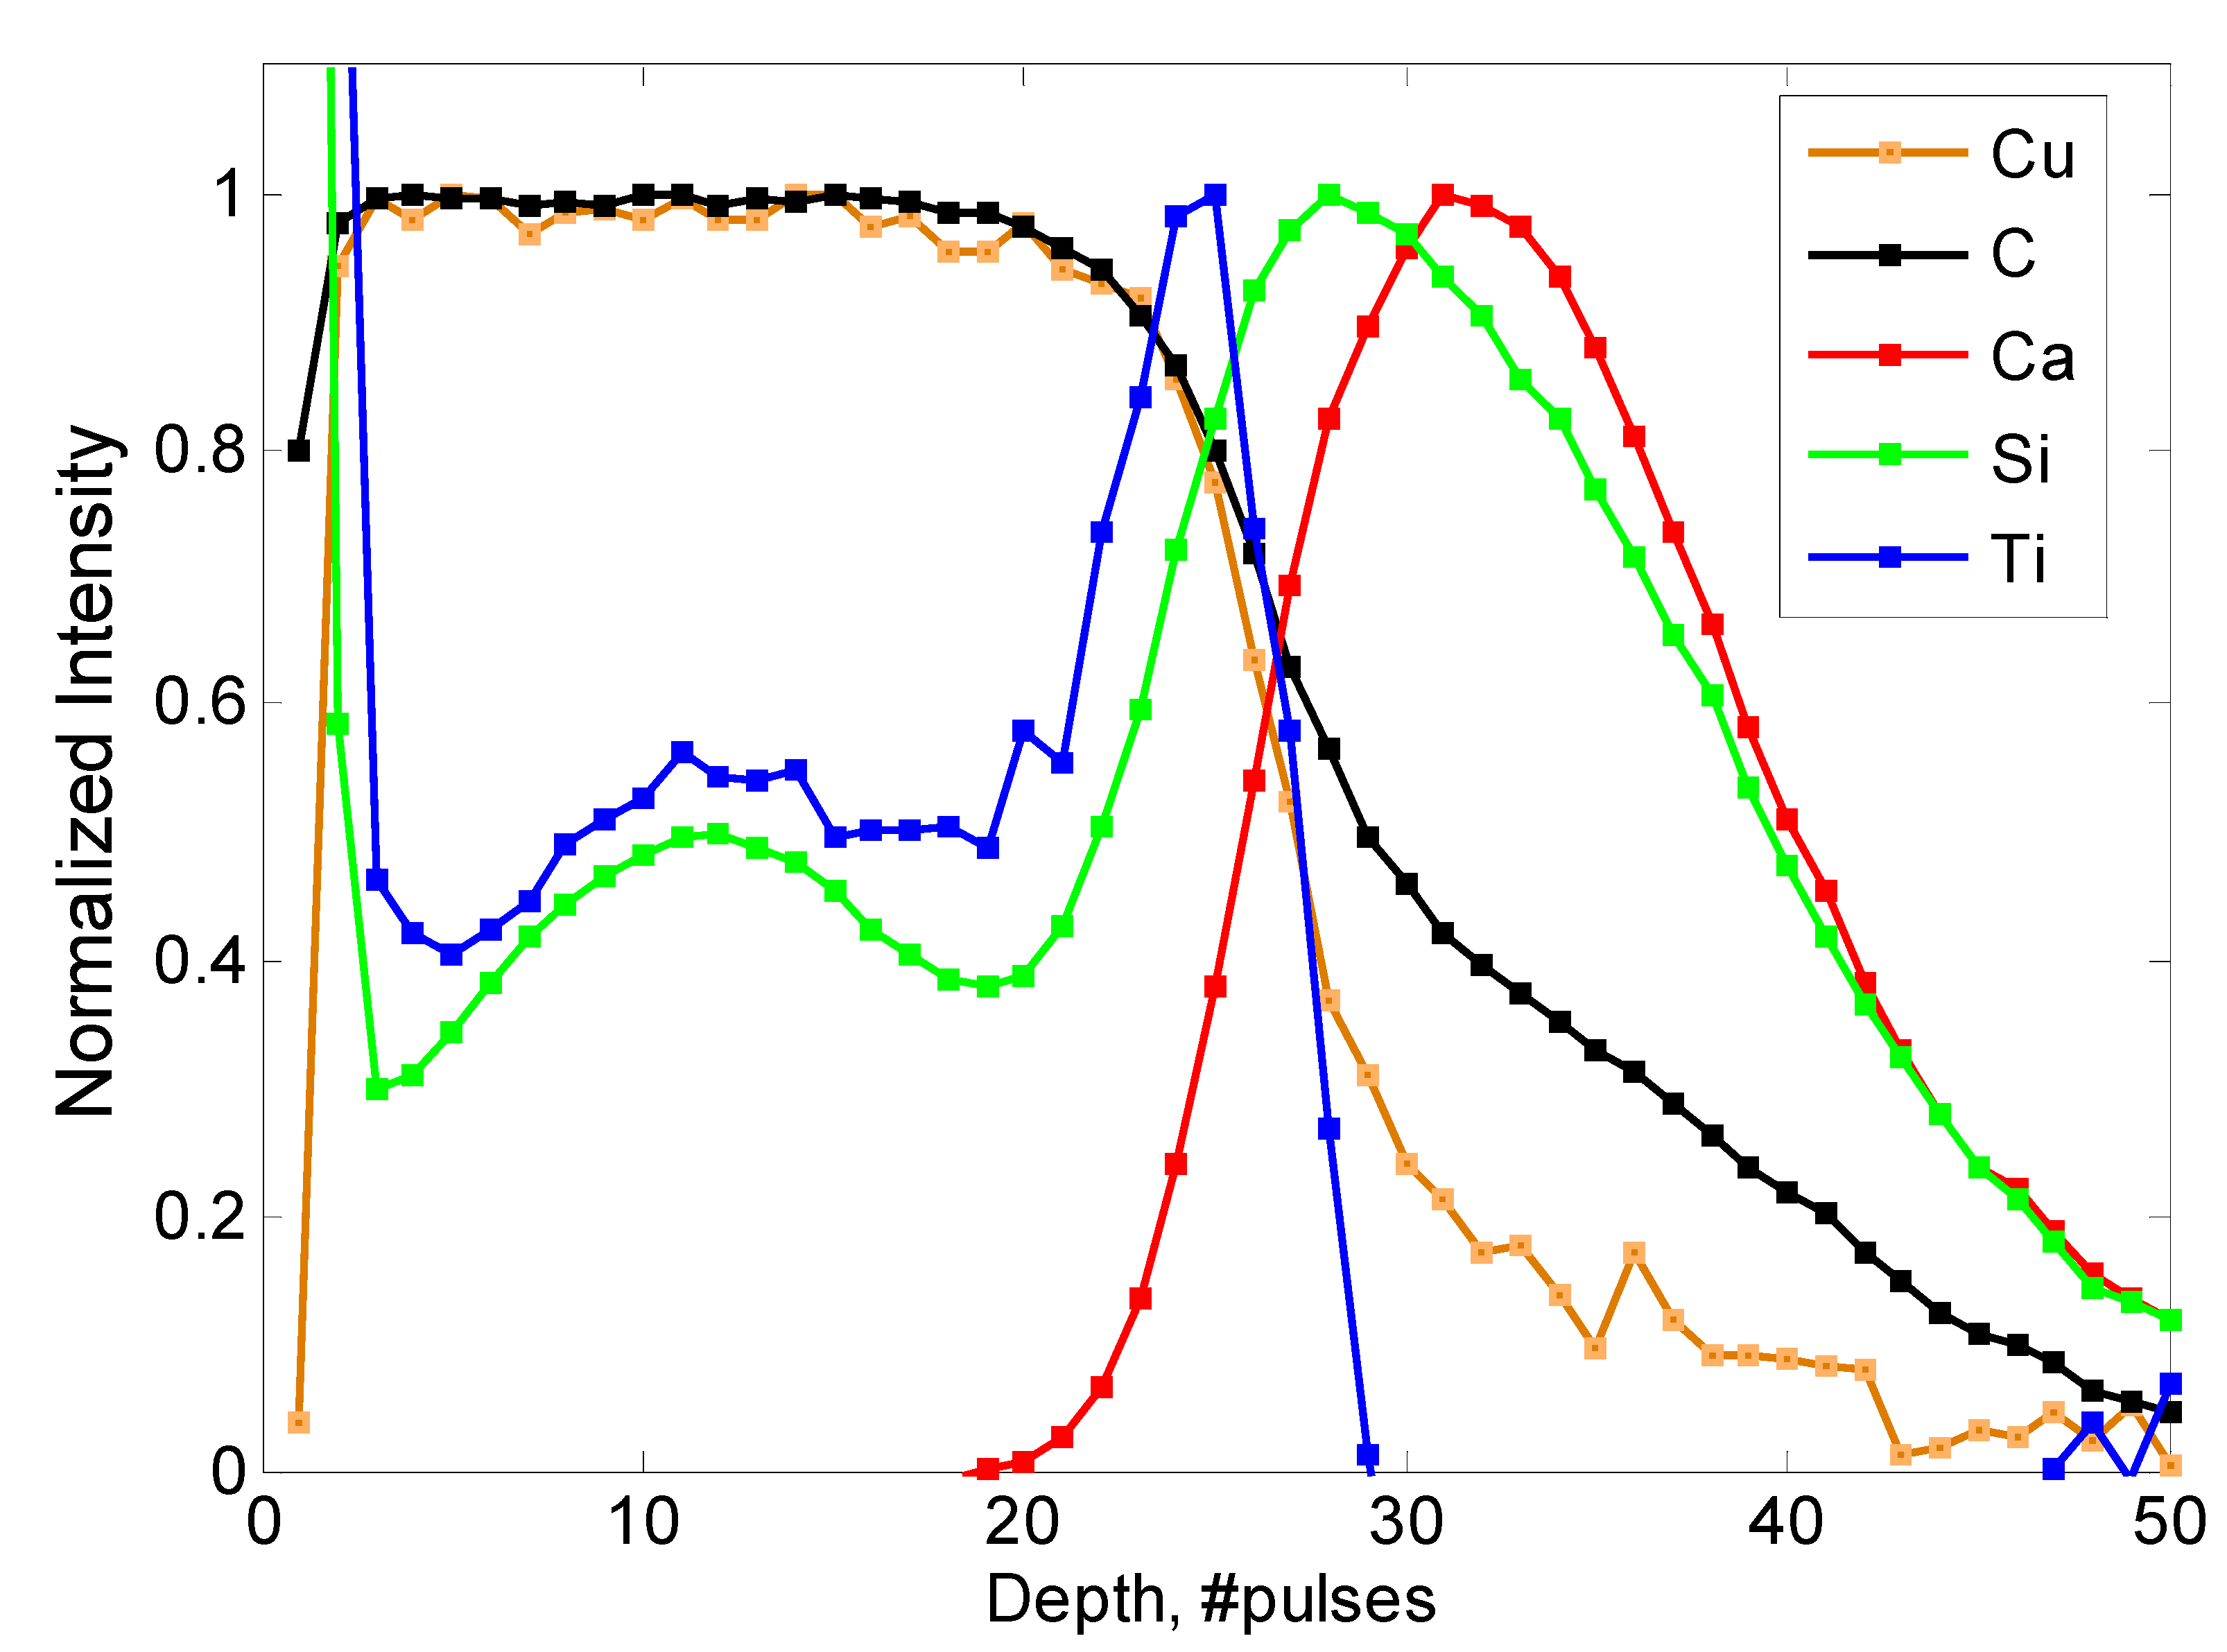
Figure 7.
Elemental (copper and calcium) depth profiles of cyan toner printed on an uncoated and on three coated papers (coat weights 5,10,15 gm−2), determined from LIBS data. In the figure, ablation depths are transformed into absolute length scale (μm) along the horizontal axis according to results shown in Figure 3. The vertical axis denotes normalized intensity. We observed zero calcium signal in the printed base paper.

Figure 8.
Microscopic image of a typical crater bottom, where most of the toner and coating were removed. Inserts show spatial toner distribution obtained from elemental LIBS information. Observe the role of fibers in fixing the toner. Blue color refers to low and red color to high toner concentration, respectively.
Disclaimer/Publisher’s Note: The statements, opinions and data contained in all publications are solely those of the individual author(s) and contributor(s) and not of MDPI and/or the editor(s). MDPI and/or the editor(s) disclaim responsibility for any injury to people or property resulting from any ideas, methods, instructions or products referred to in the content. |
© 2023 by the authors. Licensee MDPI, Basel, Switzerland. This article is an open access article distributed under the terms and conditions of the Creative Commons Attribution (CC BY) license (https://creativecommons.org/licenses/by/4.0/).
Share and Cite
MDPI and ACS Style
Häkkänen, H.; Backfolk, K.; Sirviö, P.; Korppi-Tommola, J. Study of Toner Penetration in Papers by Laser Induced Plasma Spectroscopy and Optical Profilometry. Coatings 2023, 13, 346. https://doi.org/10.3390/coatings13020346
AMA Style
Häkkänen H, Backfolk K, Sirviö P, Korppi-Tommola J. Study of Toner Penetration in Papers by Laser Induced Plasma Spectroscopy and Optical Profilometry. Coatings. 2023; 13(2):346. https://doi.org/10.3390/coatings13020346
Chicago/Turabian StyleHäkkänen, Heikki, Kaj Backfolk, Petri Sirviö, and Jouko Korppi-Tommola. 2023. "Study of Toner Penetration in Papers by Laser Induced Plasma Spectroscopy and Optical Profilometry" Coatings 13, no. 2: 346. https://doi.org/10.3390/coatings13020346
Note that from the first issue of 2016, this journal uses article numbers instead of page numbers. See further details here.