Article

Lipid Bilayer Membrane in a Silicon Based Micron Sized Cavity Accessed by Atomic Force Microscopy and Electrochemical Impedance Spectroscopy

by
Muhammad Shuja Khan
1,*,
Noura Sayed Dosoky
2,
Darayas Patel
3,
Jeffrey Weimer
4 and
John Dalton Williams
1
1
Electrical and Computer Engineering Department, University of Alabama in Huntsville, Huntsville, AL 35899, USA
2
Biotechnology Science and Engineering Program, University of Alabama in Huntsville, Huntsville, AL 35899, USA
3
Department of Mathematics and Computer Science, Oakwood University, Huntsville, AL 35896, USA
4
Chemistry/Chemical and Materials Engineering Department, University of Alabama in Huntsville, Huntsville, AL 35899, USA
*
Author to whom correspondence should be addressed.
Biosensors 2017, 7(3), 26; https://doi.org/10.3390/bios7030026
Submission received: 15 May 2017 / Revised: 27 June 2017 / Accepted: 30 June 2017 / Published: 5 July 2017
(This article belongs to the Special Issue Nanomaterials Based Optical Biosensors)

Abstract

:
Supported lipid bilayers (SLBs) are widely used in biophysical research to probe the functionality of biological membranes and to provide diagnoses in high throughput drug screening. Formation of SLBs at below phase transition temperature (Tm) has applications in nano-medicine research where low temperature profiles are required. Herein, we report the successful production of SLBs at above—as well as below—the Tm of the lipids in an anisotropically etched, silicon-based micro-cavity. The Si-based cavity walls exhibit controlled temperature which assist in the quick and stable formation of lipid bilayer membranes. Fusion of large unilamellar vesicles was monitored in real time in an aqueous environment inside the Si cavity using atomic force microscopy (AFM), and the lateral organization of the lipid molecules was characterized until the formation of the SLBs. The stability of SLBs produced was also characterized by recording the electrical resistance and the capacitance using electrochemical impedance spectroscopy (EIS). Analysis was done in the frequency regime of 10−2–105 Hz at a signal voltage of 100 mV and giga-ohm sealed impedance was obtained continuously over four days. Finally, the cantilever tip in AFM was utilized to estimate the bilayer thickness and to calculate the rupture force at the interface of the tip and the SLB. We anticipate that a silicon-based, micron-sized cavity has the potential to produce highly-stable SLBs below their Tm. The membranes inside the Si cavity could last for several days and allow robust characterization using AFM or EIS. This could be an excellent platform for nanomedicine experiments that require low operating temperatures.

Graphical Abstract

1. Introduction

Supported lipid bilayers (SLBs) are commonly used to model cell membranes and its native proteins [1]. Production of SLBs as a model system comprised of either single or multiple component lipids has been done using vesicle fusion [2,3,4,5,6,7], Langmuir–Blodgett/Langmuir–Schaefer deposition [8,9]. Scanning probe lithography methods as Dip-Pen Nanolithography [10,11,12,13] and Polymer Pen Lithography [14] could also be utilized for the production of lipid bilayer membrane. Vesicle fusion is the most common method on hydrophilic surfaces [1]. Vesicles adsorb on the surface and rupture, leading to bilayer formation across the entirety of the hydrophilic support [15]. The presence of a hydration layer approximately 1–2 nm between the support and the lower lipid leaflet allows the bilayer to remain laterally fluid and enables diffusion of lipids [16]. The production of SLBs is often carried out at above the phase transition temperature (Tm) of lipids on supports such as glass, mica, Si3N4, and porous membranes including alumina, gold coated alumina, and silicon (Si) [1]. In recent years, the scientific community has shown a progressive interest in analyzing biological samples on silicon based materials because they have proven to be biocompatible, biodegradable, and photoluminescent [1,17,18]. Few reports are available for the production of lipid membranes below or close to their Tm [19,20]. The protocols used to prepare membranes on substrates also vary [21,22,23,24], possibly due to variations in the concentration of the lipids, in their incubation temperature and time, or in the substrates used. The transition temperature is expected to depend on the vesicle size or the substrate. However, the formation of lipid bilayers at or in proximity to Tm has been rarely studied to validate this hypothesis. One study has been reported with 1,2-dipalmitoyl-sn-glycero-3-phosphocholine (DPPC) mixtures [19], and the parameters governing the process have only been partially discussed.
Atomic force microscopy (AFM) has been widely utilized to investigate the mechanical behavior of SLBs at real space under physiological environment [25]. With AFM, vesicles and bilayer patches can easily be distinguished from each other at nanometer resolutions. Electrochemical impedance spectroscopy (EIS) has also been utilized to investigate the electrical properties (resistance and capacitance) of the pre-formed lipid bilayer membranes produced at different support [26]. Therefore, AFM and EIS are the potential tools to characterize the membrane formation process in real-time fashion at above and below the Tm of the lipids and also to investigate the stability of the membrane for longer duration.
In this work, we present the complete, robust method to prepare SLBs at the center of an anisotropically etched, thin Si membrane. An etched well was created to maintain a controlled temperature for the buffer solution where the lipid bilayer can easily be formed. The procedure started with the layout that will produce a silicon micro-cavity using microfabrication. This cavity was used to create SLBs at temperatures above and below Tm of the lipids. The effect of incubation temperature and cooling rate on the quality of membrane formed by 1,2-dipalmitoyl-sn-glycero-3-phosphoethanolamine (DPPE) and 1,2-dipalmitoyl-sn-glycero-3-phosphoserine (DPPS) were elaborated and captured. Experiments have been done in a natural fluidic environment using AFM to monitor the continuous fusion of vesicles until the complete formation of the SLBs inside the cavity. The electrical resistance and the capacitance of the bilayers were obtained using EIS continuously for over four days. We finally demonstrate that rupture force and lipid bilayer depth values for SLB produced below the Tm by employing force spectroscopy experiment and the results are in good agreement with other AFM studies.

2. Materials and Methods

2.1. Materials and Instruments

A silicon wafer polished on both side was purchased from Silicon Valley Microelectronics, Inc. (Santa Clara, CA, USA), stock ampules (25 mg) of 1,2-dipalmitoyl-sn-glycero-3-phosphoethanolamine (DPPE) and 1,2-dipalmitoyl-sn-glycero-3-phosphoserine (DPPS) were purchased from Avanti Polar Lipids Inc., (Alabaster, AL, USA). Molecular sieves 4 Å and nylon filter (0.2 μm) were purchased from Sigma-Aldrich Corp. (St. Louis, MO, USA). Silicon Nitride cantilevers with spring constants 0.3 N/m were purchased from Bruker Inc. (Camarillo, CA, USA). The instruments used include a Branson 1510 sonicator bath, a white light interferometer (WYKO NT1100, Veeco, Tucson, AZ, USA, a surface profiler (TENCOR P10, KLA-Tencor, Milpitas, CA, USA), a Plasma-Therm 790 Series (Saint Petersburg, FL, USA), a scanning electron microscope (LEO1550, Pleasanton, CA, USA), an atomic force microscope (Pico Plus AFM 1550 from Molecular Imaging, Keysight Technologies, Santa Rosa, CA, USA), and an electrochemical impedance spectroscope (VersaSTAT MC by Princeton Applied Research, AMETEK, Berwyn, PA, USA.

2.2. Fabrication and Functionalization of Micron-Sized Cavity

A silicon-on-insulator (SOI) wafer was used with dimension 500:2:2.5 μm. A Si3N4 layer with a thickness of 2 μm was deposited on both sides using plasma enhanced chemical vapor deposition. This was followed by pattering a 1 mm × 1 mm square with SPR220 photoresist. Reactive ion etching was then performed to etch the exposed area of Si3N4. Next, a micron-sized silicon cavity of 20 μm × 20 μm was fabricated by immersing the chip in 30% KOH at 55 °C. A thin silicon membrane support with thickness of 2 μm was finally prepared by removing the SiO2 layer using 2% HF. The Si cavity chip was functionalized using 1% Triton X-100 (TX-100) [27] solution dissolved in phosphate buffered saline and incubated for 10 min. Detergent molecules were used to solubilize nanopore chip onto the surface through hydrophobic interactions and created half-micelle structures with the hydrophilic head group facing outward into the aqueous environment. The nanopore chip was washed with 0.1% TX-100 solution dissolved in PBS and dried overnight under germ free condition for air drying at room temperature.

2.3. Preparation of Large Unilamellar Vesicles and Lipid Bilayer Membrane

Ampoules with lipids were dispensed in chloroform solution and the contents were transferred into pre-rinsed glass vials (2 mL). The vials were covered with teflon side screw cap and were stored at −20 °C. The final concentration of lipidic solution used in this work was 300 μL for DPPE (5 mg/mL) and 150 μL for DPPS (5 mg/mL). The solvent was evaporated under nitrogen for 15 min. The lipids were further dried in desiccator for 1 h under vacuum and rehydrated by adding the buffer comprising of 10 mM Tris and 10 mM NaCl. The large unilamellar vesicles (LUVs) were produced by sonication using a sonicator bath at room temperature for 40 min. Vesicles were then incubated for 20 min. The incubation temperatures were one slightly above (70 °C) and one below (50 °C) the Tm of DPPE and DPPS. Finally, the samples were cooled down to room temperature at the rate of 1 °C/min for the complete fusion and formation of SLBs. The sample was then rinsed with the buffer solution at room temperature several times in order to remove unfused vesicles attached to the membrane surface.

2.4. Atomic Force Microscopy

The membrane imaging was performed in warm buffer comprised of 10 mM Tris and 10 mM NaCl using AFM nanoscope equipped with a J scanner (maximum XY scan range of 60 μm × 60 μm). The silicon cavity coated with lipid bilayer membrane was mounted in a fluid cell and was characterized in non-contact mode. A low force cantilever with a spring constant of 0.3 N/m was used to prevent any damage during scanning of the membrane surface. The cantilever oscillation was turned to a frequency of 120–180 kHz and the amplitude kept below a maximum of 6 nm. The scan rate was set to 5–10 Hz for imaging areas larger than 1 μm × 1 μm and was set to 10–22 Hz for smaller areas. The force applied on the sample was maintained at the lowest possible value by continuously adjusting the set point and gain during the imaging. Images were collected at a minimum of 256 × 256 pixels frames at different time intervals. The z-set point and differential gains were manually optimized during each scan. Images were analyzed and post-processed in the Gwyddion 2.31 software (http://gwyddion.net/).

2.5. Electrochemical Impedance Spectroscopy

Electrochemical impedance spectroscopy (EIS) was used to characterize the electrical properties in terms of resistance and capacitance as well as the stability of lipid bilayer membrane. In this work, the EIS measurements were recorded at frequency regime of 10−2 to 105 Hz with signal amplitude of 100 mV. As shown in Figure S2, the Si cavity chip with pre-coated lipid bilayer was sandwiched between the two teflon chambers. The top chamber was filled with an electrolyte. O-rings were placed on each side of the chip to provide low stress on the cavity walls and to prevent any electrolyte leakage. Electrolytic solution (10 mM NaCl) was filtered using 0.2 μm nylon filter before adding to the top chamber. A platinum wire immersed in the electrolyte was used as the working electrode. The counter electrode along with reference was connected to Si chip via conductive tape. Measurements were recorded at different time intervals.

3. Results and Discussion

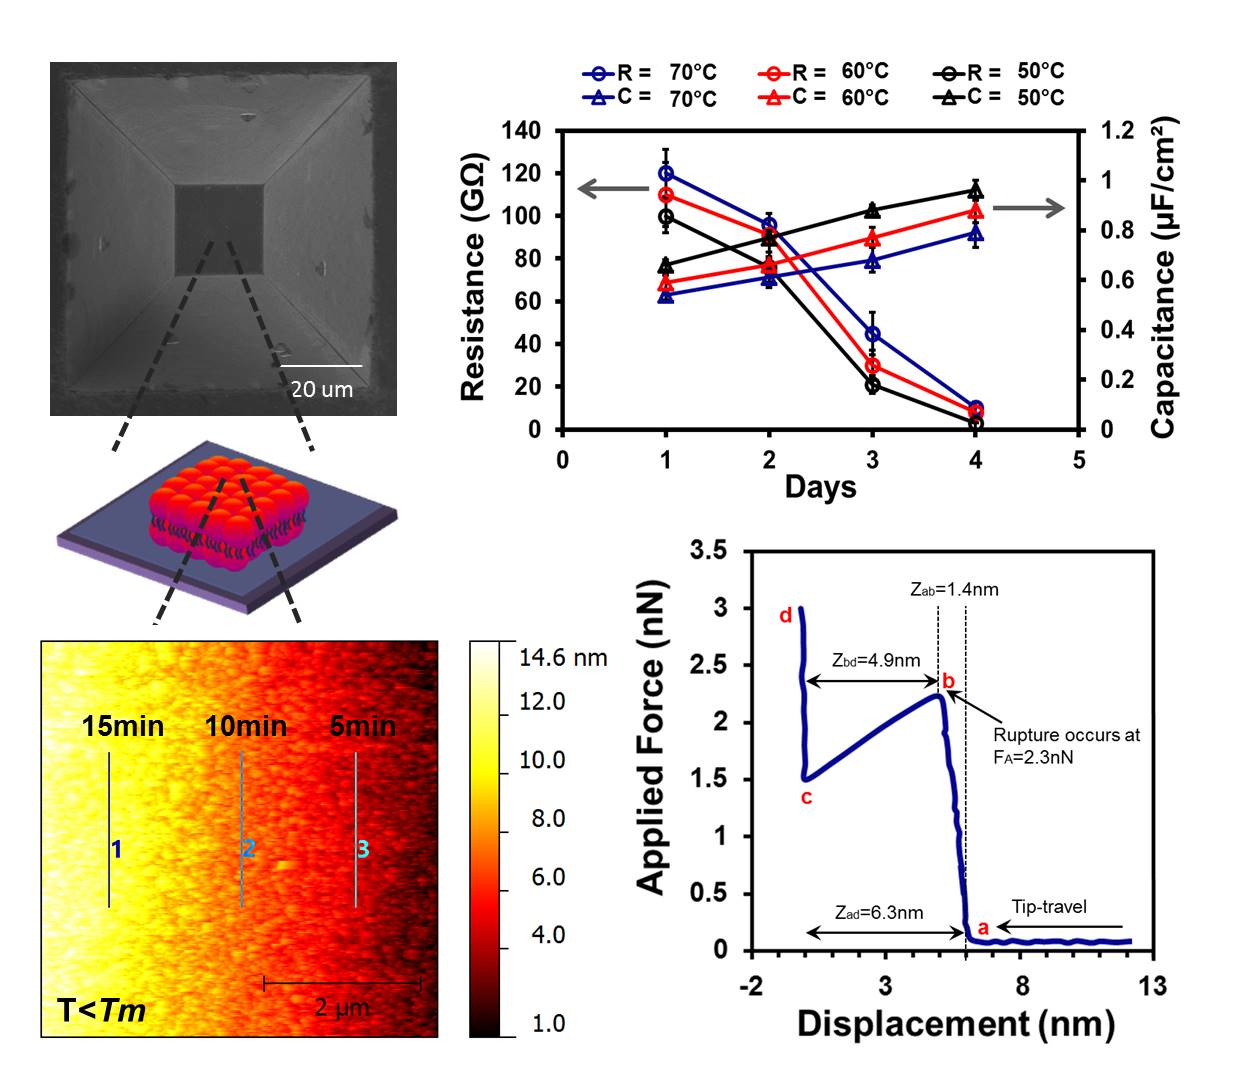
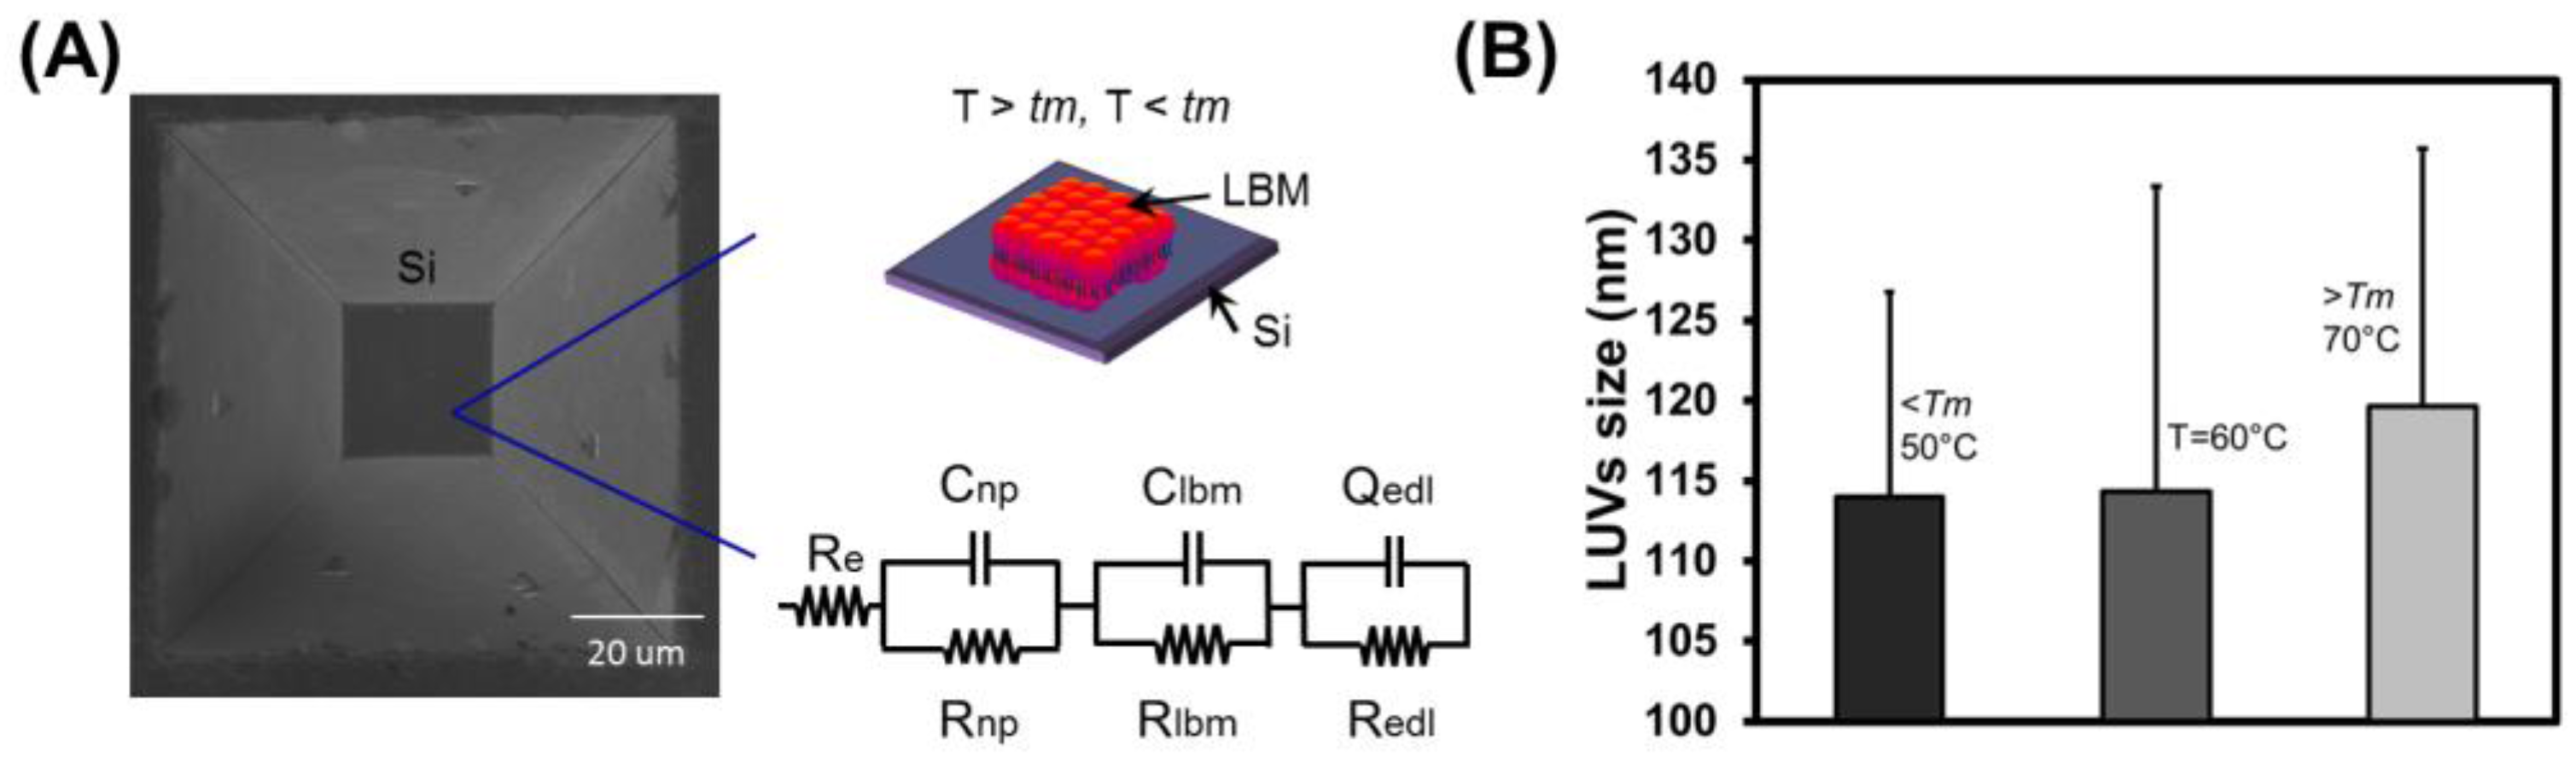
3.1. Fabrication of Micron-Sized Cavity in Si and Lipid Bilayers

The thin base layer structures fabricated inside a silicon microstructure had cavity depths of ~493 ± 6 μm was fabricated using 30% KOH at 55 °C for four days followed by room temperature treatment for 4 h. A detailed description for the production of this silicon-based micron cavity was previously discussed in [28]. Figure 1 shows an image on the left from scanning electron microscopy (SEM) of a typical Si cavity fabricated in this work. The surface roughness inside the Si based cavity using AFM in tapping mode was 0.95 ± 0.11 nm. Low surface roughness plays an imperative role in the production of SLBs at below the Tm of the lipids. The schematic on the right represents how a bilayer film is to be suspended in the cavity (top) and how it is to be modeled for impedance spectroscopy (bottom).
Depending on several factors such as sonication time, incubation time, and temperature and cooling rate (Table S1), the sequence of events during SLB formation (adsorption, fusion, and spreading) were interpreted at different stages using AFM. When vesicles come into contact with a suitable solid surface, they may adsorb, break up, or spread to form lipid bilayer membrane on a hydrophilic surface or a monolayer on a hydrophobic one. Protrusion usually occurs in lipid bilayers formation from vesicles [3,29,30]. Sometimes high thickness can be seen due to the presence of trapped, adsorbed, and partially fused vesicles. Using AFM, the effect of protrusion can be captured and helpful to visualize the formation of SL at below the Tm of the lipids. Therefore, AFM imaging was performed by scanning the AFM probe across the surface of the preformed SLB, which provides information on the topographical characteristics of the supported lipid bilayer, such as the lateral extent of domains and height of patches relative to the substrate. We found that the time-scale of the interaction by imaging the surface after incremental time steps was revealed interesting information as described below. Size of the LUVs produced at different temperature was estimated using dynamic light scattering (DLS) as shown in Figure 1B. Here the size refers as hydrodynamic diameter of the individual vesicle.

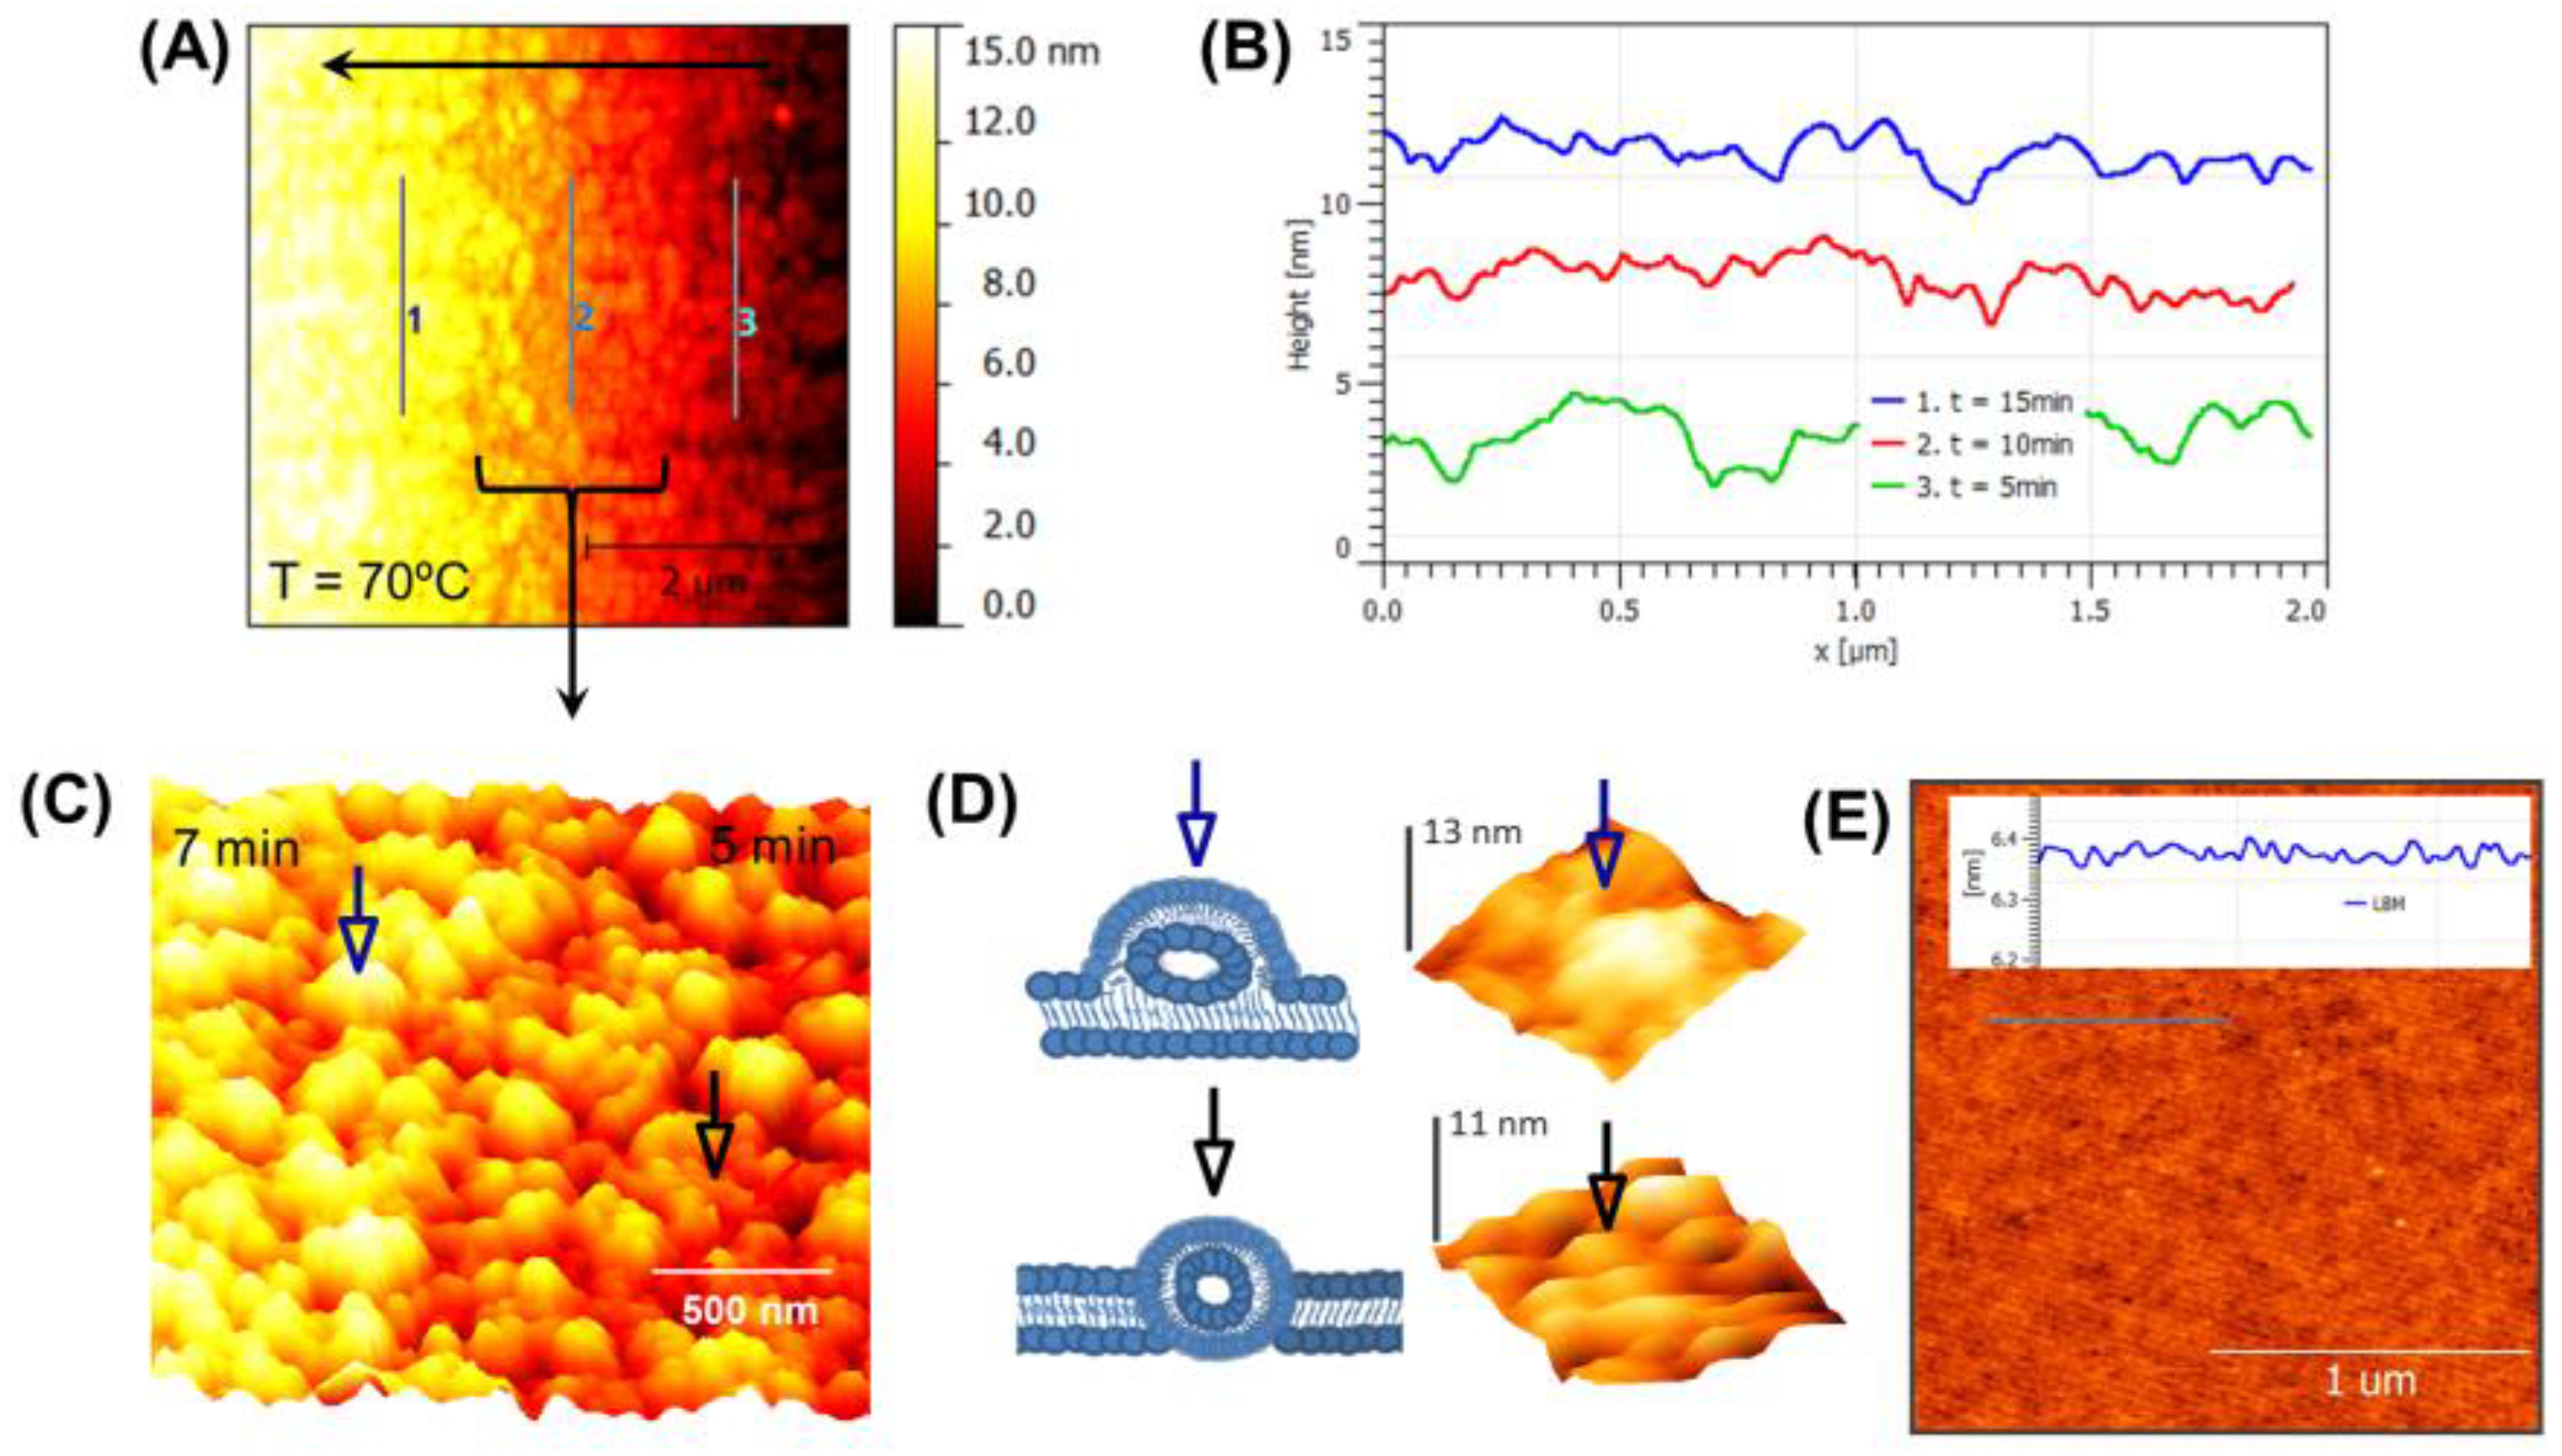
3.2. Real-Time Monitoring of SLB above Tm

Figure 2A shows in situ AFM images obtained in an aqueous solution for SLBs with coverage of 2 μm × 2 μm. In this case, LUVs were incubated at above (70 °C) the Tm of lipids (54 °C for DPPS and 65 °C for DPPE). Figure 2A reveals continuous flow at three stages for LUVs adsorption, fusion, and finally the production of lipid bilayer with partially fused and unfused flattened vesicles. Horizontal black arrow in Figure 2A indicates the scan direction of AFM tip from right to left and also represent the time information from 5 to 15 min with cooling rate (1 °C/min). Figure 2B illustrates the thickness profiles at different stages. At t = 5 min (line 3), the vesicles spontaneously fused to form irregular small patches of bilayer(s). At t = 10 min (line 2), lipid bilayer shows substantial unabsorbed and trapped vesicles with flattened shape. At t = 15 min (line 1), the membrane shows the complete coverage with presence of both partially fused and unfused flattened vesicles on top of the base membrane layer. Figure 2C (t = 5–7 min) illustrates the fusion procedure at high resolution with same height scale as in Figure 2A of lipid molecules. This image is an overview of the scan area showing three different stages, including attached liposomes, partly flattened vesicles, and membrane sheets. At t = 2 min, vesicles started accumulating and interacting with Si support to produce the base layer with some flattened trapped vesicles (Figure 2D bottom). At t = 7 min, both unfused and partially fused flattened vesicles were dominant over the original base layer of membrane. This represents that the partially fused vesicle was close to flattened shape (blue arrow) instead of spherical as illustrated in Figure 2D (bottom). This shows that a partly flattened liposome slowly collapses from the outer edges and forms a bilayer. The cross sections clearly show the decrease in height of the original vesicle from nearly 119 nm (Figure 1B) to the height of a double bilayer, 13 nm, as observed at the edges as shown in Figure 2D. The vesicles fused and spread immediately on contact with the silicon support followed by vesicle adsorption on top of the originally established SLBs. The unfused vesicles could be removed by rinsing with PBS (pH 7.4). Warm imaging PBS buffer was injected using syringe pump with flow rate of 50 μL/min. This successfully removed the remaining unbounded vesicles from the original intact membrane as shown in Figure 2E. Lipid bilayer thickness was estimated to be 4.9 ± 0.05 nm. An additional thickness revealed the surface roughness (0.94 ± 0.11 nm) of thin silicon membrane and the presence of thin hydrophilic layer (~1–2 nm) between the substrate and the membrane.

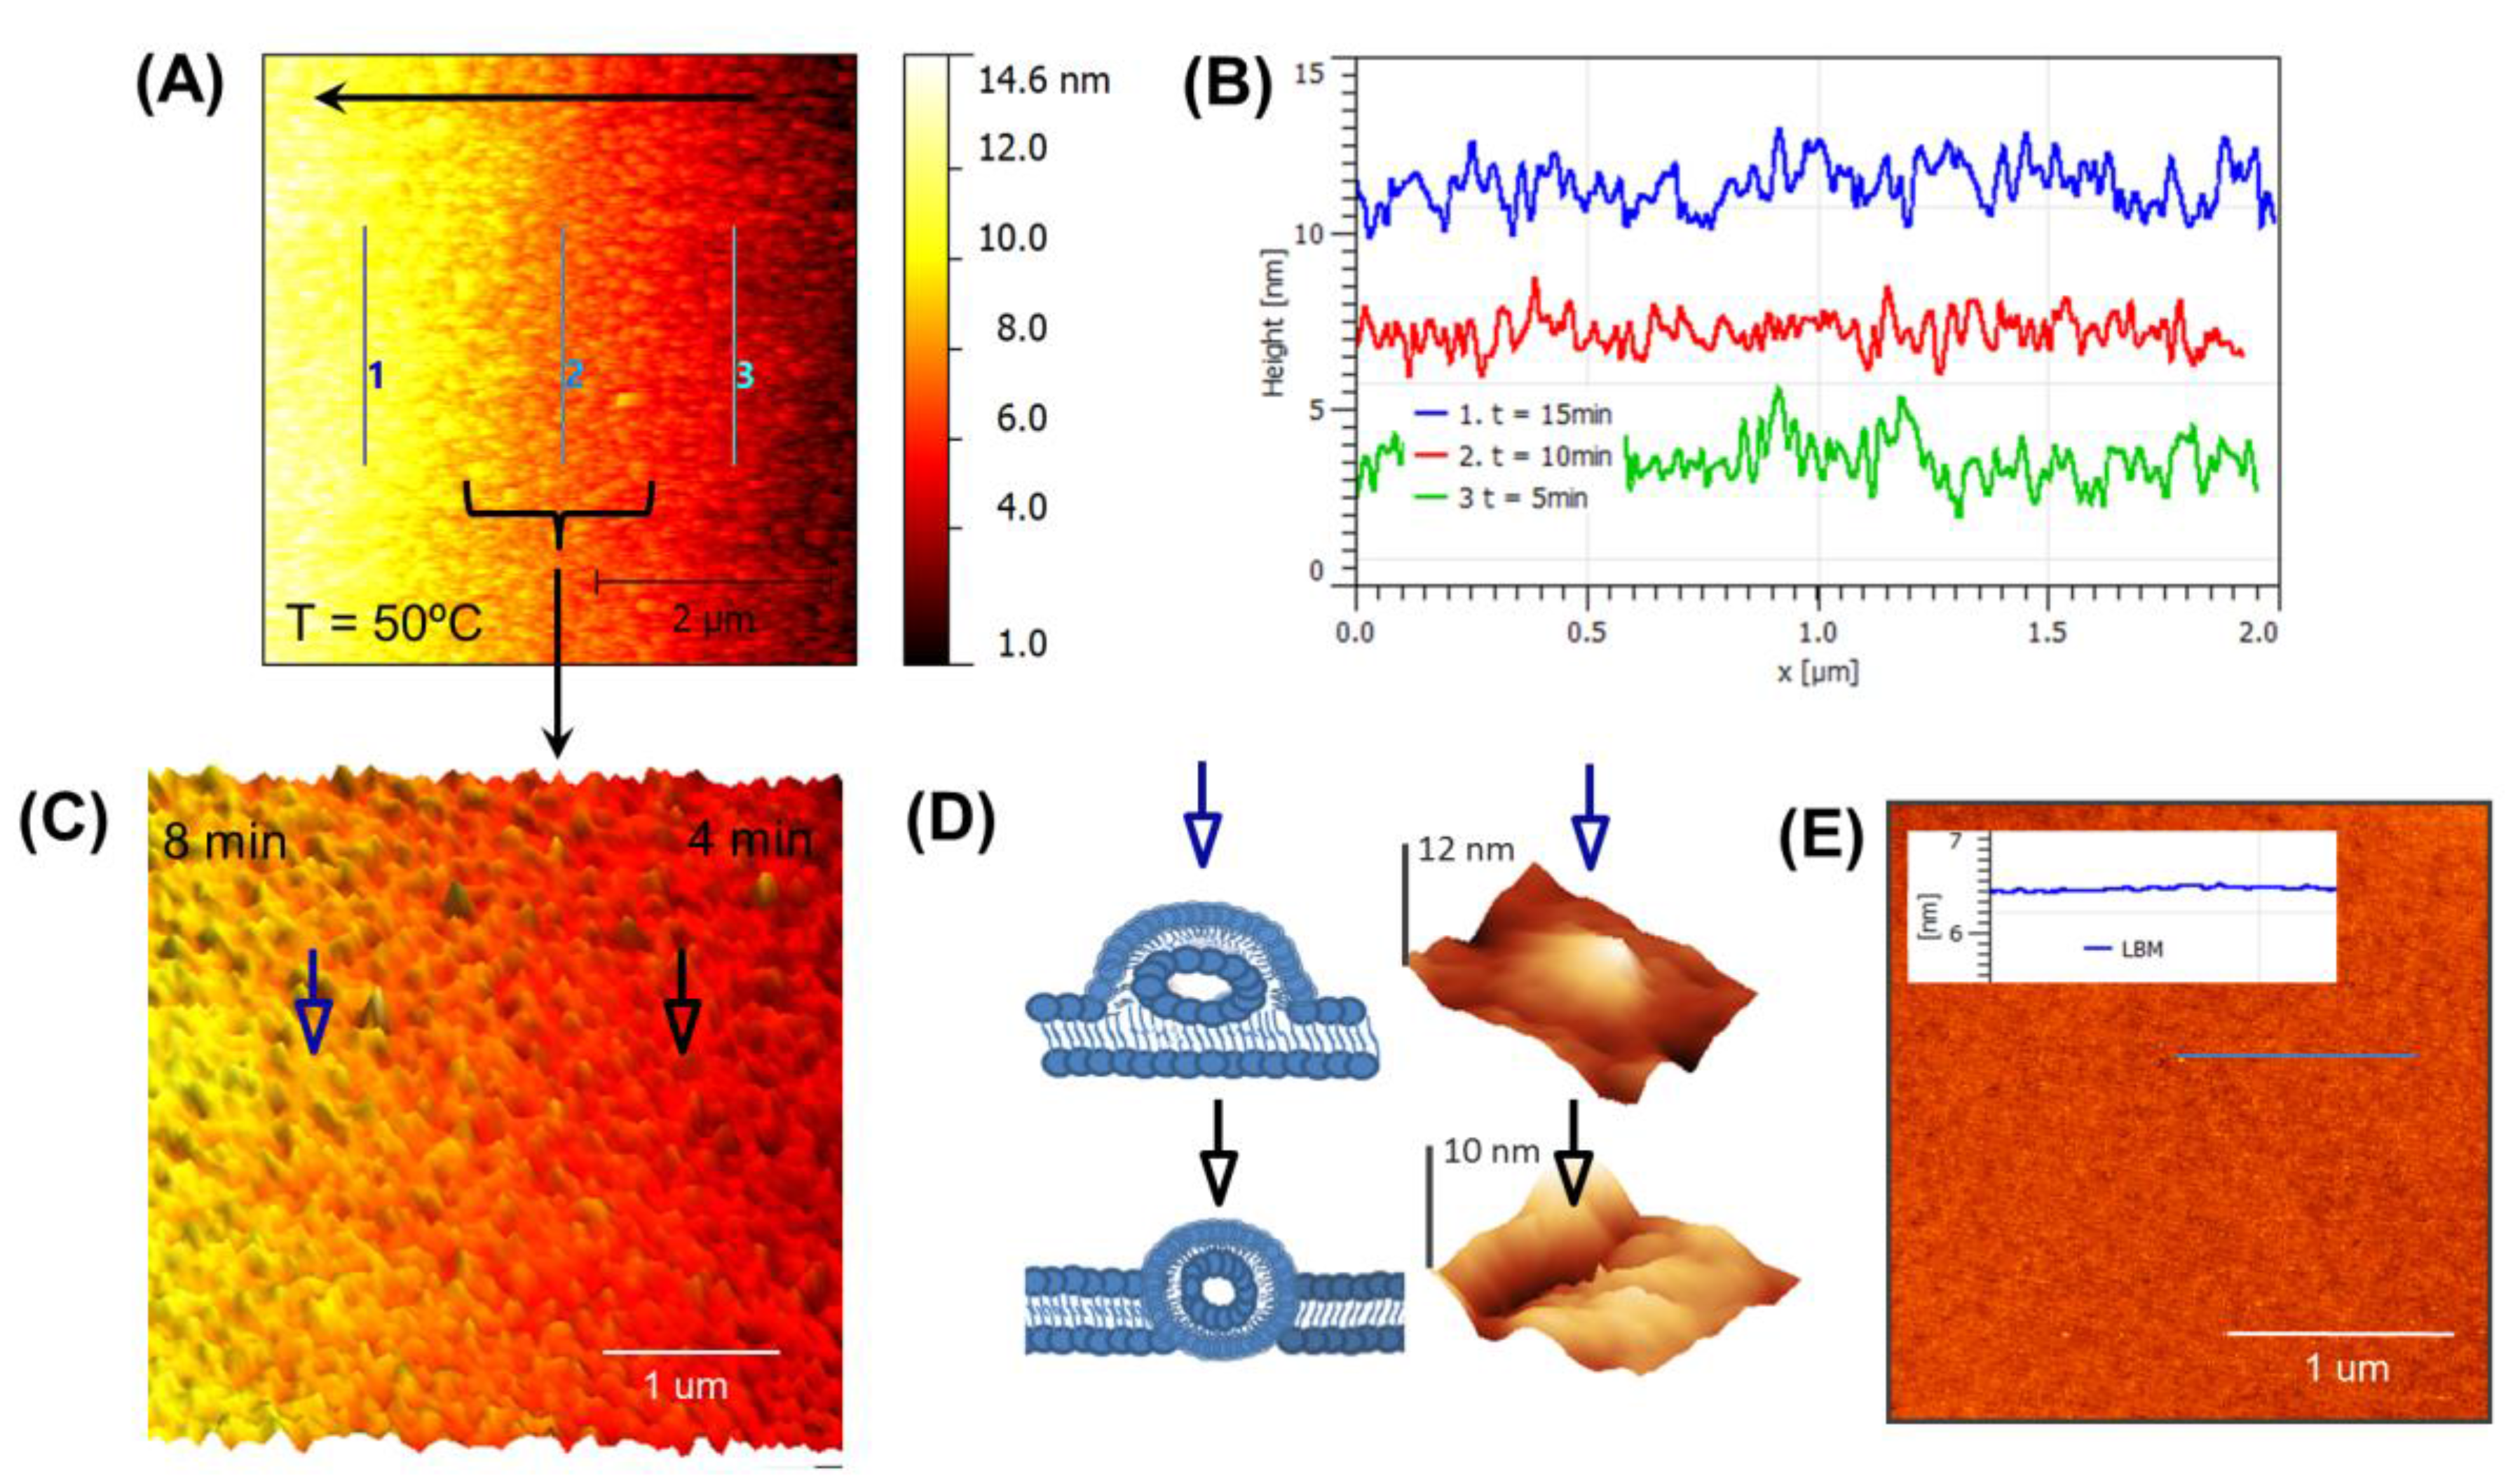
3.3. Real-Time Monitoring of SLB below Tm

Another experiment was conducted to monitor the fusion procedure of incubated vesicles inside the silicon-based micron-sized cavity. In this case, the incubated temperature was below (50 °C) the Tm of lipids. The results presented here fill a gap in understanding the events involved in formation of a planar, supported lipid bilayer from liposomes incubated at below the Tm. Figure 3A illustrates the formation of membrane with surface coverage of 2 μm × 2 μm. It reveals the stages for LUVs adsorption, fusion, and finally production of lipid bilayer with partially fused flattened and trapped flattened vesicles. Vesicles were instantly fused with substrate and formed random patches of bilayer as shown in line-profile of Figure 3B at different stages. The results suggest that once the process is initiated, it is a smooth and continuous chain of events. Some of the partially fused vesicles (blue arrow) and trapped vesicles (black arrow) were still intact within bilayer as shown in Figure 3c. This scan sequence (right to left) shown in Figure 3C illustrates the collapsing of a liposome onto itself and the intermediate stages in the formation of a bilayer membrane. As shown in Figure 3D, the partially fused (top) and trapped (bottom) vesicles were flattened from the outside toward the center until it completely collapsed onto itself. Also, some spreading takes place during this flattening process. The right represents the schematic of perturbation during the membrane formation and the left shows the individual image of the flattened fused and trapped vesicles with height of 12 nm and 10 nm, respectively. The dimensions of various structures present in the images were measured by cross section analysis performed in the fast scan direction of the height images. Estimations of the liposome sizes were made from attached liposomes under the imaging conditions outlined in the methods section. The height measurements may also be influenced by the tip forces, although they were minimized by using tapping mode. Unattached flattened vesicles were removed using imaging warm buffer with slow rinsing and the base lipid membrane showed complete coverage, even the vesicles were incubated successfully below their Tm as shown in Figure 3E. We have also studied the formation of SLB at 60 °C inside the silicon cavity and the results are presented in Figure S1.

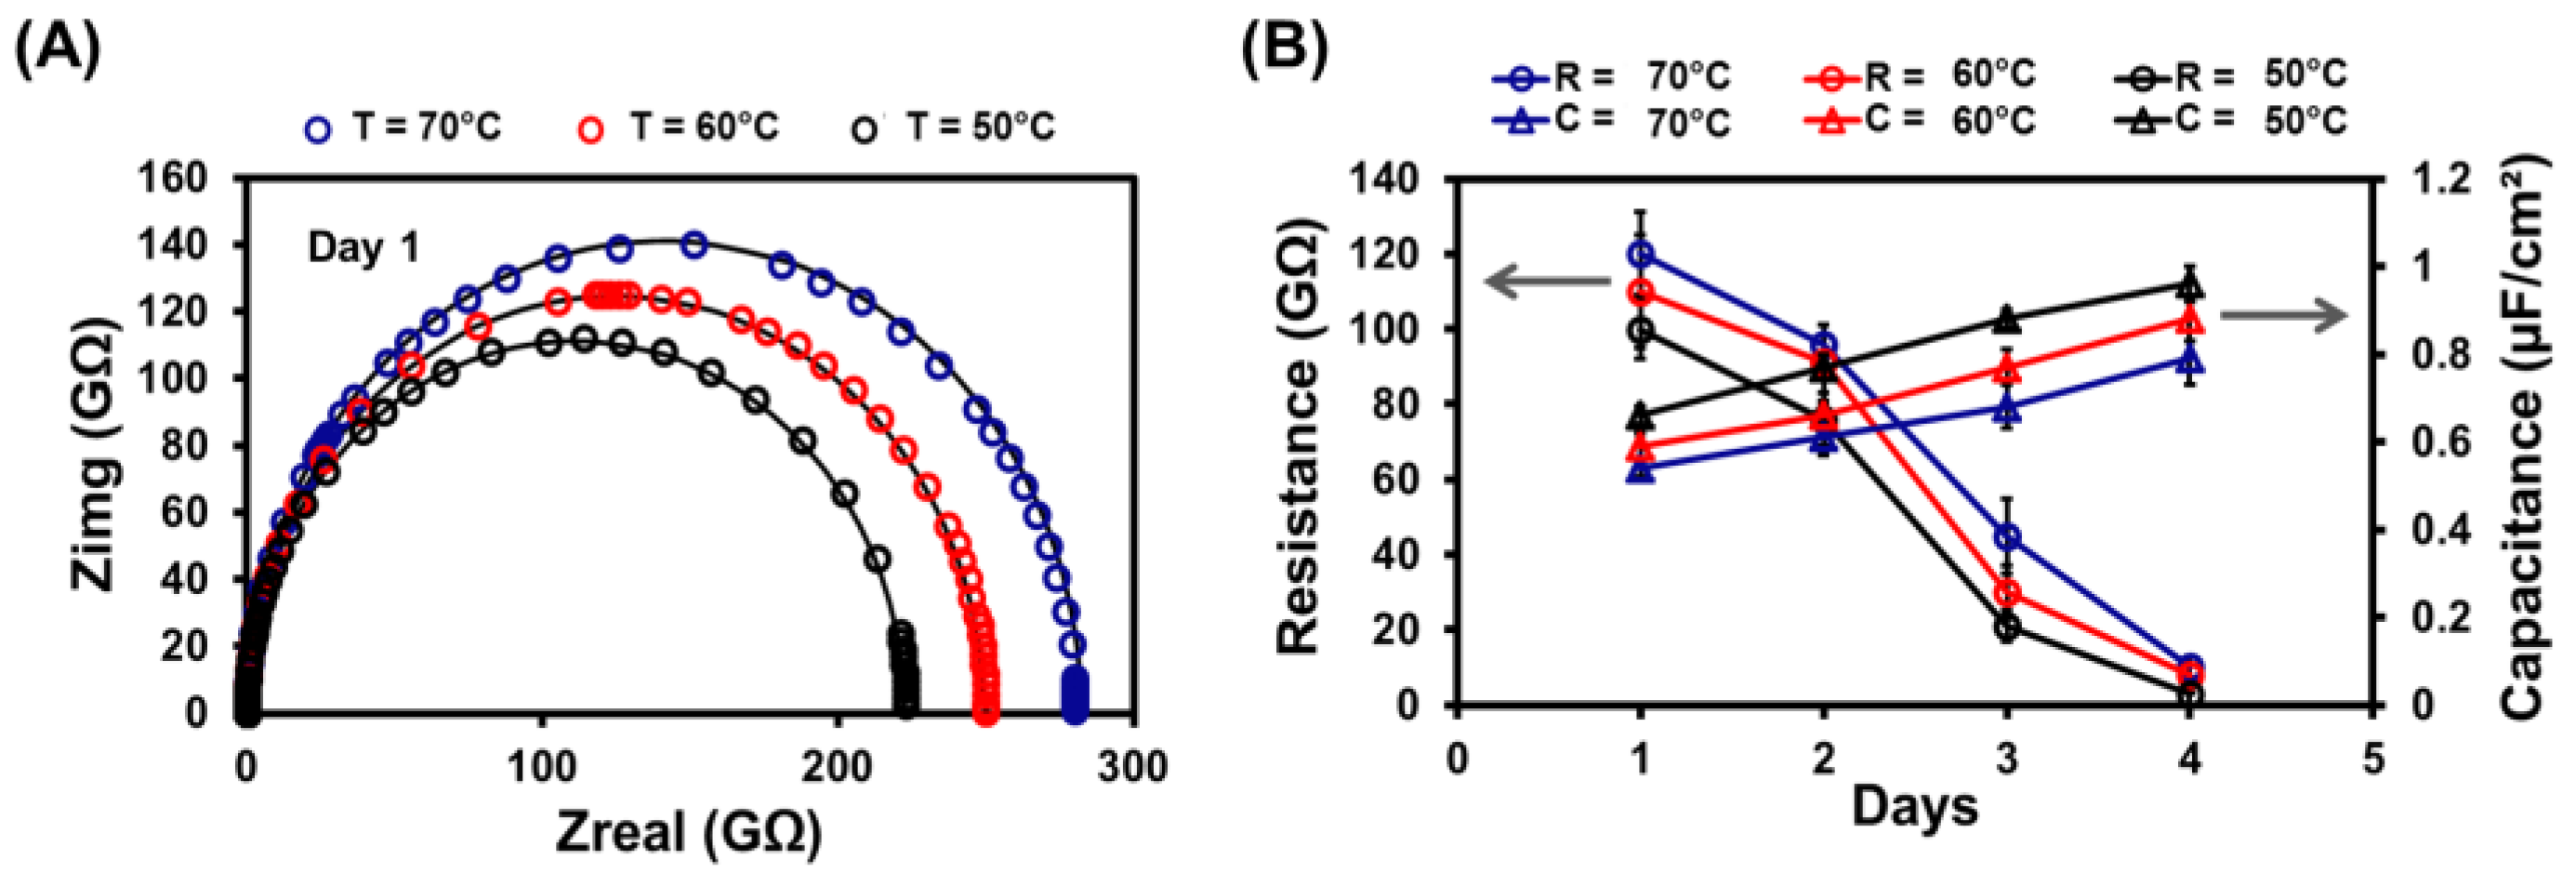
3.4. Electrochemical Impedance Spectroscopy

The electrochemical method is a well-known technique to characterize the lipid bilayer supported on a substrate. The impedance response for electrochemical systems reflects the electrical characterization of a system under study and is commonly represented as electrical equivalent circuit. As shown in Figure 1A, the circuit is comprised of a simple electrolyte resistance (Re) in series with the parallel RC elements (RSi and CSi). RSi and CSi are the resistance and capacitance of the silicon cavity support, respectively. Additional parallel RC elements (Rlbm and Clbm) are introduced in series with parallel RC elements of Si cavity (RSi and CSi). Rlbm and Clbm are the resistance and capacitance of the supported lipid bilayer produced at below the Tm of the lipids. There is an additional distribution of ions which reflects the non-ideal behavior of a system and is commonly expressed as constant phase element (CPE) [31,32]. Therefore, in the same equivalent circuit, additional parallel RC elements (Redl and Qedl) are introduced in series with parallel RC elements of membrane (Rlbm and Clbm). Here, Redl and Qedl are the charge transfer resistance and capacitance of electric double layer (EDL) formed at the interface between the membrane and the electrolyte. Here, Qedl is treated as YCPE(ω) = Y0(iω)α [31,32], where Y0 and n (0 < α < 1) are the CPE coefficient and exponent, respectively. Qedl is estimated as a pure capacitance when is α close to 1 and a pure resistance when α is close to 0.
Electrochemical characterization was done by assembling the Si cavity coated with lipid bilayer membrane in between two teflon chambers at the frequency regime of 10−2–105 Hz with signal amplitude of 100 mV. Figure 4A shows the Nyquist plot of coated SLB inside Si cavity formed at different incubation temperatures (70, 60, and 50 °C). To extract the information for membrane impedance and capacitance, experimental data were characterized using equivalent circuit as shown in Figure 1A. The membrane capacitance of 0.71 ± 0.053, 0.65 ± 0.034, and 0.61 ± 0.011 μF/cm2 was obtained after fitting data for 50, 60, and 70 °C respectively, as shown in Figure 4B. This data is consistent with lipid membranes produced on ordered porous silicon membrane (0.7 ± 0.3 μF/cm2) [33], nonordered porous silicon membrane (0.63 μF/cm2) [34,35], ordered porous alumina (0.65 ± 0.2 μF/cm2) [36], and porous silicon nitride (0.40 μF/cm2) [37]. The capacitance obtained in this work is in agreement with those obtained for the closely related phospholipid phosphatidylcholine membrane in a 1 mM NaCl electrolyte and was reported to be ~0.62 μF/cm2 [38,39].
In this study, the membranes exhibited >1 GΩ sealed resistance with at least a four-day-long life time (n = 11, n represents number of trials). After performing the data fitting, the impedance of the SLB was estimated to be 121.11 ± 10.26, 108.22 ± 10.33, and 101.68 ± 9.18 GΩ for 70, 60, and 50 °C respectively as shown in Figure 4B. Previously, high impedance (26.3 GΩ) of SLB was reported by controlling the contact area between the aqueous droplet and the conductive solid surface in an oil solution containing phospholipids [40]. In this work, we present SLB produced inside Si cavity at below Tm exhibited almost four times more GΩ sealed impedance. We also estimated the resistance (Redl) and capacitance (Qedl) occurred due to the presence of electric double layer (EDL) formed at the interface of the membrane and the electrolyte. This results in Redl of 1.6 KΩ and Qedl of 0.796 nF-sα−1 (α = 0.781). Figure S3 represents the magnitude plot using EIS results for the SLB produce at 50 °C (below Tm) over period of time.

3.5. Stability of Lipid Bilayer Membrane

Long-term stability of SLB is one of the prerequisites for a robust biosensor and high throughput drug screening [40,41,42]. The initial impedance for SLB produced at below Tm was recorded to be 101.68 ± 9.18 GΩ. The membrane resistance was gradually dropped to 78.24 ± 9.06 and 22.38 ± 4.25 GΩ during intervals of 48 h and 72 h, respectively. After four days, membrane exhibited the reasonable resistance of ~1.25 GΩ (n = 21) as shown in Figure 4B. Comparably, the most successful research article for SLB produced using small unilamellar vesicles (SUVs) exhibited a life of membrane for about 50 h [41]. They utilized the expensive high energy electron beam tool to fabricate the pore in Al2O3 support and then produce SLB. Later, to reduce the cost of a substrate material and a fabrication method, the set of tapered apertures with different shapes (beak, triangle, and cylindrical) were fabricated [42]. They developed apertures in SU8 photoresist with the diameter ranging from 60 to 80 μm. Instead of creating supported lipid bilayer, they produced black lipid membranes (BLMs) by employing painting and folding techniques with the life of 36 h (triangle shaped aperture) and 21 h (beak-shaped aperture), respectively. Results obtained in this work utilized Si micron-sized cavity as a support to produce SLB with the stability of about 96 h as shown in Figure 4B.

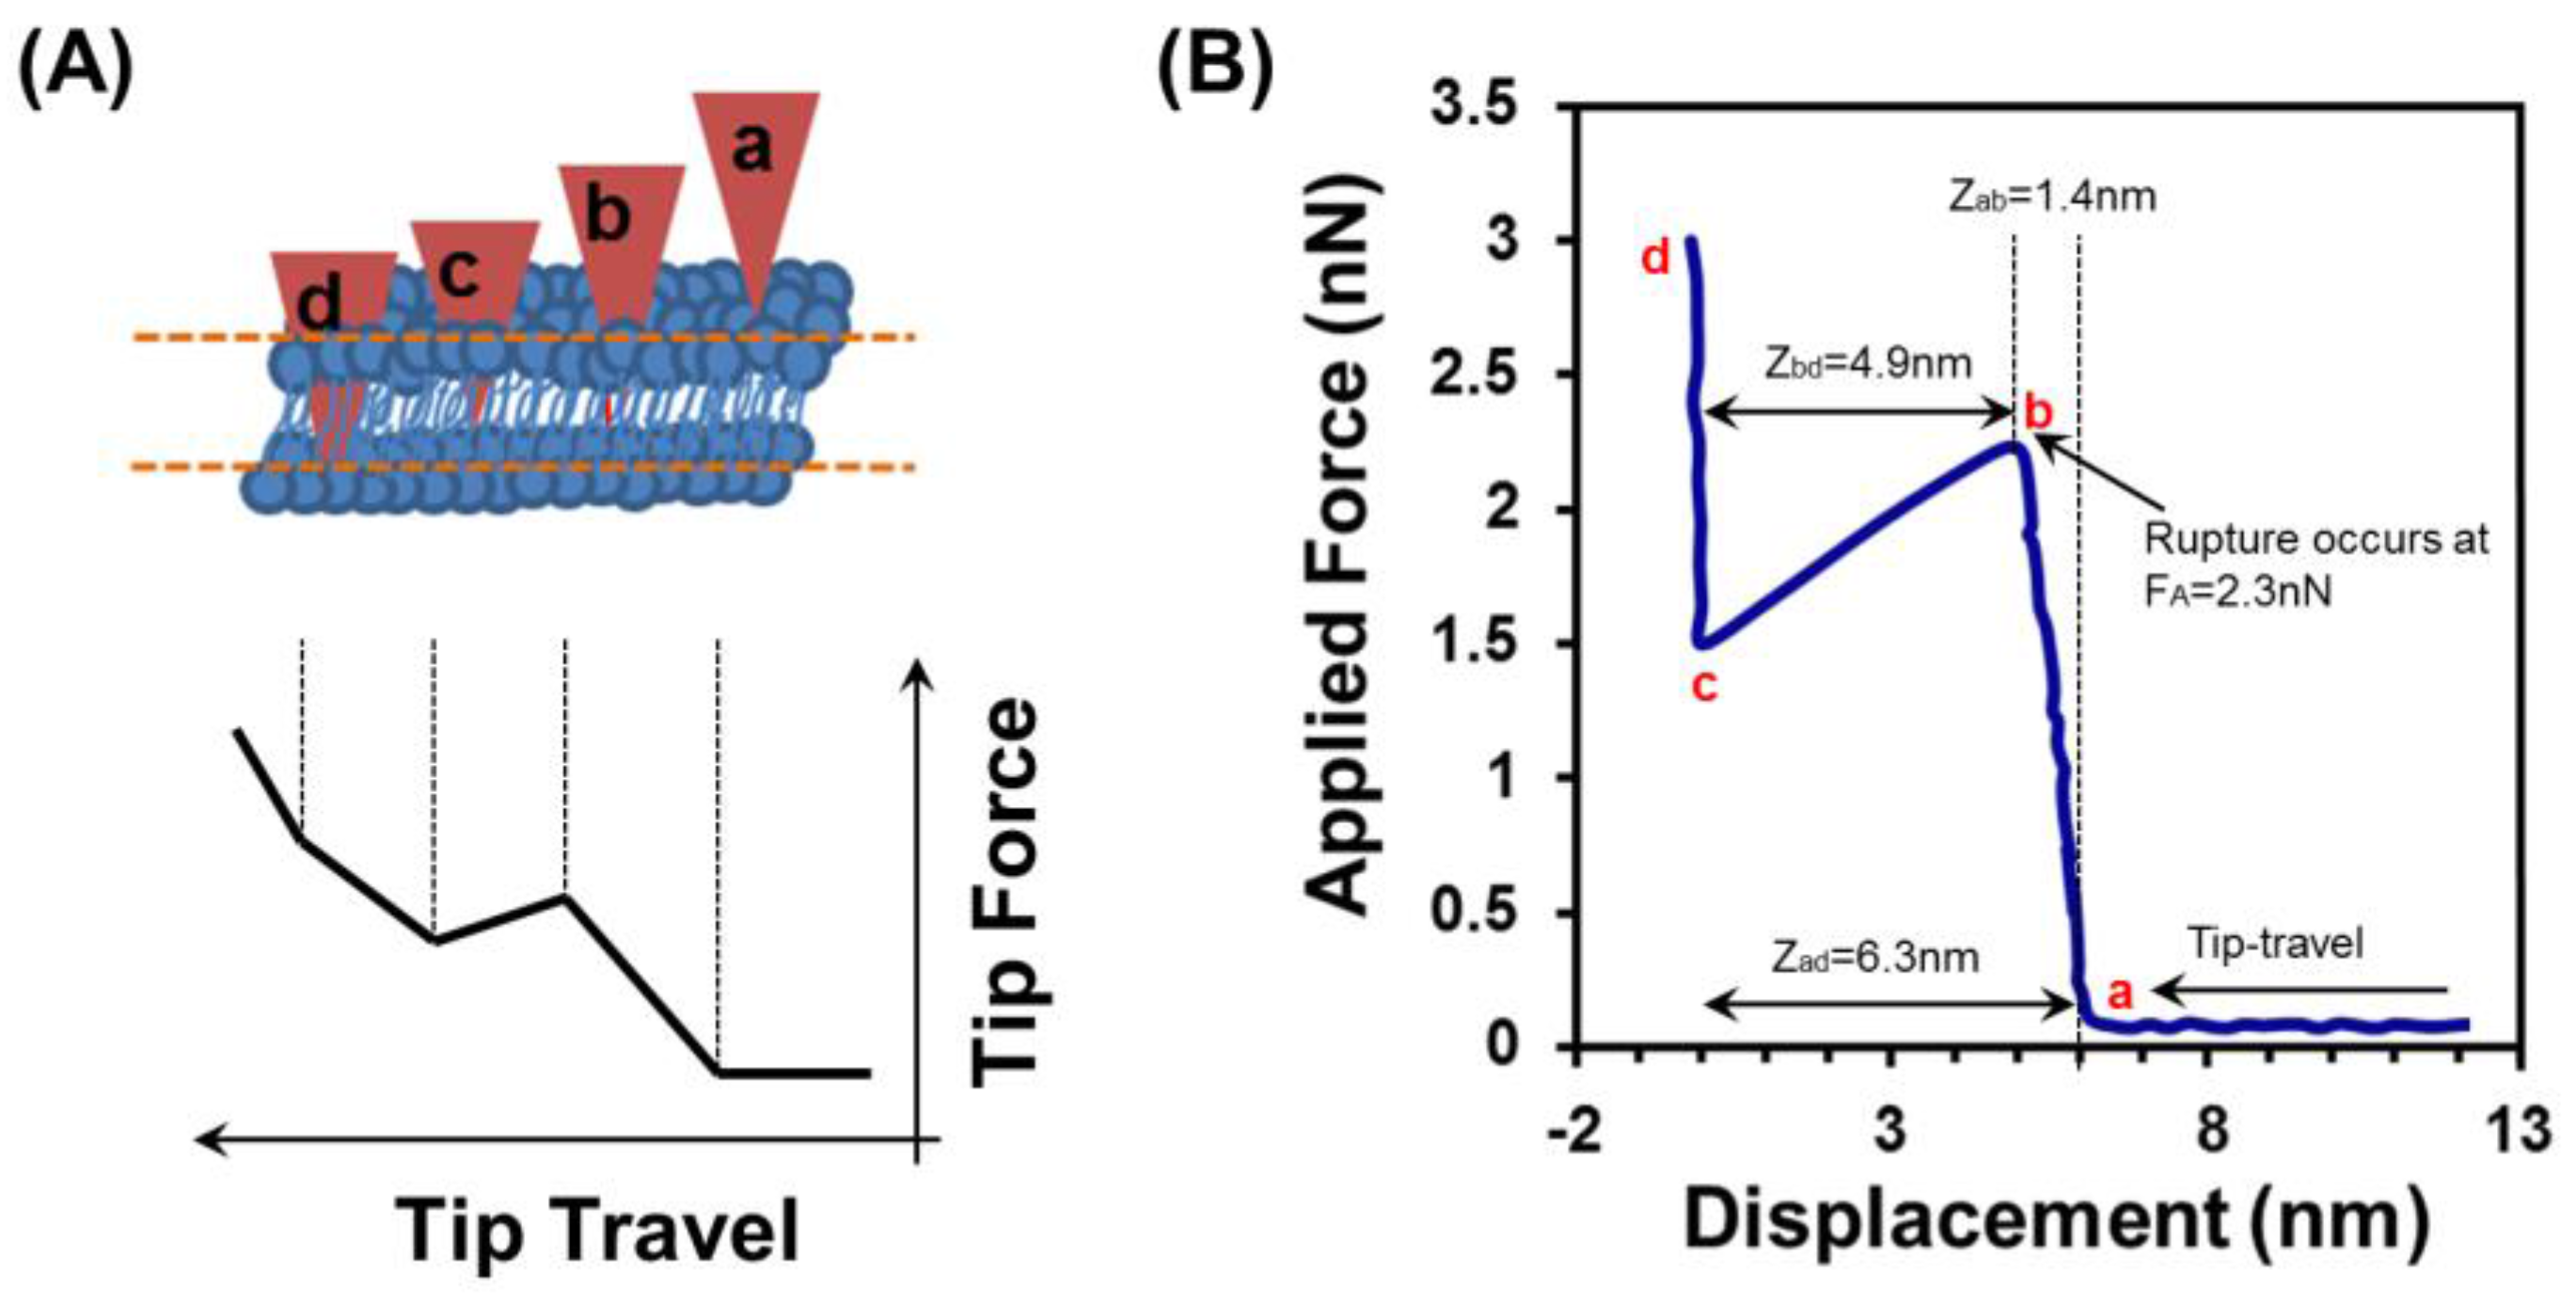
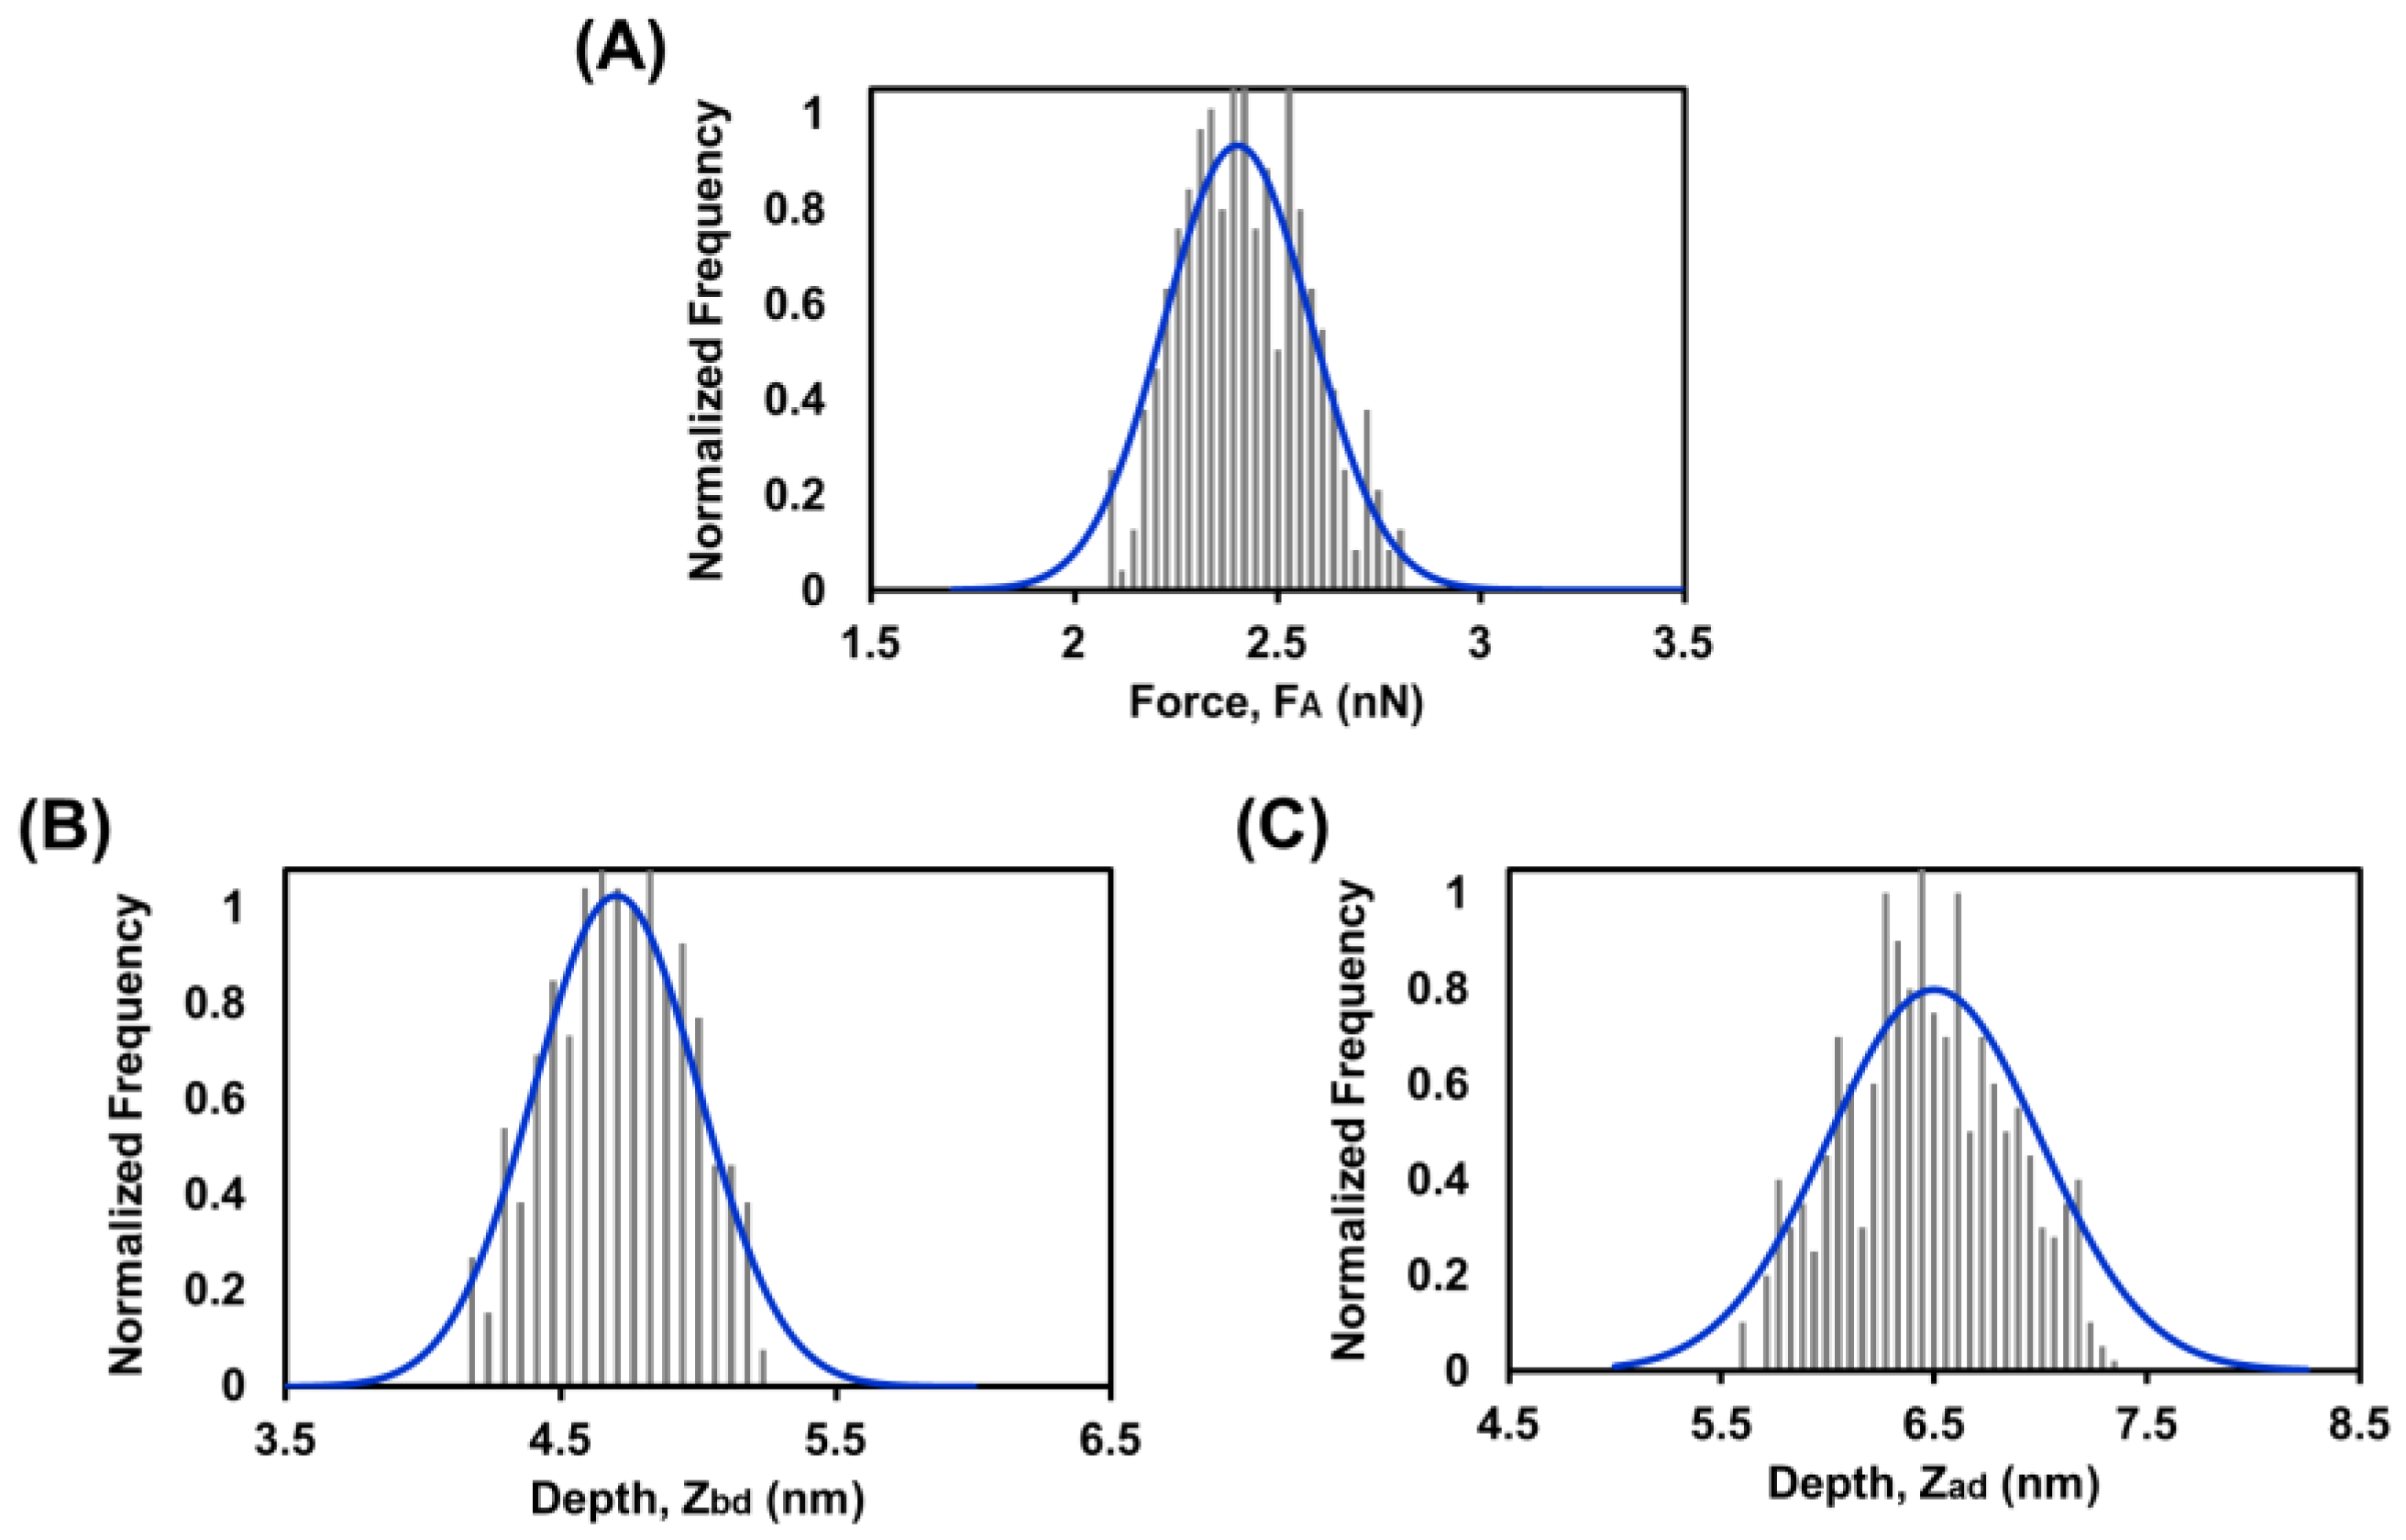
3.6. Force Spectroscopy Study of SLB below Tm

To demonstrate force spectroscopy study for the SLB produced below the Tm inside the micron-sized Si cavity, the cantilevers’ tip approaches and leaves the surface in a repetitive manner. The force experienced by the cantilever can be detected and then plotted against the z-piezo displacement. During measurement, AFM probe was brought towards the SLB and a load increasingly applied until the bilayer ruptures. Afterwards, the probe was withdrawn; the cycle was repeated many times. In our work, the force experienced by the cantilever was detected and then plotted against the tip-sample separation (displacement). Figure 5 describes the effect of tip cantilever on the surface of the SLB produced at below Tm inside the silicon cavity.
Figure 5A depicts the scheme of a cantilever deflection with respect to depth of the lipid bilayer membrane. Initially, there is no cantilever deflection until reaching point ‘a’ and then a sudden jump-to-contact occurs at just beyond point ‘a’, resulting in a tip position at point ‘b’. Increasing the pressure force to the membrane, AFM cantilever deflection reveals the linear response to piezo displacement. This provides a linear relationship between the applied force and the piezo, as shown in line ‘a–b’ of Figure 5A. Upon reaching point ‘b’, a sudden jump to point ‘c’ occurs, which represents the actual breakthrough of the lipid bilayer membrane. Further increasing the force leads to an apparent linear relationship (c–d), which contains valuable information since the tip pyramid has been in contact with the substrate. Here Point ‘a’ is not always well-defined, for example, due to long range electrostatic repulsion leading to a curved region around ‘a’, and a similar problem may be observed around ‘d’.
In the real-time force spectroscopy experiment, a single representative force–distance curve for the rupture of SLB was derived as shown in Figure 5B The z-piezo displacement was converted to tip-sample separation so as to more accurately reflect the tip dynamics. The first cantilever deflection occurred at ‘a’ and with an immediate jump, the tip moved to ‘b’. This most likely happens due to electrostatic attraction between the tip and the lipid bilayer membrane. As displayed in Figure 5B, the tip was first interacted with the upper surface of the bilayer at a distance Zad = 6.3 nm from the silicon surface and then rupture was occurred at FA = 2.3 nN with depth Zbd = 4.9 nm. In order to gain a more accurate reflection of the bilayer properties, the force–distance measurements were repeated several times. As shown in Figure 6, the data represents the approach–retract cycles for a single tip. The mean values are FA = 2.4 ± 0.18 nN, Zad = 6.5 ± 0.4 nm, and Zbd = 4.7 ± 0.3 nm. This Zbd depth is in good agreement with the other reports in the literature [1,43,44].

4. Conclusions

The work presented in this paper reveals new study for the production of a supported lipid bilayers, SLBs on an anistropically etched micron-sized cavity in silicon at above and below the phase transition temperature, Tm of the lipids (DPPE and DPPS). Initially, a micron-sized cavity was fabricated using standard microfabrication procedure. Large unilamellar vesicles were prepared and incubated at above and below the Tm of lipids. By using continuous flow mode of atomic force microscopy in natural fluidic environment, all major steps (adsorption, fusion, and formation) for the formation of lipid bilayer including vesicles attachment were monitored in real-time environment, captured, and discussed. We demonstrated that SLBs can also be formed without attaining the deposition temperature above Tm of the lipids, but subsequent cooling effects on the final membranes’ structure need to be taken into account. Stability and electrical properties of the SLBs produced at different temperatures were characterized and recorded continuously over four days using electrochemical impedance spectroscopy with a three electrode system. Impedance and capacitance of the SLBs were compared with previously reported data and the results are in good agreement. Finally, the rupture force and the bilayer depth were estimated using force spectroscopy measurements. We anticipate that a silicon based micron-sized cavity could be helpful in preparing lipid bilayer membranes at below Tm for nano-medicine applications.

Supplementary Materials

The following are available online at www.mdpi.com/2079-6374/7/3/26/s1, Figure S1: An illustration of real-time monitoring of a lipid bilayer membrane inside a Si-based cavity at 60 °C using AFM, Figure S2: Schematic assembly of silicon-based micron-sized cavity with teflon chamber for EIS studies, Figure S3: The magnitude plots for supported lipid bilayers produced at 50 °C (below Tm) over period of time, Table S1: Summarized results for successful preparation of lipid bilayer membranes inside silicon-based micron-sized cavity at different incubation temperatures.

Acknowledgments

This work was supported by the Office of the Vice President for Research and Economic Development, University of Alabama in Huntsville. Patel and Weimer provided open access to and training on atomic force microscopes at Oakwood University and the University of Alabama in Huntsville. The principal author is currently with the Department of Bioengineering at University of Illinois at Urbana-Champaign and acknowledges the Laboratory for Materials in Medicine, Biomedical Research Center, and Carle Foundation Hospital, Urbana IL.

Author Contributions

M.S.K. conceived the idea, designed the study, and conducted experiments (microfabrication, AFM and EIS). N.S.D. designed protocols for preparation of large unilamellar vesicles and supported lipid bilayers and contributed in experimental study in part. D.P. and J.W. trained M.S.K. to conduct AFM measurements. J.W. and J.D.W. supervised the study and manuscript. M.S.K. wrote the manuscript.

Conflicts of Interest

The authors declare no conflict of interest.

References

  1. Khan, M.S.; Dosoky, N.S.; Williams, J.D. Engineering lipid bilayer membranes for protein studies. Int. J. Mol. Sci. 2013, 14, 21561–21597. [Google Scholar] [CrossRef] [PubMed]
  2. Mingeot-Leclercq, M.P.; Deleu, M.; Brasseur, R.; Dufrene, Y.F. Atomic force microscopy of supported lipid bilayers. Nat. Protoc. 2008, 3, 1654–1659. [Google Scholar] [CrossRef] [PubMed]
  3. Reviakine, I.; Brisson, A. Formation of supported phospholipid bilayers from unilamellar vesicles investigated by atomic force microscopy. Langmuir 2000, 16, 1806–1815. [Google Scholar] [CrossRef]
  4. Hane, F.; Drolle, E.; Gaikwad, R.; Faught, E.; Leonenko, Z. Amyloid-β aggregation on model lipid membranes: An atomic force microscopy study. J. Alzheimers Dis. 2011, 26, 485–494. [Google Scholar] [PubMed]
  5. Lin, W.C.; Blanchette, C.D.; Ratto, T.V.; Longo, M.L. Lipid domains in supported lipid bilayer for atomic force microscopy. Methods Mol. Biol. 2007, 400, 503–513. [Google Scholar] [PubMed]
  6. Wacklin, H.P.; Thomas, R.K. Spontaneous formation of asymmetric lipid bilayers by adsorption of vesicles. Langmuir 2007, 23, 7644–7651. [Google Scholar] [CrossRef] [PubMed]
  7. Ma, Z.; Janmey, P.A.; Sharp, K.A.; Finkel, T.H. Improved method of preparation of supported planar lipid bilayers as artificial membranes for antigen presentation. Microsc. Res. Tech. 2011, 74, 1174–1185. [Google Scholar] [CrossRef] [PubMed]
  8. Picas, L.; Suarez-Germa, C.; Teresa Montero, M.; Hernandez-Borrell, J. Force spectroscopy study of langmuir-blodgett asymmetric bilayers of phosphatidylethanolamine and phosphatidylglycerol. J. Phys. Chem. B 2010, 114, 3543–3549. [Google Scholar] [CrossRef] [PubMed]
  9. Torrent-Burgues, J.; Oncins, G.; Sanz, F. Study of mixed Langmuir and Langmuir-Blodgett films of dissimilar components by AFM and force spectroscopy. Colloids Surf. A Physicochem. Eng. Asp. 2008, 321, 70–75. [Google Scholar] [CrossRef]
  10. Lenhert, S.; Sun, P.; Wang, Y.; Fuchs, H.; Mirkin, C.A. Massively Parallel Dip-Pen Nanolithography of Heterogeneous Supported Phospholipid Multilayer Patterns. Small 2007, 3, 71–75. [Google Scholar] [CrossRef] [PubMed]
  11. Hirtz, M.; Corso, R.; Sekula-Neuner, S.; Fuchs, H. Comparative Height Measurements of Dip-Pen Nanolithography-Produced Lipid Membrane Stacks with Atomic Force, Fluorescence, and Surface-Enhanced Ellipsometric Contrast Microscopy. Langmuir 2011, 27, 11605–11608. [Google Scholar] [CrossRef] [PubMed]
  12. Hirtz, M.; Oikonomou, A.; Georgiou, T.; Fuchs, H.; Vijayaraghavan, A. Multiplexed biomimetic lipid membranes on graphene by dip-pen nanolithography. Nat. Commun. 2013, 4, 2591. [Google Scholar] [CrossRef] [PubMed]
  13. Hirtz, M.; Brglez, J.; Fuchs, H.; Niemeyer, C.M. Selective Binding of DNA Origami on Biomimetic Lipid Patches. Small 2015, 11, 5752–5758. [Google Scholar] [CrossRef] [PubMed]
  14. Brinkmann, F.; Hirtz, M.; Greiner, A.M.; Weschenfelder, M.; Waterkotte, B.; Bastmeyer, M.; Fuchs, H. Interdigitated Multicolored Bioink Micropatterns by Multiplexed Polymer Pen Lithography. Small 2013, 9, 3266–3275. [Google Scholar] [CrossRef] [PubMed]
  15. Jass, J.; Tjarnhage, T.; Puu, G. From liposomes to supported, planar bilayer structures on hydrophilic and hydrophobic surfaces: An atomic force microscopy study. Biophys. J. 2000, 79, 3153–3163. [Google Scholar] [CrossRef]
  16. Castellana, E.T.; Cremer, P.S. Solid supported lipid bilayers: From biophysical studies to sensor design. Surf. Sci. Rep. 2006, 61, 429–444. [Google Scholar] [CrossRef]
  17. Sailor, M.J.; Park, J.H. Hybrid nanoparticles for detection and treatment of cancer. Adv. Mater. 2012, 24, 3779–3802. [Google Scholar] [CrossRef] [PubMed]
  18. Hou, H.; Nieto, A.; Ma, F.; Freeman, W.R.; Sailor, M.J.; Cheng, L. Tunable sustained intravitreal drug delivery system for daunorubicin using oxidized porous silicon. J. Control Release 2014, 178, 46–54. [Google Scholar] [CrossRef] [PubMed]
  19. Seantier, B.; Breffa, C.; Felix, O.; Decher, G. In Situ Investigations of the Formation of Mixed Supported Lipid Bilayers Close to the Phase Transition Temperature. Nano Lett. 2004, 4, 5–10. [Google Scholar] [CrossRef]
  20. Jing, Y.; Trefna, H.; Persson, M.; Kasemo, B.; Svedhem, S. Formation of supported lipid bilayers on silica: Relation to lipid phase transition temperature and liposome size. Soft Matt. 2014, 10, 187–195. [Google Scholar] [CrossRef] [PubMed]
  21. El Kirat, K.; Morandat, S.; Dufrene, Y.F. Nanoscale analysis of supported lipid bilayers using atomic force microscopy. Biochim. Biophys. Acta 2010, 1798, 750–765. [Google Scholar] [CrossRef] [PubMed]
  22. Morandat, S.; Azouzi, S.; Beauvais, E.; Mastouri, A.; El Kirat, K. Atomic force microscopy of model lipid membranes. Anal. Bioanal. Chem. 2013, 405, 1445–1461. [Google Scholar] [CrossRef] [PubMed]
  23. Giocondi, M.C.; Yamamoto, D.; Lesniewska, E.; Milhiet, P.E.; Ando, T.; Le Grimellec, C. Surface topography of membrane domains. Biochim. Biophys. Acta 2010, 1798, 703–718. [Google Scholar] [CrossRef] [PubMed]
  24. Goksu, E.I.; Vanegas, J.M.; Blanchette, C.D.; Lin, W.C.; Longo, M.L. AFM for structure and dynamics of biomembranes. Biochim. Biophys. Acta Biomembr. 2009, 1788, 254–266. [Google Scholar] [CrossRef] [PubMed]
  25. Binnig, G.; Quate, C.F. Atomic Force Microscope. Phys. Rev. Lett. 1986, 56, 930–933. [Google Scholar] [CrossRef] [PubMed]
  26. Khan, M.S.; Williams, J.D. Fabrication of solid state nanopore in thin silicon membrane using low cost multistep chemical etching. Materials 2015, 8, 7389–7400. [Google Scholar] [CrossRef]
  27. Rauscher, M.; Dietrich, S. Wetting Phenomena in Nanofluidics. Annu. Rev. Mater. Res. 2008, 38, 143–172. [Google Scholar] [CrossRef]
  28. Khan, M.S.; Dosoky, N.S.; Berdiev, B.K.; Williams, J.D. Electrochemical impedance spectroscopy for black lipid membranes fused with channel protein supported on solid-state nanopore. Eur. Biophys. J. 2016, 45, 843–852. [Google Scholar] [CrossRef] [PubMed]
  29. Richter, R.P.; Berat, R.; Brisson, A.R. Formation of solid-supported lipid bilayers: An integrated view. Langmuir 2006, 22, 3497–3505. [Google Scholar] [CrossRef] [PubMed]
  30. Reimhult, E.; Hook, F.; Kasemo, B. Temperature dependence of formation of a supported phospholipid bilayer from vesicles on SiO2. Phys. Rev. E 2002, 66, 051905. [Google Scholar] [CrossRef] [PubMed]
  31. Kerner, Z.; Pajkossy, T. Impedance of rough capacitive electrodes: The role of surface disorder. J. Electroanal. Chem. 1998, 448, 139–142. [Google Scholar] [CrossRef]
  32. Kim, C.H.; Kisiel, K.; Jung, J.; Ulanski, J.; Tondelier, D.; Geffroy, B.; Bonnassieux, Y.; Horowitz, G. Persistent photoexcitation effect on the poly(3-hexylthiophene) film: Impedance measurement and modeling. Synth. Met. 2012, 162, 460–465. [Google Scholar] [CrossRef]
  33. Weiskopf, D.; Schmitt, E.K.; Kluhr, M.H.; Dertinger, S.K.; Steinem, C. Micro-BLMs on highly ordered porous silicon substrates: Rupture process and lateral mobility. Langmuir 2007, 23, 9134–9139. [Google Scholar] [CrossRef] [PubMed]
  34. Tantawi, K.H.; Berdiev, K.B.; Cerro, R.; Williams, J.D. Porous silicon membrane for investigation of transmembrane proteins. Superlattices Microstruct. 2013, 58, 72–80. [Google Scholar] [CrossRef]
  35. Tantawi, K.H.; Cerro, R.; Berdiev, K.B.; Matrin, M.E.; Patel, D.; Williams, J.D. Investigation of transmembrane protein fused in lipid bilayer membranes supported on porous silicon. J. Med. Eng. Technol. 2013, 37, 28–34. [Google Scholar] [CrossRef] [PubMed]
  36. Romer, W.; Steinem, C. Impedance analysis and single-channel recordings on nano-black lipid membranes based on porous alumina. Biophys. J. 2004, 86, 955–965. [Google Scholar] [CrossRef]
  37. Zhu, Z.W.; Wang, Y.; Zhang, X.; Sun, C.F.; Li, M.G.; Yan, J.W.; Mao, B.W. Electrochemical impedance spectroscopy and atomic force microscopic studies of electrical and mechanical properties of nano-black lipid membranes and size dependence. Langmuir 2012, 28, 14739–14746. [Google Scholar] [CrossRef] [PubMed]
  38. Naumowicz, M.; Petelska, A.D.; Figaszewski, Z.A. Impedance analysis of a phosphatidylcholine-phosphatidylethanolamine system in bilayer lipid membranes. Electrochim. Acta 2006, 51, 5024–5028. [Google Scholar] [CrossRef]
  39. Naumowicz, M.; Kotynska, J.; Petelska, A.; Figaszewski, Z. Impedance analysis of phosphatidylcholine membranes modified with valinomycin. Eur. Biophys. J. 2006, 35, 239–246. [Google Scholar] [CrossRef] [PubMed]
  40. Wang, X.; Ma, S.; Su, Y.; Zhang, Y.; Bi, H.; Zhang, L.; Han, X. High Impedance Droplet-Solid Interface Lipid Bilayer Membranes. Anal. Chem. 2015, 87, 2094–2099. [Google Scholar] [CrossRef] [PubMed]
  41. Venkatesan, B.M.; Polans, J.; Comer, J.; Sridhar, S.; Wendel, D.; Aksimentiev, A.; Bashir, R. Lipid bilayer coated Al2O3 nanopore sensors: Towards a hybrid biological solid-state nanopore. Biomed. Microdevices 2011, 13, 671–682. [Google Scholar] [CrossRef] [PubMed]
  42. Kalsi, S.; Powl, A.M.; Wallace, B.A.; Morgan, H.; De Planque, M.R.R. Shaped apertures in photoresist films enhance the lifetime and mechanical stability of suspended lipid bilayers. Biophys. J. 2014, 106, 1650–1659. [Google Scholar] [CrossRef] [PubMed]
  43. Seeger, H.M.; Di Cerbo, A.; Alessandrini, A.; Facci, P. Supported lipid bilayers on mica and silicon oxide: Comparison of the main phase transition behavior. J. Phys. Chem. B 2010, 114, 8926–8933. [Google Scholar] [CrossRef] [PubMed]
  44. Picas, L.; Rico, F.; Scheuring, S. Direct measurement of the mechanical properties of lipid phases in supported bilayers. Biophys. J. 2012, 102, L01–L03. [Google Scholar] [CrossRef] [PubMed]
Figure 1. Anisotropically etched silicon with lipid bilayer membrane (LBM) produced using LUVs incubated at different temperatures. (A) The left shows a characteristic SEM image of a fabricated micron-cavity in Si. The right shows schematics of how the LBM is to be suspended in the cavity (top) and its equivalent electrical model (bottom); (B) Dynamic light scattering (DLS) measurements of LUVs incubated at different temperatures (50, 60, and 70 °C). Polydispersity index values obtained are below 0.3. Readings were obtained in triplicate and the error bars represent the standard error of the mean.
Biosensors 07 00026 g001
Figure 2. An illustration of real-time monitoring of a lipid bilayer membrane inside a Si-based cavity at 70 °C (above Tm) using AFM. (A) A single line profile at a fixed position across the membrane captured as a function of increasing time from right to left; (B) Individual line profiles extracted from the image on the left at the positions 3–1 corresponding to 5, 10, and 15 min; (C) High resolution shows that small patches formed instantaneously and fused to create the membrane. Blue arrow (partially fused flattened vesicle) and black arrow (trapped flattened vesicle) indicate distinguish characterization of vesicles at different states; (D) The left shows the schematic of perturbation due to partially fused flattened (top) and trapped (bottom) vesicles occurred during the formation of LBM. The right represents the 3D topography images of individual partially fused flattened and trapped vesicles with heights of 13 nm and 11 nm respectively; (E) An image of the LBM after it has been rinsed with warm buffer. A representative line profile across part of the image shows that characteristic hills or valleys (as observed in C) absent in the final SLB produced at above Tm.
Biosensors 07 00026 g002
Figure 3. An illustration of real-time monitoring of a lipid bilayer membrane inside a Si-based cavity at 50 °C (below Tm) using AFM. (A) AFM imaging reveals the fusion of vesicles procedure from left to right across the formation of lipid bilayer; (B) The time accumulation of profile scans with AFM at the positions 3–1 corresponding to 5, 10, and 15 min; (C) High resolution shows that small patches formed instantaneously and fused to create the membrane. Blue arrow (partially fused flattened vesicle) and black arrow (trapped flattened vesicle) show distinguish characterization of vesicles at different stages; (D) Illustration of perturbation due to partially fused flattened (top) and trapped (bottom) vesicles occurred during the formation of LBM and the 3D topography images (right) represent heights of 12 nm and 10 nm, respectively; (E) An image and extracted line profile of the membrane after it has been rinsed with warm buffer. A representative line profile across part of the image shows that characteristic hills or valleys (as observed in C) are absent in the final SLB produced at below Tm.
Biosensors 07 00026 g003
Figure 4. Measurements using EIS on an SLB in the micro-cavity at different temperatures (50, 60, and 70 °C). The Nyquist plot on the left reveals the impedance details of the pre-formed lipid bilayer. The solid black lines are the results of fitting the data (circles) using the electrical model presented in Figure 1A. The resistance (circles) and capacitance (triangles) values extracted from SLBs over different days for different temperatures.
Biosensors 07 00026 g004
Figure 5. Force spectroscopy study of SLB produced at below Tm. (A) An illustration of the steps taken to measure the mechanical properties of a bilayer. The tip travels through the bilayer (top schematic) as an increasing force is applied to it. The force is measured as a function of travel through the layer (bottom schematic). The physical significance is interpreted as follows: (a) First contact of the tip with the top surface of the bilayer; (b) Rupture of the upper surface of the bilayer, (b–c) Rapid tip transition through the central portion of the bilayer; (c) On-set of increased repulsion associated with compression of proximal head groups, water layer and other trapped material; (c–d) Compression of trapped material; (d) Tip in direct contact with silicon surface inside the cavity; (B) A representative measurement of force–distance from a preformed SLB inside the Si cavity at below Tm. Rupture of the top layer occurs at a force of 2.3 nN after a tip displacement of 1.4 nm from first contact. The tip reaches the Si surface at 6.3 nm displacement.
Biosensors 07 00026 g005
Figure 6. Supported lipid membrane rupture force and depth distributions. (A) Rupture force, FA; (B) Zbd; (C) Zad. Mean values are FA = 2.4 ± 0.18 nN, Zad = 6.5 ± 0.4 nm, and Zbd = 4.7 ± 0.3 nm (errors are standard deviations). Blue lines are Gaussian fits to the distributions.
Biosensors 07 00026 g006

