Article

Experimental Validation of the Sensitivity of Waveguide Grating Based Refractometric (Bio)sensors

by
Thomas E. Gartmann
1,† and
Florian Kehl
1,2,3,*,†
1
CSEM Centre Suisse d'Electronique et de Microtechnique SA, Bahnhofstrasse 1, Landquart CH-7302, Switzerland
2
Laboratory of Biosensors and Bioelectronics (LBB), Swiss Federal Institute of Technology ETH, Gloriastrasse 35, Zürich CH-8092, Switzerland
3
Optics Balzers AG, Neugrüt 35, Balzers FL-9496, Liechtenstein
*
Author to whom correspondence should be addressed.
These authors contributed equally to this work.
Biosensors 2015, 5(2), 187-198; https://doi.org/10.3390/bios5020187
Submission received: 17 February 2015 / Revised: 30 March 2015 / Accepted: 3 April 2015 / Published: 13 April 2015
(This article belongs to the Special Issue Label-Free Biosensors: Exploring the Field)

Abstract

:
Despite the fact that the theoretical foundations of the sensitivity of waveguide grating based (bio)sensors are well-known, understood and their implications anticipated by the scientific community since several decades, to our knowledge, no prior publication has experimentally confirmed waveguide sensitivity for multiple film thicknesses, wavelengths and polarization of the propagating light. In this paper, the bulk refractive index sensitivity versus waveguide thickness of said refractometric sensors is experimentally determined and compared with predictions based on established theory. The effective refractive indices and the corresponding sensitivity were determined via the sensors’ coupling angles at different cover refractive indices for transverse electric as well as transverse magnetic polarized illumination at various wavelengths in the visible and near-infrared. The theoretical sensitivity was calculated by solving the mode equation for a three layer waveguide.

Graphical Abstract

1. Introduction

Waveguide grating based sensors are highly sensitive optical transducers, mainly applied for bulk refractometric or label-free (bio)sensing, to accurately determine the refractive index of a fluid or to detect the interaction, presence and concentration of (bio)molecules [1]. The application areas range from medicine, biotechnology and pharmaceutical industry to food, feed and environmental monitoring [2,3,4,5,6,7].
Evidently, a key parameter of such a sensor is its sensitivity. It is therefore important for the development of a new sensor to choose its overall design and the individual design parameters for a maximized sensitivity. Numerous different, highly sensitive planar waveguide sensor designs have been demonstrated (an overview can be found in [8,9,10]) and other publications focused on maximizing sensitivity and developing design rules for optimal sensors [1,10,11,12,13,14]. The aim of this publication is therefore neither to theoretically assess the sensitivity of said sensors nor to maximize it, but to provide experimentally measured data to verify well-established theory regarding the sensitivity of dielectric waveguide grating based (bio)chemical and refractometric sensors. These results have been anticipated for several decades but lack of a systematic experimental verification.
In its simplest configuration, a planar, step-index waveguide grating coupler exhibits a 3-layer structure consisting of the supporting substrate S, a high refractive index waveguide layer F and the investigated cover layer C (Figure 1) [2,15,16]. A corrugated grating region in the waveguide acts both as a light coupling element into the waveguide by means of diffraction as well as the sensitive element of the sensor. The sensing principle of a grating coupler can be illustrated by the resonance condition for light coupling into or out of the waveguide via the grating [1,17]:
n c / s *   s i n ( θ c ) = n e f f m g λ Λ
where nc/s denotes the refractive index of the cover or the substrate, depending from which side the sample is illuminated, θc the coupling angle, mg the grating diffraction order, λ the vacuum wavelength of the incident light, Λ the grating period and
n e f f = f ( n c ,   n f ,   n s , h f ,   h g ,   D ,   λ , ρ ,   m )
the effective refractive index of the waveguide, which itself depends on the cover-, waveguide- and substrate refractive indices, the waveguide thickness hf, the depth hg and duty-cycle D of the corrugated grating, the wavelength λ and polarization ρ of the incident light, which can either be transverse electric (TE) or transverse magnetic (TM), as well as the mode number m of the propagating wave. Hereinafter, the influence of hg and D on neff are neglected as only shallow and therefore weak gratings with hg << λ and two conformally corrugated waveguide sides with D ≈ 0.5 are considered [13].
As the coupling angle θc depends on neff (Equation (1)), which itself depends on the cover refractive index nc (Equation (2)), changes of the cover refractive index nc can be monitored by observing the in- or out-coupling angle [1]. As the sensing is accomplished by the evanescent tail of the propagating waveguide mode, the adsorption of molecules can be measured as the cover refractive index is altered in close proximity to the sensor surface, since in general, the adsorbed molecules exhibit a different refractive index than the displaced surrounding cover medium. Thus, a grating coupler can be employed as a (bio)chemical sensor [2]. To enhance the coupling capacity of chemical species to the sensor surface, hydrophilic and open hydrogel matrices with adlayer thicknesses ha of a few hundreds of nanometers are commonly anchored to the latter [18], hereby covering the entire extent of the evanescent field. In this common case, the sensitivity for surface sensing can be approximated by the sensitivity for homogeneous sensing, where the entire bulk refractive index of the cover changes.
Figure 1. Schematic representation of a waveguide grating coupler, consisting of a substrate S, waveguide film F with a layer thickness of hf and cover layer C with refractive indices ns, nf and nc, respectively. A corrugated grating with a depth of hg, period Λ and duty-cycle D acts as a coupling element for coherent light with wavelength λ, polarization ρ incident at an angle θc, thereby creating a guided mode with evanescent tails with penetration depths Δzc and Δzs.
Biosensors 05 00187 g001
As a consequence of the above, the sensitivity s towards changes in the cover refractive index of said sensor can be expressed as the change of the effective refractive index with respect to the change of the bulk refractive index of the cover medium as defined in Equation (3).
s =   n e f f n c Δ n e f f Δ n c
where Δnc denotes the difference in the refractive index of the cover material and Δneff the resulting difference in the effective refractive index, which can be calculated with Equation (1) from experimentally determined coupling angles.
The sensitivity of a slab waveguide towards cover refractive index changes depends on the fraction of the total power P of the guided mode with respect to the power fraction in the cover Pc [1]:
P c / s P = n f 2 n e f f 2 n f 2 n c 2 Δ z c / s h e f f
where Δzc/s are the penetration depths of the evanescent field into the cover and substrate layer, respectively, and heff the effective waveguide thickness:
h e f f = h f + Δ z c + Δ z s
whereas the penetration depths depend on the polarization ρ of the propagating mode (ρ = 0 for TE and ρ = 1 for TM modes):
Δ z c / s = λ 2 π ( n e f f 2 n c / s 2 ) 1 2 [ ( n e f f n f ) 2 + ( n e f f n c / s ) 2 1 ] ρ
After some calculations (as further described in [1]) we can express the sensitivity toward cover refractive index changes as:
s = n e f f n c = ( n c n e f f ) ( P c P ) [ 2 ( n e f f n c ) 2 1 ] ρ
As aforementioned, the goal of this study is to experimentally validate and reconstruct the well-known, theoretical sensitivity plots s(hf) of waveguide grating couplers for various waveguide thicknesses hf, wavelengths λ and polarization ρ of the incident light. These can be obtained by numerically solving the transcendental three layer mode equation for neff and inserting the obtained values in Equation (7), as explained in more detail in subchapter 2.2.

2. Material and Methods

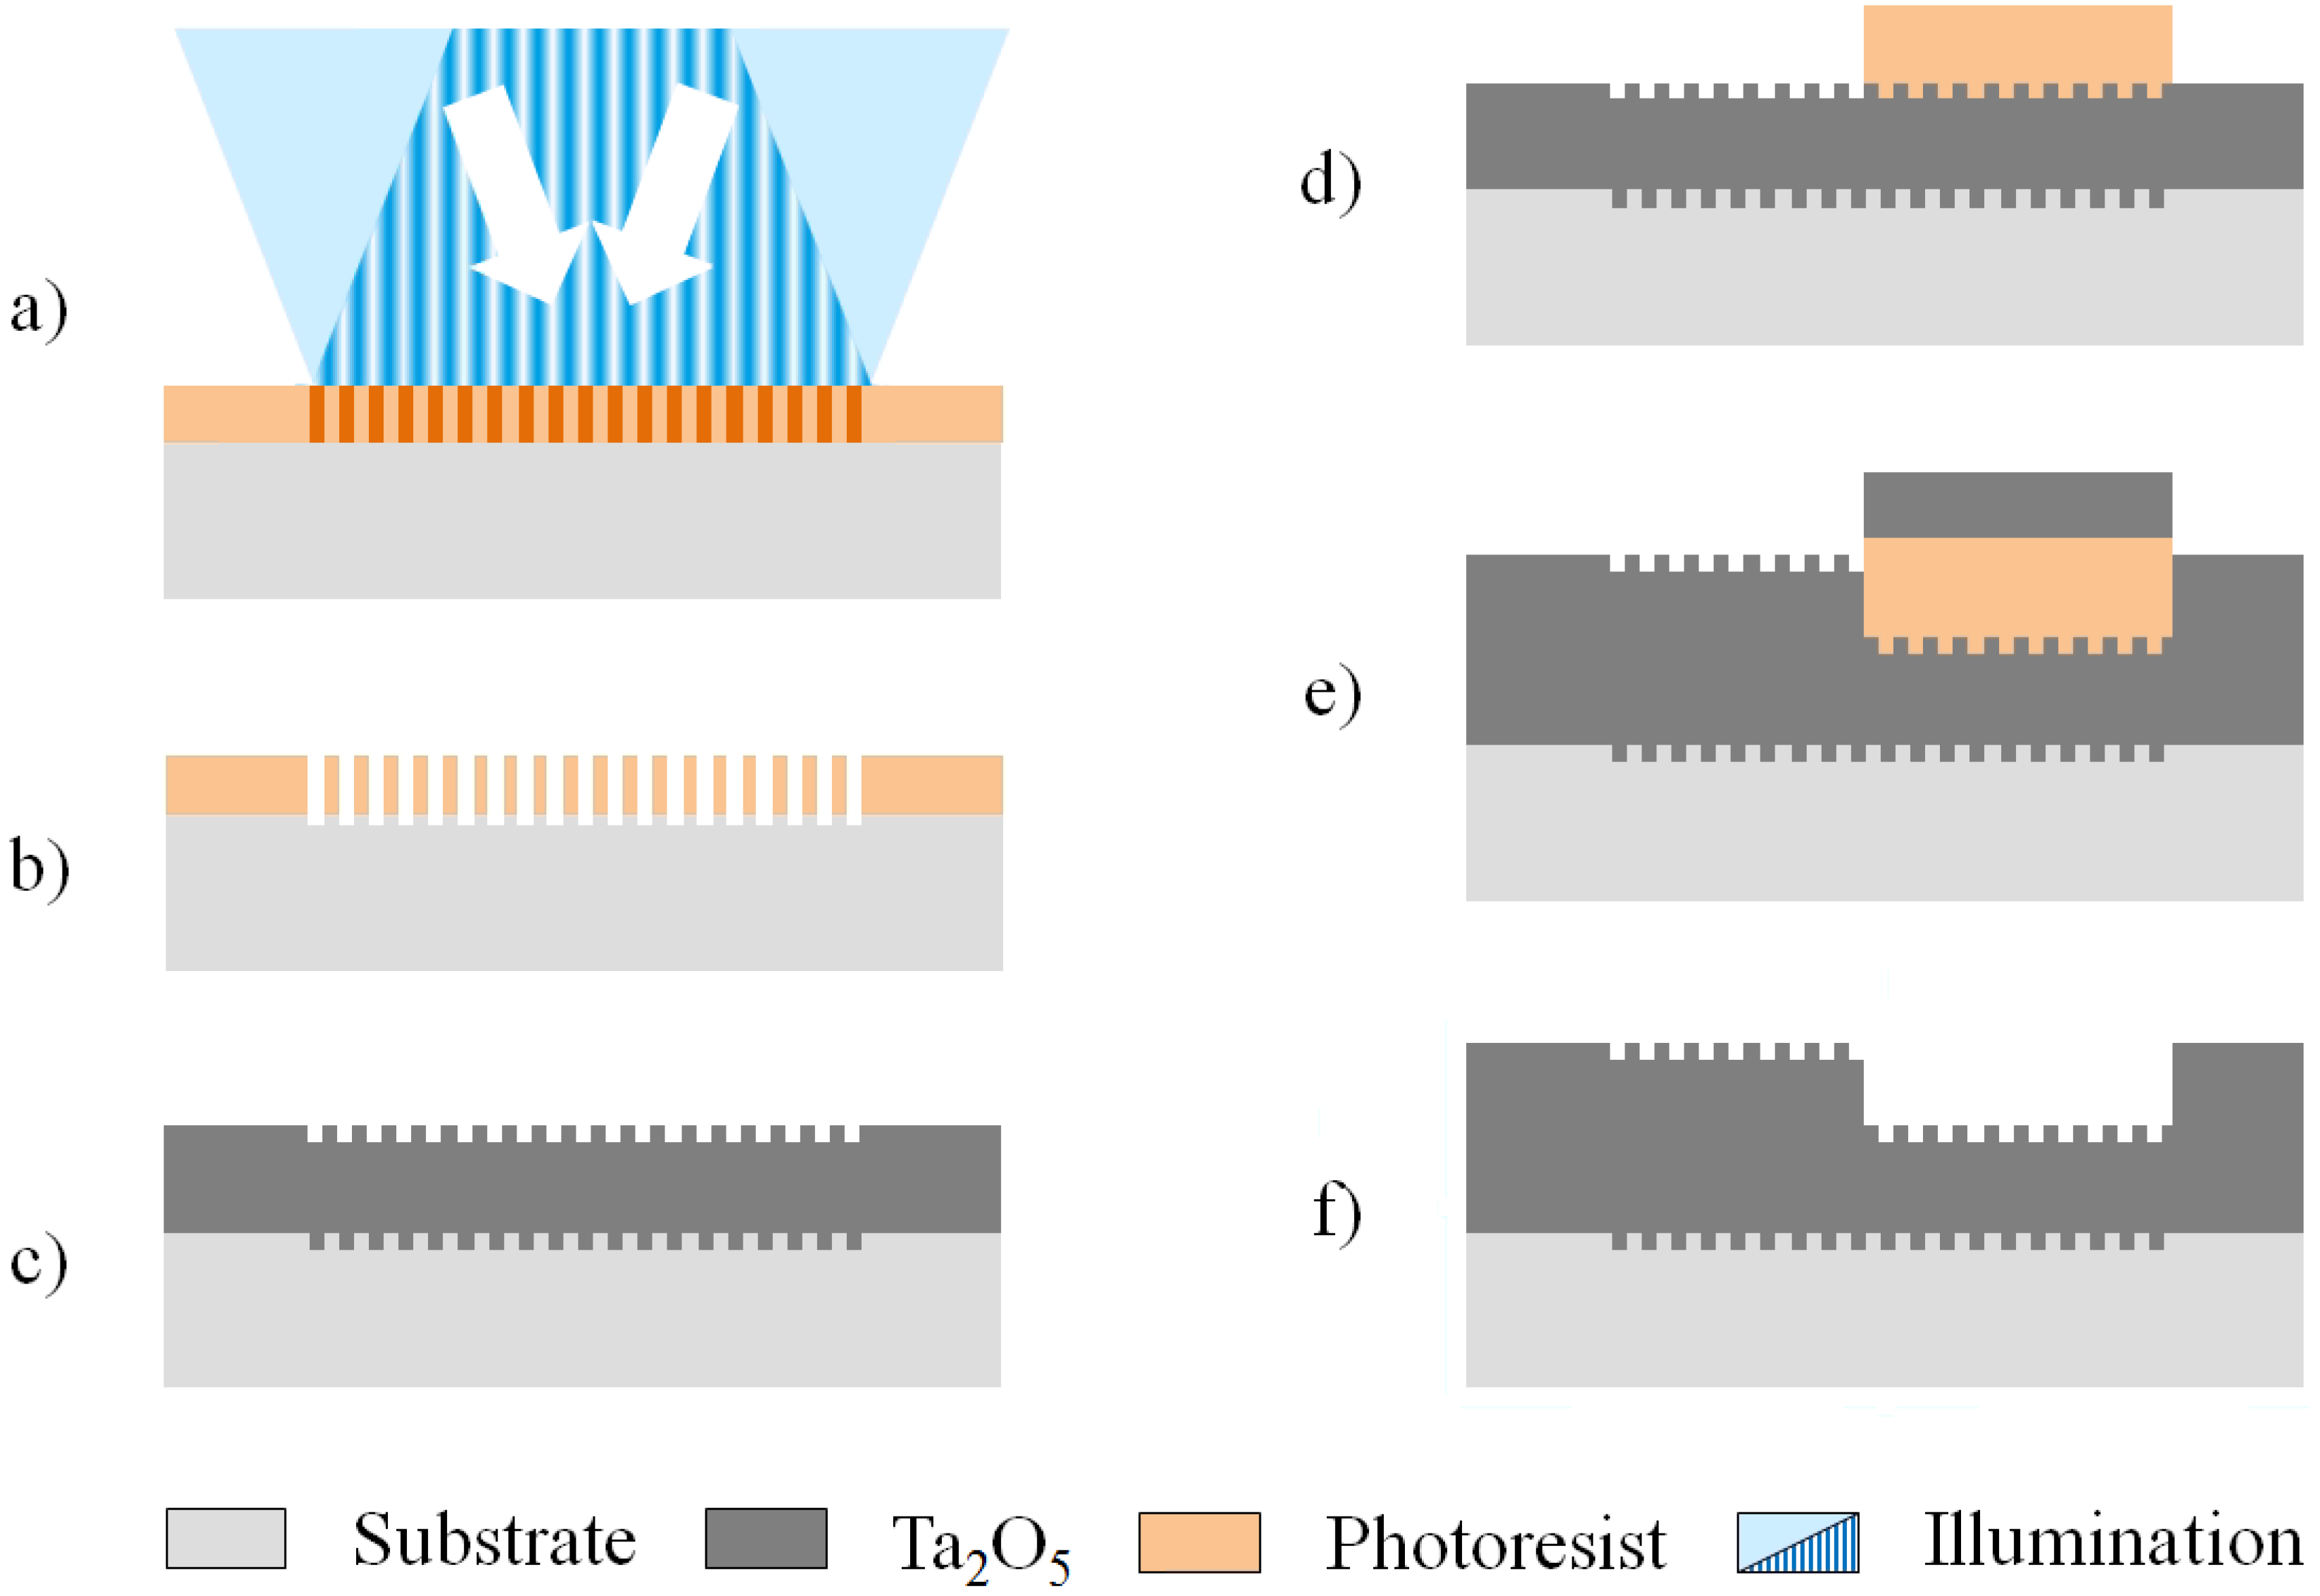
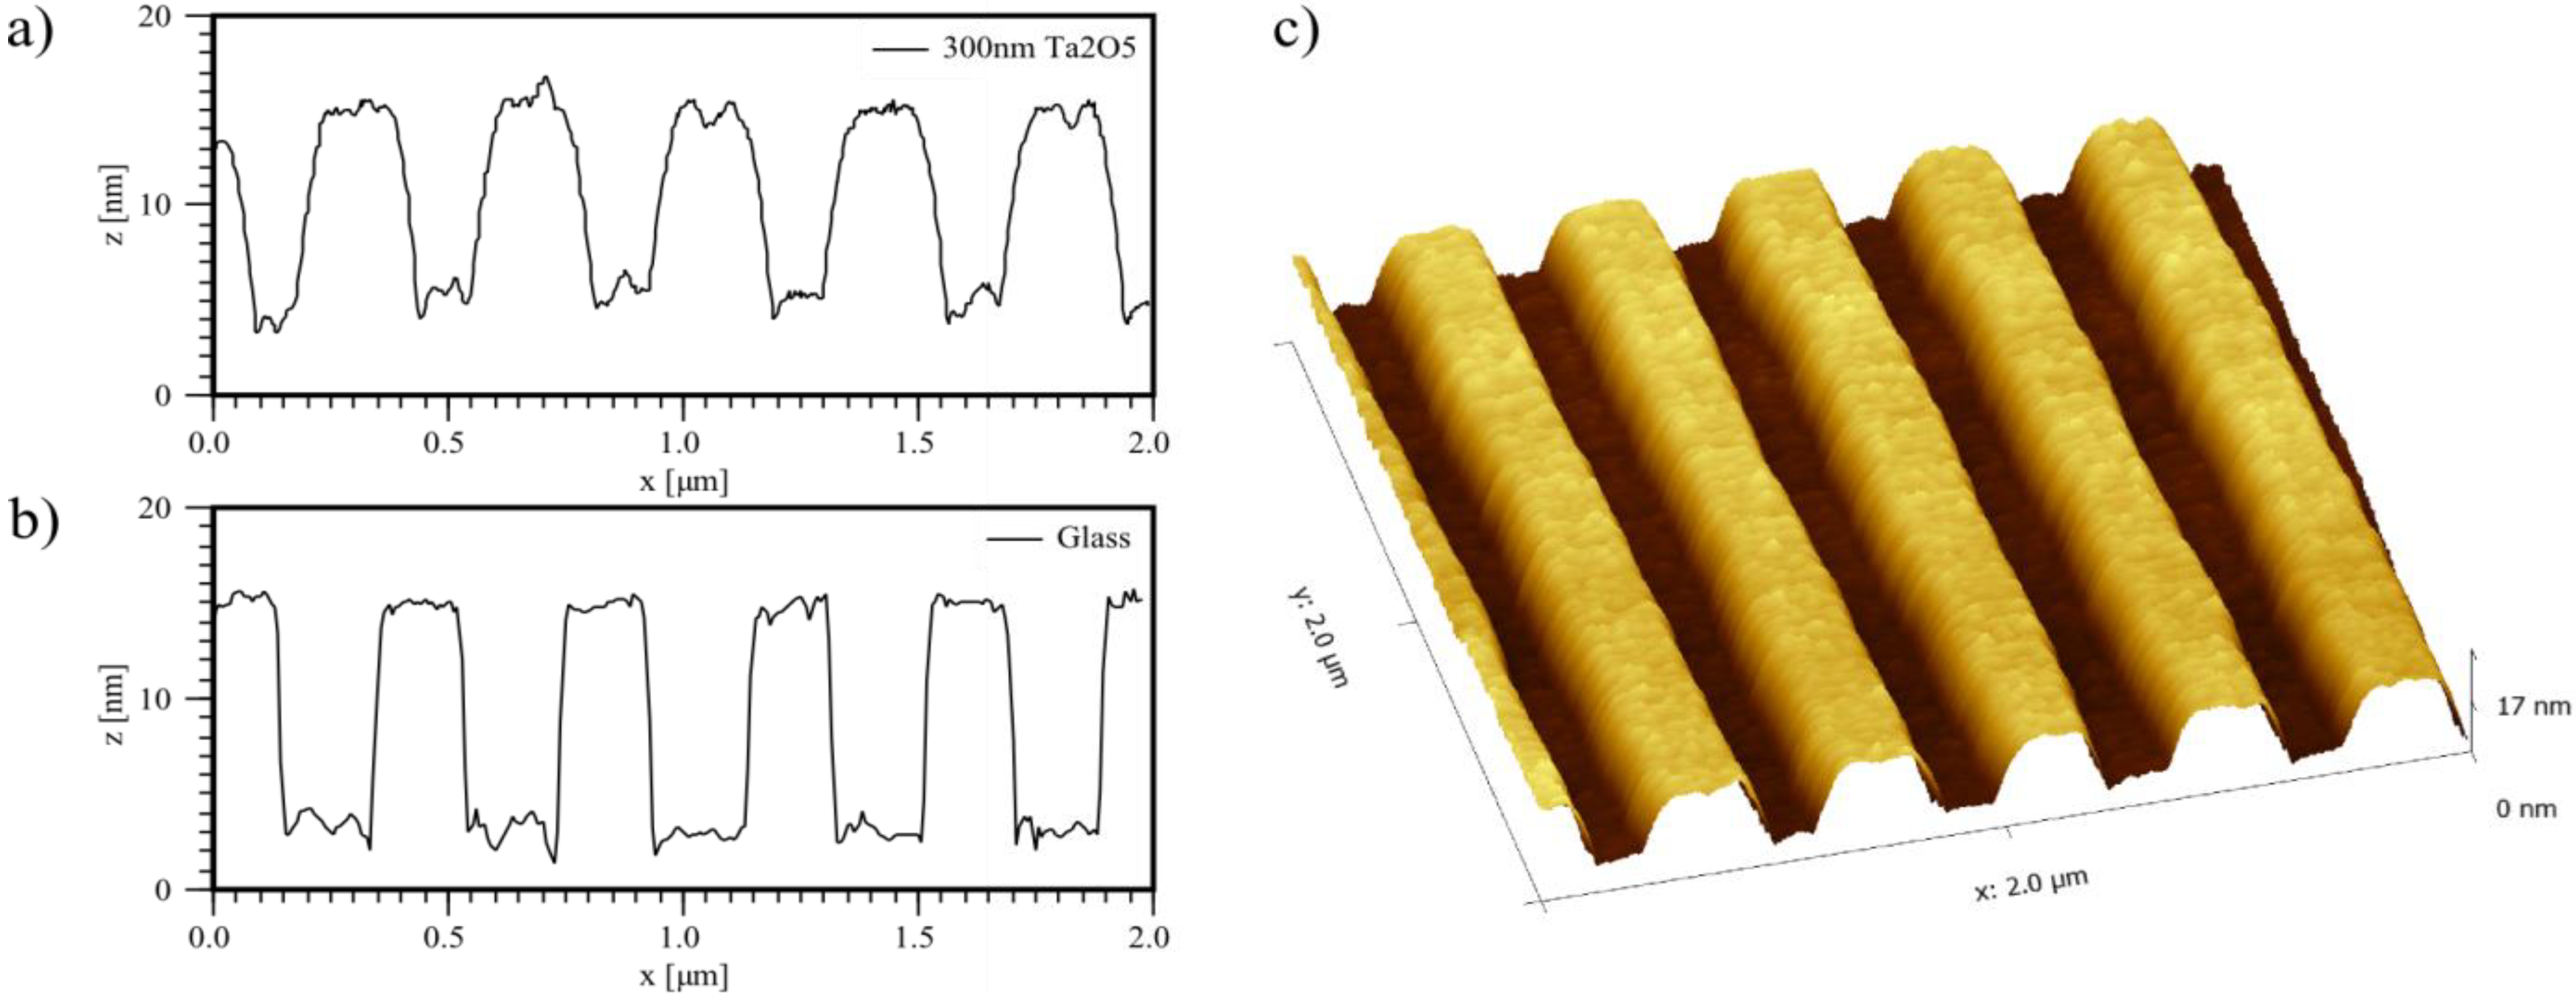
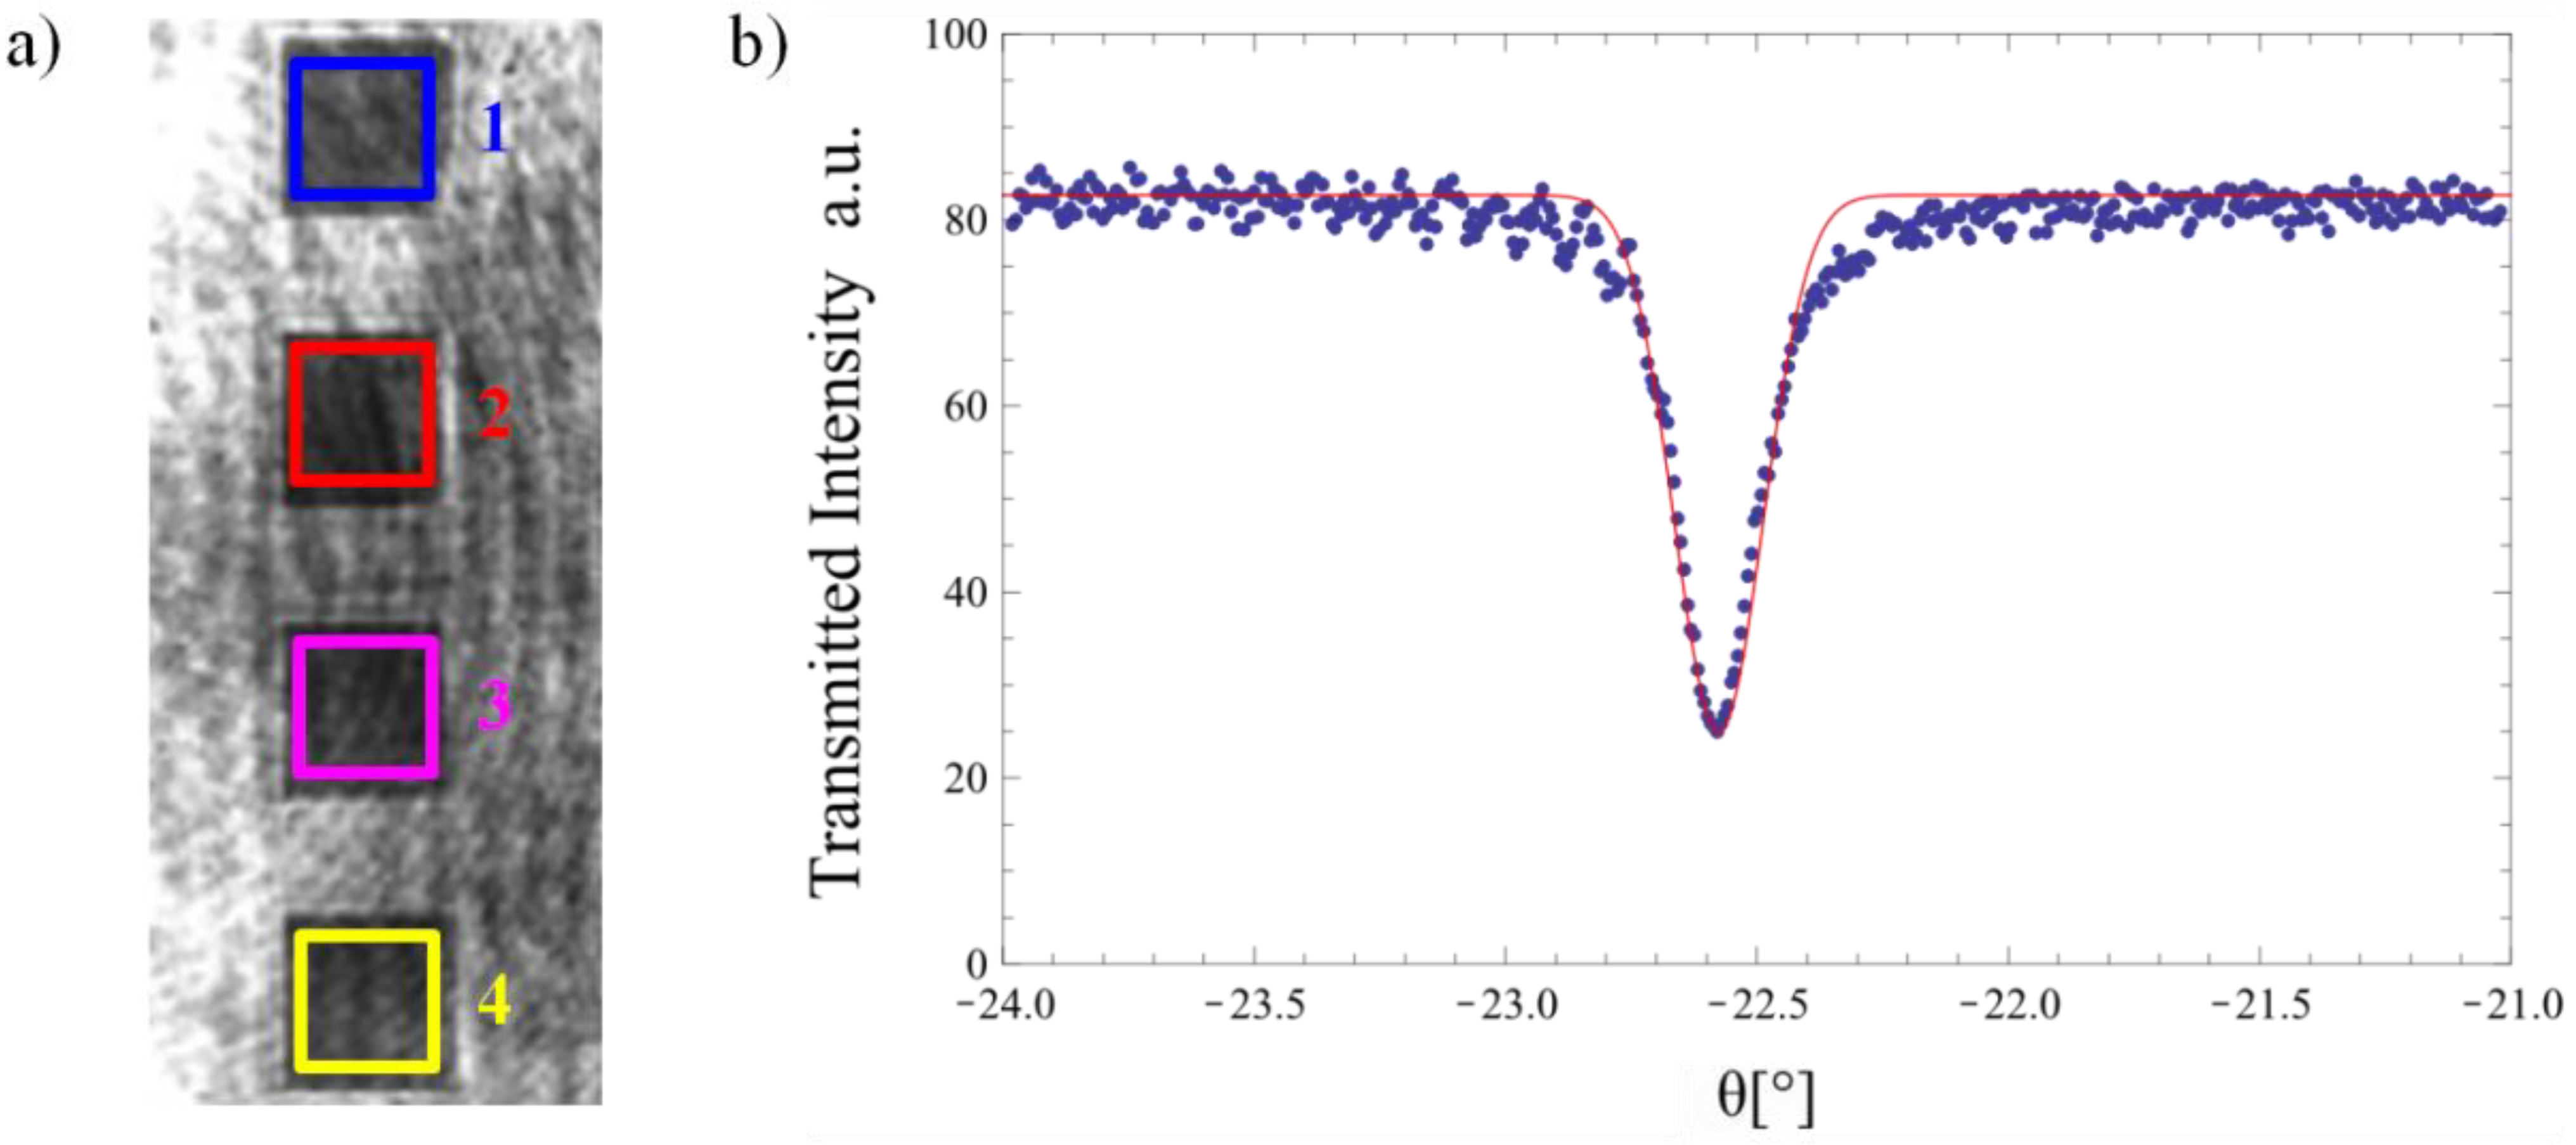
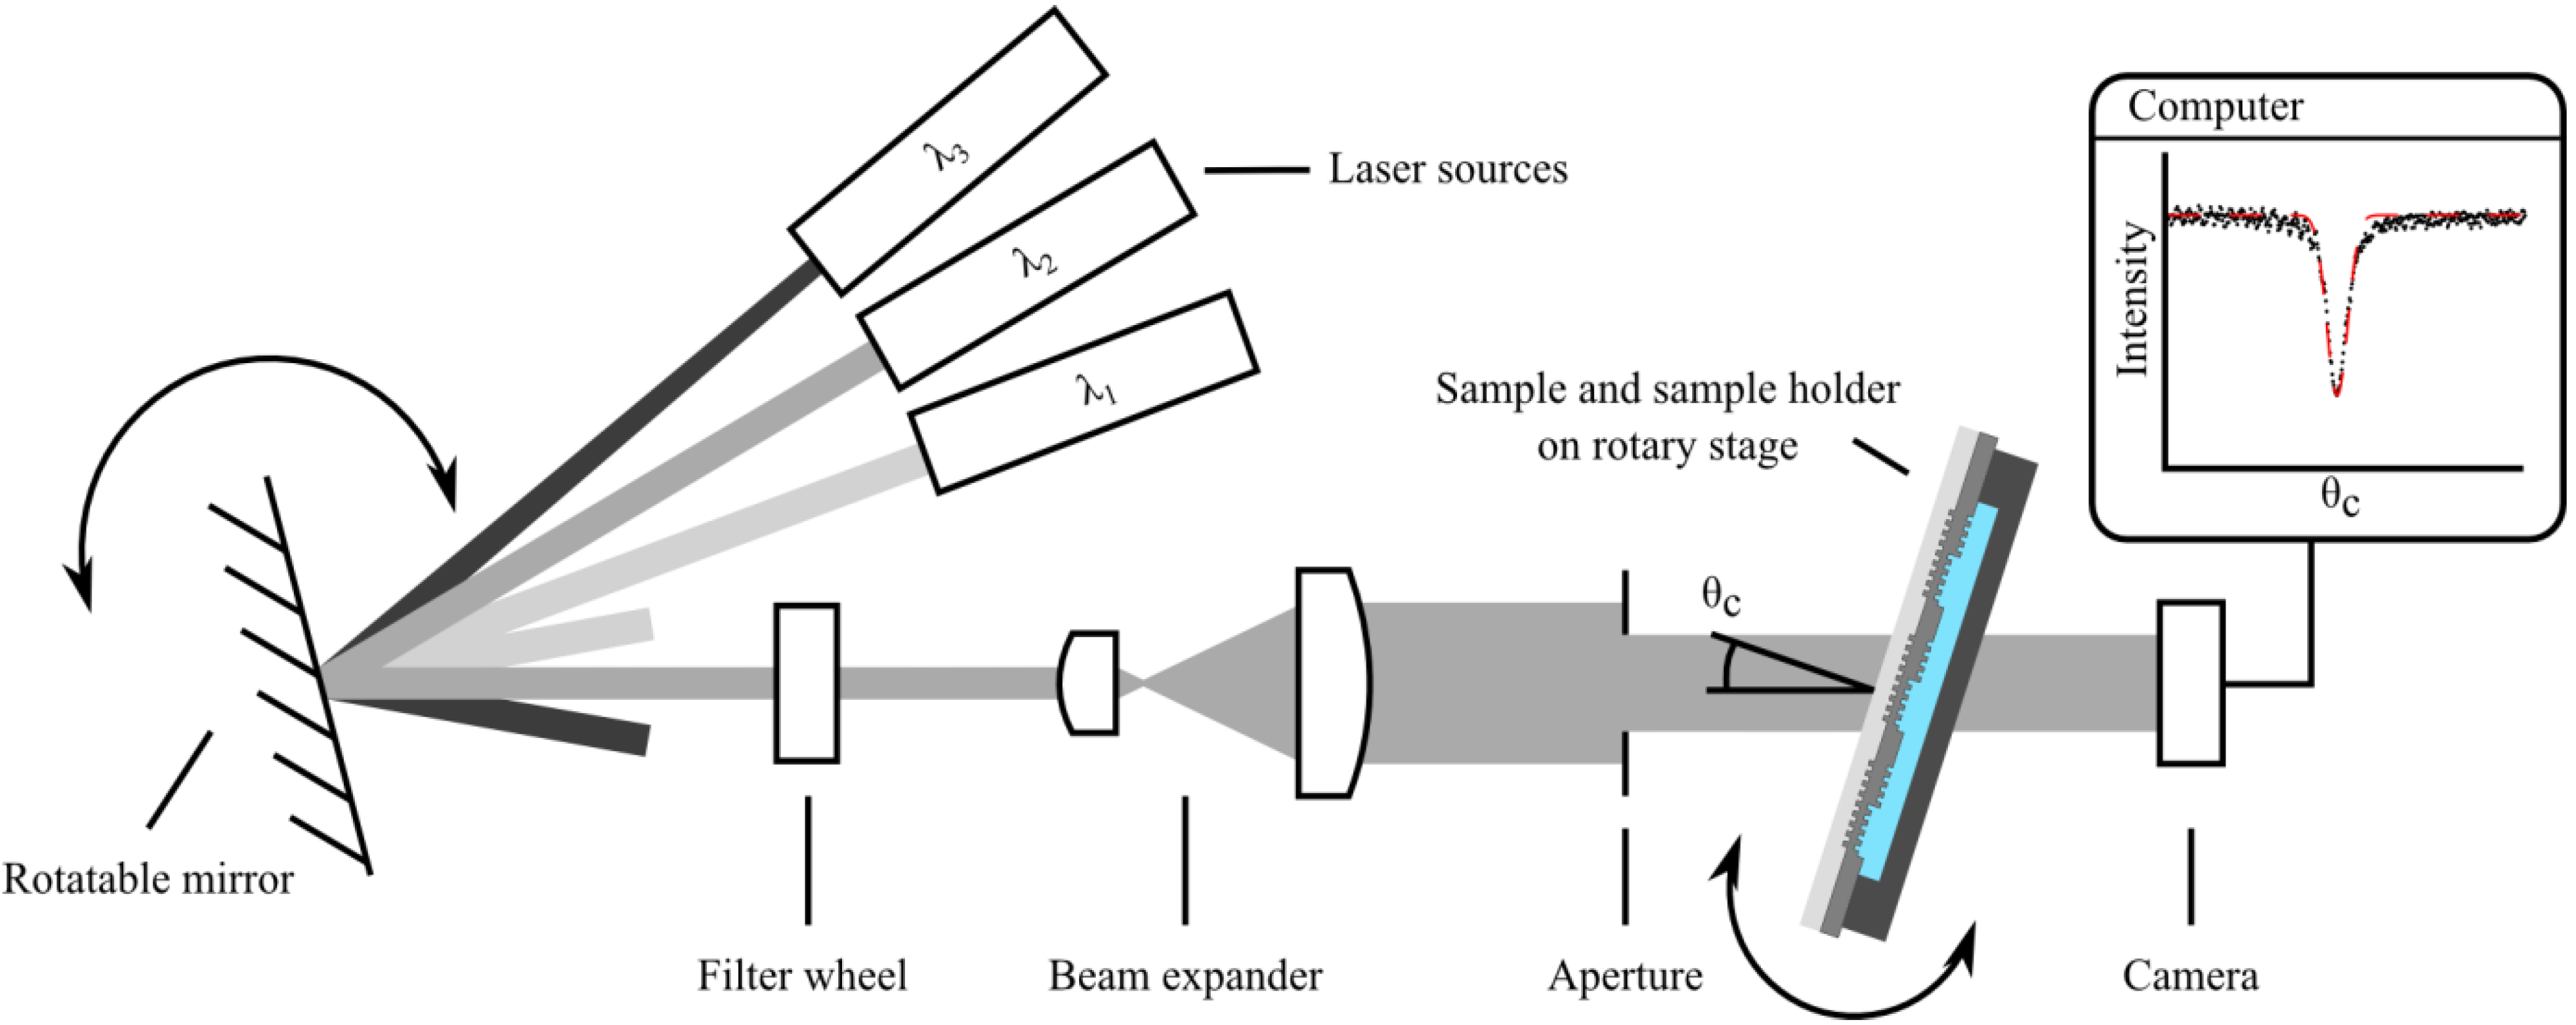
2.1. Sample Preparation and Measurement of the Refractometric Sensitivity

To determine the sensitivity of a given chip design, the in-coupling angles into the waveguide gratings were measured for different waveguide thicknesses hf, wavelengths λ and polarization ρ of the incident light as well as cover refractive indices nc. From the measured in-coupling angles, which were corrected with Snell’s law for the change in angle upon refraction at the transition from substrate to air, the effective refractive indices (Equation (1)) and the corresponding sensitivity s of the sensor towards change of the bulk refractive index were calculated (Equation (3)). In this study, only the case most often met in practice, where nc < ns, corresponding to an aqueous cover solution and a glass substrate, was considered.
The waveguide of the investigated sensor consists of a Ta2O5 film on a structured glass substrate (D263T by Schott, Mainz, Germany), as schematically depicted in Figure 2. To facilitate coupling via the substrate, a broadband anti-reflective coating was deposited on its reverse side. In a second production step, a rectangular grating (0.9 mm by 0.9 mm) was structured into the glass substrate using interference photolithography and reactive ion etching (RIE) in a CHF3/Ar plasma (Figure 3). The developed photoresist was removed by O2 plasma stripping and subsequently, a first layer of Ta2O5 was magnetron sputtered onto the substrate, followed by the deposition of a sacrificial photoresist layer in the regions where a thinner waveguide thickness was desired. A second layer of Ta2O5 was sputtered onto the sample thereafter and the production was completed with a lift-off process to uncover the thinner waveguide regions. Average waveguide thicknesses hf ranging from 83.0 nm ± 0.6 nm to 329.63 nm ± 0.08 nm with a root mean square (RMS) surface roughness of approximately 1.2 nm were produced. The waveguide thicknesses were measured using a spectrometer (Lambda 800, PerkinElmer, Waltham, MA, USA), as well as with a prism coupler (Model 2010, METRICON, Pennington, NJ, USA). The rectangular gratings were produced with a grating depth hg of 12 ± 2 nm and a grating period Λ of 360 ± 0.1 nm.
Several samples were examined by atomic force microscopy (AFM) to measure the RMS surface roughness as well as to ensure the envisaged grating structure and confirm the conformity of the two corrugated interfaces S-F and F-C, which was inherently granted due to the grating’s small aspect ratio (hg << Λ) (Figure 4). This particular chip design with two different waveguide thicknesses is based on the WIOS sensor [19,20], a standard product at Optics Balzers, with the advantage of the production process being readily available, stable and well understood. Whereas the configuration with two adjacent waveguide regions with two different thicknesses are a prerequisite for the WIOS sensor, it was not a requirement for the measurements conducted in the framework of this study, but still beneficial, as two different thicknesses could be investigated at once.
Figure 2. Schematic drawing of the investigated waveguide grating chips. (a) Cross section (not to scale); (b) Top view: Chip with 24 gratings with waveguide thickness hf1 and hf2, respectively, whereas the central eight gratings (four of each height) have been considered per measurement per chip.
Biosensors 05 00187 g002
Figure 3. Chip production sequence: (a) exposure of the deposited photoresist to interference lithography; (b) photoresist development and subsequent etching of the substrate by reactive ion etching (RIE); (c) O2 plasma stripping of the photoresist and sputtering of a first Ta2O5 layer; (d) deposition and structuring of a sacrificial photoresist; (e) sputtering of a second Ta2O5 layer and (f) lift-off of the additional Ta2O5 by removing the sacrificial photoresist.
Biosensors 05 00187 g003
Figure 4. By atomic force microscopy (AFM) measured profile of the grating after (a) and before (b) deposition of ~300 nm Ta2O5, together with a topographical scan of the grating (c) after deposition. Due to the small aspect ratio of the grating (hg << Λ), the structure of the grating is mostly conserved also for thicker Ta2O5 layers.
Biosensors 05 00187 g004
The experimental setup, similar to the one featured in [21] to study final grating length effects, is sketched in Figure 5. The sensor chips were mounted in a transparent PMMA sample holder and different cover media were applied to the corrugated Ta2O5 surface. The investigated media included air, purified water (Milli-QTM, EMD Millipore, Billerica, MA, USA) and index matching liquid (Series A, n = 1.52, Cargille Laboratories, Cedar Grove, NJ, USA). The mounted samples were placed on a motorized rotary stage with encoder (CR1/M-Z7, Thorlabs, Newton, NJ, USA) with an angular repeatability of less than 0.017 degree and an angular resolution of 6·10−4 degree. Afterwards, the samples were illuminated through the substrate with linearly polarized light at wavelengths of 532.3 ± 0.2 nm (CW532, Roithner LaserTechnik, Vienna, Austria), 632.8 ± 0.2 nm (1103P, Uniphase, Mateca, CA, USA), 779.7 ± 0.2 nm (LDM780/3LJ, Roithner LaserTechnik, Vienna, Austria) and 845.1 ± 0.2 nm (LDM850/3LJ, Roithner LaserTechnik, Vienna, Austria), according to the available laser sources within the investigated wavelength range. The emission spectra of the laser sources were previously measured with an optical spectrum analyzer (AQ6373, Yokogawa, Musashino, Japan). To determine the in-coupling angle, the angle dependent light transmission through the grating region was measured with a CCD camera combined with a telecentric lens (Guppy F-033B by Allied Vision Technologies, Stadtroda, Germany and 0.5× TML 63074 by Edmund Optics, Barrington, NJ, USA). For every combination of waveguide thickness, cover refractive index as well as polarization and wavelength of the incident light, 4 out of 24 individual grating regions per chip (Figure 2b and Figure 6a) were measured in parallel to allow for an accuracy estimate of the determined coupling angles. The angle of incidence was swept by turning the mounted sample on the rotary stage, which was controlled via a MATLAB [22] script from an external computer. At the in-coupling angle, the intensity of the transmitted light was decreased as a part of the incident light was coupled into the waveguide, resulting in a dip in the measured transmitted light intensity versus angle.
A typical example of such a measurement is shown in Figure 6. Subsequently and in good approximation to the curve, a Gaussian fit was applied to the inverse of the dip and the center of the fit was defined as the in-coupling angle [21]. Since coupling into the waveguide occurs symmetrically around the angle of normal light incidence onto the waveguide (see Equation (1)), measurements were performed while turning the rotary stage clockwise (+) as well as counter-clockwise (−) from the angle of normal incidence of the light onto the sample. By evaluating the difference between the resulting positive and negative coupling angles, it was thus possible to precisely calculate the angle of normal light incidence onto the sample and therefore to correct the measured in-coupling angles for an offset.
Figure 5. Experimental setup to determine the coupling angles consisting of various laser sources, rotatable mirror for source selection, filter wheel with polarizers for TE and TM polarization selection, beam expander, aperture, the mounted sample on a motorized rotation stage as well as a CCD camera for signal recording.
Biosensors 05 00187 g005
Figure 6. Typical measurement of the transmitted light intensity at the coupling angle: (a) CCD camera image with the four measurement regions. (b) Measured intensity and inverted Gaussian fit for one region to determine the coupling angle. The intensity oscillations are caused by Fresnel reflections at cover and substrate. Configuration: λ = 532.3 ± 0.2 nm, hf = 122.8 ± 0.8 nm, nc = 1.5247.
Biosensors 05 00187 g006
From the measured in-coupling angles, the effective refractive indices were calculated with Equation (1) and subsequently the sensitivity with Equation (3) for two different cases; in the first case, the difference Δnc1 between air and water and in the second the difference Δnc2 between water and the index matching liquid was evaluated. These measurements were performed with TE and TM polarization of the incident light. Furthermore, only the first two diffraction orders mg = ±1 of the grating and excitation of the waveguide’s fundamental mode was investigated, according to the coupling condition in Equation (1).

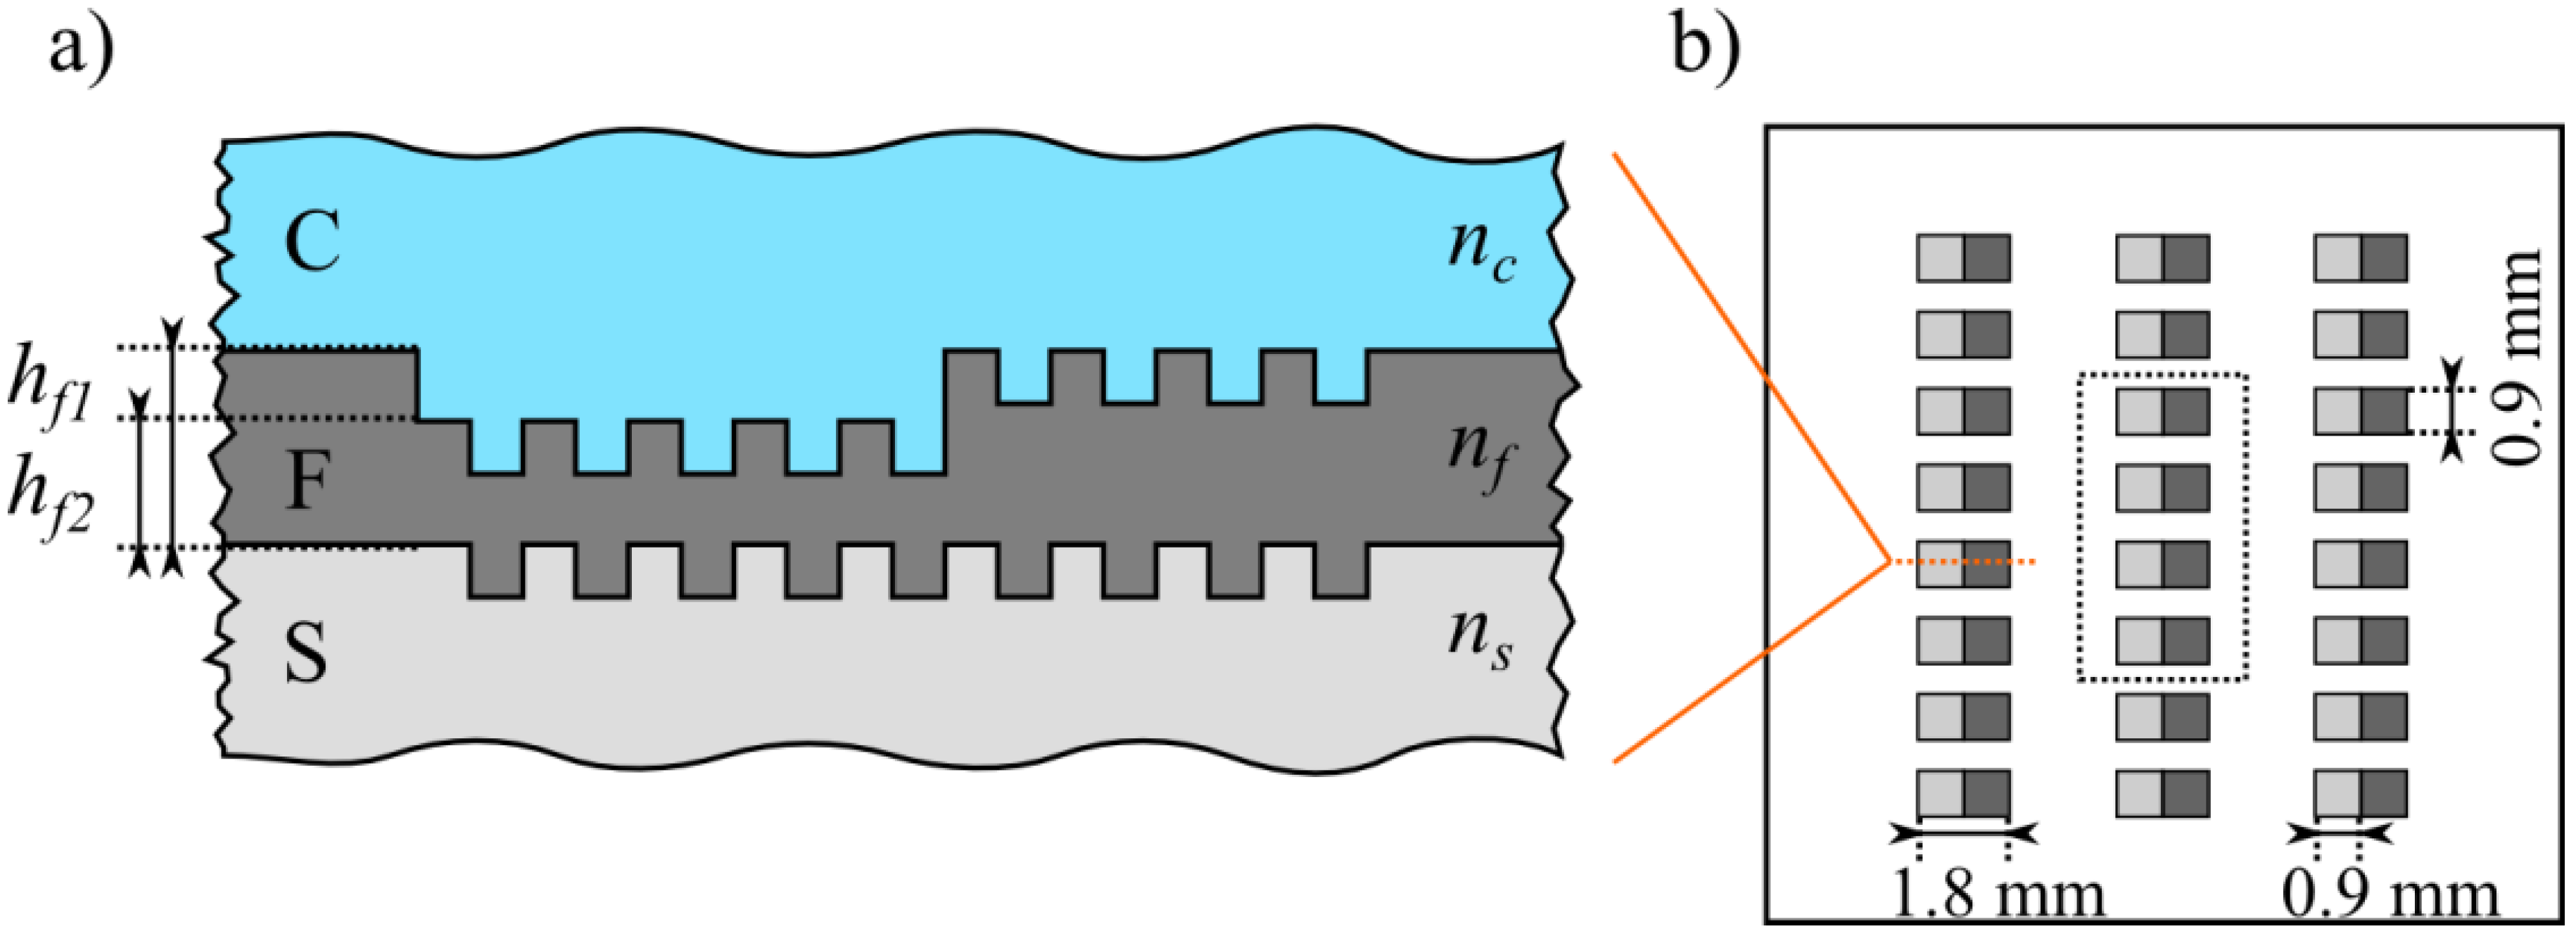
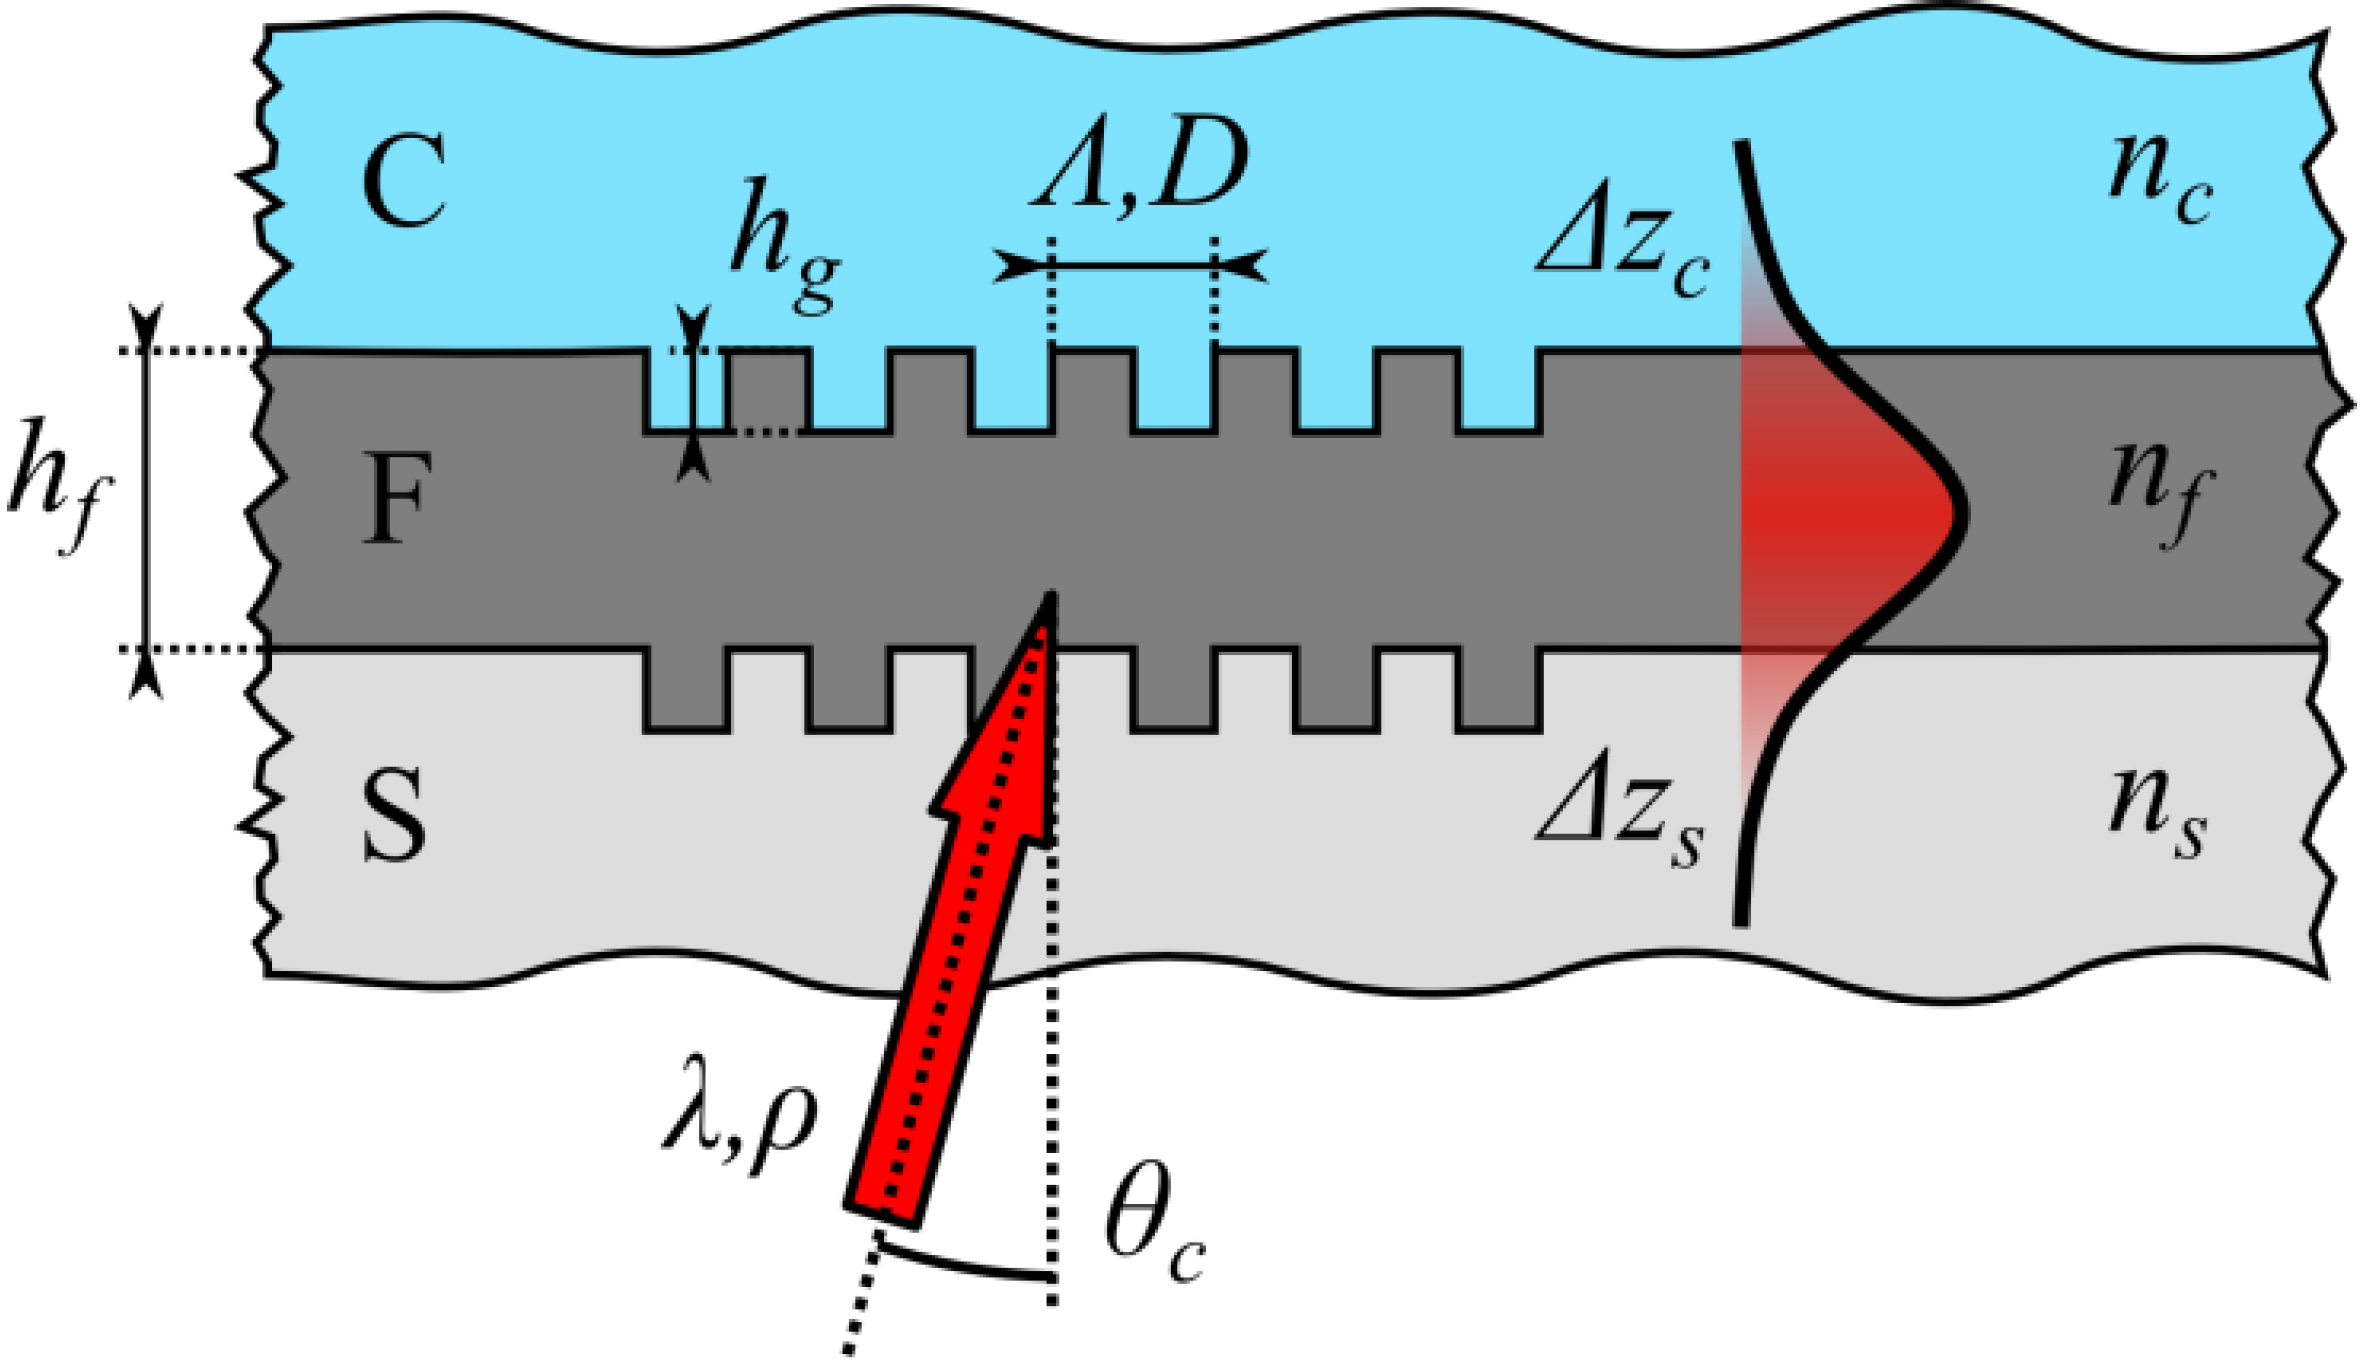
2.2. Calculation of the Theoretical Sensitivity

The theoretical sensitivity was calculated by numerically solving the transcendental three-layer mode equation (Equation (8)) to compute neff
2 π λ n f 2 n e f f 2   h f + Φ c + Φ s m π = 0
where
Φ c / s = t a n 1 [ ( n f n c / s ) 2 ρ n e f f 2 n c / s 2 n f 2 n e f f 2 ]
and m = 0 for the considered fundamental modes. The measured wavelengths of the incident light were directly fed into Equation (8) along with the corresponding refractive indices listed in Table 1. The refractive indices of the liquids were either provided by the manufacturer (for the index matching liquid) or by literature (for water [23]). The refractive index of air was set to nair = 1.0003 for all investigated wavelengths [24], whereas the refractive indices of the substrate and the Ta2O5 film were determined with the aforementioned prism coupler. With these input parameters the effective refractive indices neff were calculated for the three different cover refractive indices. Together with the cover refractive index difference, the corresponding sensitivity was calculated with Equation (3).
Table 1. Refractive Indices of the Sensor Materials at the Investigated Wavelengths.
λ [nm]nfnsnwaternindex·matching·liquid
532.32.15111.52641.33541.5247
632.82.12291.52131.33211.5173
779.72.10241.51681.32901.5115
845.12.09181.51571.32791.5099

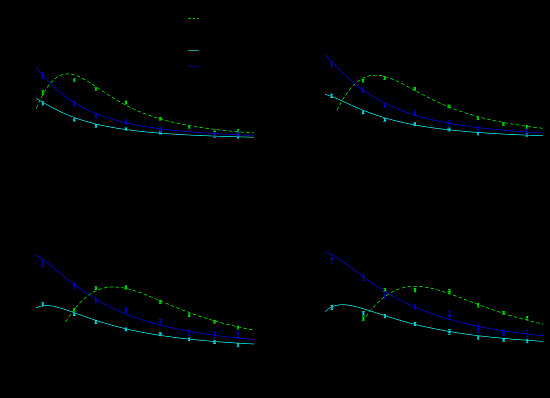
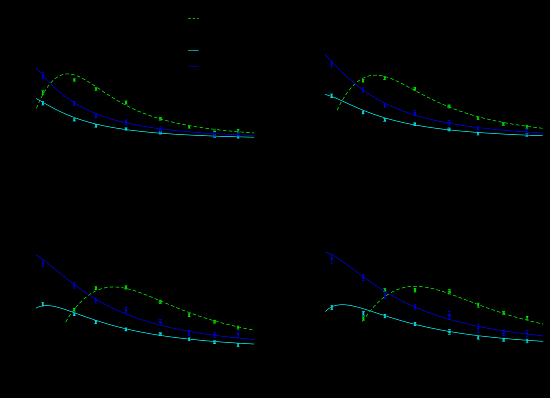
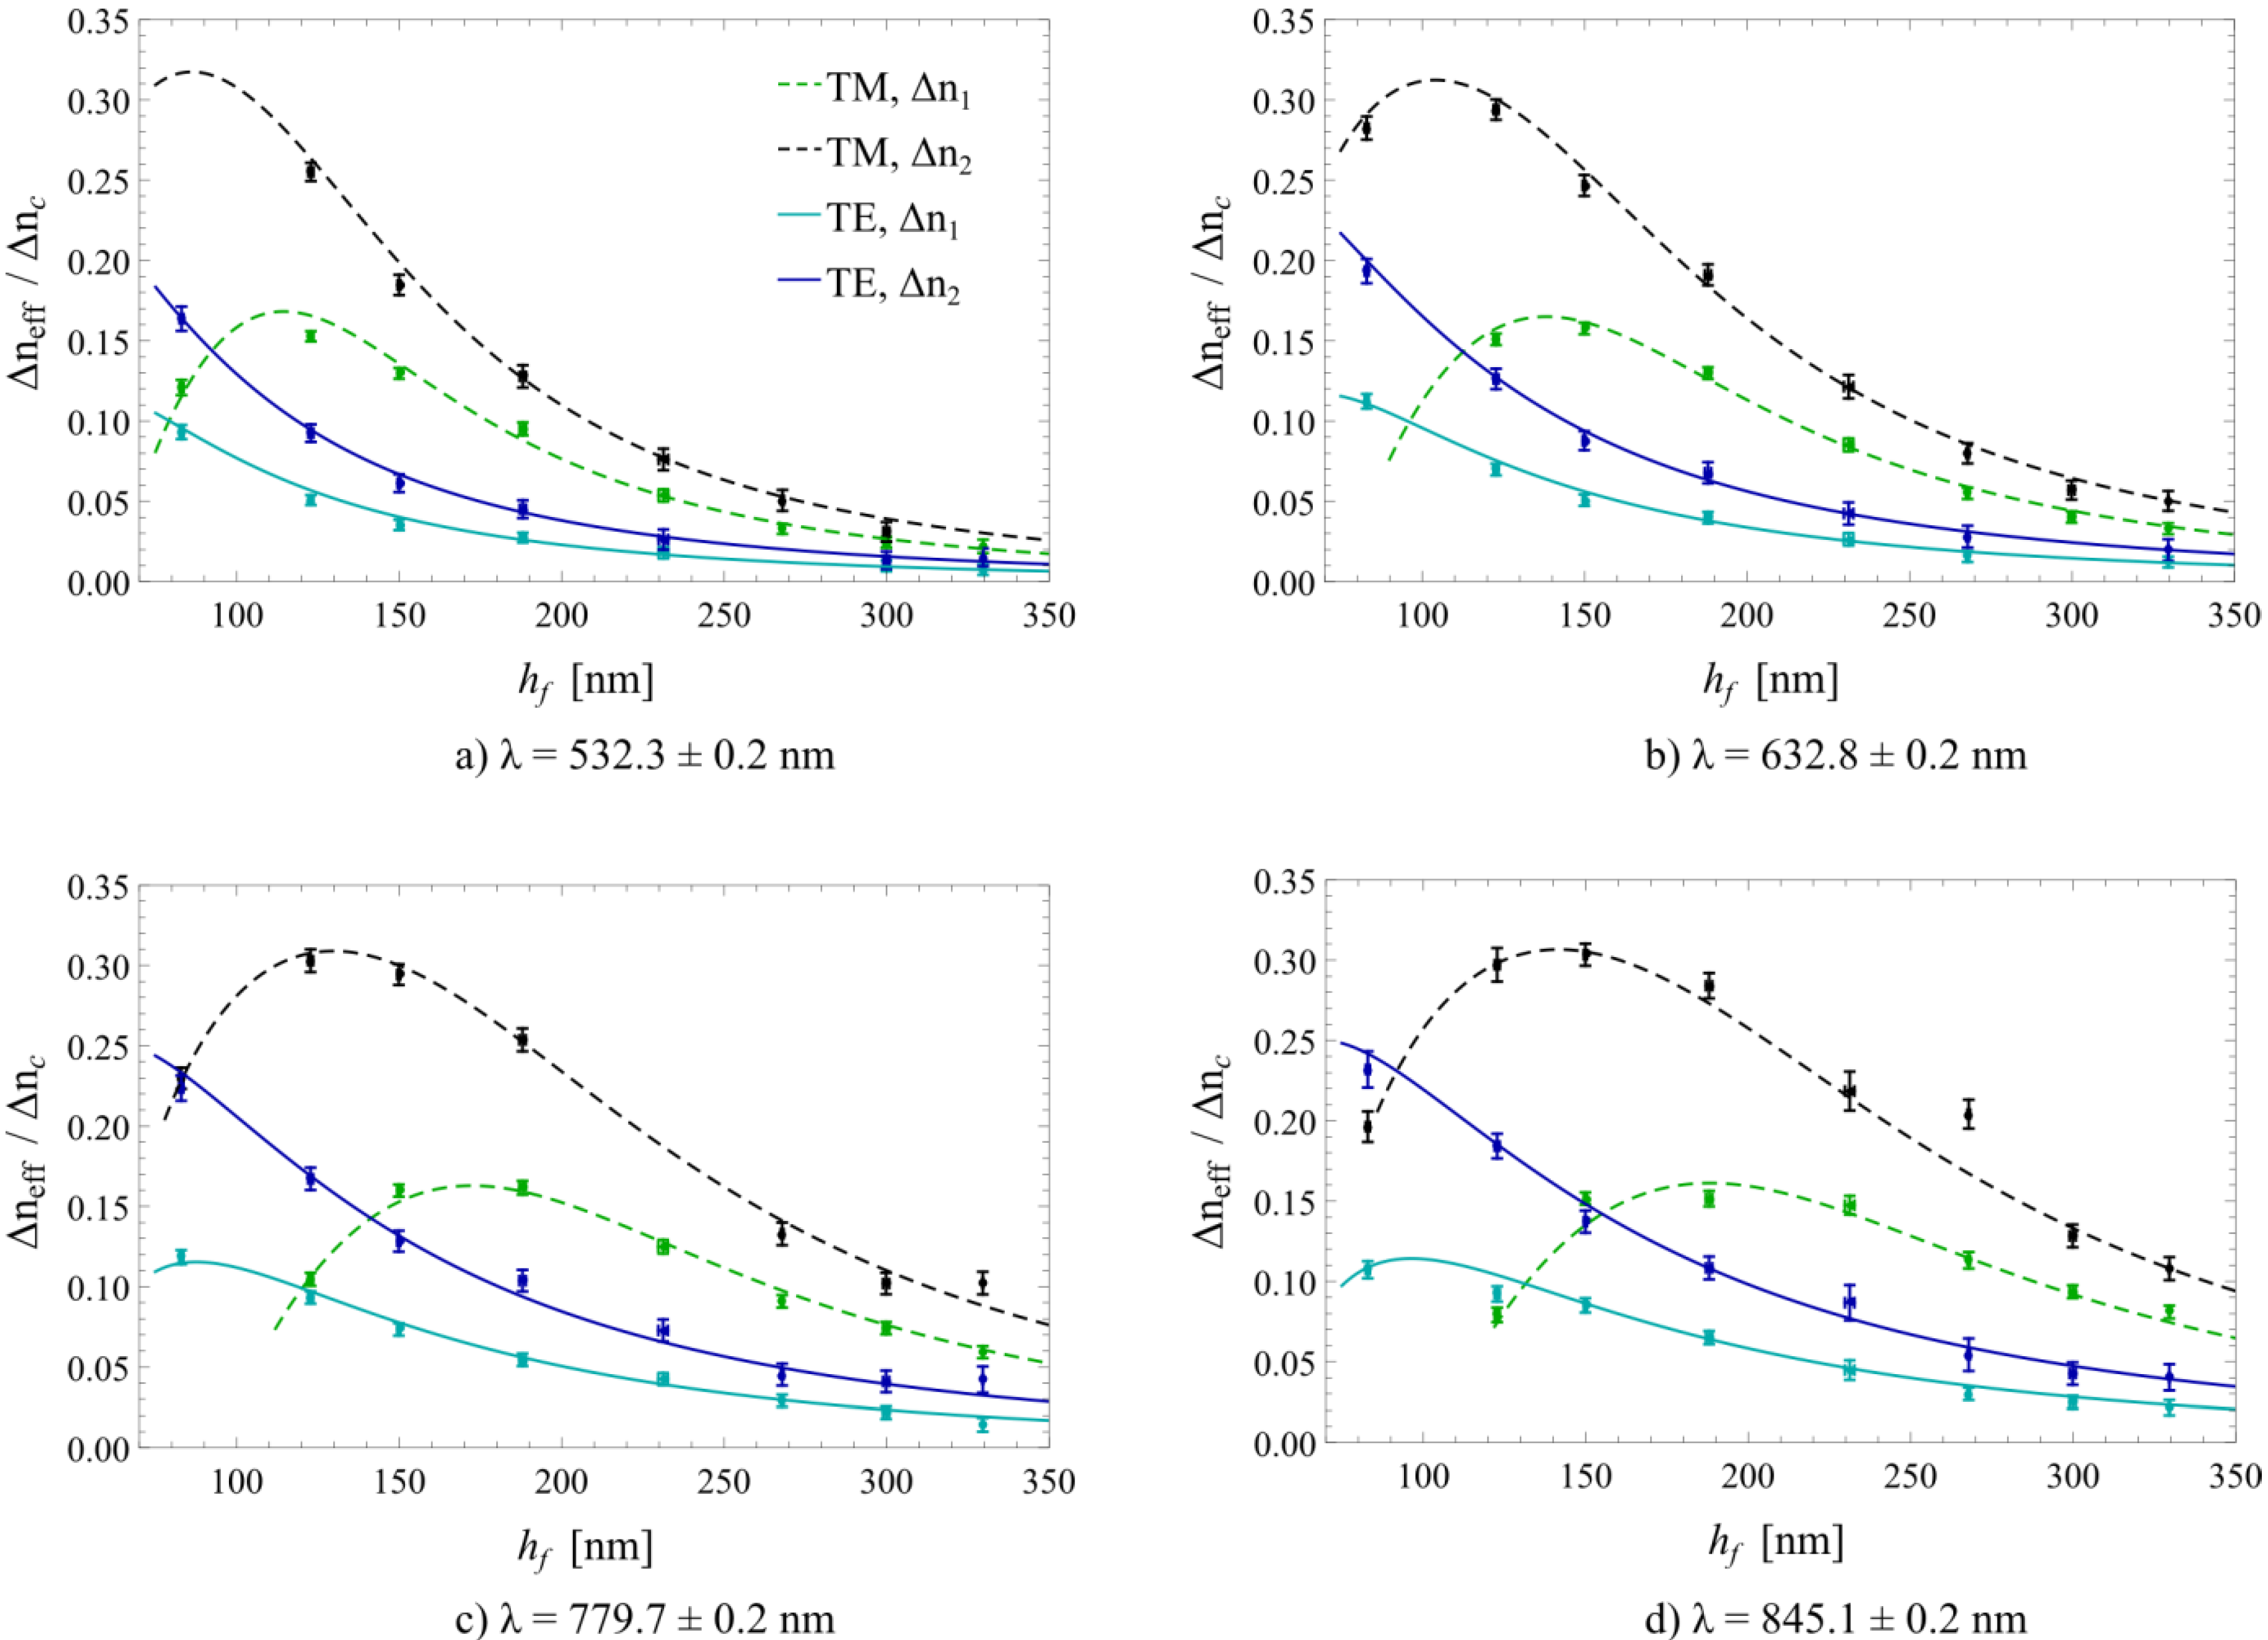
3. Results and Discussion

Both measured and calculated sensitivities for the investigated waveguide grating based (bio)sensor are displayed in Figure 7 for all measured waveguide thicknesses, wavelengths and polarizations of the incident light. There is a good agreement between the measured data and the numerical simulations. To quantitatively express the agreement, the root-mean-square deviation (RMSD) of the measured sensitivities from the simulated ones was calculated for every displayed graph in Figure 7. The RMSD represents the deviation of the simulated values from the measured ones, or vice versa. On average, the RMSD was 0.006 ± 0.003, which is equal to the average standard deviation of the measured sensitivities. Thus, the accuracy is most probably limited by the achievable resolution of the current measurement setup. Additionally, the Pearson product-moment correlation coefficients (PPMCC) were calculated for all the graphs in Figure 7. The PPMCC were ≥0.994, except for λ = 845.1 ± 0.2 nm and TM polarization with PPMCCs of 0.973 (Δnc1) and 0.984 (Δnc2), signifying that the measured and simulated sensitivities are almost perfectly correlated. Therefore, it can be concluded, that the good agreement of measurements and simulations is supported by the calculated RMSD’s and PPMCC’s.
Figure 7. Measured (marks) and calculated sensitivities (lines) for transverse magnetic (TM) and transverse electric (TE) polarization at the four investigated wavelengths of the incident light. All error bars (standard deviations of all measured values) were plotted but some are barely discernible due to their small value.
Biosensors 05 00187 g007
Regarding the measured sensitivity values, one can observe that for TE modes, highest sensitivity is achieved in close proximity to the cut-off thickness of the fundamental mode. By contrast, for TM polarization, waveguide layer thicknesses further away from the cut-off in the range of 100 nm to 170 nm exhibit highest sensitivity towards cover refractive index changes for the investigated range of refractive indices, wavelengths and grating structures. In general, it can be concluded that for homogeneous sensing, the fundamental TM mode exhibits a higher sensitivity over the corresponding TE mode for the investigated case where nc < ns. This can easily be concluded from Equation (7) and is in agreement with the literature [1,11,14,25]. For both polarizations, a general trend of decreasing sensitivity for increasing waveguide thicknesses can be observed. By considering Equations (4) and (5), this can be explained by the power fraction of the mode overlap of the propagating light protruding into the cover medium, which is inversely proportional to the effective waveguide thickness heff. Therefore, with increasing heff, the sensitivity approaches zero as Pc/P→0 [1]. In addition, one can observe that for high refractive indices of the cover materials, in this work the measurement of water-index matching liquid, the sensitivity is increased compared to using cover media with lower refractive indices. This is a direct consequence governed by Equation (6), as the evanescent field in the cover medium Δzc tends towards infinity as neffnc, resulting in a maximized fraction of total power in the cover medium (Pc/P→1).
As mentioned in the introduction, the aforesaid findings only hold true for homogeneous, refractometric sensing and for biosensing with 3D immobilization matrices with thicknesses in the range of or bigger than the evanescent field’s penetration depth (haΔzc). The case of surface or thin-layer sensing (ha << Δzc) has been investigated theoretically as well as experimentally in [1,11,14,26], although the conditions for maximum sensitivity are close to the homogeneous case. A normalized analysis for the sensitivity optimization of waveguide based sensors can be found in [14].
It should also be mentioned that the investigated cover refractive index changes are substantially bigger than in typical sensing applications, where the effect of adsorbing biomolecules on the cover refractive index is several orders of magnitude smaller. Nevertheless, this does not contradict the abovementioned calculations. If all parameters are known (which is the case here), the effective refractive index neff is unambiguously defined via Equation (2). For the calculation and measurement of neff with one cover medium, no parameters of the second cover medium are required. Therefore, these calculations are decoupled and the magnitude of Δnc has no influence on the accuracy of the determination of the effective refractive indices and the derived sensitivity (Equation (3)).

4. Conclusions

In this publication, the refractometric sensitivity of waveguide grating sensors was experimentally determined for different waveguide thicknesses, wavelengths and polarizations of the incident light and compared with numerical calculations to verify well-established theory.
A good agreement between theoretically calculated and experimentally measured sensitivity was observed. The RMSD’s of the measured values from the simulated values are in the same order of magnitude as the experimental uncertainty of the measured sensitivities. Further, a very good correlation of the measured and simulated sensitivities was observed, yielding PPMCC’s above 0.97. Therefore, it can be concluded that the sensitivity of the coupling angle towards change of the bulk refractive index can be accurately and reliably modeled with established theory. Hence, this study aims at filling a gap in the published literature by experimentally reconstructing the sensitivity curves for waveguide grating coupler based sensors and it confirms the validity as well as the accuracy of the theoretical predictions for various illumination wavelengths, polarizations, waveguide thicknesses and refractive indices of the cover medium.

Acknowledgments

The authors would like to thank Luca Hirt for writing the software to evaluate the coupling angles, as well as Mirjad Keka and Johannes Kremmel of the Institute for Micro- and Nanotechnology from the University of Applied Sciences and Technology Buchs for the waveguide thickness and refractive index measurements. We also thank Philipp Büchel and Jasmine Deutsch from Optics Balzers for the sample production. The research leading to these results has received funding from the European Union’s Seventh Framework Programme (FP7/2007–2013) under grant agreement n° FP7-KBBE-2010-4-RADAR 265721.

Author Contributions

Both authors contributed to the experiments and the drafting of the manuscript.

Conflicts of Interest

The authors declare no conflict of interest.

References

  1. Tiefenthaler, K.; Lukosz, W. Sensitivity of grating couplers as integrated-optical chemical sensors. J. Opt. Soc. Am. B 1989, 6, 209–220. [Google Scholar] [CrossRef]
  2. Nellen, P.M.; Tiefenthaler, K.; Lukosz, W. Integrated optical input grating couplers as biochemical sensors. Sens. Act. 1988, 15, 285–295. [Google Scholar] [CrossRef]
  3. Cooper, M.A. Optical biosensors in drug discovery. Nat. Rev. Drug Discov. 2002, 1, 515–528. [Google Scholar] [CrossRef] [PubMed]
  4. Pasche, S.; Wenger, B.; Ischer, R.; Giazzon, M.; Angeloni, S.; Voirin, G. Integrated optical biosensor for in-line monitoring of cell cultures. Biosens. Bioelectron. 2010, 26, 1478–1485. [Google Scholar] [CrossRef] [PubMed]
  5. Adrian, J.; Pasche, S.; Diserens, J.M.; Sánchez-Baeza, F.; Gao, H.; Marco, M.P.; Voirin, G. Waveguide interrogated optical immunosensor (WIOS) for detection of sulfonamide antibiotics in milk. Biosens. Bioelectron. 2009, 24, 3340–3346. [Google Scholar] [CrossRef] [PubMed]
  6. Bier, F.F.; Schmid, R.D. Real time analysis of competitive binding using grating coupler immunosensors for pesticide detection. Biosens. Bioelectron. 1994, 9, 125–130. [Google Scholar] [CrossRef]
  7. Vörös, J.; Graf, R.; Kenausis, G.L.; Bruinink, A.; Mayer, J.; Textor, M.; Wintermantel, E.; Spencer, N.D. Feasibility study of an online toxicological sensor based on the optical waveguide technique. Biosens. Bioelectron. 2000, 15, 423–429. [Google Scholar] [CrossRef] [PubMed]
  8. Schmitt, K.; Oehse, K.; Sulz, G.; Hoffmann, C. Evanescent field sensors based on tantalum pentoxide waveguides—A review. Sensors 2008, 8, 711–738. [Google Scholar] [CrossRef]
  9. Kozma, P.; Kehl, F.; Ehrentreich-Förster, E.; Stamm, C.; Bier, F.F. Integrated planar optical waveguide interferometer biosensors: A comparative review. Biosens. Bioelectron. 2014, 58, 287–307. [Google Scholar] [CrossRef] [PubMed]
  10. Lukosz, W. Integrated optical chemical and direct biochemical sensors. Sens. Actuators B Chem. 1995, 29, 37–50. [Google Scholar] [CrossRef]
  11. Kunz, R.E.; Cottier, K. Optimizing integrated optical chips for label-free (bio-) chemical sensing. Anal. Bioanal. Chem. 2006, 384, 180–190. [Google Scholar] [CrossRef] [PubMed]
  12. Guillod, T.; Kehl, F.; Hafner, C. FEM-Based method for the simulation of dielectric waveguide grating biosensors. PIER 2013, 137, 565–583. [Google Scholar] [CrossRef]
  13. Kunz, R.E.; Dübendorfer, J.; Morf, R.H. Finite grating depth effects for integrated optical sensors with high sensitivity. Biosens. Bioelectron. 1996, 11, 653–667. [Google Scholar] [CrossRef]
  14. Parriaux, O.; Veldhuis, G.J. Normalized analysis for the sensitivity optimization of integrated optical evanescent-wave sensors. J. Lightwave Technol. 1998, 16, 573–582. [Google Scholar] [CrossRef]
  15. Tiefenthaler, K.; Lukosz, W. Grating couplers as integrated optical humidity and gas sensors. Thin Solid Films 1985, 126, 205–211. [Google Scholar] [CrossRef]
  16. Lukosz, W.; Nellen, Ph.M.; Stamm, Ch.; Weiss, P. Output grating couplers on planar waveguides as integrated optical chemical sensors. Sens. Actuators B Chem. 1990, 1, 585–588. [Google Scholar] [CrossRef]
  17. Tamir, T.; Peng, S.T. Analysis and design of grating couplers. Appl. Phys. 1977, 14, 235–254. [Google Scholar] [CrossRef]
  18. Löfås, S.; Johnsson, B. A novel hydrogel matrix on gold surfaces in surface plasmon resonance sensors for fast and efficient covalent immobilization of ligands. J. Chem. Soc. Chem. Commun. 1990, 21, 1526–1528. [Google Scholar] [CrossRef]
  19. Wiki, M.; Kunz, R.E. Wavelength-interrogated optical sensor for biochemical applications. Opt. Lett. 2000, 25, 463–465. [Google Scholar] [CrossRef] [PubMed]
  20. Cottier, K.; Wiki, M.; Voirin, G.; Gao, H.; Kunz, R.E. Label-free highly sensitive detection of (small) molecules by wavelength interrogation of integrated optical chips. Sens. Actuators B Chem. 2003, 91, 241–251. [Google Scholar] [CrossRef]
  21. Brazas, J.C.; Li, L. Analysis of input-grating couplers having finite lengths. Appl. Opt. 1995, 34, 3786–3792. [Google Scholar]
  22. MATLAB Release R2010b; The MathWorks, Inc.: Natick, MA, USA, 2010.
  23. Daimon, M.; Masamura, A. Measurement of the refractive index of distilled water from the near-infrared region to the ultraviolet region. Appl. Opt. 2007, 46, 3811–3820. [Google Scholar] [CrossRef] [PubMed]
  24. Ciddor, P.E. Refractive index of air: new equations for the visible and near infrared. Appl. Opt. 1996, 35, 1566–1573. [Google Scholar] [CrossRef] [PubMed]
  25. Schmitt, K.; Hoffmann, C. High-Refractive Index Waveguide Platforms for Chemical and Biosensing. In Optical Guided-wave Chemical and Biosensors I, Springer Series on Chemical Sensors and Biosensors, 1st ed.; Zourob, M., Lakhtakia, A., Eds.; Springer Verlag: Berlin, Heidelberg, Germany, 2010; Volume 7, pp. 21–54. [Google Scholar]
  26. Ramsden, J.J.; Lvov, Y.M.; Decher, G. Determination of optical constants of molecular films assembled via alternate polyion adsorption. Thin Solid Films 1995, 254, 246–251. [Google Scholar] [CrossRef]

