Developing a Real Time Sensing System to Monitor Bacteria in Wound Dressings


Abstract
:1. Introduction


2. Materials and Methods
- Investigate the effects on impedance profiles against frequency with the sensor system for: Staphylococcus aureus growth in suspension, both in a standard culture broth, and when boosted by the addition of glucose to the same broth.
- Investigate the effects of: (a) lower inoculation density on the impedance profiles and (b) the effect of glucose concentration on the impedance profiles. These experiments were performed to explore the detection limits and understand the differences caused by the presence of glucose seen in the initial experiments.
- Test the changes in growth inhibition that might have been caused by the presence of the silver-silver chloride (Ag-AgCl) sensors by prewashing of the sensors to remove early release of silver chloride deposits
- Investigate the effect of different cell inoculation densities on the bacterial growth of three strains of Staphylococcus aureus in the presence of Ag-AgCl sensors.
- Investigate the effect of the application of voltage during the impedance measurements on the bacterial growth of three strains of Staphylococcus aureus. This was to further investigate the inhibiting effect seen in previous experiments, as previous results indicated that by performing the impedance measurements growth inhibition was increased.
2.1. Bacteria
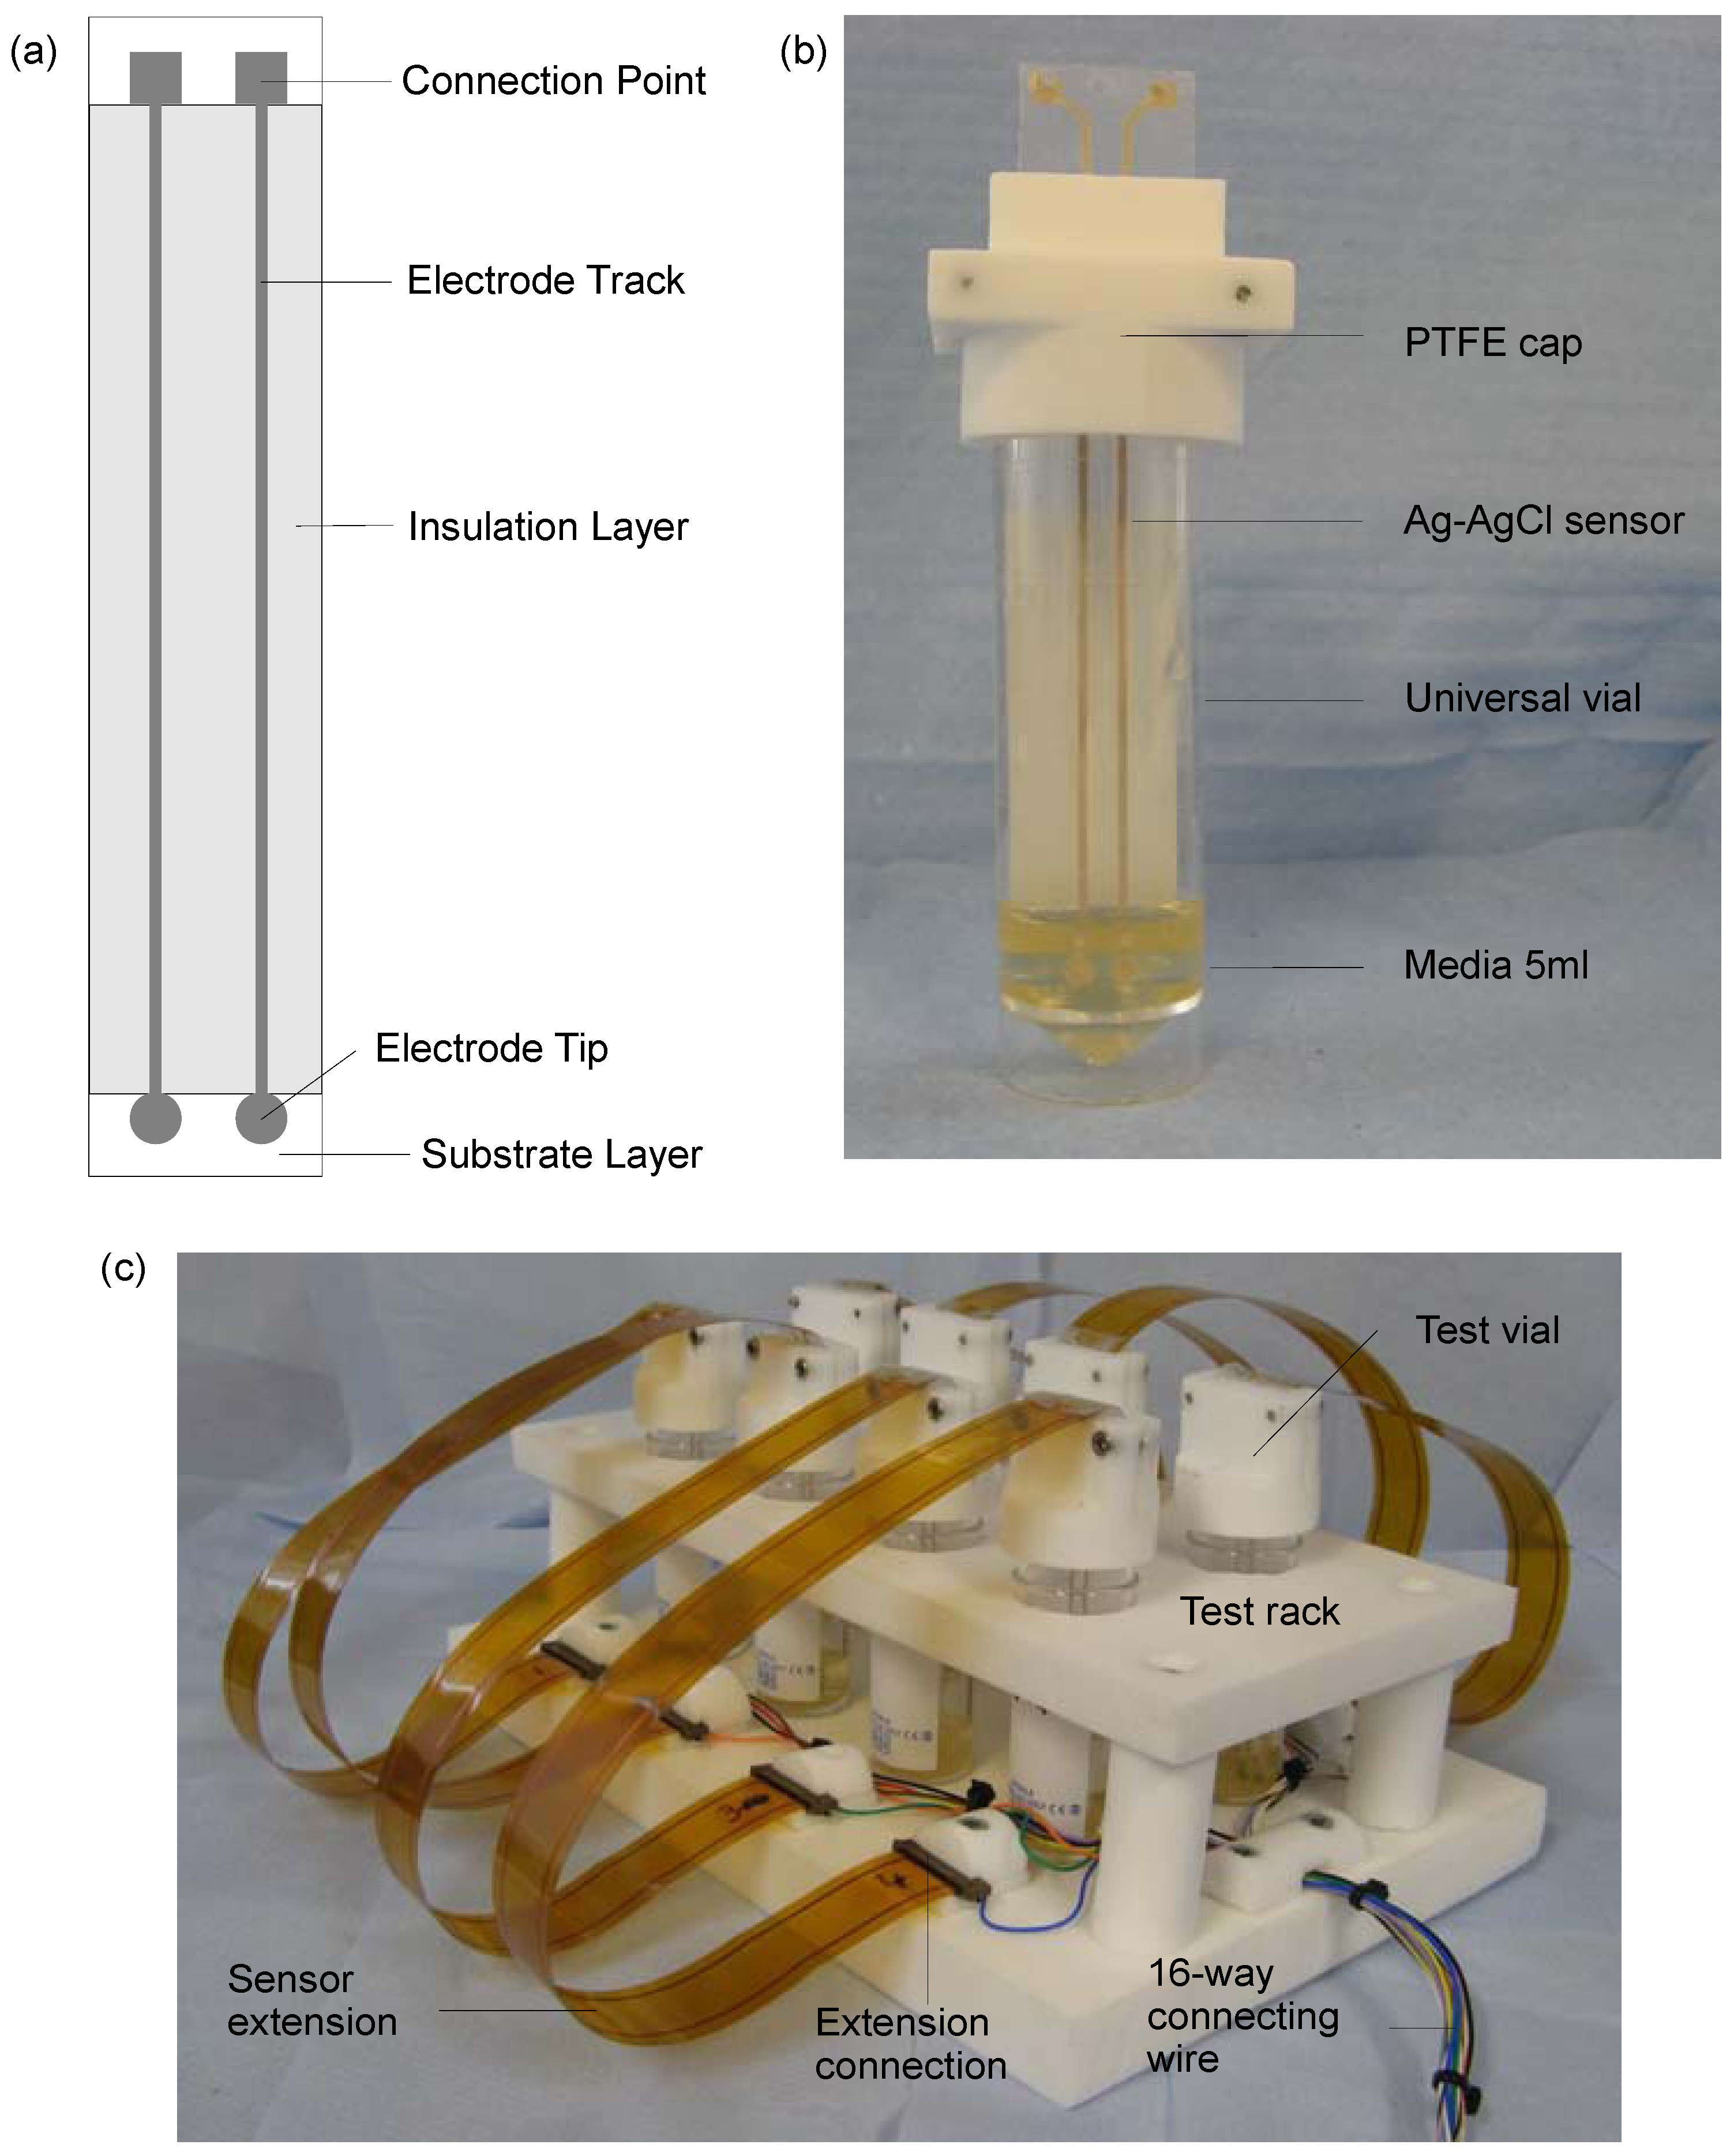
2.2. Sensors
2.3. Key Experiments
2.3.1. Growth of Strain RN4220

2.3.2. Lower Inoculation Densities, Glucose and Pre-washing
2.3.3. Presence of Ag-AgCl Sensors
2.3.4. Presence of Impedance Measurements
3. Results
3.1. RN4220 Growth
3.2. Lower Inoculation Densities, Glucose and Pre-washing

3.3. Presence of Ag-AgCl Sensors
 ); Sample 2(
  ); Sample 3(
  ); Mean control (
  ).
); Sample 2( ); Sample 3( ); Mean control ( ).
).
); Sample 2( ); Sample 3( ); Mean control ( ).
3.4. Influence of Impedance Measurement
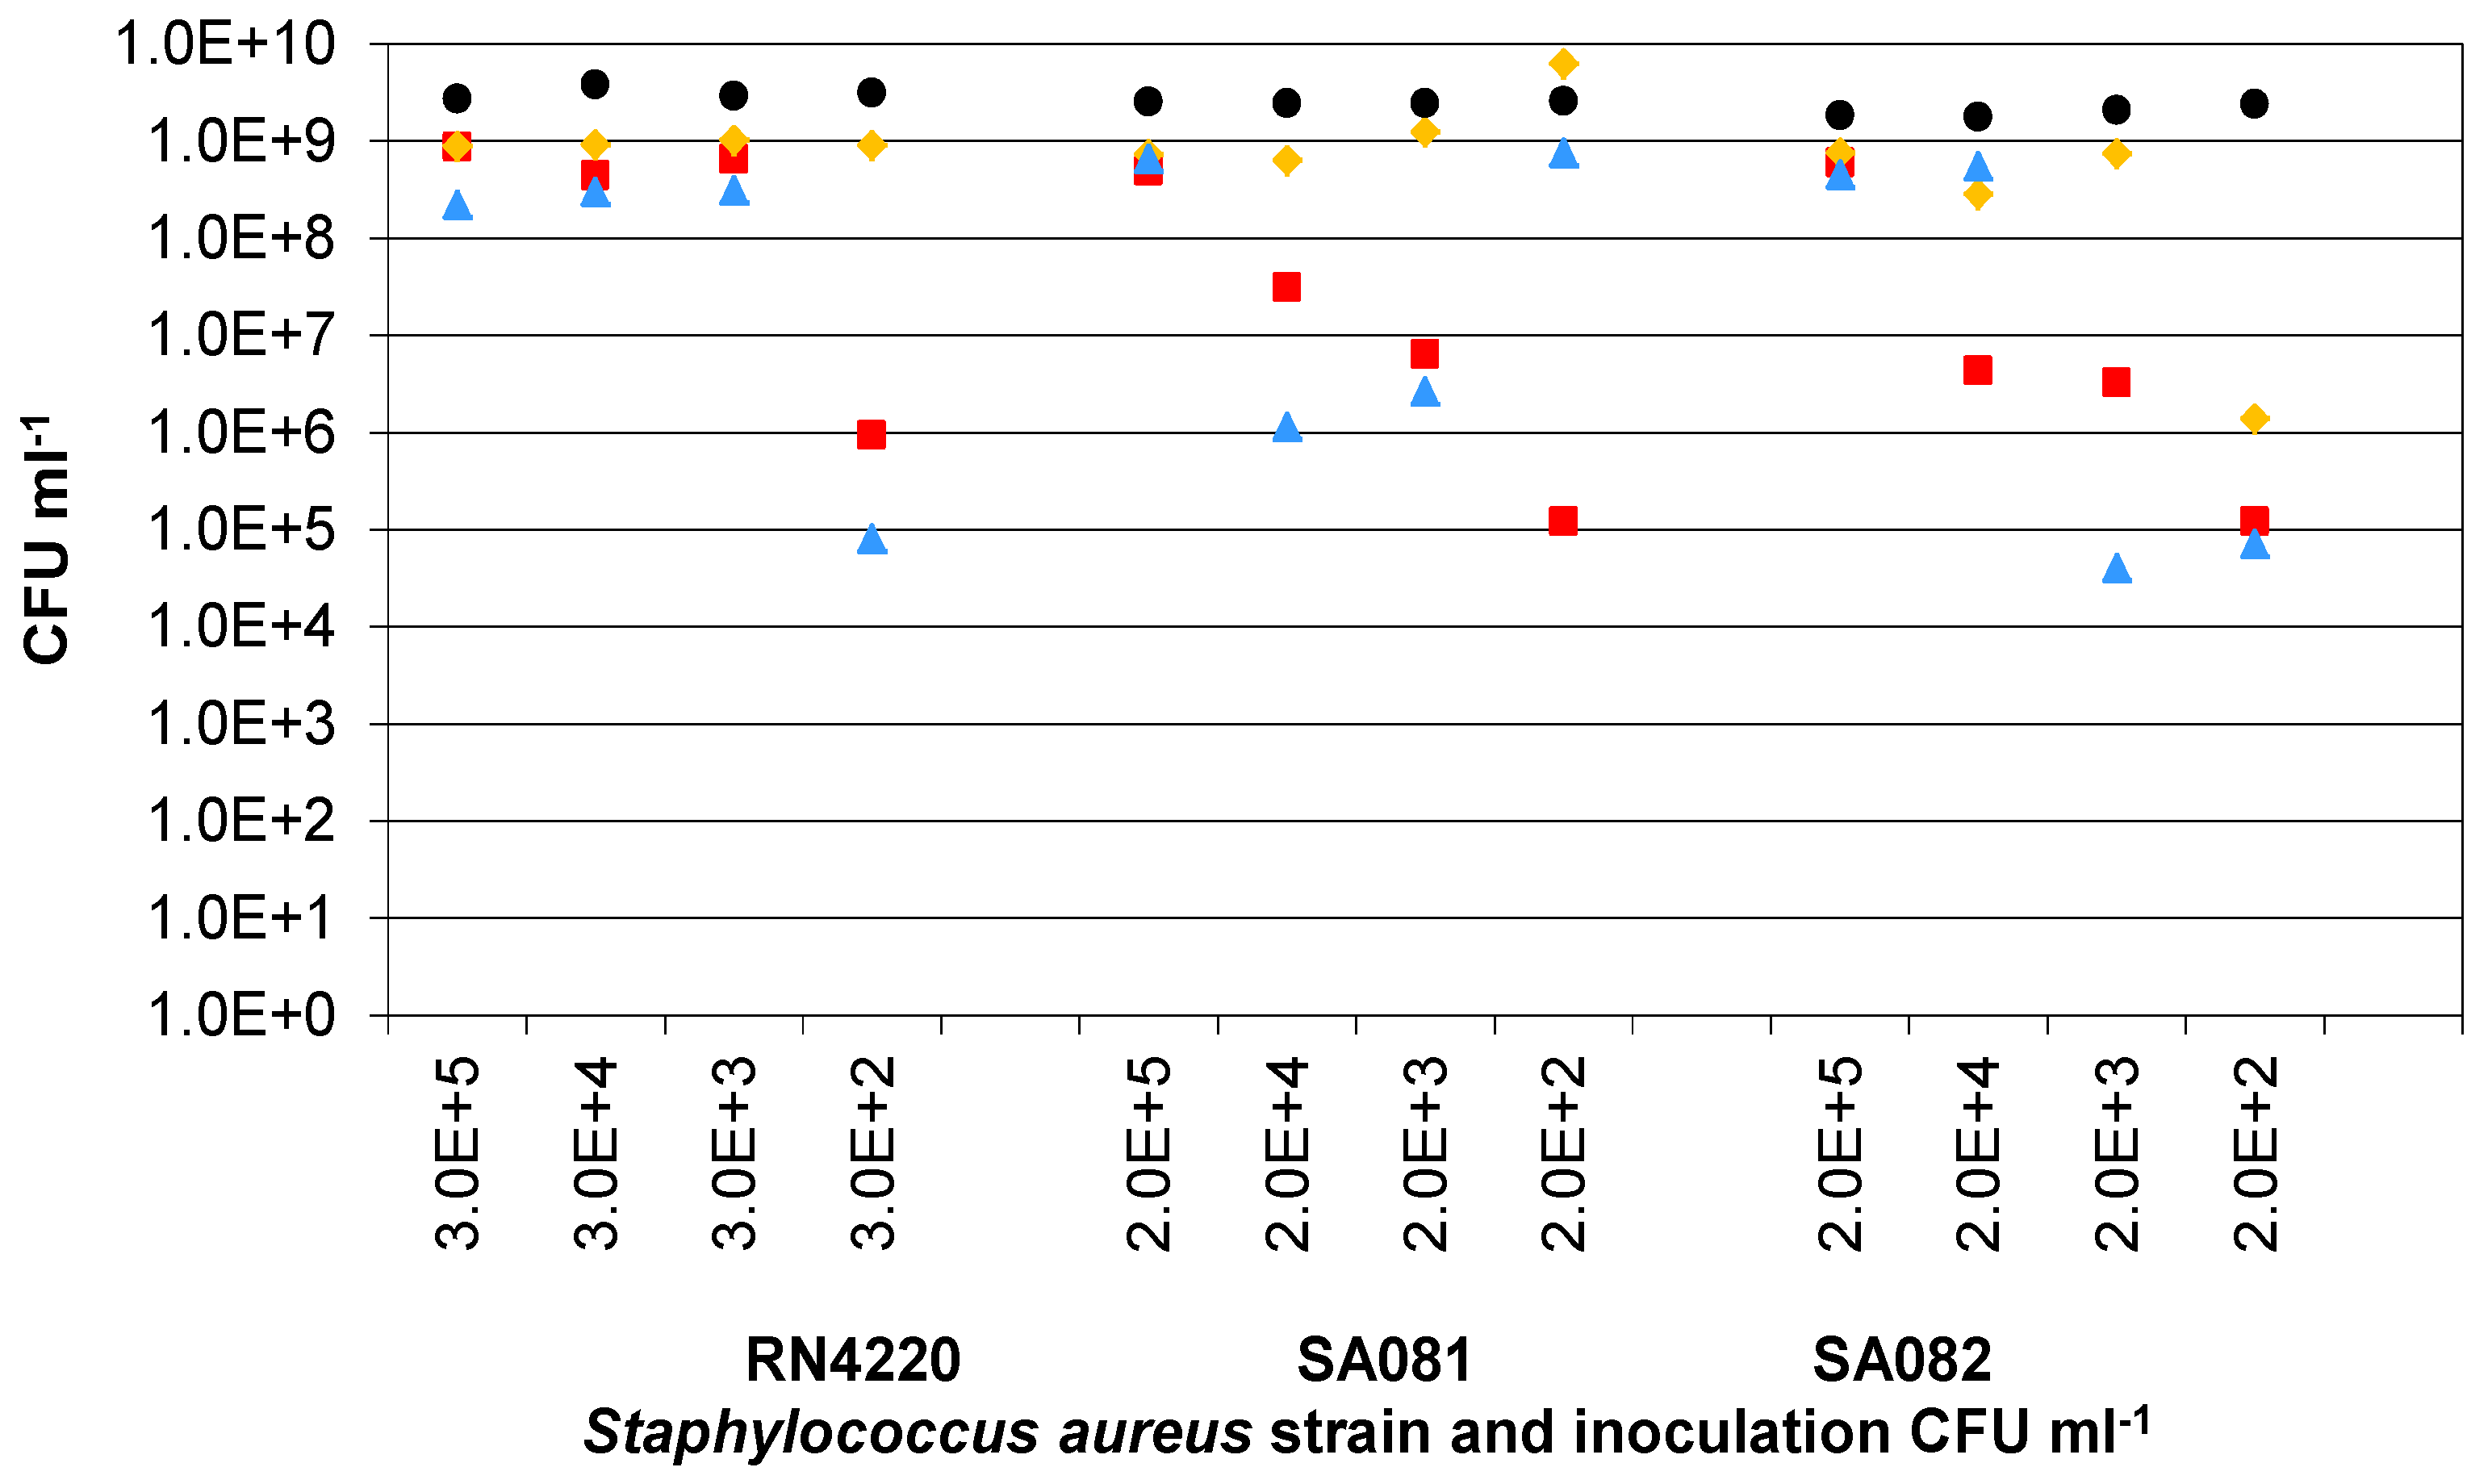
) Start value; ( ) Final cell density without impedance measurements; ( ) Control growth with no sensors; ( ) Final cell density with impedance measurements. (b) Typical magnitudes of the normalised phase angle peak over time from the influence of impedance measurement experiments. The peak occurs at approximately 8 h and increases over time unless the bacteria reach cell densities in excess of 1×10⁷ CFU∙mL−1 where upon it starts to decrease.
) Start value; ( ) Final cell density without impedance measurements; ( ) Control growth with no sensors; ( ) Final cell density with impedance measurements. (b) Typical magnitudes of the normalised phase angle peak over time from the influence of impedance measurement experiments. The peak occurs at approximately 8 h and increases over time unless the bacteria reach cell densities in excess of 1×10⁷ CFU∙mL−1 where upon it starts to decrease. 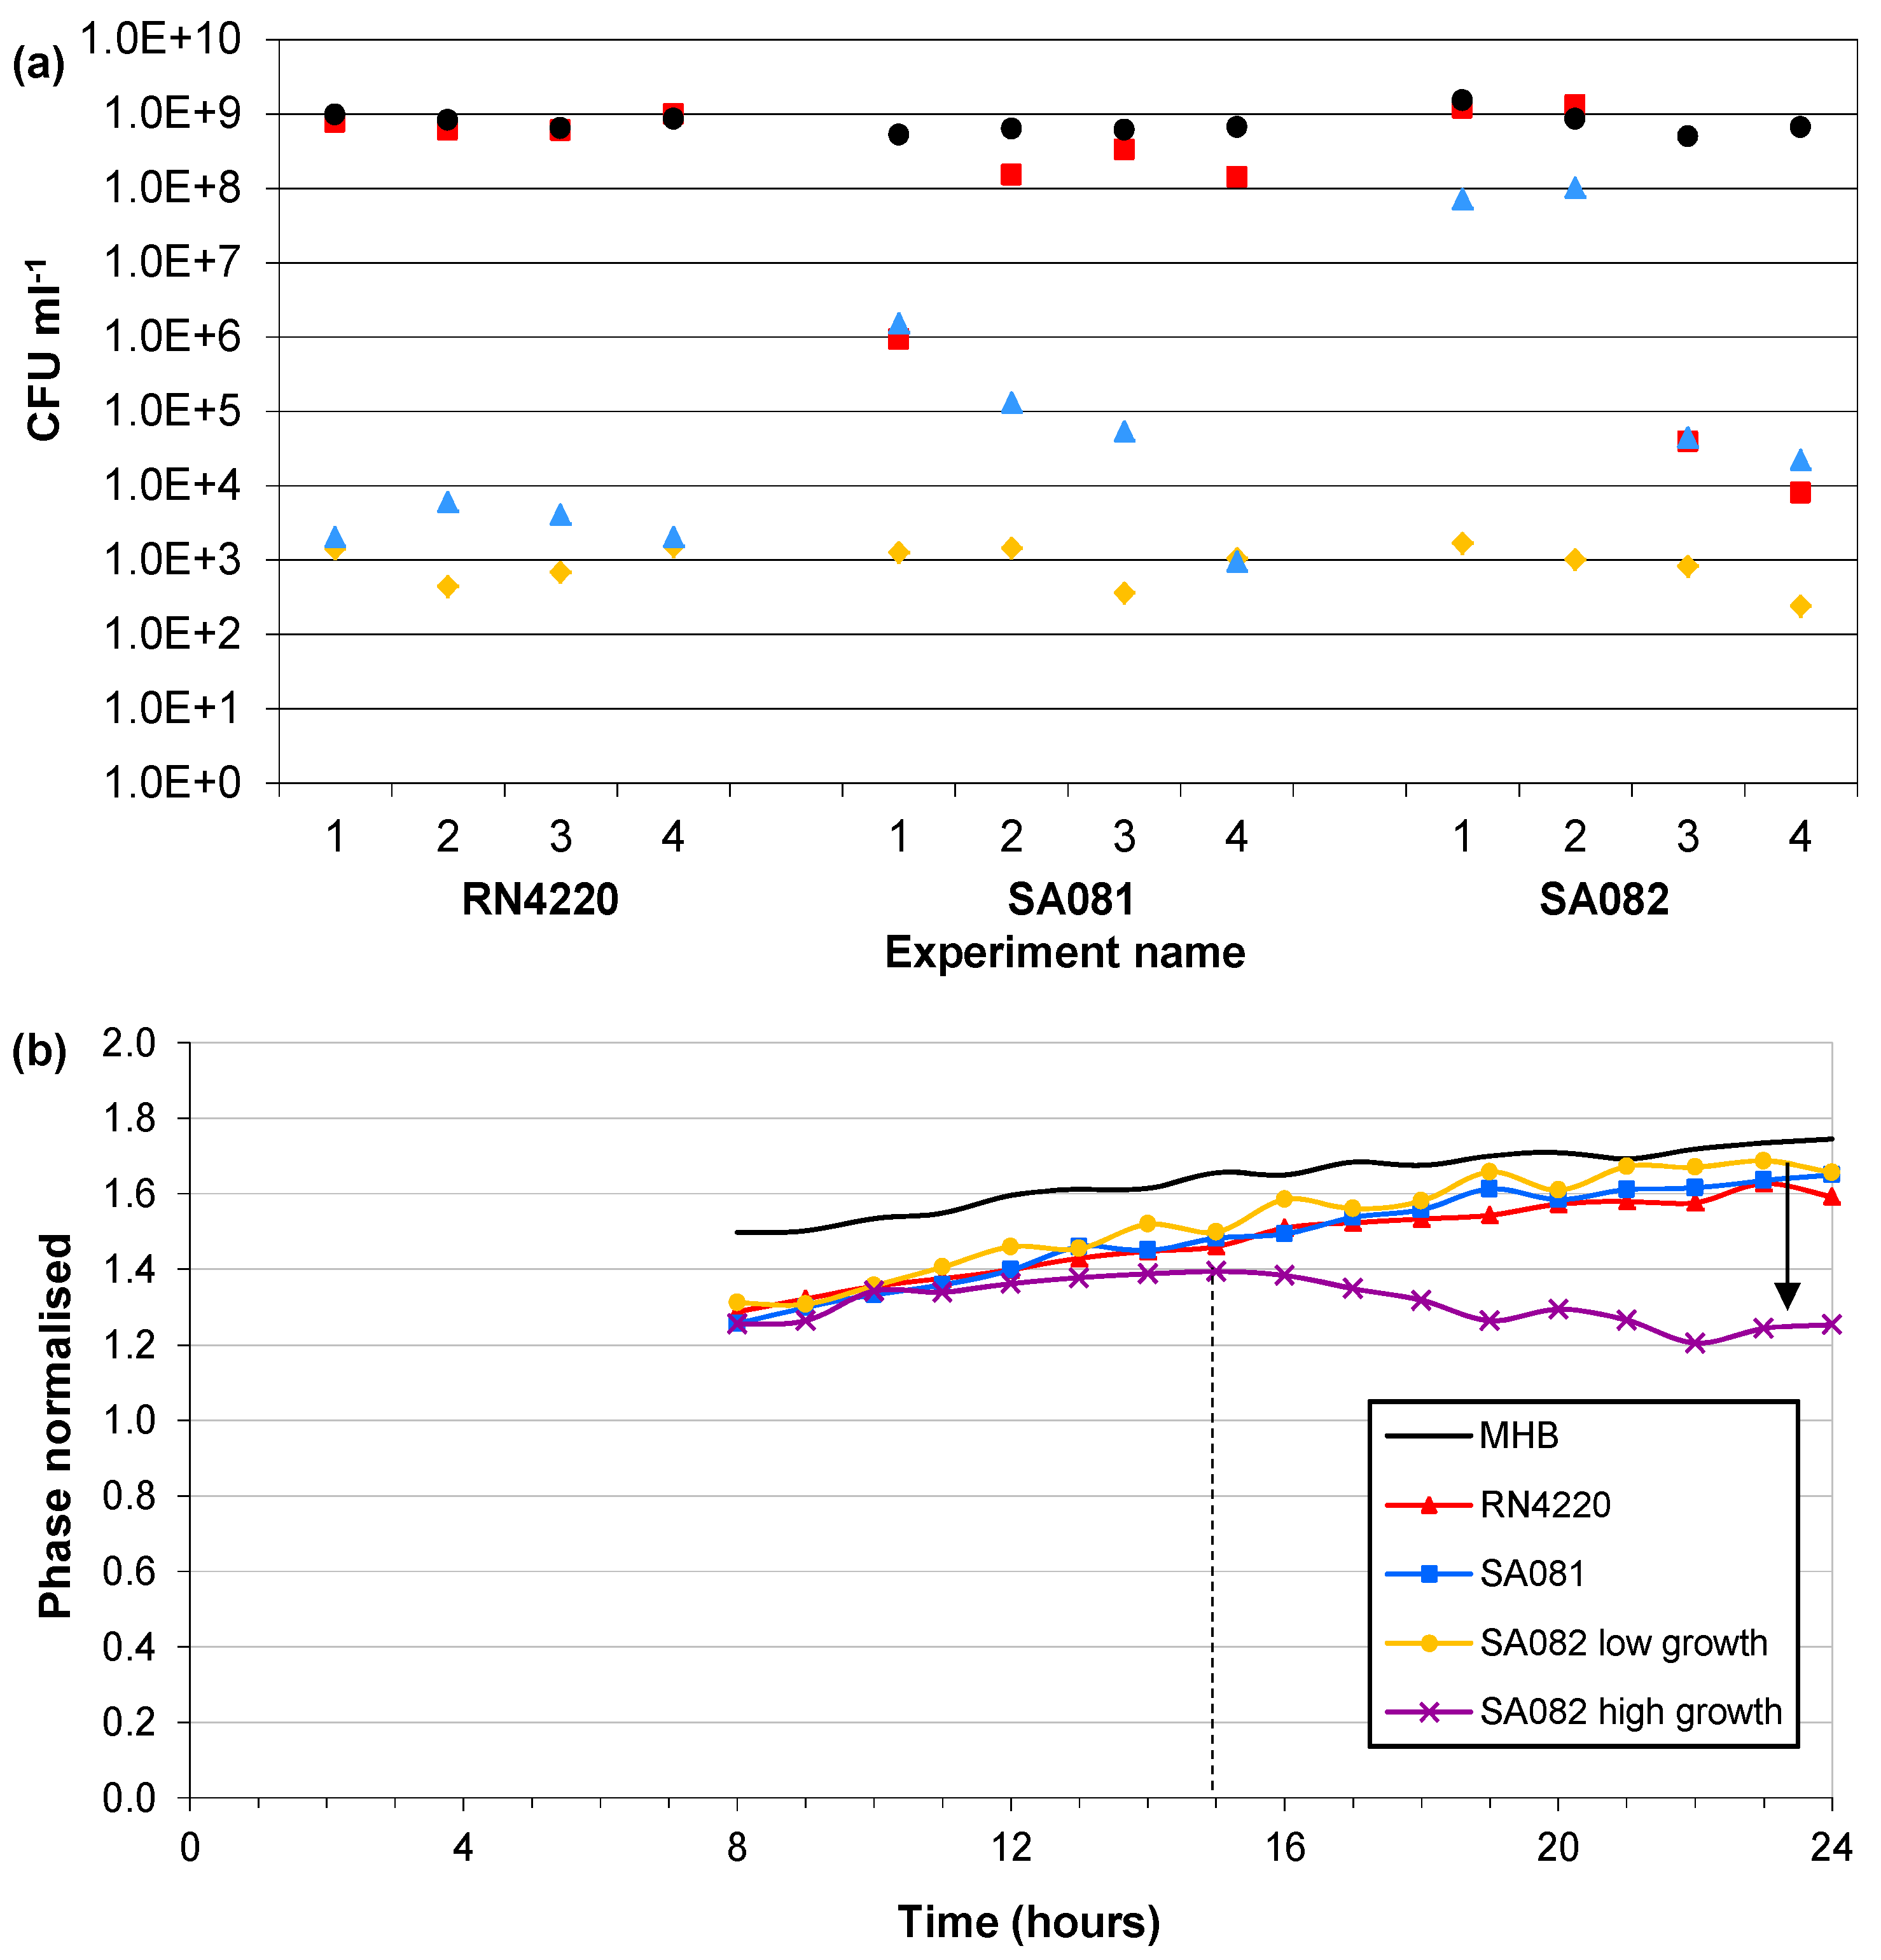
4. Discussion
4.1. Detection of Bacteria
4.2. Bacterial Growth
5. Conclusion
Acknowledgements
References
- Kingsley, A. A proactive approach to wound infection. Nurs. Stand. 2001, 15, 50–58. [Google Scholar]
- Costerton, J.W.; Post, J.C.; Ehrlich, G.D.; Hu, F.Z.; Kreft, R.; Nistico, L.; Kathju, S.; Stoodley, P.; Hall-Stoodley, L.; Maale, G.; James, G.; Stoereanos, N.; DeMeo, P. New methods for the detection of orthopedic and other biofilm infections. FEMS Immunol. Med. Microbiol. 2011, 61, 133–140. [Google Scholar]
- Bowler, P.G.; Duerden, B.I.; Armstrong, D.G. Wound microbiology and associated approaches to wound management. Clin. Microbiol. Rev. 2001, 14, 244–269. [Google Scholar]
- Rutkove, S.B. Electrical impedance myography: Background, current state, and future directions. Muscle Nerve 2009, 40, 936–946. [Google Scholar] [CrossRef]
- Rigaud, B.; Morucci, J.P.; Chauveau, N. Bioelectrical impedance techniques in medicine. 1. Bioimpedance measurement—Second section: Impedance spectrometry. Crit. Rev. Biomed. Eng. 1996, 24, 257–351. [Google Scholar]
- Cady, P. Rapid automated bacterial identification by impedance measurement. In New Approaches to the Identification of Microorganisms; Heden, C., Illeni, T., Eds.; Wiley: New York, NY, USA, 1975; pp. 73–99. [Google Scholar]
- Firstenberg-Eden, G.; Eden, G. Impedance Microbiology; Wiley: New York, NY, USA, 1984. [Google Scholar]
- Eden, G.; Eden, R. Enumeration of microorganisms by their dynamic AC conductance patterns. IEEE Trans. Biomed. Eng. 1984, 31, 193–198. [Google Scholar]
- Kell, D.B.; Davey, C.L. Conductimetric and impedimetric devices. In Biosensors: A Practical Approach; Cass, A.E., Ed.; Oxford University Press: Oxford, UK, 1990; pp. 125–154. [Google Scholar]
- Richards, J.C.S.; Jason, A.C.; Hobbs, G.; Gibson, D.M.; Christie, R.H. Electronic measurement of bacterial-growth. J. Phys. E 1978, 11, 560–568. [Google Scholar]
- Ur, A.; Brown, D.F.J. Monitoring of bacterial activity by impedance measurements. In New Approaches to the Identification of Microorganisms; Heden, C., Illeni, T., Eds.; Wiley: New York, NY, USA, 1975; pp. 63–71. [Google Scholar]
- Lazcka, O.; Del Campo, F.J.; Munoz, F.X. Pathogen detection: A perspective of traditional methods and biosensors. Biosens. Bioelectron. 2007, 22, 1205–1217. [Google Scholar]
- Weber, S.A.; Watermann, N.; Jossinet, J.; Byrne, J.A.; Chantrey, J.; Alam, S.; So, K.; Bush, J.O.; Kane, S.; McAdams, E.T. Remote wound monitoring of chronic ulcers. IEEE Trans. Inf. Technol. Biomed. 2010, 14, 371–377. [Google Scholar]
- McColl, D.; Cartlidge, B.; Connolly, P. Real time monitoring of moisture levels in wound dressings in vitro: An experimental study. Int. J. Surg. 2007, 5, 316–322. [Google Scholar] [CrossRef]
- McColl, D.; MacDougall, M.; Watret, L.; Connolly, P. Monitoring moisture without disturbing the wound dressing. Wounds UK 2009, 5, 94–99. [Google Scholar]
- Shedden, L.; Connolly, P. A System and Method for Cell Characterisation. Patent Application WO/2009/136157, May 2009. [Google Scholar]
- Lind, R.; Connolly, P.; Wilkinson, C.D.W.; Breckenridge, L.J.; Dow, J.A.T. Single cell mobility and adhesion monitoring using extracellular electrodes. Biosens. Bioelectron. 1991, 6, 359–367. [Google Scholar]
- Giaever, I.; Keese, C.R. Micromotion of mammalian-cells measured electrically. Proc. Natl. Acad. Sci. USA 1991, 88, 7896–7900. [Google Scholar]
- Rothermel, A.; Nieber, M.; Mueller, J.; Wolf, P.; Schmidt, M.; Robitzki, A. Real time measurement of PMA-induced cellular alterations by microelectrode array-based impedance spectroscopy. BioTechniques 2006, 41, 445–450. [Google Scholar]
- Whulanza, Y.; Ucciferri, N.; Domenici, C.; Vozzi, G.; Ahluwalia, A. Sensing scaffolds to monitor cellular activity using impedance measurements. Biosens. Bioelectron. 2011, 26, 3303–3308. [Google Scholar]
- Thomas, S.; Fear, M.; Humphreys, J.; Disley, L.; Waring, M. The effect of dressing on the production of exudate from venous leg ulcers. Wounds 1996, 8, 145–150. [Google Scholar]
- James, G.A.; Swogger, E.; Wolcott, R.; Pulcini, E.D.; Secor, P.; Sestrich, J.; Costerton, J.W.; Stewart, P.S. Biofilms in chronic wounds. Wound Repair Regen. 2008, 16, 37–44. [Google Scholar]
- Schierle, C.F.; de la Garza, M.; Mustoe, T.A.; Galiano, R.D. Staphylococcal biofilms impair wound healing by delaying reepithelialization in a murine cutaneous wound model. Wound Repair Regen. 2009, 17, 354–359. [Google Scholar]
- Smith, K.; Hunter, I.S. Efficacy of common hospital blocides with biofilms of multi-drug resistant clinical isolates. J. Med. Microbiol. 2008, 57, 966–973. [Google Scholar]
- Sopwith, W.; Hart, T.; Garner, P. Preventing infection from useable medical equipement: A systematic review. BMC Infect. Dis. 2002, 2, 1–10. [Google Scholar]
- Dobson, C.B.; Archibald, A.R. Effect of specific growth limitations on cell wall composition of Staphylococcus aureus H. Arch. Microbiol. 1978, 119, 295–301. [Google Scholar]
- Brown, M.R.W.; Williams, P. The influence of environment on envelope properties affecting survival of bacteria in infections. Annu. Rev. Microbiol. 1985, 39, 527–556. [Google Scholar]
- Levine, N.S.; Lindberg, R.B.; Mason, A.D.; Pruitt, B.A. The quantitative swab culture and smear: A quick, simple method for determining the number of viable aerobic bacteria on open wounds. J. Trauma 1976, 16, 89–94. [Google Scholar]
- Schultz, G.S.; Sibbald, R.G.; Falanga, V.; Ayello, E.A.; Dowsett, C.; Harding, K.; Romanelli, M.; Stacey, M.C.; Teot, L.; Vanscheidt, W. Wound bed preparation: A systematic approach to wound management. Wound Repair Regen. 2003, 11, 1–28. [Google Scholar]
- Clement, J.L.; Jarrett, P.S. Antibacterial silver. Met. Based Drugs 1994, 1, 467–482. [Google Scholar]
- Percival, S.L.; Bowler, P.G.; Russell, D. Bacterial resistance to silver in wound care. J. Hosp. Infect. 2005, 60, 1–7. [Google Scholar]
- Gupta, A.; Maynes, M.; Silver, S. Effects of halides on plasmid-mediated silver resistance in Escherichia coli. Appl. Environ. Microbiol. 1998, 64, 5042–5045. [Google Scholar]
- Silver, S. Bacterial silver resistance: Molecular biology and uses and misuses of silver compounds. FEMS Microbiol. Rev. 2003, 27, 341–353. [Google Scholar]
- Kloth, L.C. Electrical stimulation for wound healing: A review of evidence from in vitro studies, animal experiments, and clinical trials. Int. J. Low. Extrem. Wounds 2005, 4, 23–44. [Google Scholar] [CrossRef]
- Rowley, B.A. Electrical current effects on Escherichia-coli growth-rates. Exp. Biol. Med. 1972, 139, 929–934. [Google Scholar]
© 2012 by the authors; licensee MDPI, Basel, Switzerland. This article is an open access article distributed under the terms and conditions of the Creative Commons Attribution license (http://creativecommons.org/licenses/by/3.0/).
Share and Cite
Farrow, M.J.; Hunter, I.S.; Connolly, P. Developing a Real Time Sensing System to Monitor Bacteria in Wound Dressings. Biosensors 2012, 2, 171-188. https://doi.org/10.3390/bios2020171
Farrow MJ, Hunter IS, Connolly P. Developing a Real Time Sensing System to Monitor Bacteria in Wound Dressings. Biosensors. 2012; 2(2):171-188. https://doi.org/10.3390/bios2020171
Chicago/Turabian StyleFarrow, Malcolm J., Iain S. Hunter, and Patricia Connolly. 2012. "Developing a Real Time Sensing System to Monitor Bacteria in Wound Dressings" Biosensors 2, no. 2: 171-188. https://doi.org/10.3390/bios2020171
APA StyleFarrow, M. J., Hunter, I. S., & Connolly, P. (2012). Developing a Real Time Sensing System to Monitor Bacteria in Wound Dressings. Biosensors, 2(2), 171-188. https://doi.org/10.3390/bios2020171