Effect of Graphene Oxide Synthesis Method on Properties and Performance of Polysulfone-Graphene Oxide Mixed Matrix Membranes


1
Division of Sustainable Development, College of Science and Engineering, Hamad Bin Khalifa University, Qatar Foundation, PO Box 34110, Doha, Qatar
2
Chemical Engineering, Texas A&M University at Qatar, Education City, PO Box 23874, Doha, Qatar
*
Authors to whom correspondence should be addressed.
Nanomaterials 2019, 9(5), 769; https://doi.org/10.3390/nano9050769
Submission received: 7 May 2019
/
Revised: 13 May 2019
/
Accepted: 15 May 2019
/
Published: 19 May 2019
Abstract
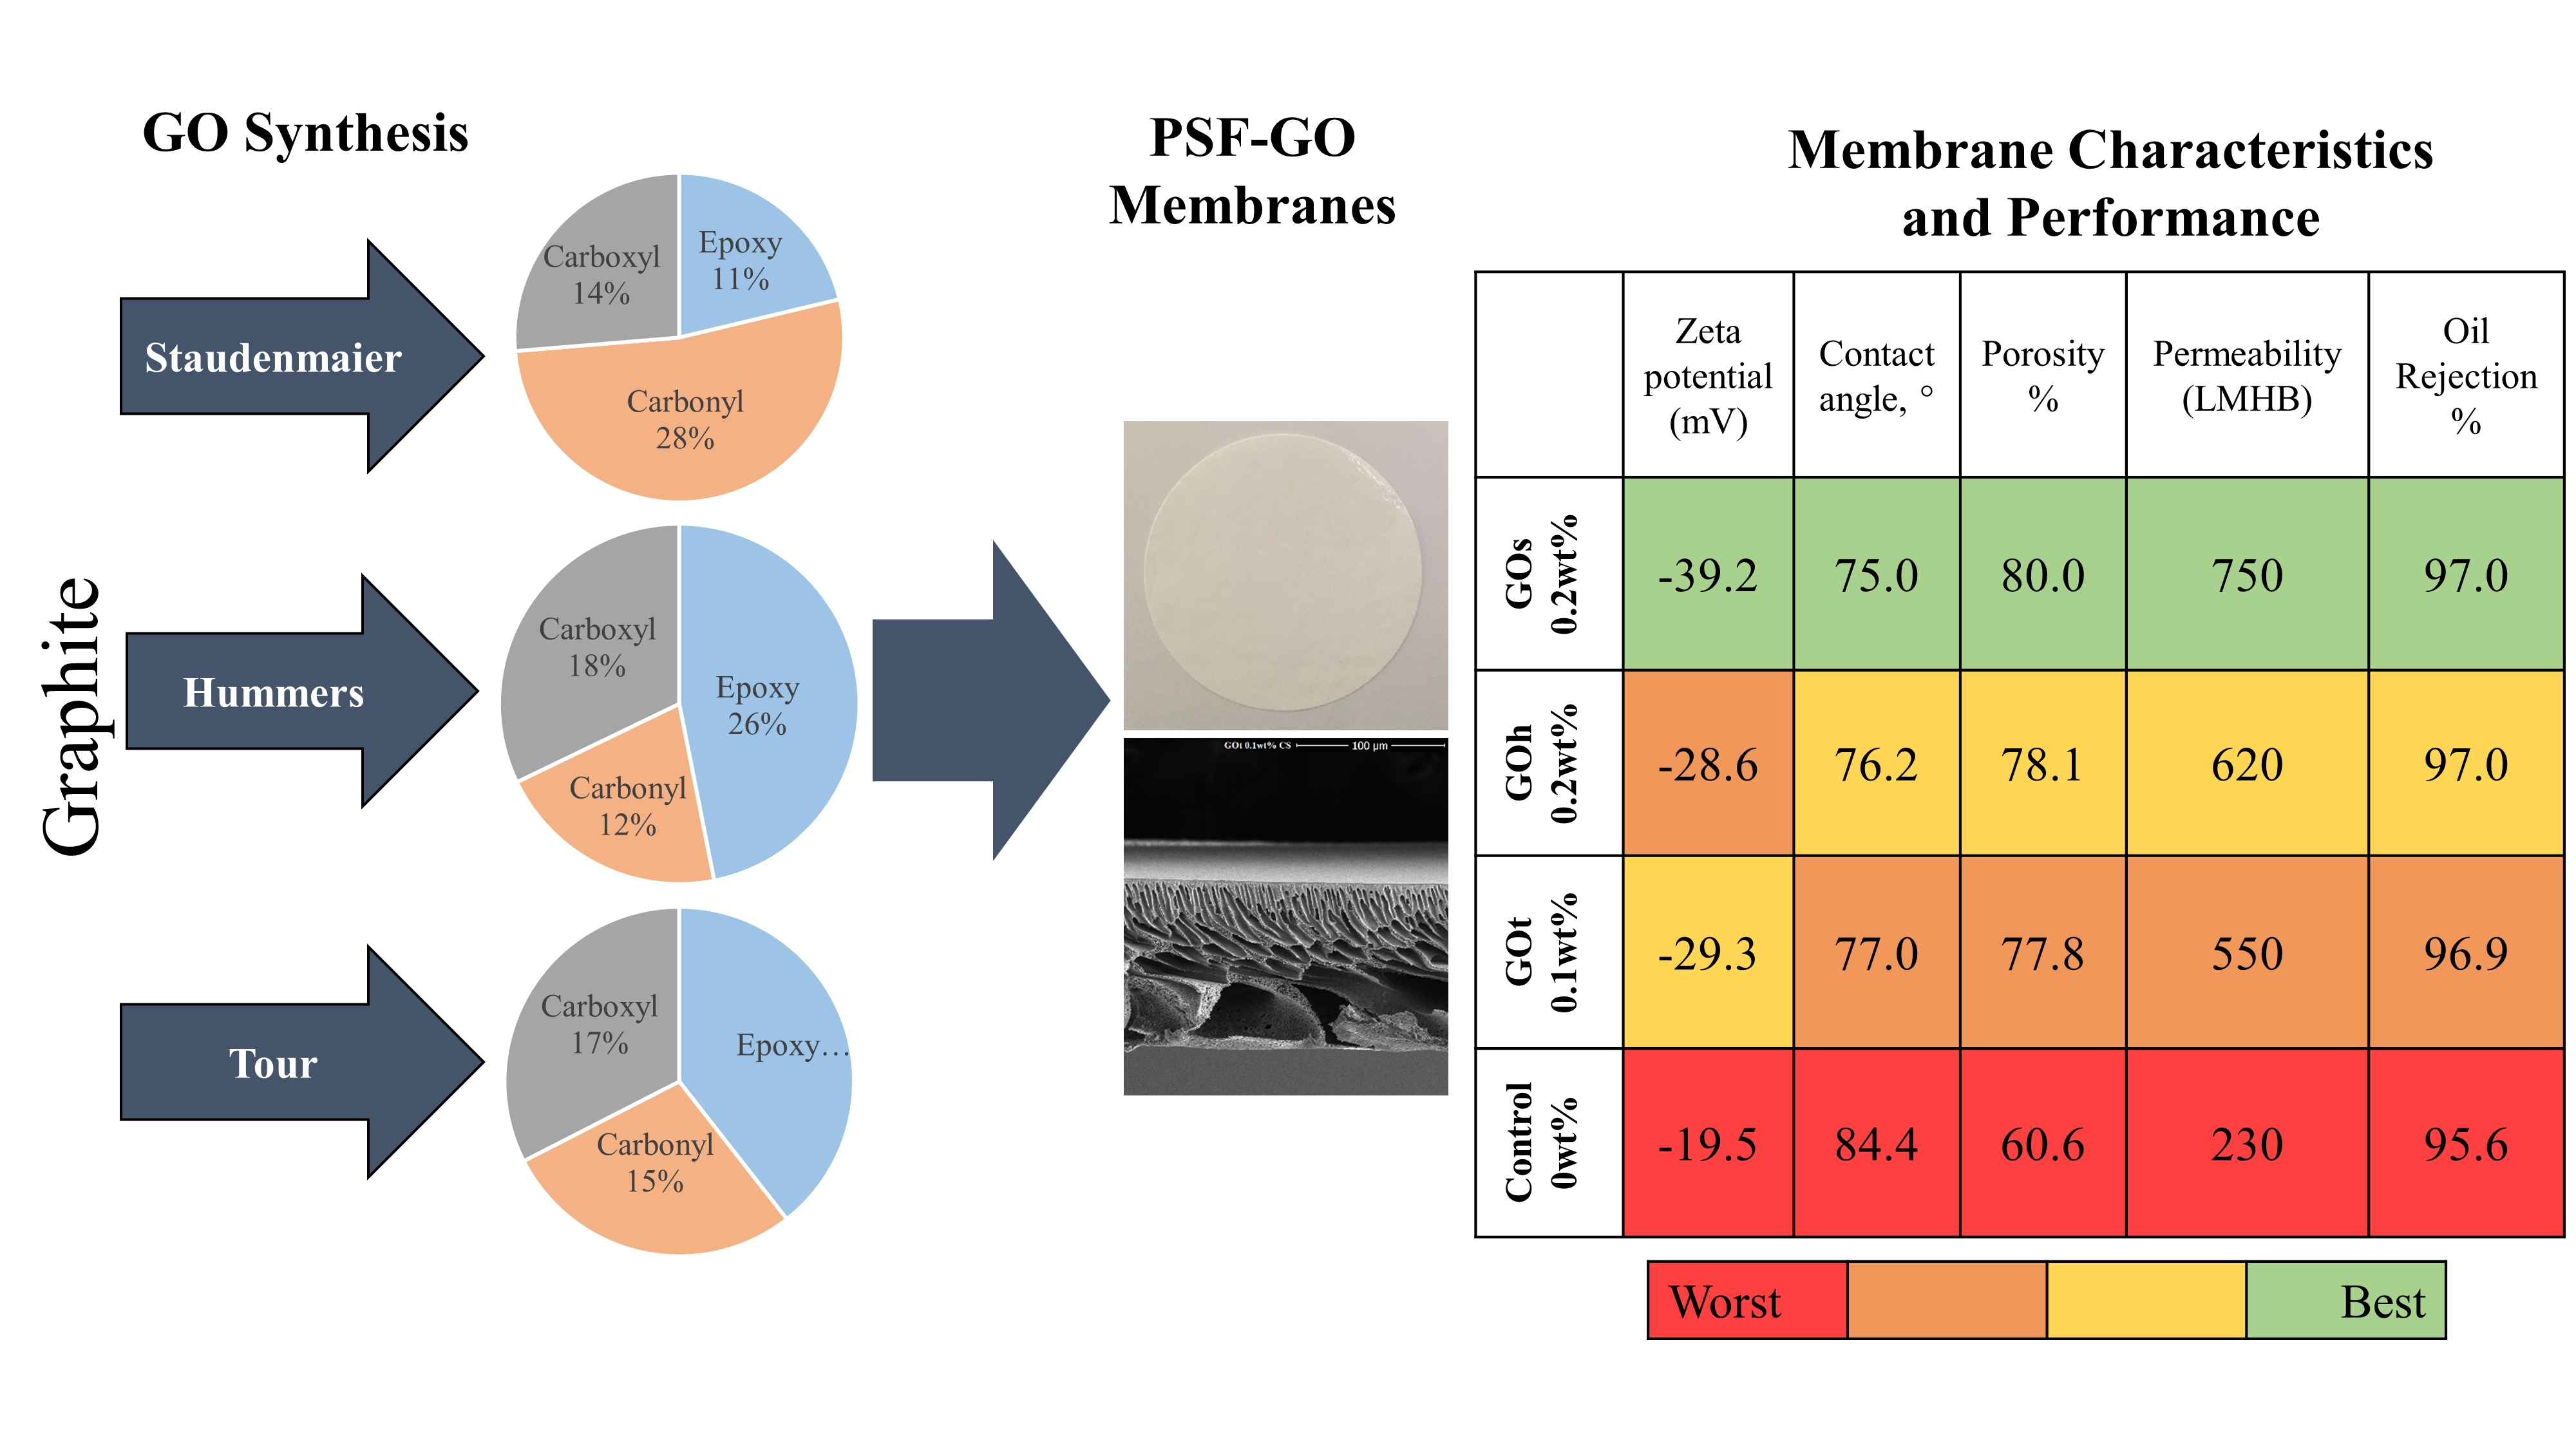
:Graphene oxide (GO) has shown great promise as a nanofiller to enhance the performance of mixed matrix composite membranes (MMMs) for water treatment applications. However, GO can be prepared by various synthesis routes, leading to different concentrations of the attached oxygen functional groups. In this research, GO produced by the Hummers’, Tour, and Staudenmaier methods were characterized and embedded at various fractions into the matrix of polysulfone (PSf) and used to prepare microfiltration membranes via the phase inversion process. The effects of the GO preparation method and loading on the membrane characteristics, as well as performance for oil removal from an oil-water emulsion, are analyzed. Our results reveal that GO prepared by the Staudenmaier method has a higher concentration of the more polar carbonyl group, increasing the membrane hydrophilicity and porosity compared to GO prepared by the Hummers’ and Tour methods. On the other hand, the Hummers’ and Tour methods produce GO with larger sheet size, and are more effective in enhancing the mechanical properties of the PSf membrane. Finally, all MMMs exhibited improved water flux (up to 2.7 times) and oil rejection, than those for the control PSf sample, with the optimum GO loading ranged between 0.1–0.2 wt%.

1. Introduction
Increased water scarcity is becoming more imminent, due to factors such as growing population, urbanization, industrialization and agriculture, as well as impacts of global climate change. Recent surveys conducted by the United Nations Educational, Scientific and Cultural Organization (UNESCO) estimate that 1.8 billion of the population will lack access to fresh water by 2025 [1]. Other studies conducted by the United Nations (UN) estimate that the yearly global water demand will increase by 20–30% by 2050 [2]. To manage these challenges, membrane-based water treatment solutions have been promoted as an environmentally-friendly, low-cost technology for the filtration and purification of non-potable water resources.
Polymeric membranes are the most prevalent membranes in the water treatment and filtration industry due to their flexibility, light weight, low energy requirements, high rejection in comparison to inorganic membranes and low cost of production [3,4]. However, polymeric membranes suffer from fouling, leading to a decline in performance over time, and subject to a trade-off between permeability and selectivity [5]. Membrane modification is one solution to overcome the disadvantages of polymeric membranes.
In mixed matrix membranes (MMMs), this can be achieved through the introduction and dispersion of nanoparticles into the membrane matrix to enhance their properties and performance. MMMs are asymmetric composite membranes made of an organic polymer and inorganic filler [6]. MMMs retain the lower cost and ease of fabrication of the polymeric membrane, but offer enhanced performance [7]. The high separation efficiency, low cost and ease of synthesis provided by the polymers are synergistically enhanced mechanically and chemically from properties attributed to the nanofillers [8], leading to an improved membrane hydrophilicity [9], modified surface structure [10], increased mechanical strength and enhanced anti-fouling properties [4]. Due to the benefits of MMMs, they are more prevalent in the market than their thin film composite counterparts, except for niche applications [11].
Several inorganic nanomaterials have been tested as nanofillers for membranes, such as silver [12] and titanium oxide [13], owing to their small nanoparticle size and anti-bacterial properties. The use of carbon nanomaterials such as graphene and carbon nanotubes (CNT) [14] have also been explored. All these experiments have provided promising enhancements to the properties and performance of the membranes. However, the production of metal, pure graphene and CNT doped membranes is costly [15]. A number of lower cost graphene-like nanomaterials exist, such as graphene oxide (GO) and reduced graphene oxide (rGO). These graphene-based materials share some similar and enhanced properties with graphene, and can be used as a substitute.
GO in particular is a more cost-effective option compared to other carbon-based materials, due the simplicity and timesaving attributes of its synthesis methods, especially for large-scale commercial applications [16]. GO has a combination of advantageous properties, such as a high lateral dimension-to-thickness ratio, an amphiphilic nature owing to its numerous surface functional groups, chemical inertness and exceptional mechanical properties [9,10]. This has led to GO being used in membrane applications, including both gas and water separation [5]. When embedded into MMM, GO increases the hydrophilicity of the membranes, as well as the water flux. Moreover, higher rejection of dyes, oil and salt have been achieved using MMMs containing GO, due to the presence of acidic functional groups that induce negative charge on the membrane surface [10]. GO is also known to have an amphiphilic nature, where water molecules are absorbed onto the hydrophilic sites, and then diffuse onto the hydrophobic carbon sites, resulting in water channels [17]. As such, GO has received significant attention as a nanofiller in MMMs, and has demonstrated promising results in a number of studies [9,18,19].
GO is synthesized from graphite in two steps. In the first, graphite flakes are oxidized to graphite oxide, leading to the introduction of oxygen-containing functional groups, such as epoxy (C–O–C), hydroxyl (OH), carbonyl (C=O) and carboxyl (R–COOH) groups into the basal plane and the edges of graphene oxide sheets [11,16]. In the second step, the produced graphite oxide is readily exfoliated in water assisted by sonication or shearing to produce GO suspension [20]. Various methods are used to prepare graphite oxide from graphite by varying the oxidizing agents and intercalants employed, producing GO with varied characteristics and structural properties. The Brodie method, that was developed in 1859, is the first method to produce graphite oxide by adding KClO3 to a mixture of graphite and fuming HNO3 [21]. Later, the Staudenmaier method was developed based on the Brodie method, where a mixture of H2SO4 and HNO3 is used as the intercalant, producing graphite oxide with a higher C/O ratio. However, these two methods rely on a lengthy oxidation step that takes up to one week. Today, the most widespread GO synthesis method is the Hummers’ method, developed in 1958 [22]. In this method, H2SO4 is used as the intercalant and NaNO3/KMnO4 as the oxidizing agents and the oxidation step is completed within 2 h. However, the Hummers’ method has been criticized because of the release of toxic gases such as NOx and ClO2 into the environment. More recently, an improved Hummers’ method was developed by Tour by eliminating NaNO3, and using a 9/1 mixture of H3PO4 and H2SO4. The Tour method does not only eliminate the production of toxic gases, but also produces a more oxidized graphite oxide with a more regular carbon framework and larger sheet size [16].
A number of researchers have evaluated the impacts of GO prepared via Hummers’ or modified-Hummers’ (removing or replacing NaNO3) on polymeric membranes, as they are the fastest methods to produce GO [10,18,23]. However, the impact of other GO synthesis methods on the performance and properties of MMM has not been systematically evaluated. Each of the synthesis methods is distinct in the chemicals and conditions used for the oxidation process, resulting in differences in the degree of oxidation and the ratio of the different functional groups present, thereby impacting the GO overall properties. Therefore, this paper investigates the influence of various GO fabrication methods (Staudenmaier, Hummers’ and Tour) on the properties and performance of polysulfone MMMs. In addition, the study investigates the role of GO concentration in the MMM to find whether interactions exist between synthesis method and optimum GO loading.
2. Materials and Methods
2.1. Materials
Polysulfone (PSf), with an average molecular weight of 35,000 mol, polyvinylpyrrolidone (PVP), with an average molecular weight of 55,000 mol, and N-Dimethylacetamide (DMAc), were all purchased from Sigma Aldrich, St. Louis, MO, USA. PSf was chosen due to its chemical stability and mechanical properties, as well as its ability to withstand higher temperatures compared to other polymers [9]. GOH (a specific form of graphene oxide (GO)) was prepared by the Hummers’ method [22] and was purchased from Sixth Element Materials Technology, Changzhou, China. GOS was prepared following the Staudenmaier method [24], and GOT was prepared by following the Tour method [25] using 45 μm natural graphite flakes kindly supplied by Asbury Carbons, Asbury, NJ, USA. Diesel was obtained from a local petrol station (Woqod) in Doha, Qatar, and was used to prepare the oily-water emulsion of 100 ppm to test the selectivity of membranes.
2.2. GO Preparation
GOS was prepared by following the Staudenmaier method [24] where 1 g of 45 µm natural flake graphite (Asbury Graphite) was mixed with 27 mL of an ice-cooled 2:1 H2SO4:HNO3 mixture. The reaction’s temperature was maintained below 35 °C by slowly adding 11 g of KClO3. After 96 h, 800 mL of UP water was added to the solution while stirring, and was filtered using 0.45 µm nylon membrane. The precipitate of GO was repeatedly washed with 5% HCl solution, first to remove sulfate ions, which were detected using the BaCl2 test, and then washed repeatedly with UP water to remove chloride ions, which were detected used the AgNO3 test.
GOT was prepared via the Tour method [25], which consists of adding 1 g of 45 µm natural flake graphite (Asbury Graphite) to a mixture of 9:1 of H2SO4:H3PO4 mixture for 3 min while stirring. Then, 5 g of KMnO4 was added to the solution. The reaction’s temperature was maintained at 20 °C for three days. The mixture was centrifuged at 5000 rpm for 30 min and then spent sulfuric acid was decanted. The last step consisted of washing the graphite oxide particles with UP water six times, and centrifuging it at 5000 rpm for 60 min.
2.3. GO Characterization
The structure and composition of the three GO samples were analyzed by X-ray powder diffraction (XRD) (D8 Advance, Bruker, Billerica, MA, USA) using CuKα radiation. The intensity graphs displayed were used to evaluate the interlayer distance by solving Bragg’s Law [21]. X-ray photoelectron spectroscopy (XPS) (Escalab 250 Xi, Thermo Fisher Scientific, Waltham, MA, USA) was used to analyze functional group composition with a pass energy of 20 eV for narrow scans and 100 eV for surveys.
2.4. Membrane Fabrication
The PSf/GO ultrafiltration mixed matrix composite membranes (MMMs) were prepared via the phase inversion method [26]. Required amounts of GO corresponding to loadings of 0, 0.05, 0.1, 0.2, 0.4 and 0.8 wt% relative to PSf were dispersed by sonication in the DMAc for 5 min under 2 s on, 3 s off, pulsing. Then, solutions of 15% PSf, 5% PVP, and 80% N-DMAc/GO were prepared by stirring overnight. The PSf/GO-nanocomposite solution was first degassed for 10 min in a sonication bath (Ultrasonic cleaner, Cole-Parmer, Vernon Hills, IL, USA), and a 200 µm film was cast on a glass plate using a membrane casting machine (Porometer MEMCAST, Convergence, Enschede, The Netherlands). After 30 s, the glass plate was immersed in a room temperature coagulation bath containing ultrapure (UP) water for 5 min. The coagulated membrane film was then stored in UP water with a daily change of the water for at least three days before testing. For membrane testing and characterization, the membrane film was cut into 47 mm disks and 5 mm wide rectangles using die cutters.
2.5. Membrane Characterization
The membrane hydrophilicity was analyzed by measuring the contact angle in a drop shape analyzer (DSA25, Kruss, Hamburg, Germany) following the sessile drop method and Young’s Laplace calculations. Each prepared membrane was tested three times, and the first eight values of each experiment were averaged for the contact angle measurement. The membranes’ surface charge was analyzed at pH 5.2 using a zeta potential analyzer (SurPASS™ 3, Anton Paar, Graz, Austria). Atomic force microscopy (AFM) (Dimension Icon, Bruker, Billerica, MA, USA) was used to obtain images of the membrane surface, as well as morphological features at three surface areas with square dimensions of 2, 10 and 25 µm. The membrane surface and cross-sectional morphologies were imaged using scanning electron microscopy (SEM) (FEI Quanta 400 SEM, Thermo Fisher Scientific, Waltham, MA, USA), operated at a pressure of 10 Pa with an acceleration voltage of 5 kV. For imaging of the cross-section, thin strips of the membrane were fractured by wetting in water and immersing in liquid nitrogen prior to air-drying the strips and placing them on an SEM stub for gold sputtering. The mechanical behavior of the membranes was evaluated via uni-direction tensile testing using dynamic mechanical analysis (DMA) (DMA Q800, TA Instruments, New Castle, DE, USA). Specimens with dimensions of 5 × 30 cm (W × L) were tested at 25 °C and constant speed of 500 µm/min until breakage. The membrane porosity was determined using the gravimetric method from the relation:
where p is porosity, m1 and m2 are weight of the membrane in the dry and wet state (kg), respectively, A is the membrane area (m2), is the membrane thickness (m) and is water density (998 kg/m3). All membrane characterization experiments were repeated on three different membrane areas with the exception of AFM and SEM, which were conducted on a single section.
2.6. Membrane Testing: Flux and Oil Rejection
The membrane performance was evaluated by measuring the flux of UP water and 100 ppm oil-emulsion using a dead-end cell (Sterlitech HP4750, Kent, WA, USA) at a trans-membrane pressure of 2 bar. The water and emulsion fluxes (J) in L m−2 h−1 (LMH) were calculated as follows:
where V is the volume of permeated water (mL), t is time (min), and A is the active membrane surface area (14.6 cm2). The oil concentration of the feed, permeate and reject solution was measured using total organic carbon (TOC) in a TOC analyzer (TOC-L, Shimadzu, Kyoto, Japan) for the oil samples before and after permeation by the following equation:
where R is the oil rejection and C0 and CP are the feed and permeate concentrations (ppm).
3. Results and Discussion
3.1. GO Characterization
To probe the extent of oxidation and changes in GO structure due to the differences in oxidation conditions, XRD was used to evaluate the interlayer distance between GO particles as well as the crystal structure. Based on the results summarized in Table 1, all three samples show a sharp intense peak corresponding to the 002 plane at 2θ between 9.7° and 11.5° and disappearance of the graphite 002 peak (2θ = 26.5°), indicating complete oxidation of all the graphite layers leading to the increase in the d-spacing. The interlayer spacing estimated using Bragg’s law reveals that the d-spacing of the GOT, GOH and GOS samples is 9.1, 8.7 and 7.7 nm, respectively. These results are consistent with previously reported values [27]. The d-spacing depends on the amount of strongly adsorbed water in the hydrophilic zones of the GO, and therefore increases with the decrease in C/O ratio.
The XPS survey spectrum of the three GO samples confirms that GO is composed mainly of carbon and oxygen, with negligible concentrations of nitrogen that is introduced during the preparation of the GO particles. The deconvolution of the high resolution C1s indicates the presence of sp2 carbon (C–C/C=C, 284.8 eV), epoxy (C–O, 286.7 eV), carbonyl (C=O, 288.3 eV), and carboxyl (O–C=O, 289.6 eV) groups. The deconvolution of the O1s spectrum confirms the presence of the C=O (532.8 eV) and C–O (534.4 eV) groups. The results of the elemental analysis and C/O ratio are provided in Table 1, and the XPS survey and high-resolution scans are available in the Supporting Information Figures S1–S3. Based on XPS analysis, the differences among the three GO samples can be summarized as follows:
- GOH has the highest oxygen content and GOS has the lowest oxygen content.
- The carbonyl (C=O) is the dominant oxygen groups in GOS with a content of 28.1%, which is twice or more the carbonyl content of GOH and GOT.
- Epoxy is the dominant oxygen groups in GOH (25%) and GOT (21%) compared to 11.5% for GOS.
The characterization results obtained through XRD and XPS experiments confirmed that the preparation method of GO influences the composition of functional groups. GOH and GOT are prepared using the same oxidizing agent (KMnO4), resulting in similar elemental composition and functional groups in comparison to GOS, which was prepared by the addition of KClO3, and resulted in a significantly lower C/O ratio, and different fractions of the oxygen functional groups [29]. Therefore, it can be concluded that the Hummers’ and Tour preparation methods are more efficient at introducing oxygen groups into the graphite structure due to the use of KMnO4 as an oxidant.
Studies have shown that the different synthesis methods result in varying GO sheet sizes, with GOS typically having the smallest sheet size, and GOT the largest. The smaller size of the GOS was confirmed by McAllister et al., who used identical synthesis conditions and graphite flakes to this study. They found GOS particles had dimensions of less than 10 µm, independent of the size of the starting graphite flakes [30]. The average particle size for the GOH was reported to be ranging between 13–14 µm, irrespective of oxidation length under typical preparation conditions [31]. Pan and Moghaddam similarly achieved a particle size of 15.8 μm, which was reduced to 10.4 μm with 10 min of sonication [32]. The same authors showed the Tour method using graphite to KMnO4 ratios of 1:6 and 1:4 (comparable to the 1:5 used in this study) produced GOT with particles of 33.8 and 55.7 μm, respectively.
3.2. Membrane Characterization
3.2.1. Membrane Hydrophilicity and Surface Charges
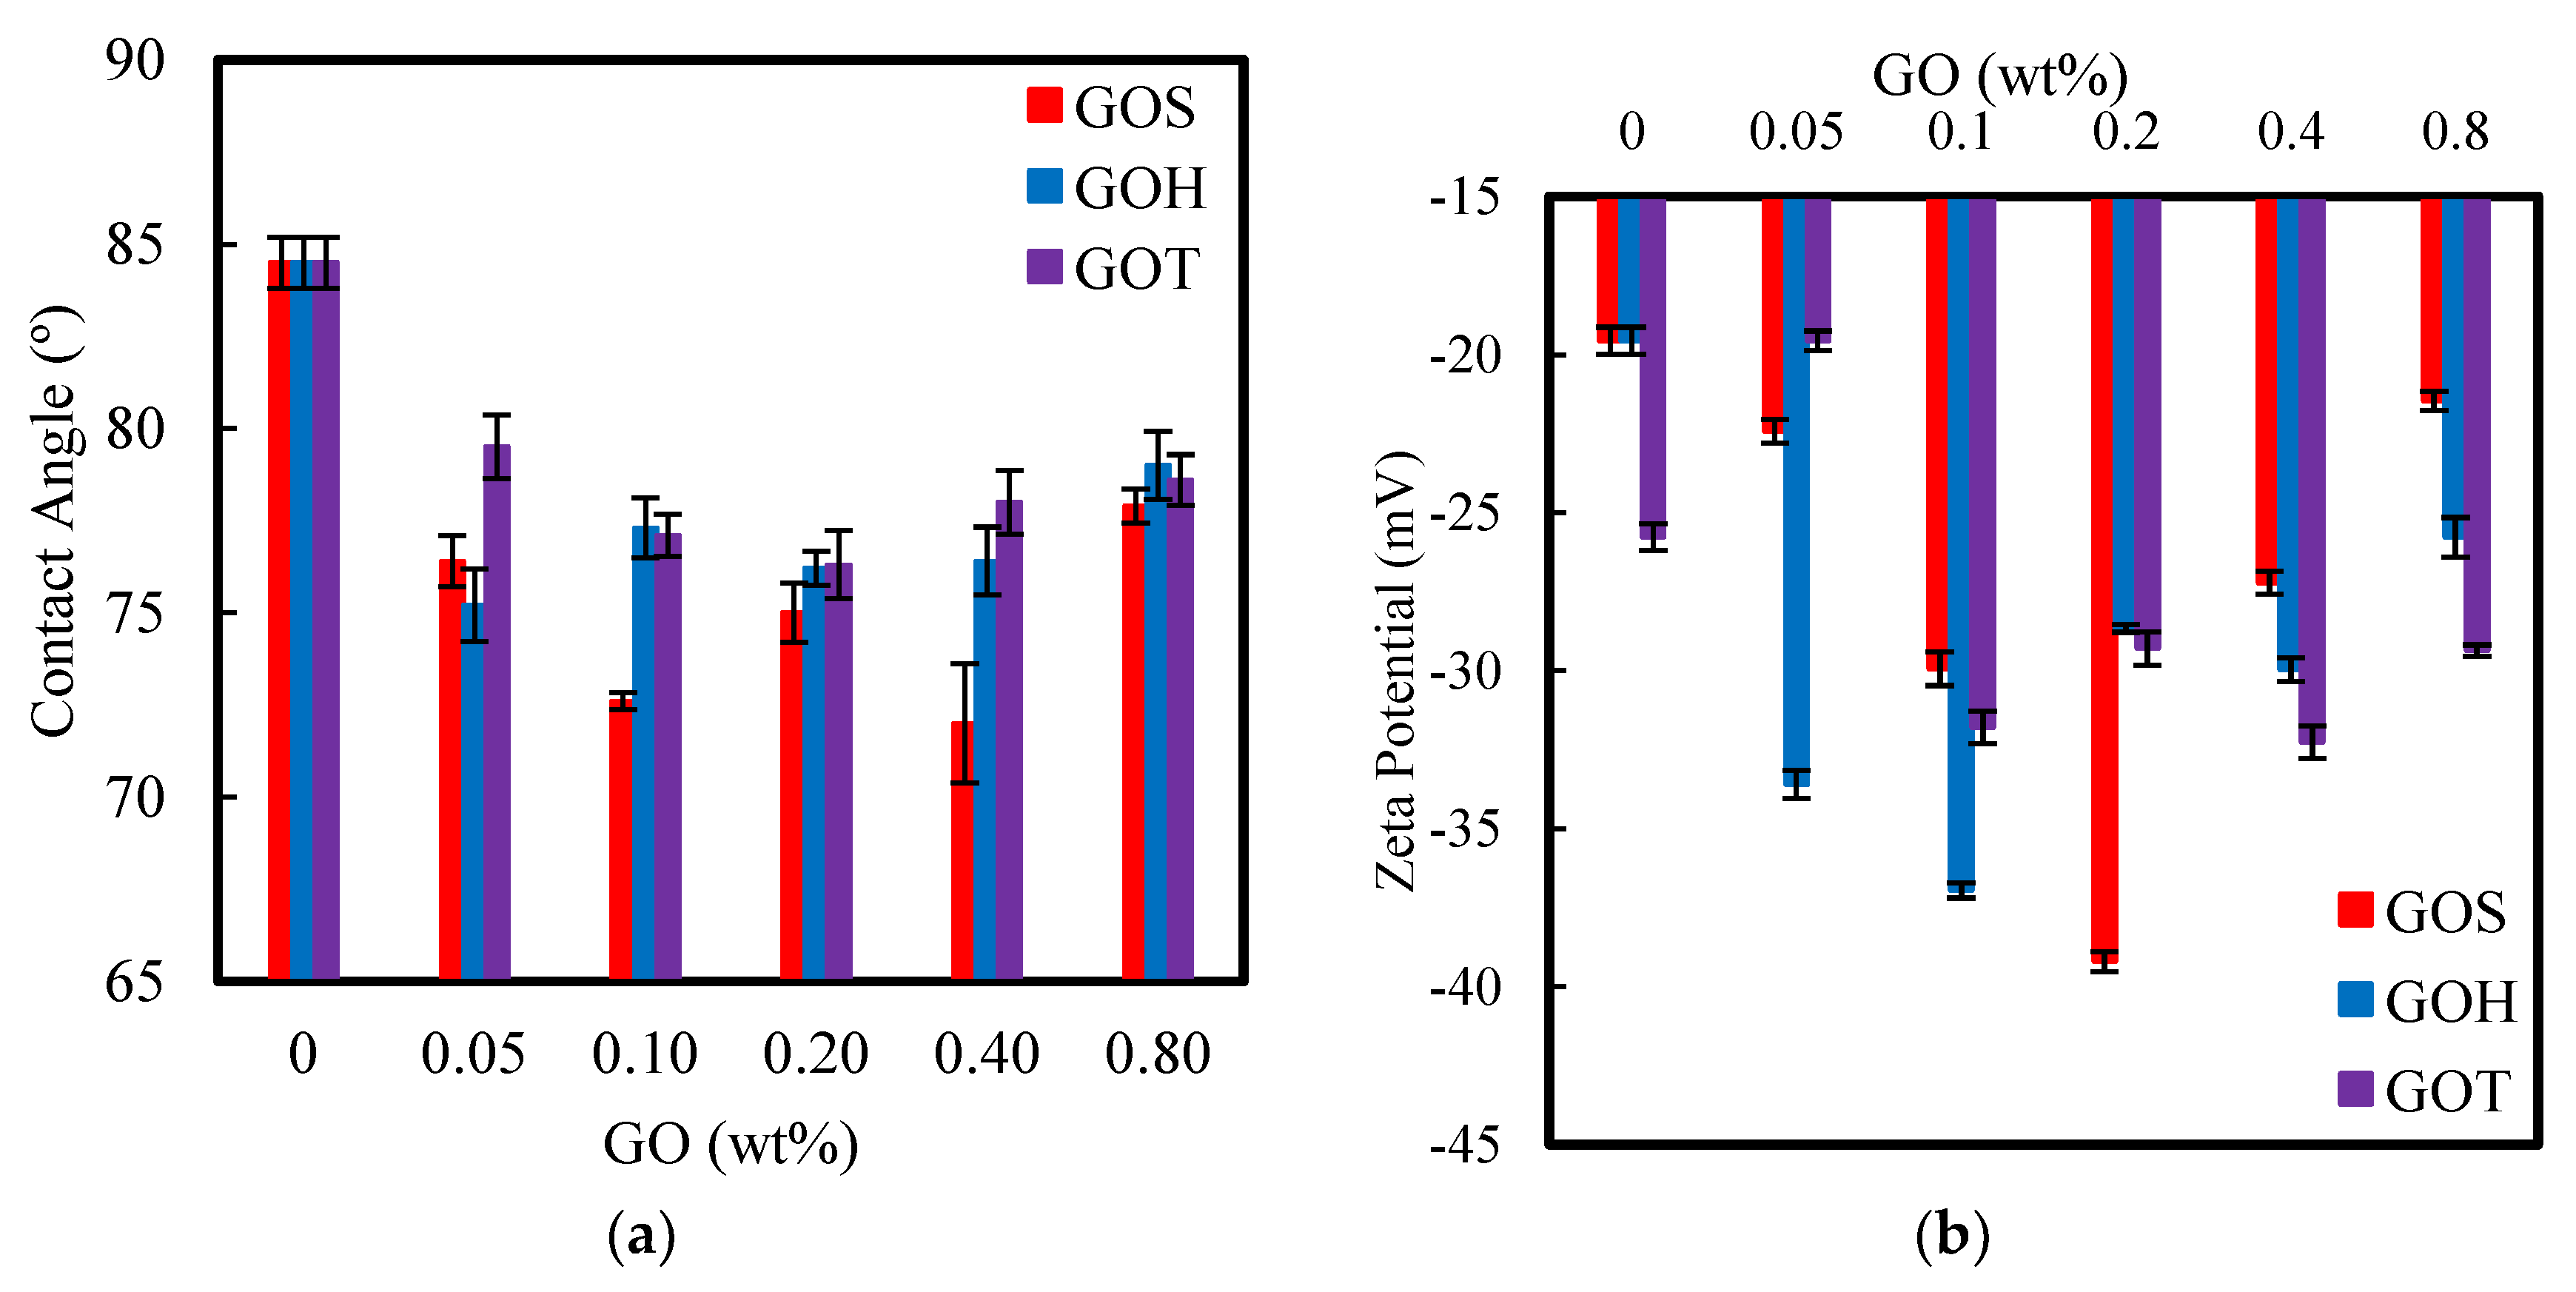
Membrane hydrophilicity is a key parameter, that impacts not only the membrane performance in terms of flux and rejection, but also the membrane antifouling characteristics. Hydrophilicity of the membranes was evaluated by water contact angle measurements. Regardless of the synthesis method, GO increased the hydrophilicity (lower contact angle) of the PSf membrane, as shown in Figure 1. Moreover, the three membrane sets show similar patterns where the contact angle decreases as the GO loading increases until reaching a minimum, and then increases as the loading increases further.
The membrane modified with GOS shows the highest hydrophilicity (lowest contact angle of 72°) at 0.4 wt% GO. In all cases, the hydrophilicity showed only minor changes under different GO loading, but all samples yielded significantly higher hydrophilicity than the control membrane. The affinity of the GO nanoparticles and their functional groups with water molecules contributes significantly to the enhanced hydrophilicity. Moreover, these results are further explained by the possible diffusion of GO sheets to the membrane surface during the casting process [23]. The proximity of hydrophilic GO sheets to the surface enhances the ability of the membranes to interact with water molecules making them more hydrophilic.
The small difference in contact angle among the different membrane sets is attributed to the presence of different oxygen functional groups on the surface of GO prepared by different methods. For instance, the carbonyl groups are usually located at the GO edges, and edge-situated functional groups are known to contribute more strongly to hydrophilicity than those situated on the basal plane [33]. Epoxy groups in contrast, are known for their hydrophobicity [34]. Interestingly, GOS modified membranes have the highest hydrophilicity, even though the oxygen content of GOS is the lowest among the GO samples. However, GOS had the highest percentage of carboxyl plus carbonyl groups (42.2%), while the carboxyl and carbonyl content in GOH and GOT were only 29.9% and 32.2%, respectively.
The zeta potential measures the surface charge of membranes, which, in turn, can indicate their rejection performance. A high negative surface charge reveals that the electrostatic repulsion between the membrane surface and the negatively charged ions is high, and therefore, their chance of being removed from water increases. The negative zeta potential value is linked to the presence of oxygenated functional groups (carbonyl, hydroxyl, carboxyl and epoxy groups) on the surface of the membrane [23]. The addition of GO into the membranes’ matrix impacted the surface charge of the membrane significantly. As summarized in Figure 1, the zeta potential values of the modified membranes became more negative compared to the control membrane, implying that they have the ability to reject more ions than the control membrane. In concordance with the contact angle results, the GOS set displayed the most negative surface charge with a decrease up to −39.2 mV for the 0.2 wt% membrane. A similar pattern was followed by the other two GO sets. At higher GO loadings, the zeta potential increases towards zero, possibly due to the agglomeration of GO sheets. The aggregation of the nanoparticles can take place during the casting of the membranes because of the strong van der Waals interactions between particles and the functional group dominance [12].
3.2.2. Membrane Surface Structure
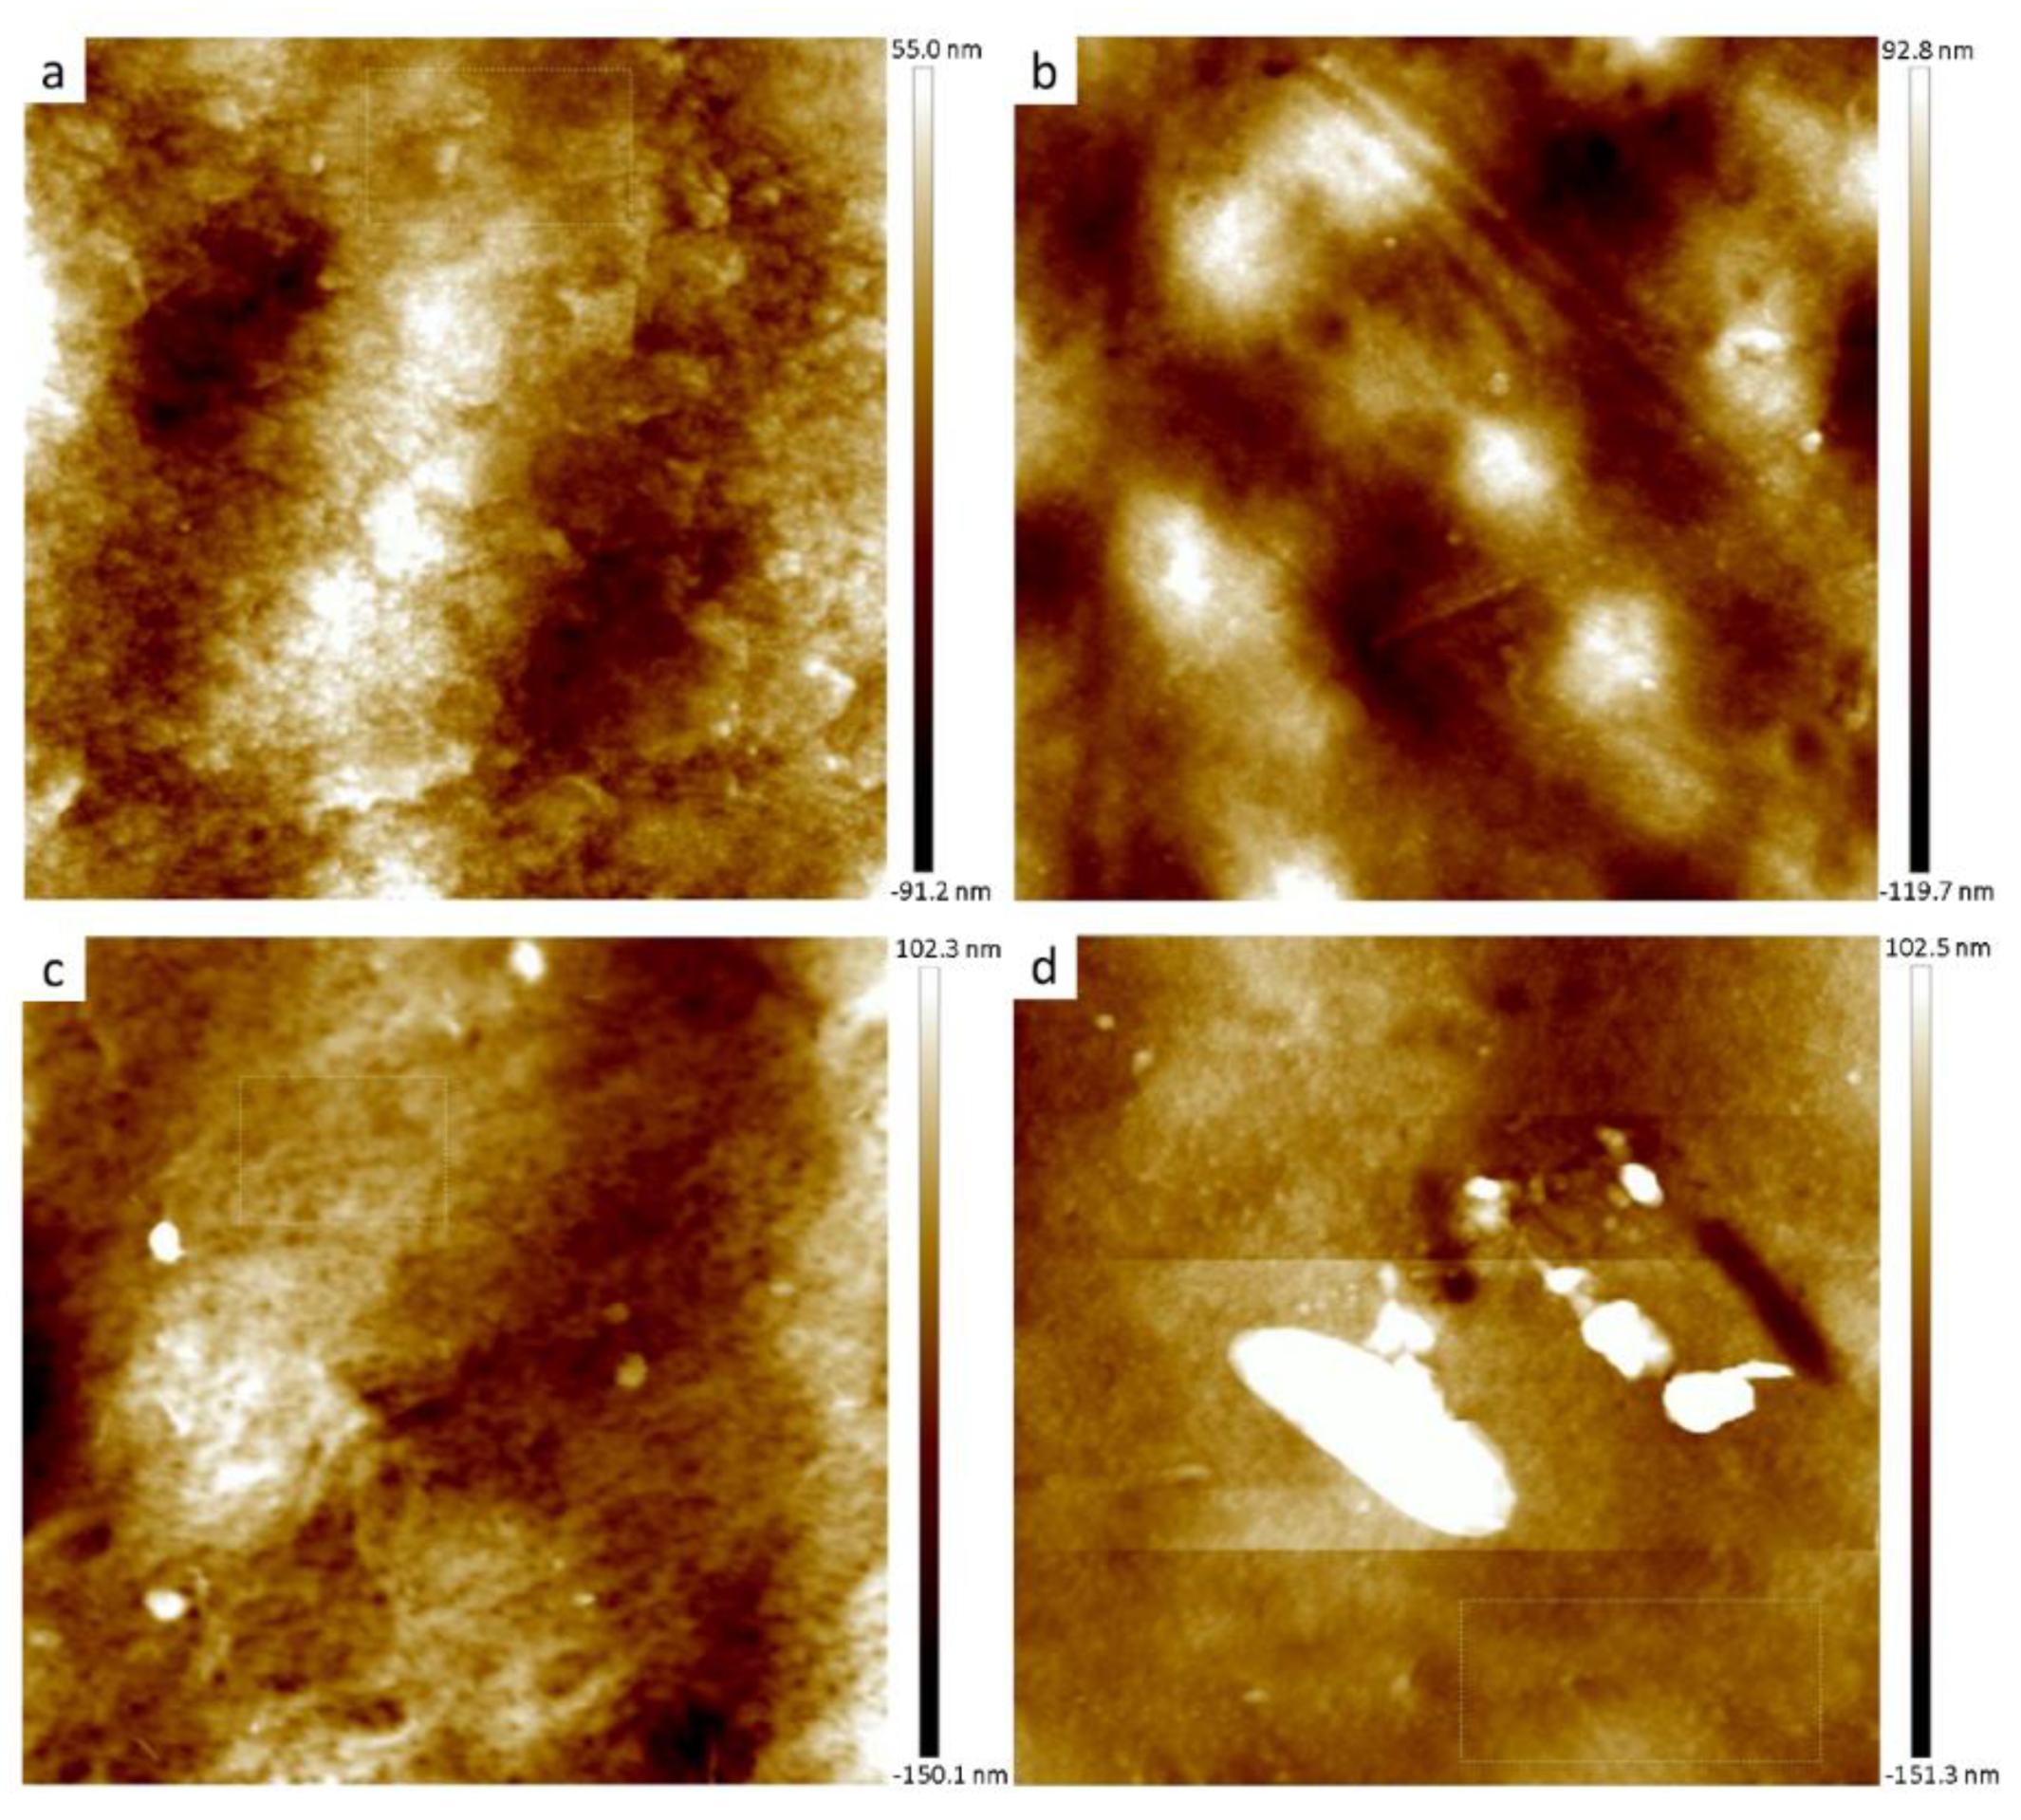
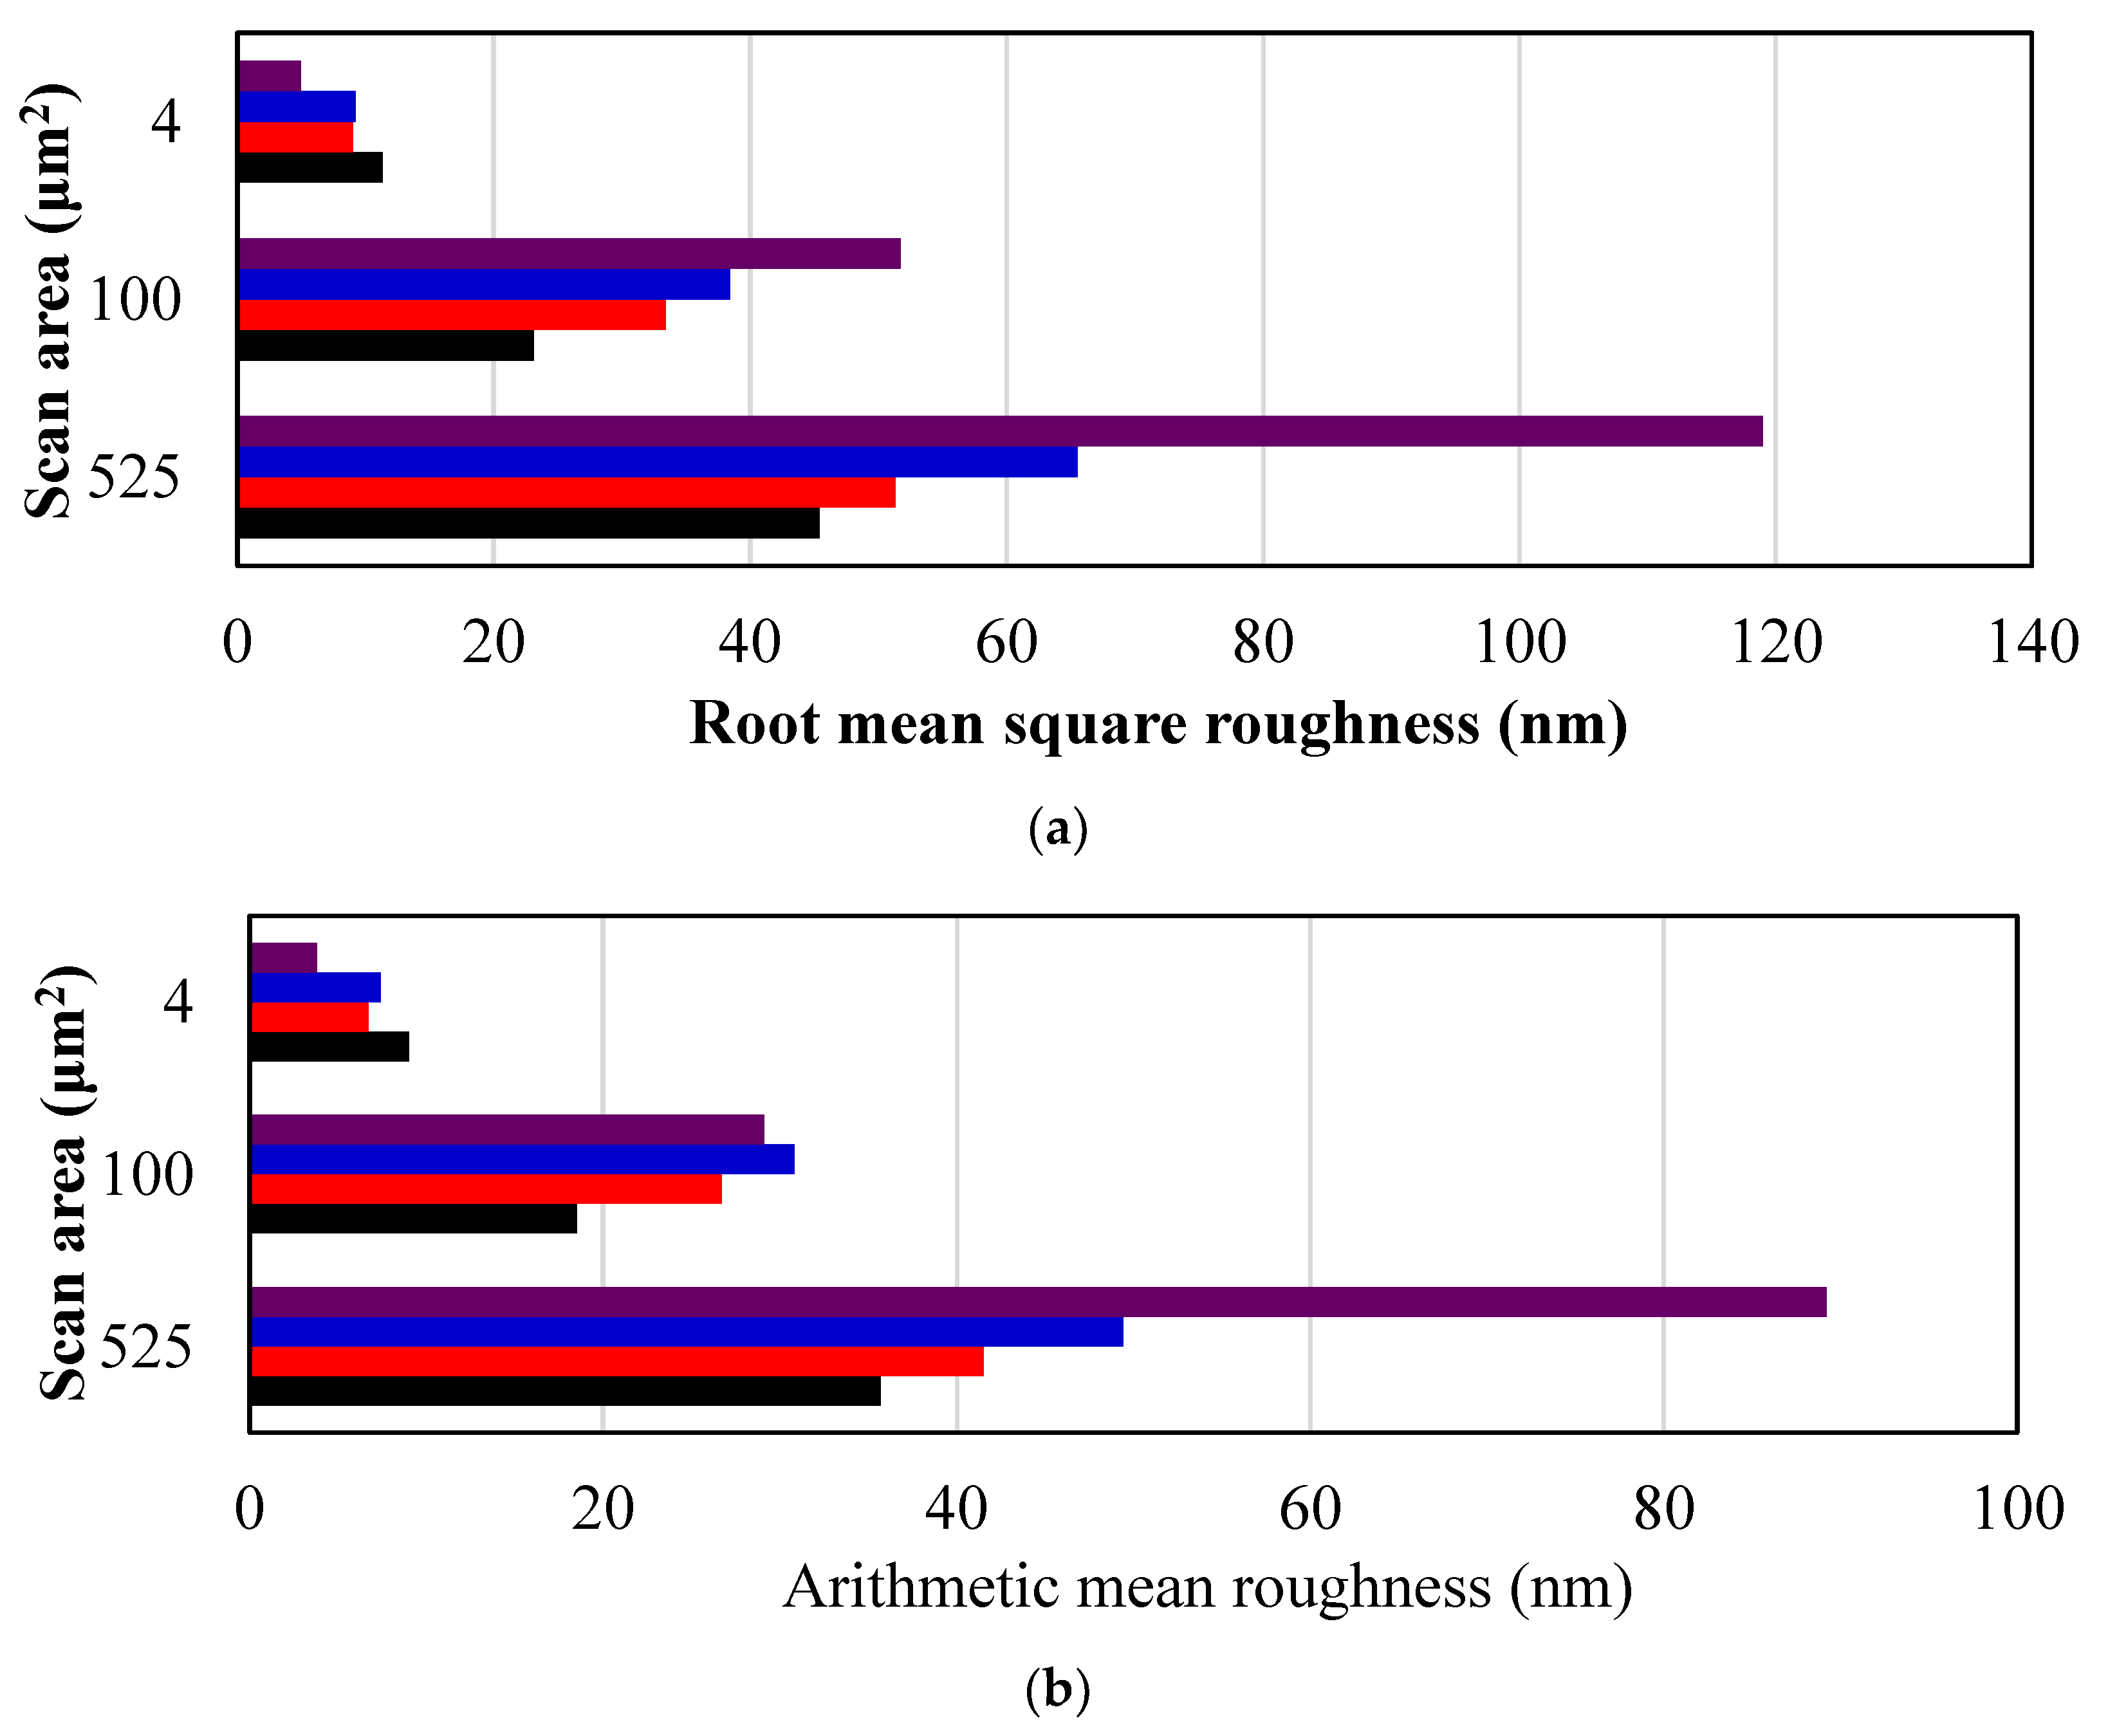
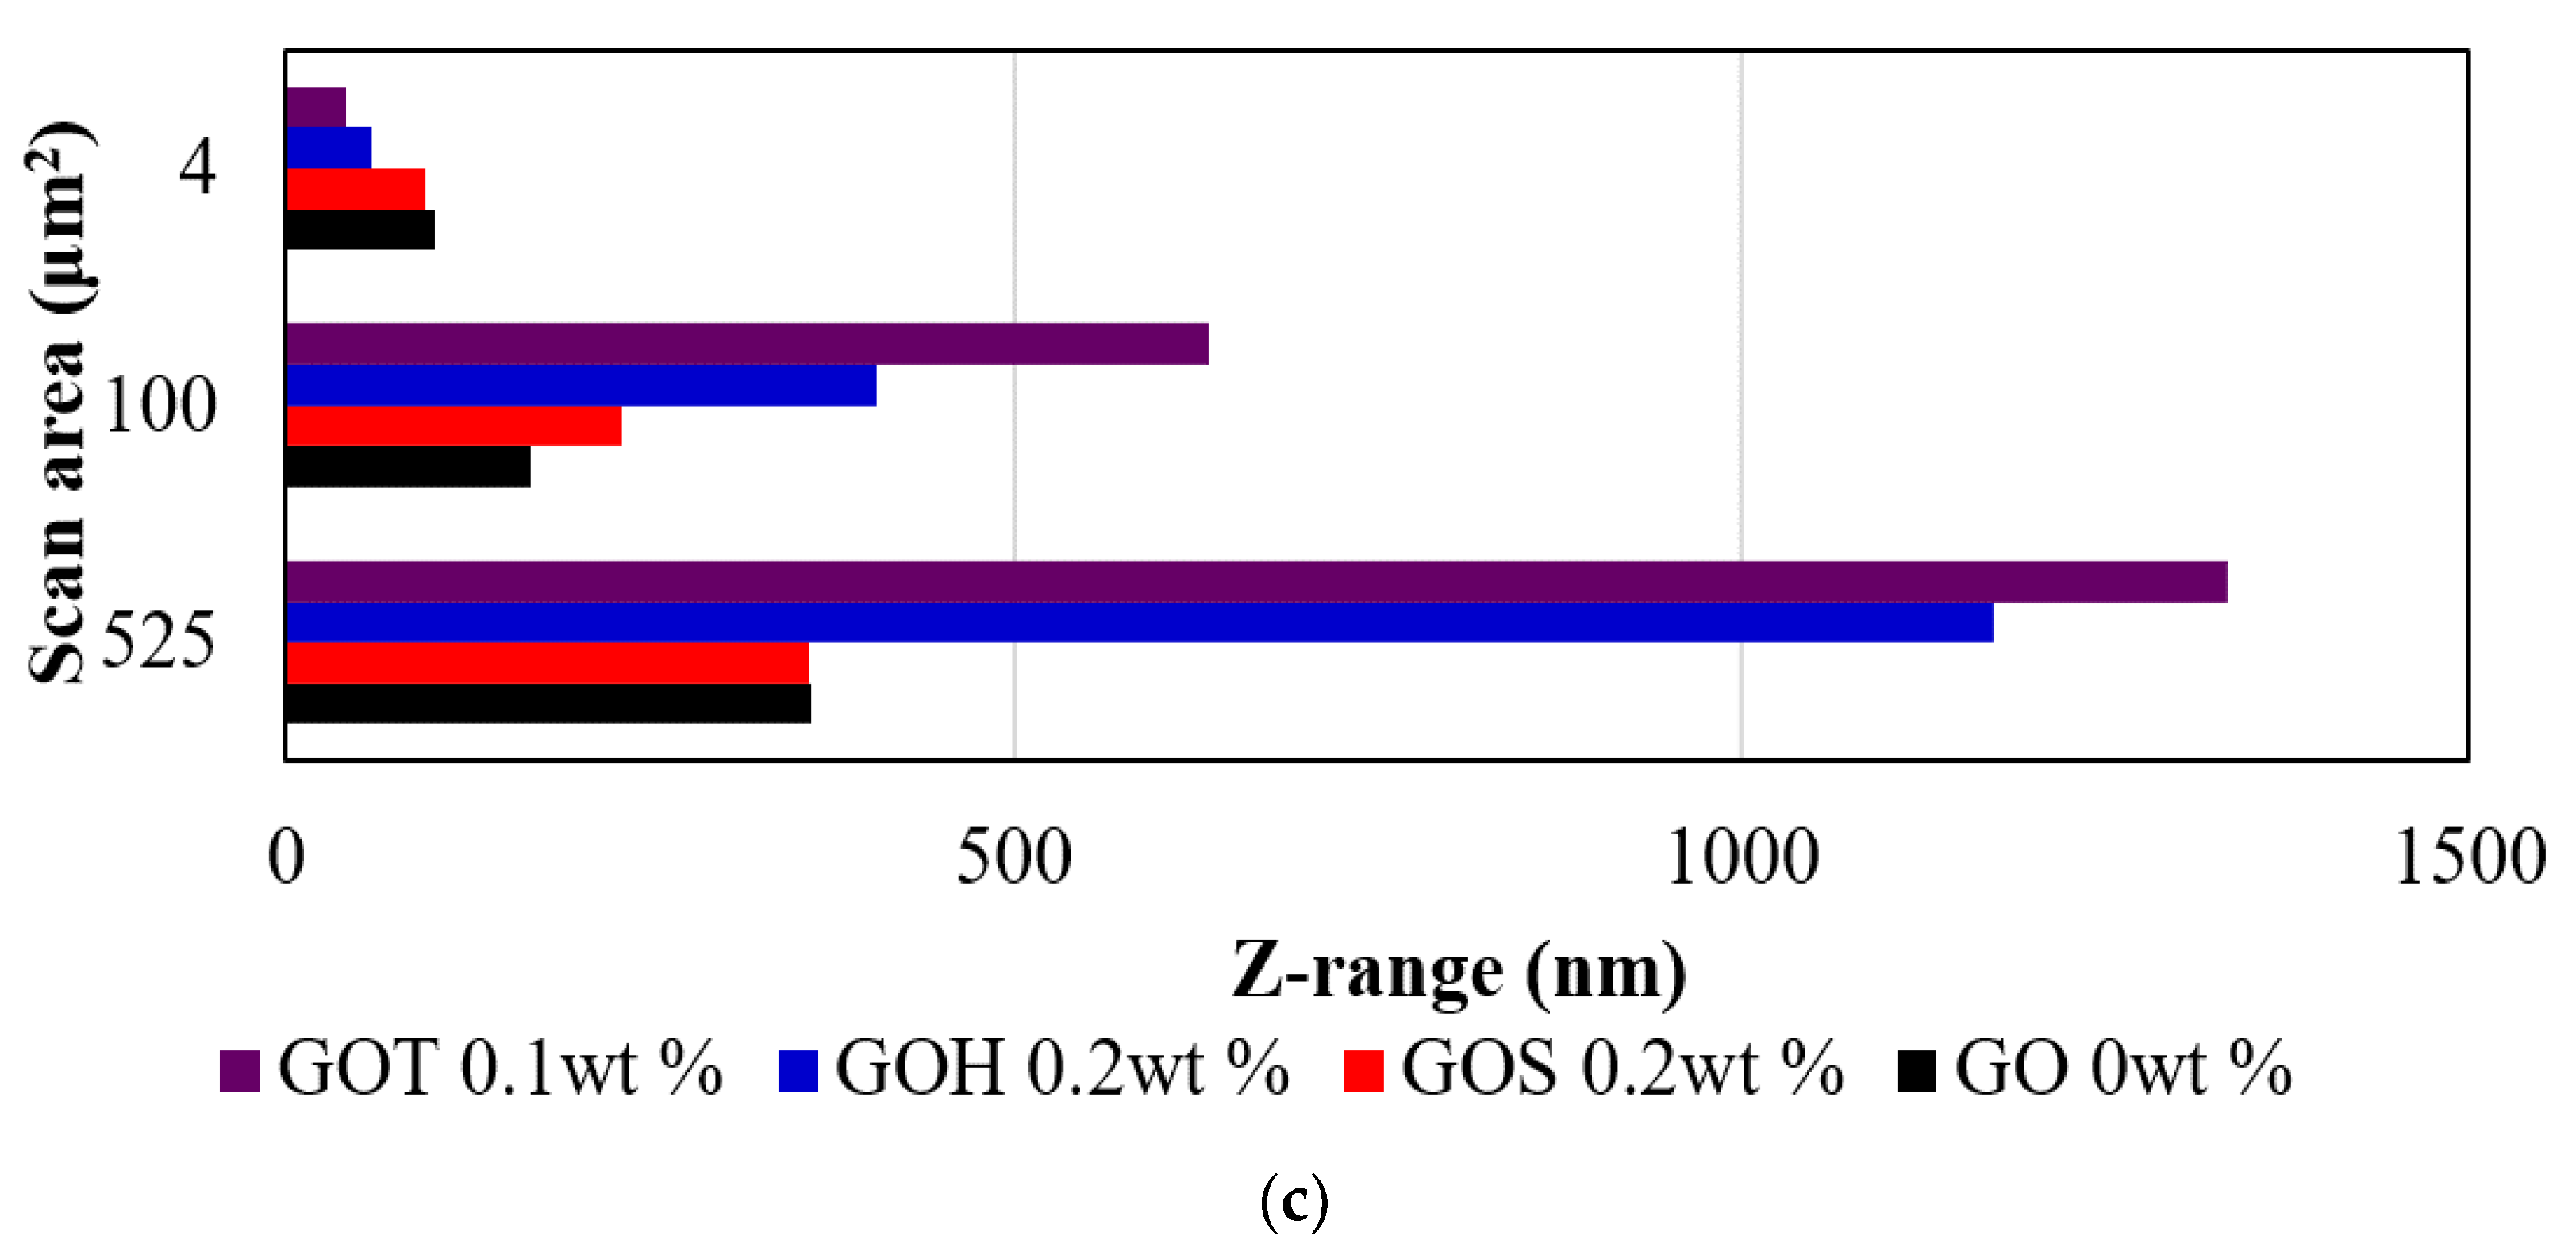
The surface and cross-section morphologies of the membranes influence the permeability and selectivity of the membranes. Therefore, the surface roughness and surface topography were evaluated via AFM under tapping-mode for membranes that had shown optimal flux performance in each set, and are shown in Figure 2. The GOT 0.1 wt% membrane was used as a reference for the GOT set, as it has displayed enhanced performance and properties compared to the other membranes, while the 0.2 wt% membranes were used for GOS and GOH for the same reason. The GO-embedded membranes showed a ridge-and-valley surface, where the lighter regions represent the highest points of the membrane, and the darker areas represent the lowest points and/or pores of the membrane. At larger scan areas (25 × 25 and 10 × 10 μm) the modified membranes showed a rougher surface than the control membrane as displayed in Figure 3, which was consistent with previous reports of MMMs [18,35]. GOT showed the roughest surface, followed by GOH and then GOS. A rough surface is desirable, as an increased roughness value has been linked to an increase in flux [13]. However, at the finest scan area (2 × 2 μm) the localized roughness was lower, with GOT having the smoothest membrane surface. The difference in behavior for GOT at the largest and smallest scan areas could possibly be influenced by the larger GO sheet size associated with the GOT synthesis method. At the 10 × 10 μm scan size GOH had a larger arithmetic mean roughness, while GOT had the larger root mean square roughness, indicating that GOT showed more irregularity in its surface structure roughness. Similar observations to roughness were observed for the largest peak-valley range (z-value) obtained from each scan (Figure 3).
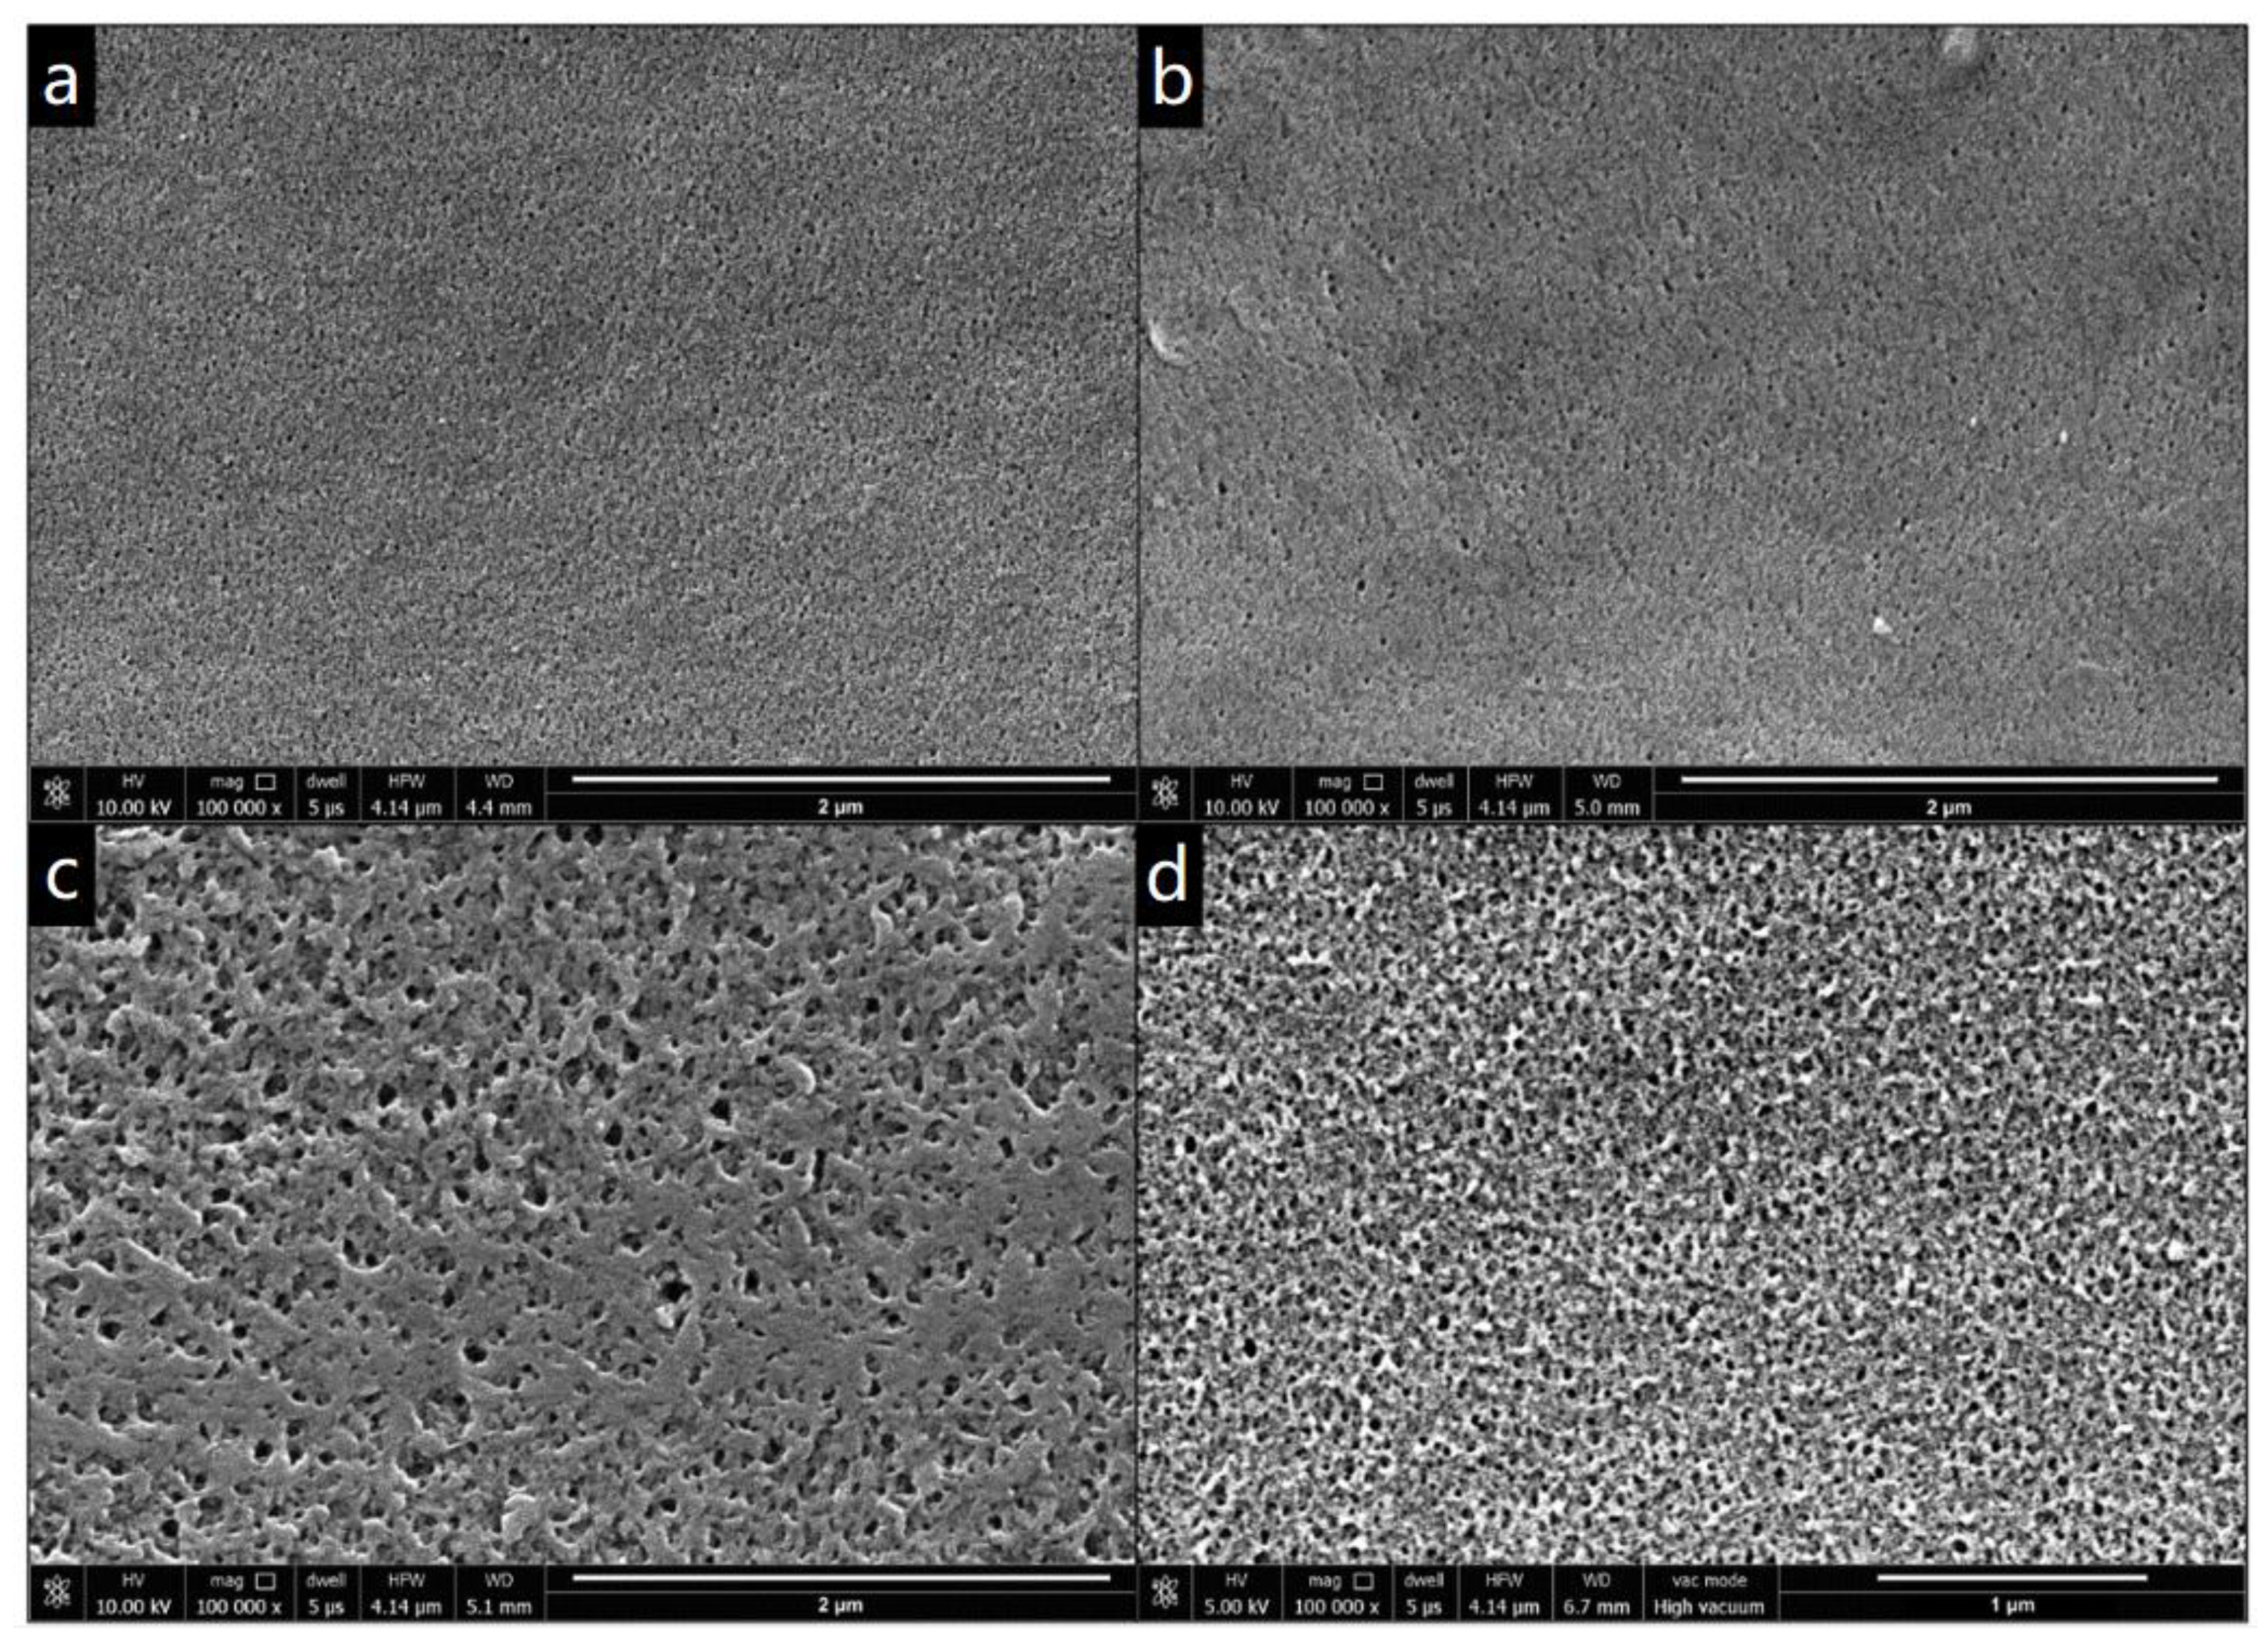
SEM analysis was conducted on the best performing membranes from each GO synthesis method to understand how differences in synthesis method impact membrane morphology, and therefore performance. The surface images in Figure 4 revealed significant differences in surface structure and porosity between the various samples. The GO-free membrane showed a fine carpet-like surface with fine pores. This same structure was also apparent in GOS doped samples, but with more distinct pore openings. For GOT a more pumice-like surface was present with larger pores, while GOH exhibited the largest pore size with a sponge-like surface.
A lower C/O ratio has been reported to result in an increased stacking of GO sheets, which results in larger channels around the GO stacks [33], consistent with the change in surface roughness and pore size of GO-doped membranes. Nevertheless, the GO nanosheets are not visually apparent on the surface of the membranes, implying that excessive agglomeration did not take place in these particular samples, and the nanoparticles were well dispersed [10]. The surface SEM images are consistent with the AFM surface structures observed at 2 × 2 μm scan area (Supporting Information Figure S4) and AFM measurements at larger scale, corresponding to water drop size, correlated with contact angle measurements, where the roughest surface (GOT) had the lowest contact angle. SEM images of the cross-section showed that all the membranes display a typical asymmetric structure, including a thin active layer and large porous support layer, with finger-like structure (Supporting Information Figure S5). It is also observed that more pores are exhibited at the top layer of the cross-section of the GO containing membranes compared to the control membrane.
3.2.3. Mechanical Properties
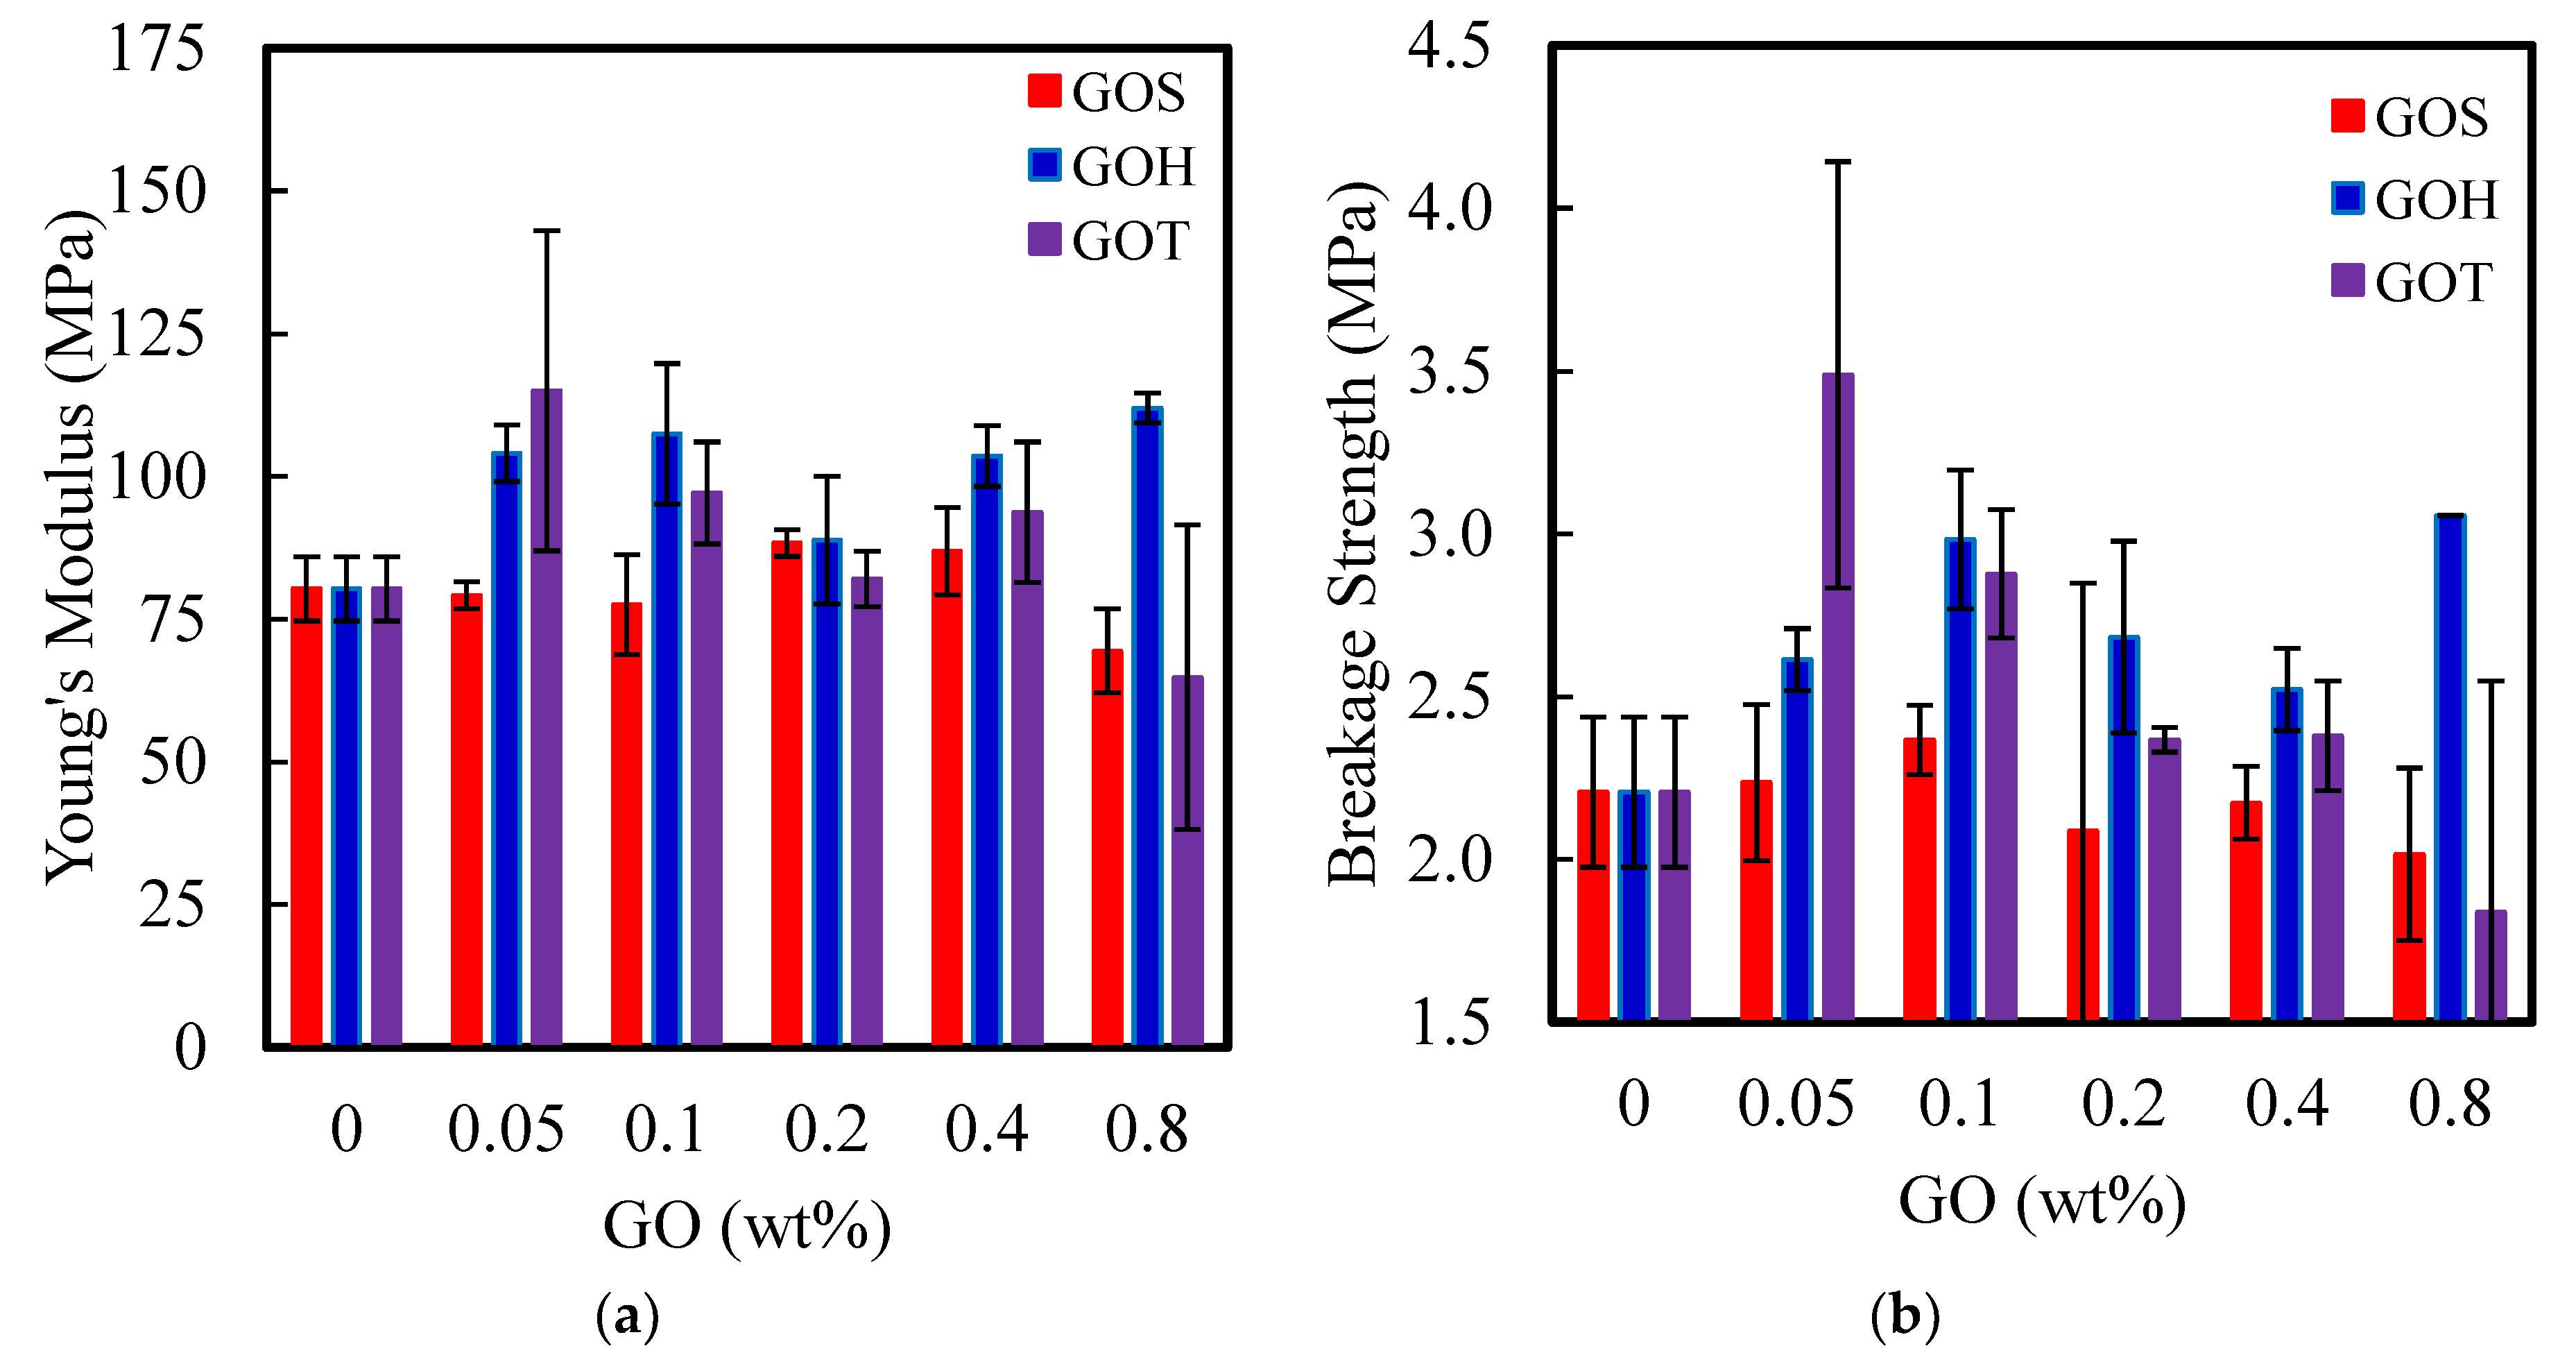
The mechanical properties of the pure and modified membranes were examined via tensile testing and the Young’s modulus, and stresses at breakage are summarized in Figure 5. All stress-strain curves exhibited a linear section as an elastic response, followed by a plastic elongation phase before rupturing (Supporting Information Figure S6). The GOS set showed very little variations in mechanical properties with GO loading. The GOT set showed the largest improvement, with an increase in Young’s modulus and rupture stress at low concentrations, but also the largest variation with loading; both properties decreasing notably at the highest GO loadings tested. For the Young’s modulus, two-way independent analysis of variance (ANOVA) showed statistically significant differences between GOS compared to GOH and GOT, with Tukey’s post-hoc test giving p values of <0.001 and 0.013, respectively. Notable interactions were also observed between synthesis and loading (p = 0.026). For stress at breakage, both loading and synthesis methods were significant predictors of behavior, with 2% loading significantly greater than most other loading rates (p < 0.001) while for the synthesis method GOS was significantly less than GOH and GOT (p < 0.001).
The size of the particles and more specifically the aspect ratio significantly impact the mechanical properties of polymer nanocomposites. Because of that, the small sheet size of GOS does not have any impact on the stiffness of the membranes regardless of the loadings, whereas the large particles of GOT significantly impact the membranes’ stiffness at very low loading, as it is expected to have very low percolation concentration, but stiffness decreases at higher loading due to aggregation of the large GOT sheets. The impact of the surface-to-bulk ratio was previously confirmed by Wu et al. [36]. Moreover, larger particles place larger stress zones in the material, and may be a cause of the increased strength variability observed with GOT.
3.3. Membrane Performance
3.3.1. Water and Oil Flux
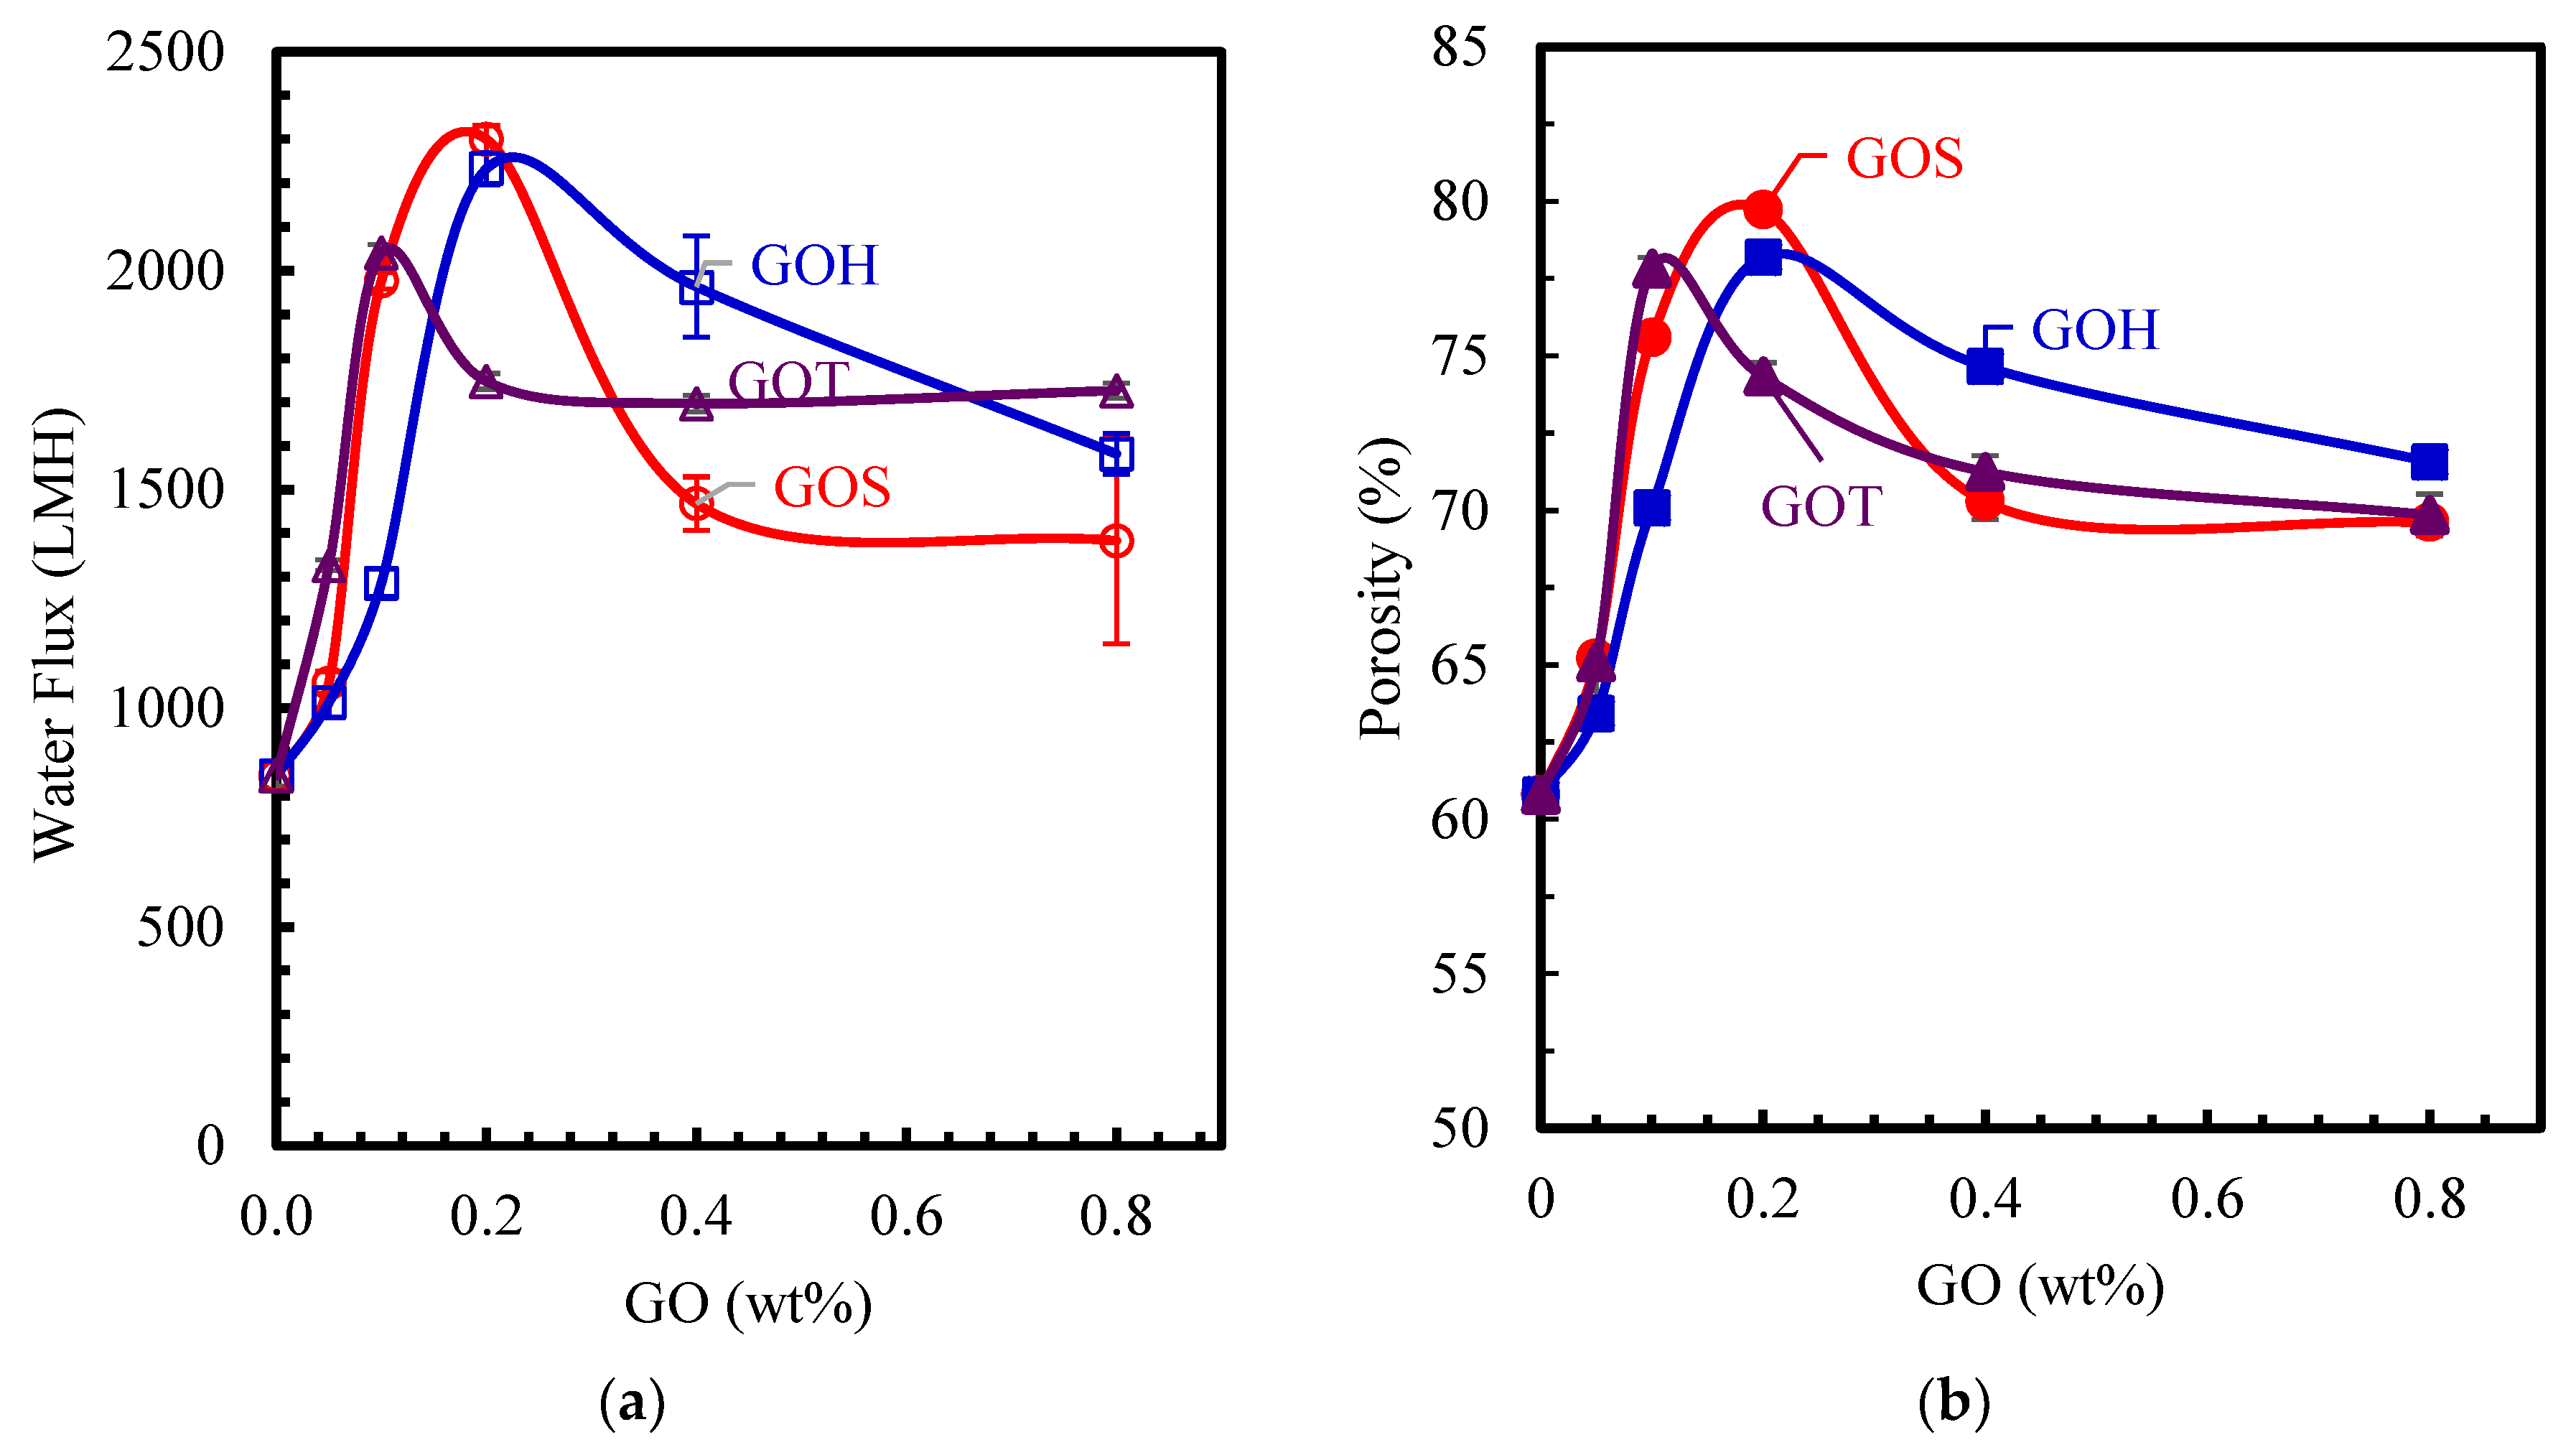
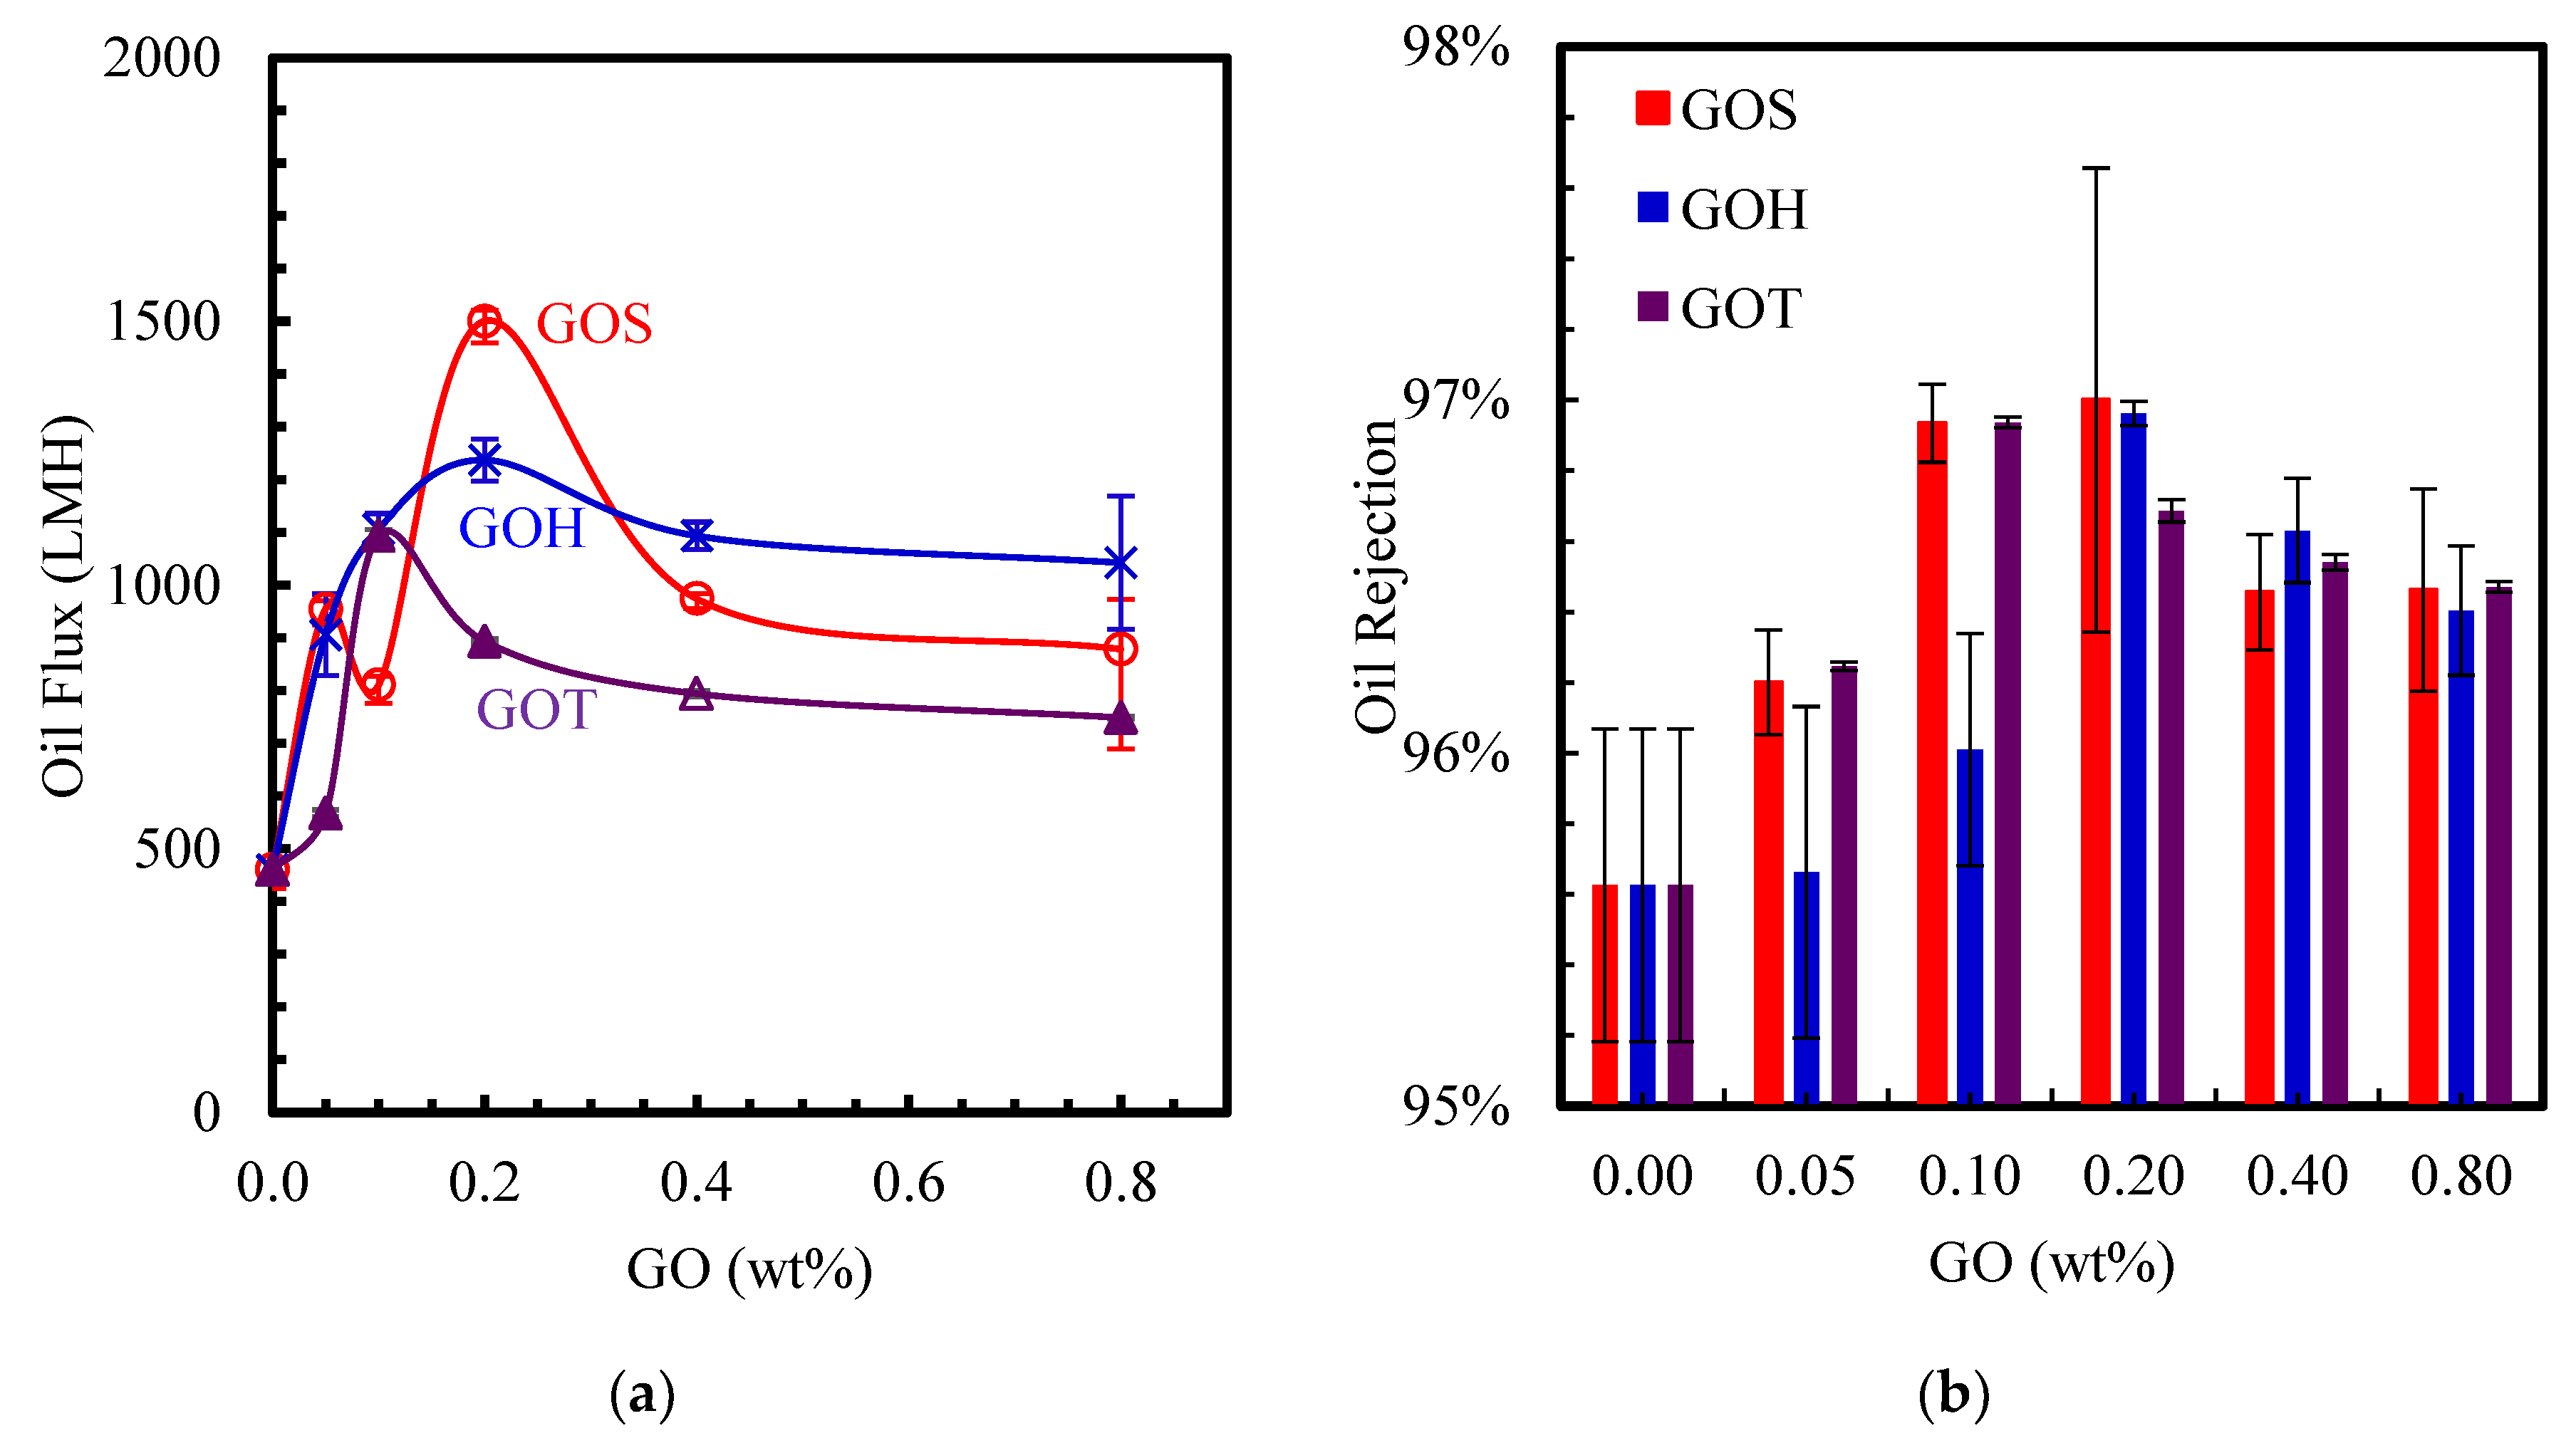
Permeability testing was conducted by first running UP water in a dead-end cell, followed by an oil-water emulsion at 2 bar pressure. The results of the experiments are summarized in Figure 6 and Figure 7 for water and oil flux, respectively. The control membrane had a stable water flux of 845 LMH and an oily-water flux of 460 LMH. All modified membranes displayed a higher water and oil permeability compared to the control membrane. Generally, all sets of membranes have displayed a trend where the flux increased with increased loading, and then decreased after reaching a peak at the highest loading.
While water and oily-water flux curves showed a consistent and similar trend, the oily-water flux was approximately two-thirds of that achieved with UP water. This decrease of flux is linked to the clogging of the pores by oil particles during the testing. The highest water flux was reached by the GOS-0.2 wt% membrane at a value of 2300 LMH. Similarly, the highest oily-water flux was also achieved with GOS-0.2 wt% at 1520 LMH. The GOH set followed a similar pattern where the highest flux was achieved by the GOH-0.2 wt% membrane for both UP water and oily-water. For the GOT set, the water and oil flux showed a maximum flux at 0.1 wt% loading, which is more than twice the flux of the control sample. At higher loading, flux decreases due to the agglomeration of the GO sheets, thereby reducing the membrane porosity (Figure 6b), and the effectiveness of GO to enhance the hydrophilicity, as confirmed by the contact angle measured and consistent with previous results [37,38]. Moreover, based on the results in Figure 6, it is clear that the membranes doped with GOH and GOT showcase similar trends, while the GOS set is different. This behavior is linked to the type of dominant functional groups in GO and their hydrophilicity. GOH and GOT contain a higher concentration of epoxy groups, while GOs has a large concentration of the more polar carbonyl groups, making GOs more effective at increasing the hydrophilicity [33]. Moreover, Ballinas et al. [39] confirmed that the size of the nanoparticle embedded into the membrane influences the permeation with a smaller nanoparticle size resulting in a higher permeation. Hence, the low particle size of GOS, which is linked to the harsh oxidizing, is more effective than GOH and GOT in increasing the porosity and the water flux.
Figure 6b shows the effect of GO loading and synthesis method on membrane porosity measured by the water wicking method. As the loading concentration increases, the porosity of the membranes increase from 60% for the control membrane, to a peak of 77–79% for a GO loading of 0.1–0.2 wt%. Beyond this loading the porosity decreases in agreement with previously reported values for GO-PSf MMMs [37]. These porosity results, in addition to the contact angle and zeta potential results, suggest an increased flux for membranes modified with small GO loading, 0.1 to 0.2 wt%.
The results of the pure water flux experiments are consistent with the impact of the GO type on hydrophilicity and porosity, as explained in the previous section. Permeability is governed by the hydrophilicity of the membranes as well as their porosity. The contact angle results provided by the experiments of this study support an increase in hydrophilicity, which is verified by the flux results. The water flux, porosity, and contact angle have similar correlation with GO type and loading as shown in Figure 1 and Figure 6.
3.3.2. Oil Rejection
The oil separation results are summarized in Figure 7 and they display the increased rejection for all membranes relative to the control membrane sample that exhibited 95.6% oil rejection. Similar to the flux behavior, the rejection initially increases with the GO concentration up to an optimum loading, and decreases at higher loading, regardless of the GO type. Nevertheless, the enhancement of rejection is relatively limited, increasing by roughly 1% only. It is typically expected that flux and rejection are competing objectives, but the use of GO as a nanofiller at appropriate doping concentrations allows improvement in both objectives simultaneously for oil removal, due to the tailoring of surface contact angle and hydrophilicity.
The carbonyl and carboxyl groups are more dominant in the GOS set, which explains the better performance and properties of the previous results in GOS. Based on literature that explored the removal capabilities of GO-embedded membranes, the variation in hydrophilicity, zeta potential, as well as the pore size, are considered to be the main factors that influence the selectivity performance of the membrane [23,40,41]. While a membrane with low contact angle and high negative zeta potential displays a high permeability, a membrane with small and tight pores reduces the flux and increases the selectivity [41].
The contact angle and zeta potential results provided by the experiments of this study support an increase in hydrophilicity and ion mobility, which is verified by the separation results.
3.4. Role of GO Doping Concentration
Many previous experiments were conducted on GO prepared via Hummers’ or modified Hummers’ method, where the nanoparticles were introduced into the matrix of membranes at various concentrations. Experiments conducted on PSf-GO membranes embedded with Hummers’ or modified Hummers’ GO nanoparticles, have all displayed an enhancement of performance and properties compared to the control membranes. Moreover, the permeability of the membranes increases at low loading concentrations and decreases at higher loadings after reaching a peak [18,40,42]. Selectivity experiments conducted by Park et al. on PSf-GO membranes showed that the highest salt rejection was achieved at 0.25% GO loading [40]. Nasseri et al. prepared a similar PSf-GO modified membrane at two concentrations only. An increase in permeability and rejection of bisphenol A was reported at 0.4 wt% loading, but decreased at 1 wt% GO, which was attributed to the lower electrostatic repulsion displayed by the 1 wt% loaded membrane [18]. The discussed experiments found in literature all agree that the GO modified membranes display a peak performance between 0.1 and 0.4 wt% of loading before the permeation performance decreases at higher loadings. The results of this study have shown a water and oil permeation behavior where the highest performance was displayed by 0.2 wt% loading for GOS and GOH membranes and 0.1 wt% loading for GOT membranes, possibly due to its larger size. The GO synthesis method did not influence significantly the GO doping concentration at which optimum conditions were achieved. Moreover, at these low loadings, the doping of GO becomes an economical approach for improved membrane performance, given the tripling in achievable flux with corresponding improved rejection.
3.5. Role of GO Synthesis Method
The specific functional groups strongly influence the properties and performance of the membranes. This is important as previous research has concluded that the carboxyl group is the most hydrophilic group, and a dominance of this group would result in higher affinity with water particles [43], although this particular functional group showed relatively limited variance between the synthesis methods in this study (14.1–18.1%).
The different influence of various functional groups can partly be attributed to their location within the GO, in addition to the chemical properties, as epoxy and hydroxyl groups tend to be located on the basal plane, while the carbonyl and carboxyl groups tend to be located on the edge of the GO [44]. GOS, which showed the highest flux results, also possess the highest proportion of carbonyl and carboxyl groups combined. In contrast, some studies have demonstrated that a high value of epoxy and hydroxyl groups tends to lower the water permeability, due to the interactions between epoxy and hydroxyl groups and water particles, supporting observations between the differences in fluxes observed in this study, where both GOH and GOT had high epoxy group content. For a similar reason, a low C/O ratio can decrease flux, due to bulk viscous dissipation and spatially extended friction associated with functional groups from the basal plane, and may further explain why the higher C/O ratio GOS resulted in improved flux, despite the lowest carboxyl functional group content [45]. Shi et al. stated that membranes with GO of low oxidation have shown a flux ten times higher than membranes embedded with GO that possess a high oxidation degree [46].
Size of particles has a significant impact upon the performance of the membranes. The smaller the GO nanoparticles are, the better the flux becomes [39]. GOT which had the largest particles also showed the lowest flux, while the GOS set, which had the smallest particle size, displayed the highest flux.
3.6. Selection of GO Synthesis Method for Membrane Enhancement
The GOS and GOH sets displayed the highest performance at the loading of 0.2 wt% with relatively similar flux values. The GOT, on the other hand, displayed the highest performance at 0.1 wt% with a slightly lower, but comparable flux value and selectivity. In all cases, regardless of the GO synthesis method, flux improvements ranged between 2.4 and 2.7 times the increase in flux for water. Given that the Tour method of GO preparation is a more sustainable and less time consuming method [25], and achieved its highest flux at only half of the amount required by the other evaluated methods, this could be argued to be the most economic and efficient synthesis method for membrane performance enhancement.
4. Conclusions
In this study, three sets of GO prepared via the Staudenmaier, Hummers’ and Tour methods have been characterized and introduced into the matrix of a PSf membrane at various concentrations from 0.05 to 0.8 wt%. In general, the addition of GO nanoparticles into the membrane matrix has helped develop membranes with significantly enhanced properties, compared to the control membrane with the optimal GO loading value of the prepared PSf-GO membranes laying between 0.1 and 0.2 wt%. Key properties defining flux and selectivity performance, such as contact angle, zeta potential and porosity, were all strongly dependent on the GO loading and synthesis type. One membrane from each set of GO modified membranes prepared stood out as exhibiting the best permeation and rejection results, which was at a loading of 0.2 wt% for both GOS and GOH sets and 0.1 wt% for the GOT set. The GOS synthesis method provided the membrane with the highest flux, with an increase of 2.7 times that of the non-modified membrane and best rejection of 97.0%, based on the higher C/O ratio and increased carbonyl content of the GOS synthesis method. While the GOS-0.2 wt% membrane displayed the highest flux and rejection, the GOT-0.1 wt% membrane displayed a comparable permeability and selectivity at half of the GOS loading requirements. This, in combination with its more environmentally friendly synthesis route, indicates this less commercialized GO synthesis method could be a more sustainable approach to membrane modification.
Supplementary Materials
The following are available online at https://www.mdpi.com/2079-4991/9/5/769/s1, Figure S1: XPS spectra results of GOS, Figure S2: XPS spectra results of GOH, Figure S3: XPS spectra results of GOT, Figure S4: AFM images of membranes at 2 × 2 μm scan area, Figure S5: SEM images of cross-sections, Figure S6: Stress-strain curves of uniaxial tension tests.
Author Contributions
Conceptualization, A.A.A.; methodology, A.A.A. and H.R.M.; formal analysis, S.S., A.A.A. and H.R.M.; investigation, S.S.; resources, A.A.A. and H.R.M.; writing—original draft preparation, S.S.; writing—review and editing, A.A.A. and H.R.M.; visualization, S.S., A.A.A. and H.R.M.; supervision, A.A.A. and H.R.M.; project administration, A.A.A. and H.R.M.
Funding
Safae Sali was supported through a Hamad bin Khalifa University scholarship.
Acknowledgments
The authors would like to express their thanks to the core labs at the Qatar Environment and Energy Research Institute, Hamad bin Khalifa University, for their assistance in GO and membrane characterization. In particular, we express our gratitude to Yahya Zakaria for the XPS analysis, Mohamed Helal for SEM analysis, Ayman Samara for DMA and contact angle analysis, Dhanasekaran Thirunavukkarasu for AFM analysis and Said Mansour for facilities access. The publication of this article was funded by the Qatar National Library.
Conflicts of Interest
The authors declare no conflict of interest.
References
- Xu, G.R.; Wang, S.H.; Zhao, H.L.; Wu, S.B.; Xu, J.M.; Li, L.; Liu, X.Y. Layer-by-layer (LBL) assembly technology as promising strategy for tailoring pressure-driven desalination membranes. J. Membr. Sci. 2015, 493, 428–443. [Google Scholar] [CrossRef]
- United Nations Educational Scientific and Cultural Organization. The United Nations World Water Development Report 2018: Nature–Based Solutions for Water; UNESCO: Paris, France, 2018. [Google Scholar]
- Wang, L.; Song, X.; Wang, T.; Wang, S.; Wang, Z.; Gao, C. Fabrication and characterization of polyethersulfone/carbon nanotubes (PES/CNTs) based mixed matrix membranes (MMMs) for nanofiltration application. Appl. Surf. Sci. 2015, 330, 118–125. [Google Scholar] [CrossRef]
- Wang, K.; Abdalla, A.A.; Khaleel, M.A.; Hilal, N.; Khraisheh, M.K. Mechanical properties of water desalination and wastewater treatment membranes. Desalination 2017, 401, 190–205. [Google Scholar] [CrossRef] [Green Version]
- Joshi, R.K.; Alwarappan, S.; Yoshimura, M.; Sahajwalla, V.; Nishina, Y. Graphene oxide: The new membrane material. Appl. Mater. Today 2015, 1, 1–12. [Google Scholar] [CrossRef]
- Baker, R.W. Overview of Membrane Science and Technology. In Membrane Technology and Applications; John Wiley & Sons: Chichester, UK, 2012; pp. 1–14. [Google Scholar]
- Qadir, D.; Mukhtar, H.; Keong, L.K. Mixed Matrix Membranes for Water Purification Applications. Sep. Purif. Rev. 2017, 46, 62–80. [Google Scholar] [CrossRef]
- Mollahosseini, A.; Rahimpour, A. Interfacially polymerized thin film nanofiltration membranes on TiO2 coated polysulfone substrate. J. Ind. Eng. Chem. 2014, 20, 1261–1268. [Google Scholar] [CrossRef]
- Ganesh, B.M.; Isloor, A.M.; Ismail, A.F. Enhanced hydrophilicity and salt rejection study of graphene oxide-polysulfone mixed matrix membrane. Desalination 2013, 313, 199–207. [Google Scholar] [CrossRef]
- Zinadini, S.; Zinatizadeh, A.A.; Rahimi, M.; Vatanpour, V.; Zangeneh, H. Preparation of a novel antifouling mixed matrix PES membrane by embedding graphene oxide nanoplates. J. Membr. Sci. 2014, 453, 292–301. [Google Scholar] [CrossRef]
- Yoo, B.M.; Shin, J.E.; Lee, H.D.; Park, H.B. Graphene and graphene oxide membranes for gas separation applications. Curr. Opin. Chem. Eng. 2017, 16, 39–47. [Google Scholar] [CrossRef]
- Das, R.; Ali, M.E.; Hamid, S.B.A.; Ramakrishna, S.; Chowdhury, Z.Z. Carbon nanotube membranes for water purification: A bright future in water desalination. Desalination 2014, 336, 97–109. [Google Scholar] [CrossRef]
- Emadzadeh, D.; Lau, W.J.; Matsuura, T.; Rahbari-Sisakht, M.; Ismail, A.F. A novel thin film composite forward osmosis membrane prepared from PSf–TiO2 nanocomposite substrate for water desalination. Chem. Eng. J. 2014, 237, 70–80. [Google Scholar] [CrossRef]
- Shawky, H.A.; Chae, S.R.; Lin, S.; Wiesner, M.R. Synthesis and characterization of a carbon nanotube/polymer nanocomposite membrane for water treatment. Desalination 2011, 272, 46–50. [Google Scholar] [CrossRef]
- Xu, Z.; Wang, H.; Hwang, J.Y. Complex carbon nanotube superstructures synthesized with natural mineral catalysts. Carbon 2007, 45, 873–879. [Google Scholar] [CrossRef]
- Romero, A.; Lavin-Lopez, M.P.; Sanchez-Silva, L.; Valverde, J.L.; Paton-Carrero, A. Comparative study of different scalable routes to synthesize graphene oxide and reduced graphene oxide. Mater. Chem. Phys. 2018, 203, 284–292. [Google Scholar] [CrossRef]
- Hegab, H.M.; Zou, L. Graphene oxide-assisted membranes: Fabrication and potential applications in desalination and water purification. J. Membr. Sci. 2015, 484, 95–106. [Google Scholar] [CrossRef]
- Nasseri, S.; Ebrahimi, S.; Abtahi, M.; Saeedi, R. Synthesis and characterization of polysulfone/graphene oxide nano-composite membranes for removal of bisphenol A from water. J. Environ. Manag. 2018, 205, 174–182. [Google Scholar] [CrossRef]
- Medina, V.F.; Griggs, C.S.; Brooke, P.; Mattei-Sosa, J.; Luke, G.; Waisner, S.A.; Jay, B.; Robert, M. Fabrication, Characterization, and Testing of Graphene Oxide and Hydrophilic Polymer Graphene Oxide Composite Membranes in a Dead-End Flow System. J. Environ. Eng. 2017, 143, 04017072. [Google Scholar] [CrossRef]
- Taha-Tijerina, J.; Venkataramani, D.; Aichele, C.P.; Tiwary, C.S.; Smay, J.E.; Mathkar, A.; Chang, P.; Ajayan, P.M. Quantification of the Particle Size and Stability of Graphene Oxide in a Variety of Solvents. Part. Part. Syst. Charact. 2015, 32, 334–339. [Google Scholar] [CrossRef]
- Zaaba, N.I.; Foo, K.L.; Hashim, U.; Tan, S.J.; Liu, W.W.; Voon, C.H. Synthesis of Graphene Oxide using Modified Hummers Method: Solvent Influence. Procedia Eng. 2017, 184, 469–477. [Google Scholar] [CrossRef] [Green Version]
- Hummers, W.S.; Offeman, R.E. Preparation of Graphitic Oxide. J. Am. Chem. Soc. 1958, 80, 1339. [Google Scholar] [CrossRef]
- Vatanpour, V.; Shockravi, A.; Zarrabi, H.; Nikjavan, Z.; Javadi, A. Fabrication and characterization of anti-fouling and anti-bacterial Ag-loaded graphene oxide/polyethersulfone mixed matrix membrane. J. Ind. Eng. Chem. 2015, 30, 342–352. [Google Scholar] [CrossRef]
- Staudenmaier, L. Verfahren zur Darstellung der Graphitsäure. Ber. Dtsch. Chem. Ges. 1898, 31, 1481–1487. [Google Scholar] [CrossRef]
- Marcano, D.C.; Kosynkin, D.V.; Berlin, J.M.; Sinitskii, A.; Sun, Z.; Slesarev, A.; Alemany, L.B.; Lu, W.; Tour, J.M. Improved synthesis of graphene oxide. ACS Nano 2010, 4, 4806–4814. [Google Scholar] [CrossRef]
- Hosseini, S.S.; Bringas, E.; Tan, N.R.; Ortiz, I.; Ghahramani, M.; Alaei Shahmirzadi, M.A. Recent progress in development of high performance polymeric membranes and materials for metal plating wastewater treatment: A review. J. Water Process Eng. 2016, 9, 78–110. [Google Scholar] [CrossRef]
- Poh, H.L.; Šaněk, F.; Ambrosi, A.; Zhao, G.; Sofer, Z.; Pumera, M. Graphenes prepared by Staudenmaier, Hofmann and Hummers methods with consequent thermal exfoliation exhibit very different electrochemical properties. Nanoscale 2012, 4, 3515–3522. [Google Scholar] [CrossRef]
- Pendolino, F.; Armata, N. Synthesis, Characterization and Models of Graphene Oxide. In Graphene Oxide in Environmental Remediation Process; SpringerBriefs in Applied Sciences and Technology; Springer: Cham, Switzerland, 2017; pp. 5–21. [Google Scholar]
- Yadav, N.; Dubey, A.; Shukla, S.; Saini, C.P.; Gupta, G.; Priyadarshini, R.; Lochab, B. Graphene Oxide-Coated Surface: Inhibition of Bacterial Biofilm Formation due to Specific Surfaceâ—Interface Interactions. ACS Omega 2017, 2, 3070–3082. [Google Scholar] [CrossRef]
- McAllister, M.J.; Li, J.L.; Adamson, D.H.; Schniepp, H.C.; Abdala, A.A.; Liu, J.; Herrera-Alonso, M.; Milius, D.L.; Car, R.; Prud’homme, R.K.; et al. Single Sheet Functionalized Graphene by Oxidation and Thermal Expansion of Graphite. Chem. Mater. 2007, 19, 4396–4404. [Google Scholar] [CrossRef]
- Pan, S.; Aksay, I.A. Factors controlling the size of graphene oxide sheets produced via the graphite oxide route. Acs Nano 2011, 5, 4073–4083. [Google Scholar] [CrossRef]
- Paneri, A.; Moghaddam, S. Impact of synthesis conditions on physicochemical and transport characteristics of graphene oxide laminates. Carbon 2015, 86, 245–255. [Google Scholar] [CrossRef]
- Wei, Y.; Zhang, Y.; Gao, X.; Ma, Z.; Wang, X.; Gao, C. Multilayered graphene oxide membranes for water treatment: A review. Carbon 2018, 139, 964–981. [Google Scholar] [CrossRef]
- Raidongia, K.; Tan, A.T.L.; Huang, J. Carbon Nanotubes and Graphene, 2nd ed.; Tanaka, K., Iijima, S., Eds.; Chapter 14 Graphene Oxide: Some New Insights into an Old Material; Elsevier: Oxford, UK, 2014; pp. 341–374. [Google Scholar]
- Akin, I.; Zor, E.; Bingol, H.; Ersoz, M. Green Synthesis of Reduced Graphene Oxide/Polyaniline Composite and Its Application for Salt Rejection by Polysulfone-Based Composite Membranes. J. Phys. Chem. B 2014, 118, 5707–5716. [Google Scholar] [CrossRef]
- Wu, Q.; Su, Y.; Liu, L.; Zhang, Z. Surface effect on the self-reinforcing behavior of graphene oxide membranes. Carbon 2018, 129, 403–408. [Google Scholar] [CrossRef]
- Xu, Z.; Zhang, J.; Shan, M.; Li, Y.; Li, B.; Niu, J.; Zhou, B.; Qian, X. Organosilane-functionalized graphene oxide for enhanced antifouling and mechanical properties of polyvinylidene fluoride ultrafiltration membranes. J. Membr. Sci. 2014, 458, 1–13. [Google Scholar] [CrossRef]
- Orooji, Y.; Faghih, M.; Razmjou, A.; Hou, J.; Moazzam, P.; Emami, N.; Aghababaie, M.; Nourisfa, F.; Chen, V.; Jin, W. Nanostructured mesoporous carbon polyethersulfone composite ultrafiltration membrane with significantly low protein adsorption and bacterial adhesion. Carbon 2017, 111, 689–704. [Google Scholar] [CrossRef]
- Ballinas, L.; Torras, C.; Fierro, V.; Garcia-Valls, R. Factors influencing activated carbon-polymeric composite membrane structure and performance. J. Phys. Chem. Solids 2004, 65, 633–637. [Google Scholar] [CrossRef]
- Park, M.J.; Phuntsho, S.; He, T.; Nisola, G.M.; Tijing, L.D.; Li, X.M.; Chen, G.; Chung, W.J.; Shon, H.K. Graphene oxide incorporated polysulfone substrate for the fabrication of flat-sheet thin-film composite forward osmosis membranes. J. Membr. Sci. 2015, 493, 496–507. [Google Scholar] [CrossRef]
- Shaban, M.; AbdAllah, H.; Said, L.; Hamdy, H.S.; Abdel Khalek, A. Titanium dioxide nanotubes embedded mixed matrix PES membranes characterization and membrane performance. Chem. Eng. Res. Des. 2015, 95, 307–316. [Google Scholar] [CrossRef]
- Lee, J.; Chae, H.R.; Won, Y.J.; Lee, K.; Lee, C.H.; Lee, H.H.; Kim, I.C.; Lee, J. Graphene oxide nanoplatelets composite membrane with hydrophilic and antifouling properties for wastewater treatment. J. Membr. Sci. 2013, 448, 223–230. [Google Scholar] [CrossRef]
- Zhang, Y.; Chung, T.S. Graphene oxide membranes for nanofiltration. Curr. Opin. Chem. Eng. 2017, 16, 9–15. [Google Scholar] [CrossRef]
- Moo, J.G.S.; Khezri, B.; Webster, R.D.; Pumera, M. Graphene oxides prepared by Hummers’, Hofmann’s, and Staudenmaier’s methods: Dramatic influences on heavy-metal-ion adsorption. ChemPhysChem 2014, 15, 2922–2929. [Google Scholar] [CrossRef]
- Gupta, B.; Kumar, N.; Panda, K.; Kanan, V.; Joshi, S.; Visoly-Fisher, I. Role of oxygen functional groups in reduced graphene oxide for lubrication. Sci. Rep. 2017, 7, 45030. [Google Scholar] [CrossRef] [PubMed] [Green Version]
- Chong, J.Y.; Wang, B.; Mattevi, C.; Li, K. Dynamic microstructure of graphene oxide membranes and the permeation flux. J. Membr. Sci. 2018, 549, 385–392. [Google Scholar] [CrossRef] [Green Version]
Figure 1.
Contact angle (a) and zeta potential (b) of GOS, GOH and GOT membranes. Error bars indicate standard deviation.
Figure 1.
Contact angle (a) and zeta potential (b) of GOS, GOH and GOT membranes. Error bars indicate standard deviation.

Figure 2.
Atomic force microscopy (AFM) surface topography of (a) GO-0 wt% (b) GOS-0.2 wt% (c) GOH-0.2 wt% and (d) GOT-0.1 wt% membrane taken at 10 × 10 μm scan area.
Figure 2.
Atomic force microscopy (AFM) surface topography of (a) GO-0 wt% (b) GOS-0.2 wt% (c) GOH-0.2 wt% and (d) GOT-0.1 wt% membrane taken at 10 × 10 μm scan area.

Figure 3.
AFM surface roughness analysis of polysulfone-graphene oxide (PSf-GO) membranes with optimum loading of GOS, GOH, and GOT measured by AFM at various scan scales showing (a) root mean square roughness, (b) arithmetic mean roughness and (c) z-range.
Figure 3.
AFM surface roughness analysis of polysulfone-graphene oxide (PSf-GO) membranes with optimum loading of GOS, GOH, and GOT measured by AFM at various scan scales showing (a) root mean square roughness, (b) arithmetic mean roughness and (c) z-range.


Figure 4.
Scanning electron microscopy (SEM) images of membrane surface of (a) GO-0 wt%, (b) GOS-0.2 wt%, (c) GOH-0.2 wt% and (d) GOT-0.1 wt% membrane. Scale bars are 2 μm for images a, b and c; and 1 μm for image d.
Figure 4.
Scanning electron microscopy (SEM) images of membrane surface of (a) GO-0 wt%, (b) GOS-0.2 wt%, (c) GOH-0.2 wt% and (d) GOT-0.1 wt% membrane. Scale bars are 2 μm for images a, b and c; and 1 μm for image d.

Figure 5.
Effect of GO type and loading on (a) Young’s modulus and (b) breakage strength of GO-PSf membranes. Error bars show sample standard deviation.
Figure 5.
Effect of GO type and loading on (a) Young’s modulus and (b) breakage strength of GO-PSf membranes. Error bars show sample standard deviation.

Figure 6.
Pure water flux at 2 bar (a) and porosity (b) of GO modified membranes. Error bars show sample standard deviation.
Figure 6.
Pure water flux at 2 bar (a) and porosity (b) of GO modified membranes. Error bars show sample standard deviation.

Figure 7.
Oil-emulsion flux at 2 bar (a) and oil rejection (b) of PSf-GO modified membranes.


Table 1.
X-ray photoelectron spectroscopy (XPS) atomic composition and X-ray diffraction (XRD) interlayer spacing for graphene oxide (GO) variations; GOS, GOH and GOT.
Table 1.
X-ray photoelectron spectroscopy (XPS) atomic composition and X-ray diffraction (XRD) interlayer spacing for graphene oxide (GO) variations; GOS, GOH and GOT.
| Atomic % 1 | |||
|---|---|---|---|
| GOS | GOH | GOT | |
| C1s C–C/C=C | 14.8 | 7.1 | 10.4 |
| C1s C–O (epoxy) | 11.5 | 25.3 | 20.5 |
| C1s C=O (carbonyl) | 28.4 | 11.3 | 14.6 |
| C1s O–C=O (carboxyl) | 14.2 | 17.3 | 16.9 |
| O1s C=O | 22.1 | 23.0 | 26.8 |
| O1s C–O | 9.0 | 11.7 | 6.7 |
| C/O Ratio | 2.2 | 1.8 | 1.9 |
| GO interlayer spacing (Å) | 7.7 | 8.7 | 9.1 |
1 The functional group values obtained from XPS were normalized to omit the nitrogen values which did not exceed 1.2% in any sample.
© 2019 by the authors. Licensee MDPI, Basel, Switzerland. This article is an open access article distributed under the terms and conditions of the Creative Commons Attribution (CC BY) license (http://creativecommons.org/licenses/by/4.0/).
Share and Cite
MDPI and ACS Style
Sali, S.; Mackey, H.R.; Abdala, A.A. Effect of Graphene Oxide Synthesis Method on Properties and Performance of Polysulfone-Graphene Oxide Mixed Matrix Membranes. Nanomaterials 2019, 9, 769. https://doi.org/10.3390/nano9050769
AMA Style
Sali S, Mackey HR, Abdala AA. Effect of Graphene Oxide Synthesis Method on Properties and Performance of Polysulfone-Graphene Oxide Mixed Matrix Membranes. Nanomaterials. 2019; 9(5):769. https://doi.org/10.3390/nano9050769
Chicago/Turabian StyleSali, Safae, Hamish R. Mackey, and Ahmed A. Abdala. 2019. "Effect of Graphene Oxide Synthesis Method on Properties and Performance of Polysulfone-Graphene Oxide Mixed Matrix Membranes" Nanomaterials 9, no. 5: 769. https://doi.org/10.3390/nano9050769
Note that from the first issue of 2016, this journal uses article numbers instead of page numbers. See further details here.