3.1. Analysis of Surface Composition Using XPS Spectroscopy
The Ti2p signal of TiO
2 at 458.5 eV was used for calibrating the binding energy of the spectra. By observing chemical displacements in binding energies, we can confirm their state of oxidation and the species present. The first samples analyzed were the untreated grade IV samples (black line), grade IV treated (red line), grade V untreated (green line), and grade V treated (blue line). The spectra obtained are shown in
Figure 2. In this figure, we can observe (a) the general spectrum for grade IV and V samples, where the presence of elements Na, C, Ti, O, Ca, and Si (with their corresponding main, secondary and Auger peaks) is evident in the grade IV samples and where, in the grade V ones, we can see the presence of Na, C, Ti, O, N, Ca, Si, S, P, and Al.
In section (b) of
Figure 2, we can observe the 2p doublet of titanium, encountering the main peak, Ti2p3/2 at a binding energy of 458.5 eV (which indicates the presence of Ti
4+); the secondary one at 462.5 eV and a satellite between 445 and 452 eV. In the untreated grade V sample, a peak was observed between 452 and 456 eV due to the presence of Ti–C bonds.
In section (c), we find the region corresponding to the 1 s peak for oxygen, with its highest energy peak at 530 eV corresponding to the Ti–O bond of titanium oxide and in the untreated grade V sample, we can see a shoulder in the main peak between 517.5 and 523 eV.
In section (d), we can see the region where the peak corresponding to C1s is, its main peak being at 284.9 eV due to the simple bonds C–C and C–H, and its satellite between 275 and 278 eV. Together with the main peak, a shoulder appears at 288.6 eV, which corresponds to the species –CCO–. Furthermore, in the untreated grade V sample, a signal can be seen between 280 and 285.5 eV, which could correspond to the species TiC [
47].
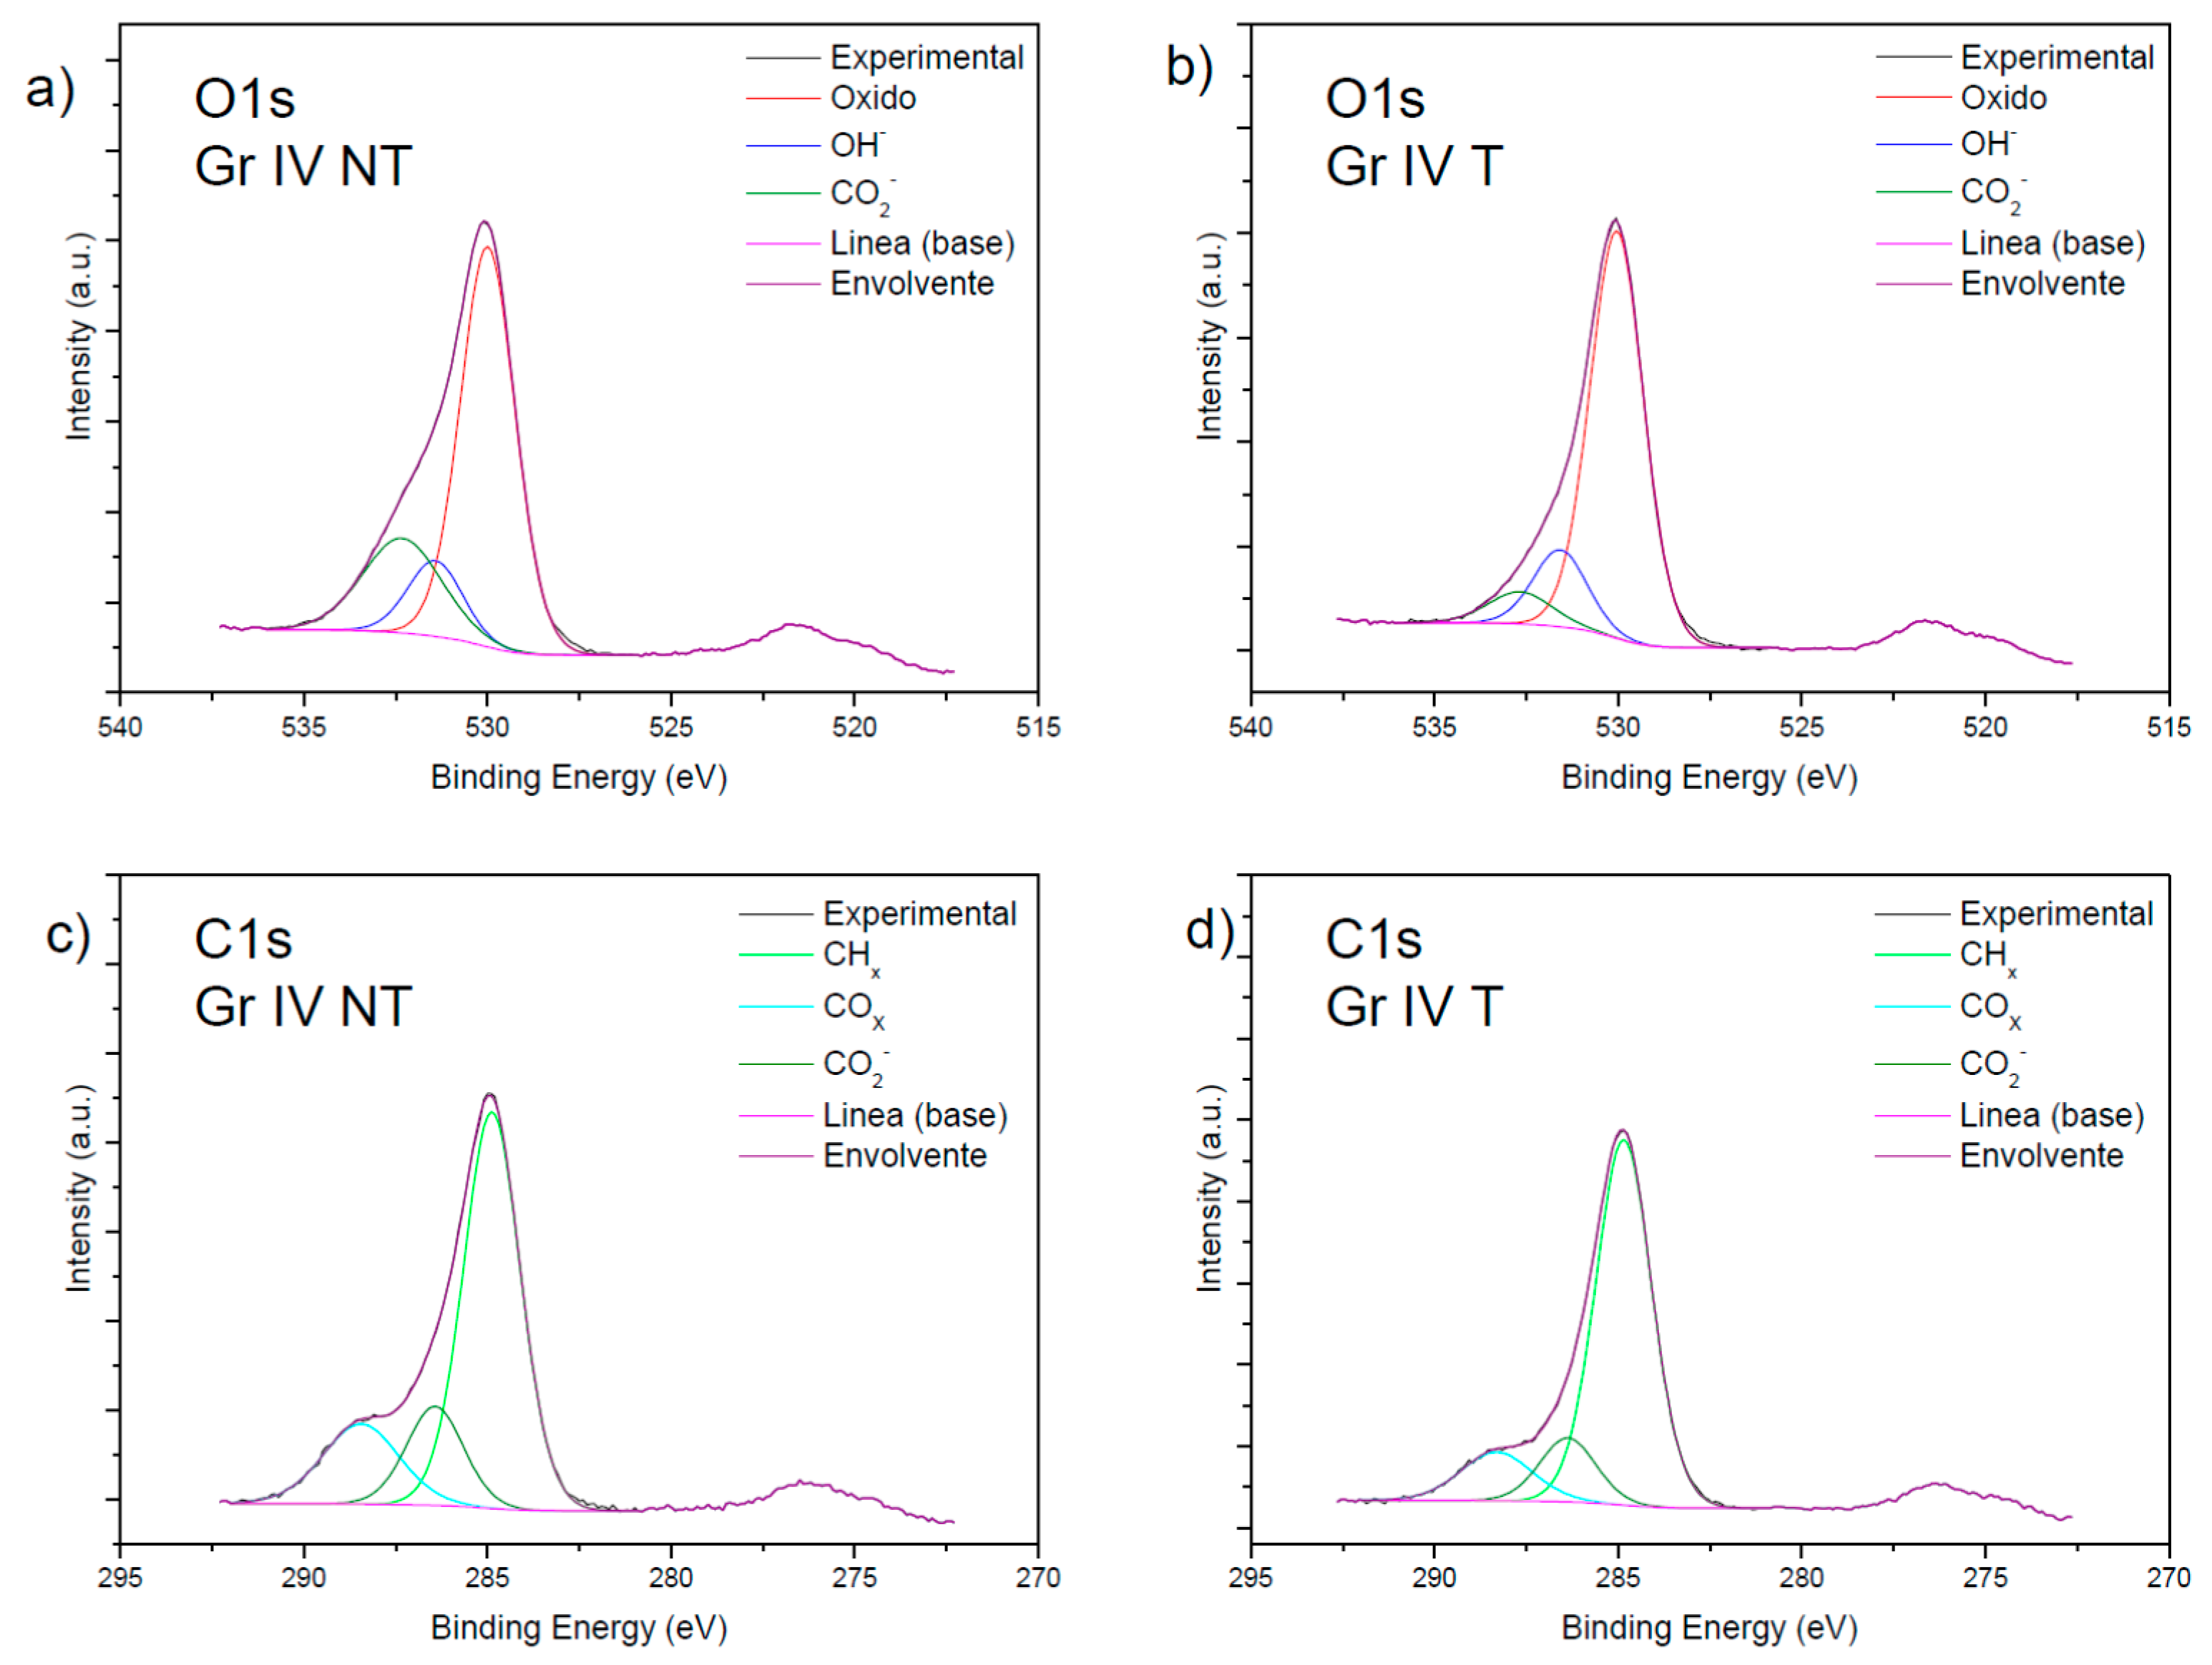
In
Figure 3, the species present in the oxygen and the carbon of the grade IV samples are studied. In sections (a) and (b), it is possible to observe the species formed by the oxygen in the untreated and treated grade IV sample, respectively, which are oxide (=O), hydroxide (–OH), and carboxylates (–COO–).
In sections (c) and (d), the species of C–H (hydrocarbons), –C=O (from ketones or aldehydes) and –COO– (carboxylates), formed by the carbon in the untreated and treated grade IV sample respectively, are shown.
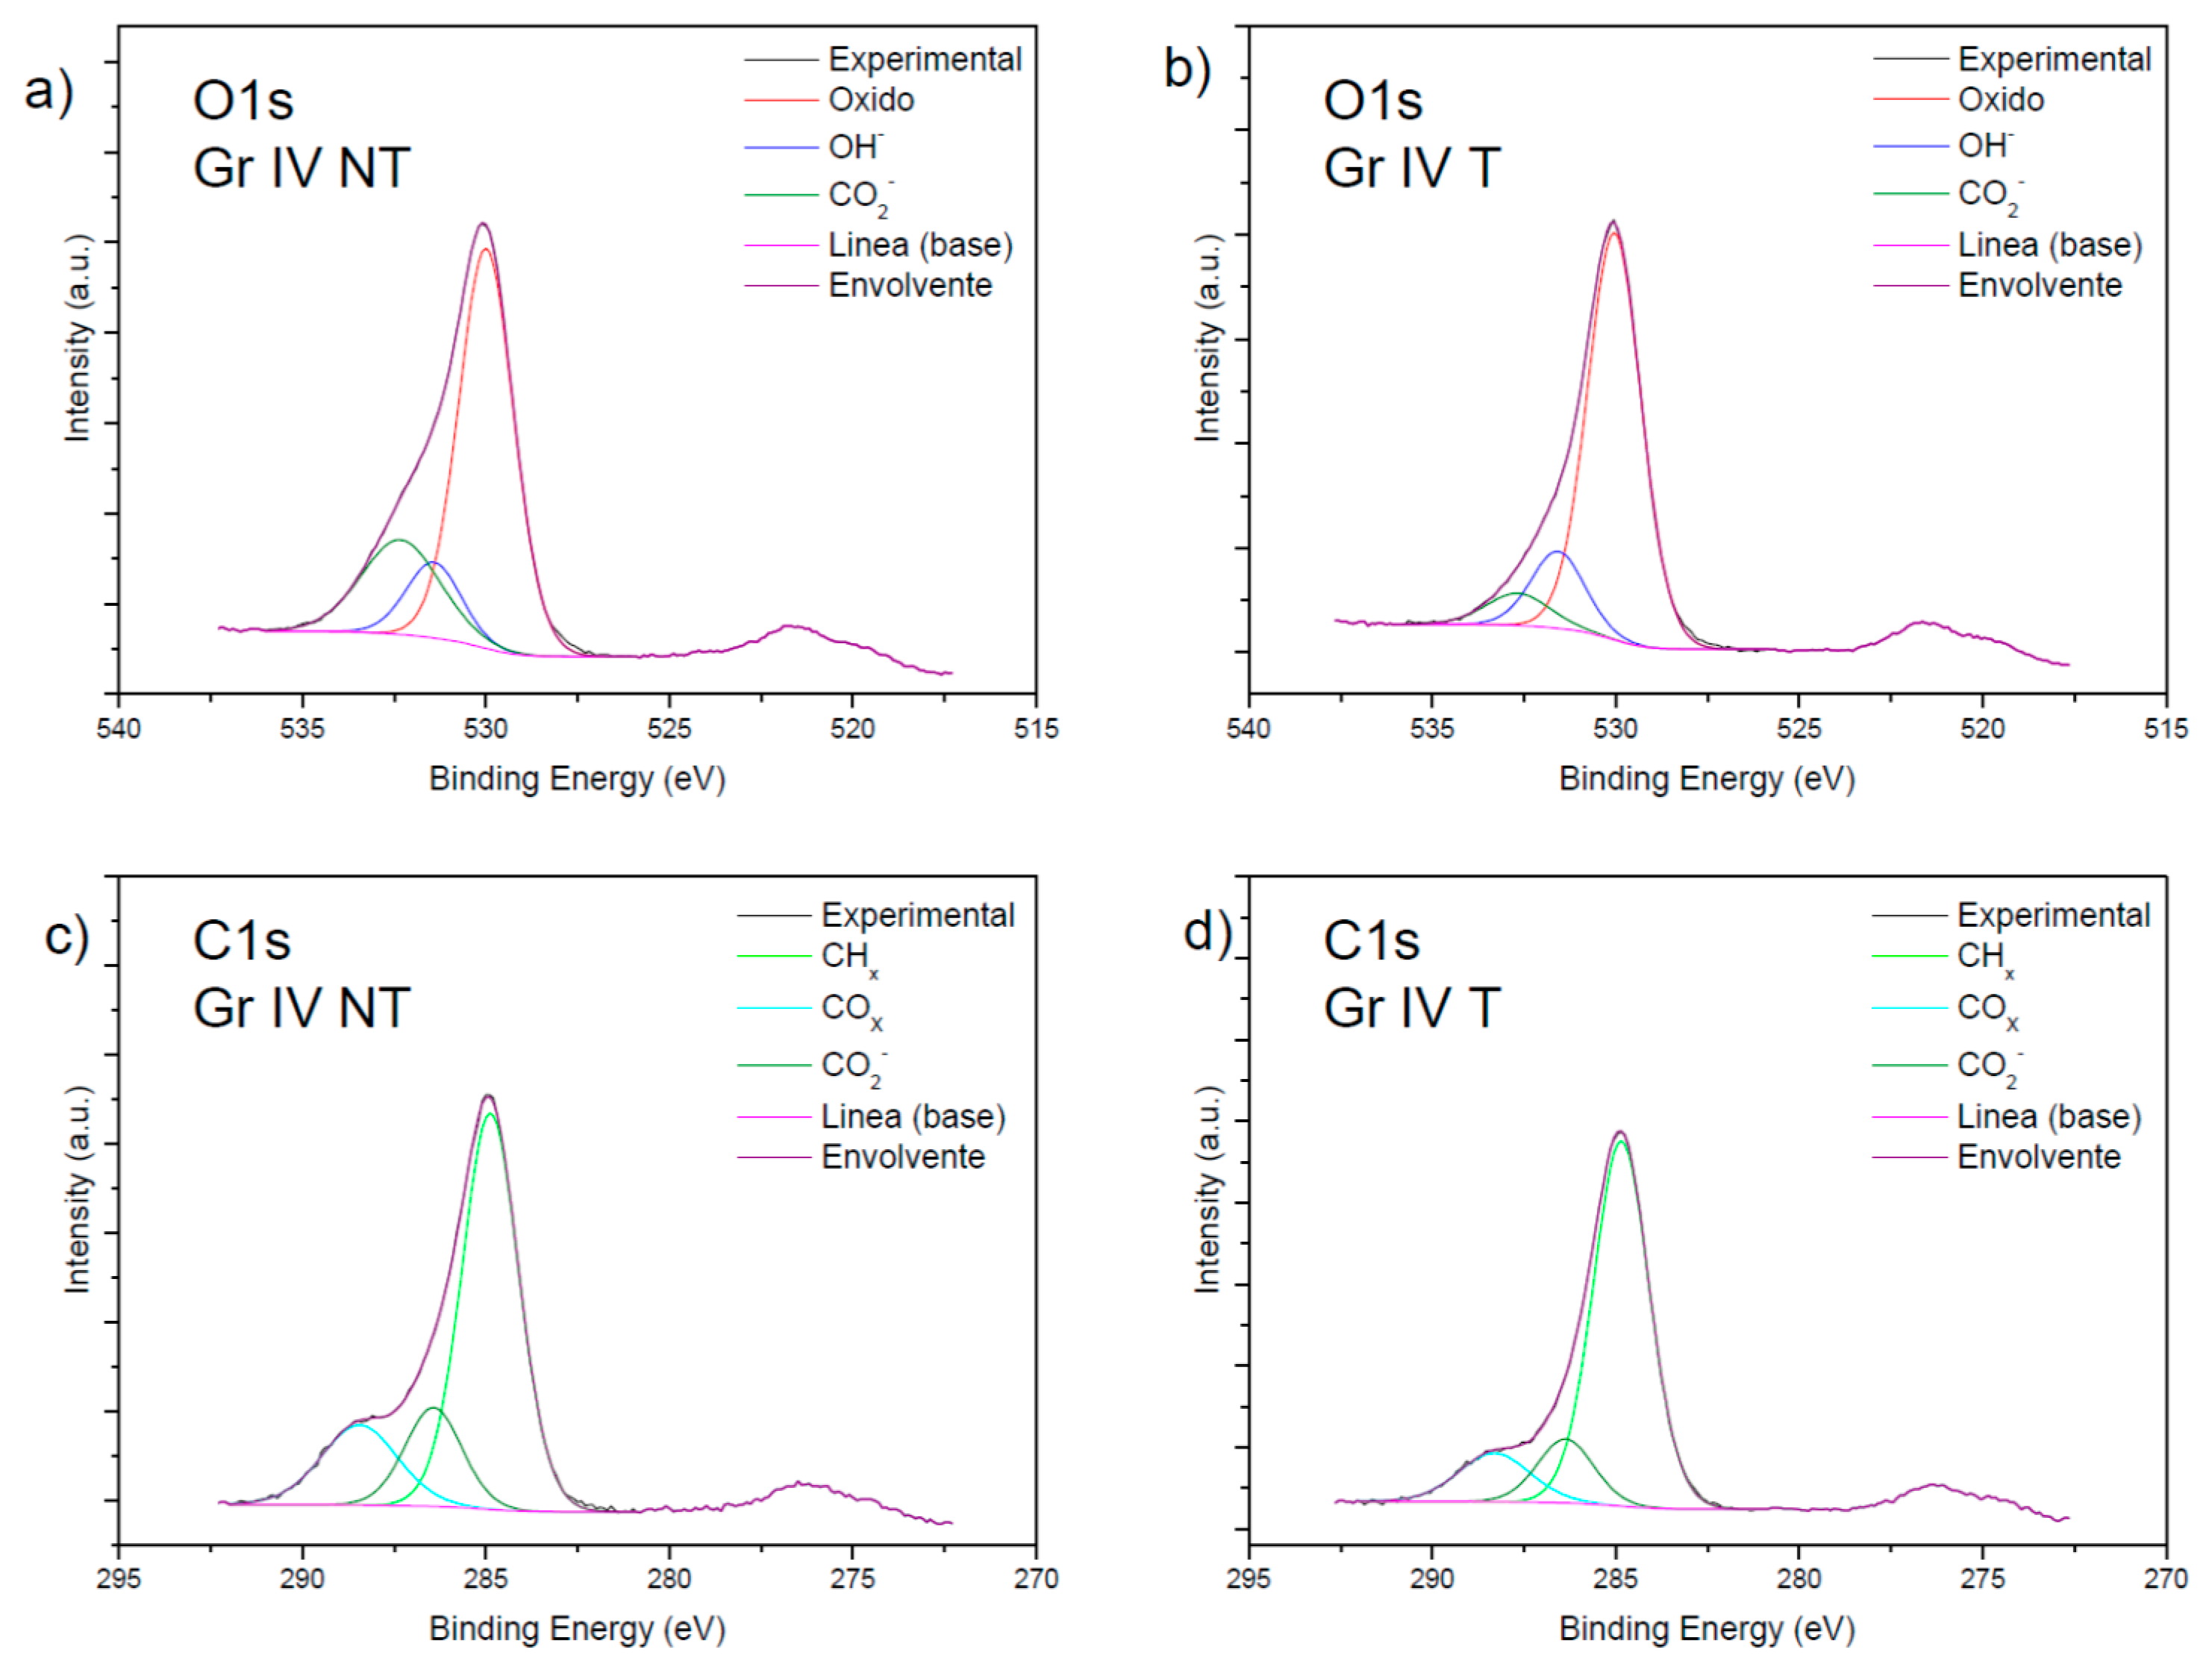
In
Figure 4, the regions of oxygen and carbon, with the respective species present in them for the treated and untreated grade V samples, were studied. In sections (a) and (b), we see the oxygen region with species of oxides (O
−2), hydroxides (OH
−), and carboxylates (CO
2−).
Sections (c) and (d) show the carbon region, where species of hydrocarbon (CHX), carbon oxides (COx), carboxylates (CO2−) are observed and, only in sample c), titanium carbide (TiC), were studied. The presence of TiC was deduced by observing the new signals at 280–282.5 eV on the green line in section (d), and the signal at 452–456 eV on the green line in section (b).
Table 2 shows the concentrations of the elements present in the treated and untreated grade IV and V samples. It can be seen that the majority elements were Ti, O and C. On the other hand, a larger amount of oxygen can be seen in all the samples compared to titanium. The oxygen which did not form titanium oxide may have formed carbonates, acids, aldehydes, ketones or alcohols with carbon, which was present in large quantities. Al was present in the concentrations of grade V and silicon in those of grade IV.
With regard to the analysis of the surface composition using XPS spectroscopy in the samples with a film of TiO
2, the elements that appeared were Ti, O and C. Moreover, in the treated samples, calcium appeared on the surface. A large amount of C can be seen on the surface and inside the layer deposited (
Table 3).
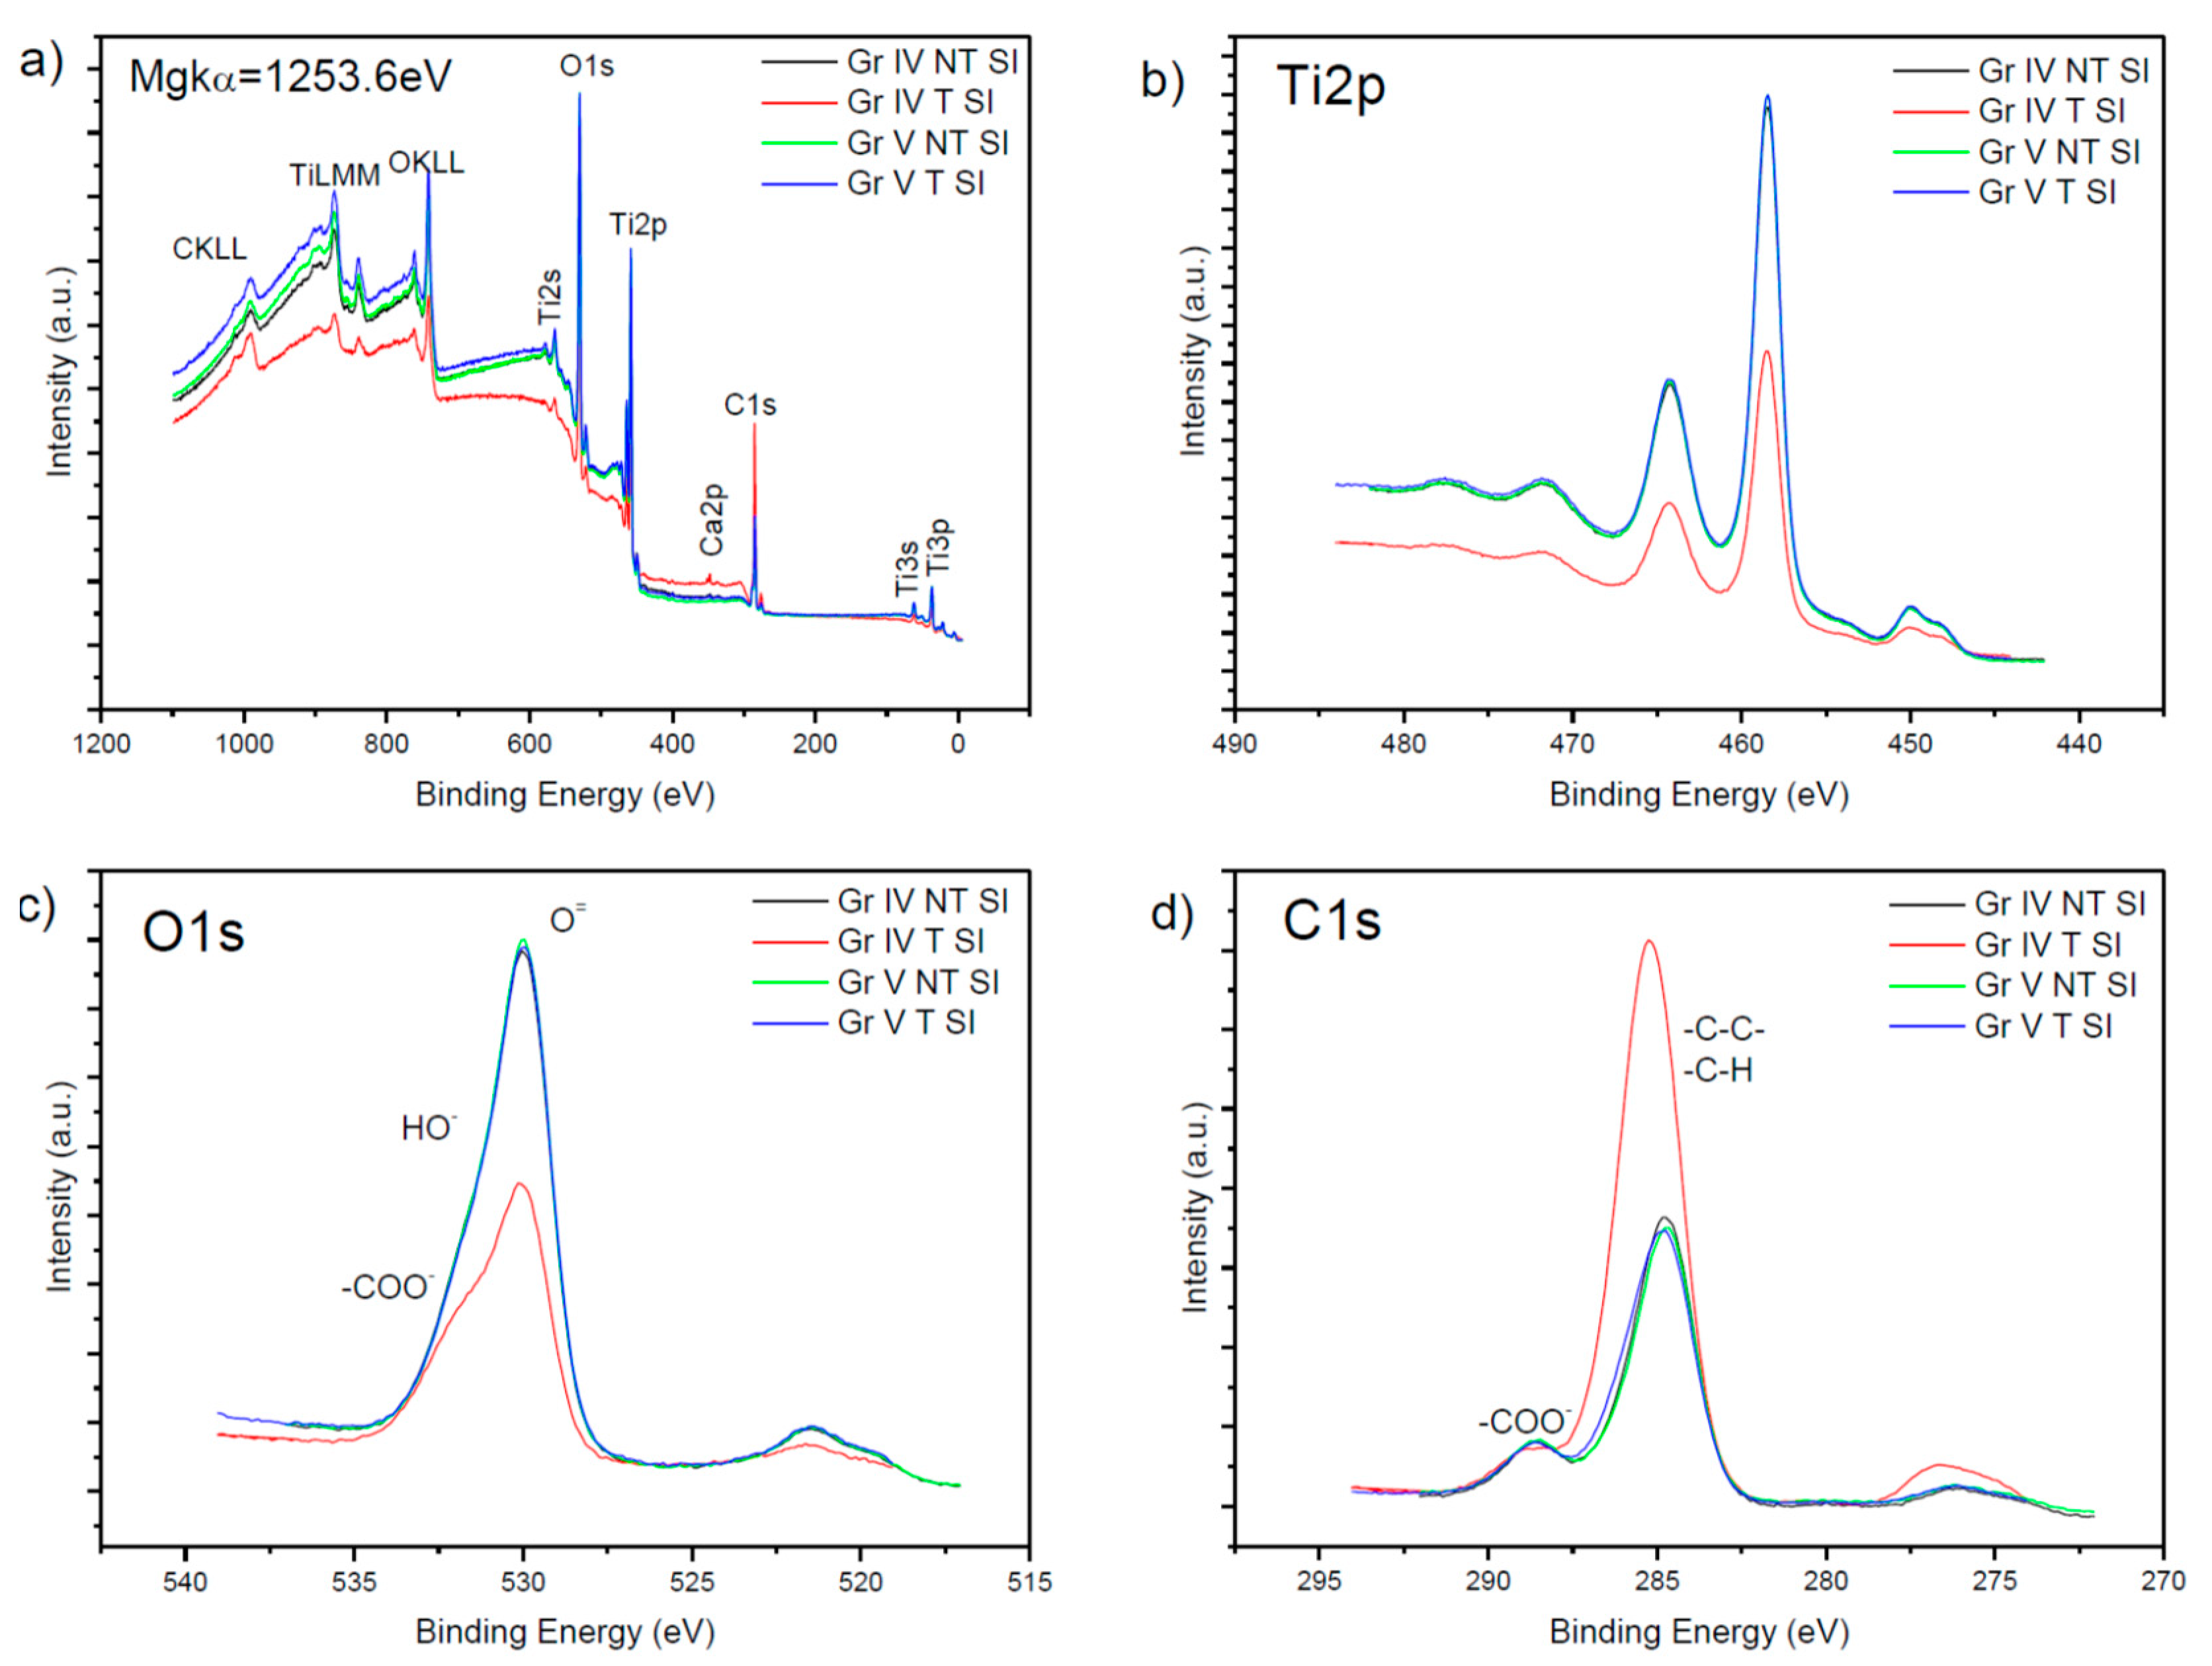
In
Figure 5, the spectra of the grade IV and V sample are compared with TiO
2. In section (a), the general spectrum with elements Ti, O, C, and Ca can be seen.
In section (b), the two 2p peaks of titanium can be seen, the main and most intense one being Ti2p3/2 at a binding energy of 458.5 eV, which indicates the presence of Ti4+, which is consistent with the layer of TiO2, and a secondary less intense one, Ti2p5/2, at 462.5 eV, which were half as intense as both the main peak and the secondary one in the grade IV T SI. Furthermore, a satellite can be seen between 452–455 eV.
Section (c) shows the region corresponding to the 1s oxygen peak with its highest energy peak at 530.8 eV corresponding to the Ti–O bond in titanium oxide and its respective satellites at 522.5 eV, the main peak in the grade IV T SI sample being half as intense, and we can also see a shoulder between 531 and 533 eV corresponding to double and simple bonds between oxygen and carbon, which is broader in this latter sample.
Finally, in section (d), we can see the region where the 1s carbon peak can be found, its main peak being at 284.9 eV and at 285.6 eV in the grade IV T SI sample and its satellites near to 277 eV, we can also see that the main peak of the grade IV T SI sample is twice as intense. Together with the main peak a shoulder appears at 288.6 eV in grade IV NT SI, which corresponds to the species –COO–.
Table 3 shows a significant amount of C in the form of C–H and O, combined with C. The O/Ti ratio is very similar in the treated and untreated grade V samples, however, in the grade IV samples, there is a greater difference between treated and untreated, and this ratio increases in the treated samples.
The C/Ti ratio increased in the treated samples, the treated grade IV sample being the one presenting a greater C/Ti ratio, and the untreated sample of the same grade in turn presented a C/Ti ratio higher than those in grade V. When comparing
Table 2 and
Table 3, a decrease of the O/Ti ratio is seen and in turn, there is an increase in the C/Ti ratio.
By comparing the original samples with those presenting a layer of titanium oxide, it is confirmed that the surface is equally composed of titanium, oxygen, and carbon. It can also be observed that the bands of these elements have relatively similar intensities to the original samples in the case of the grade IV samples, whereby the untreated one is more intense, and they vary compared to the intensity of the grade V samples.
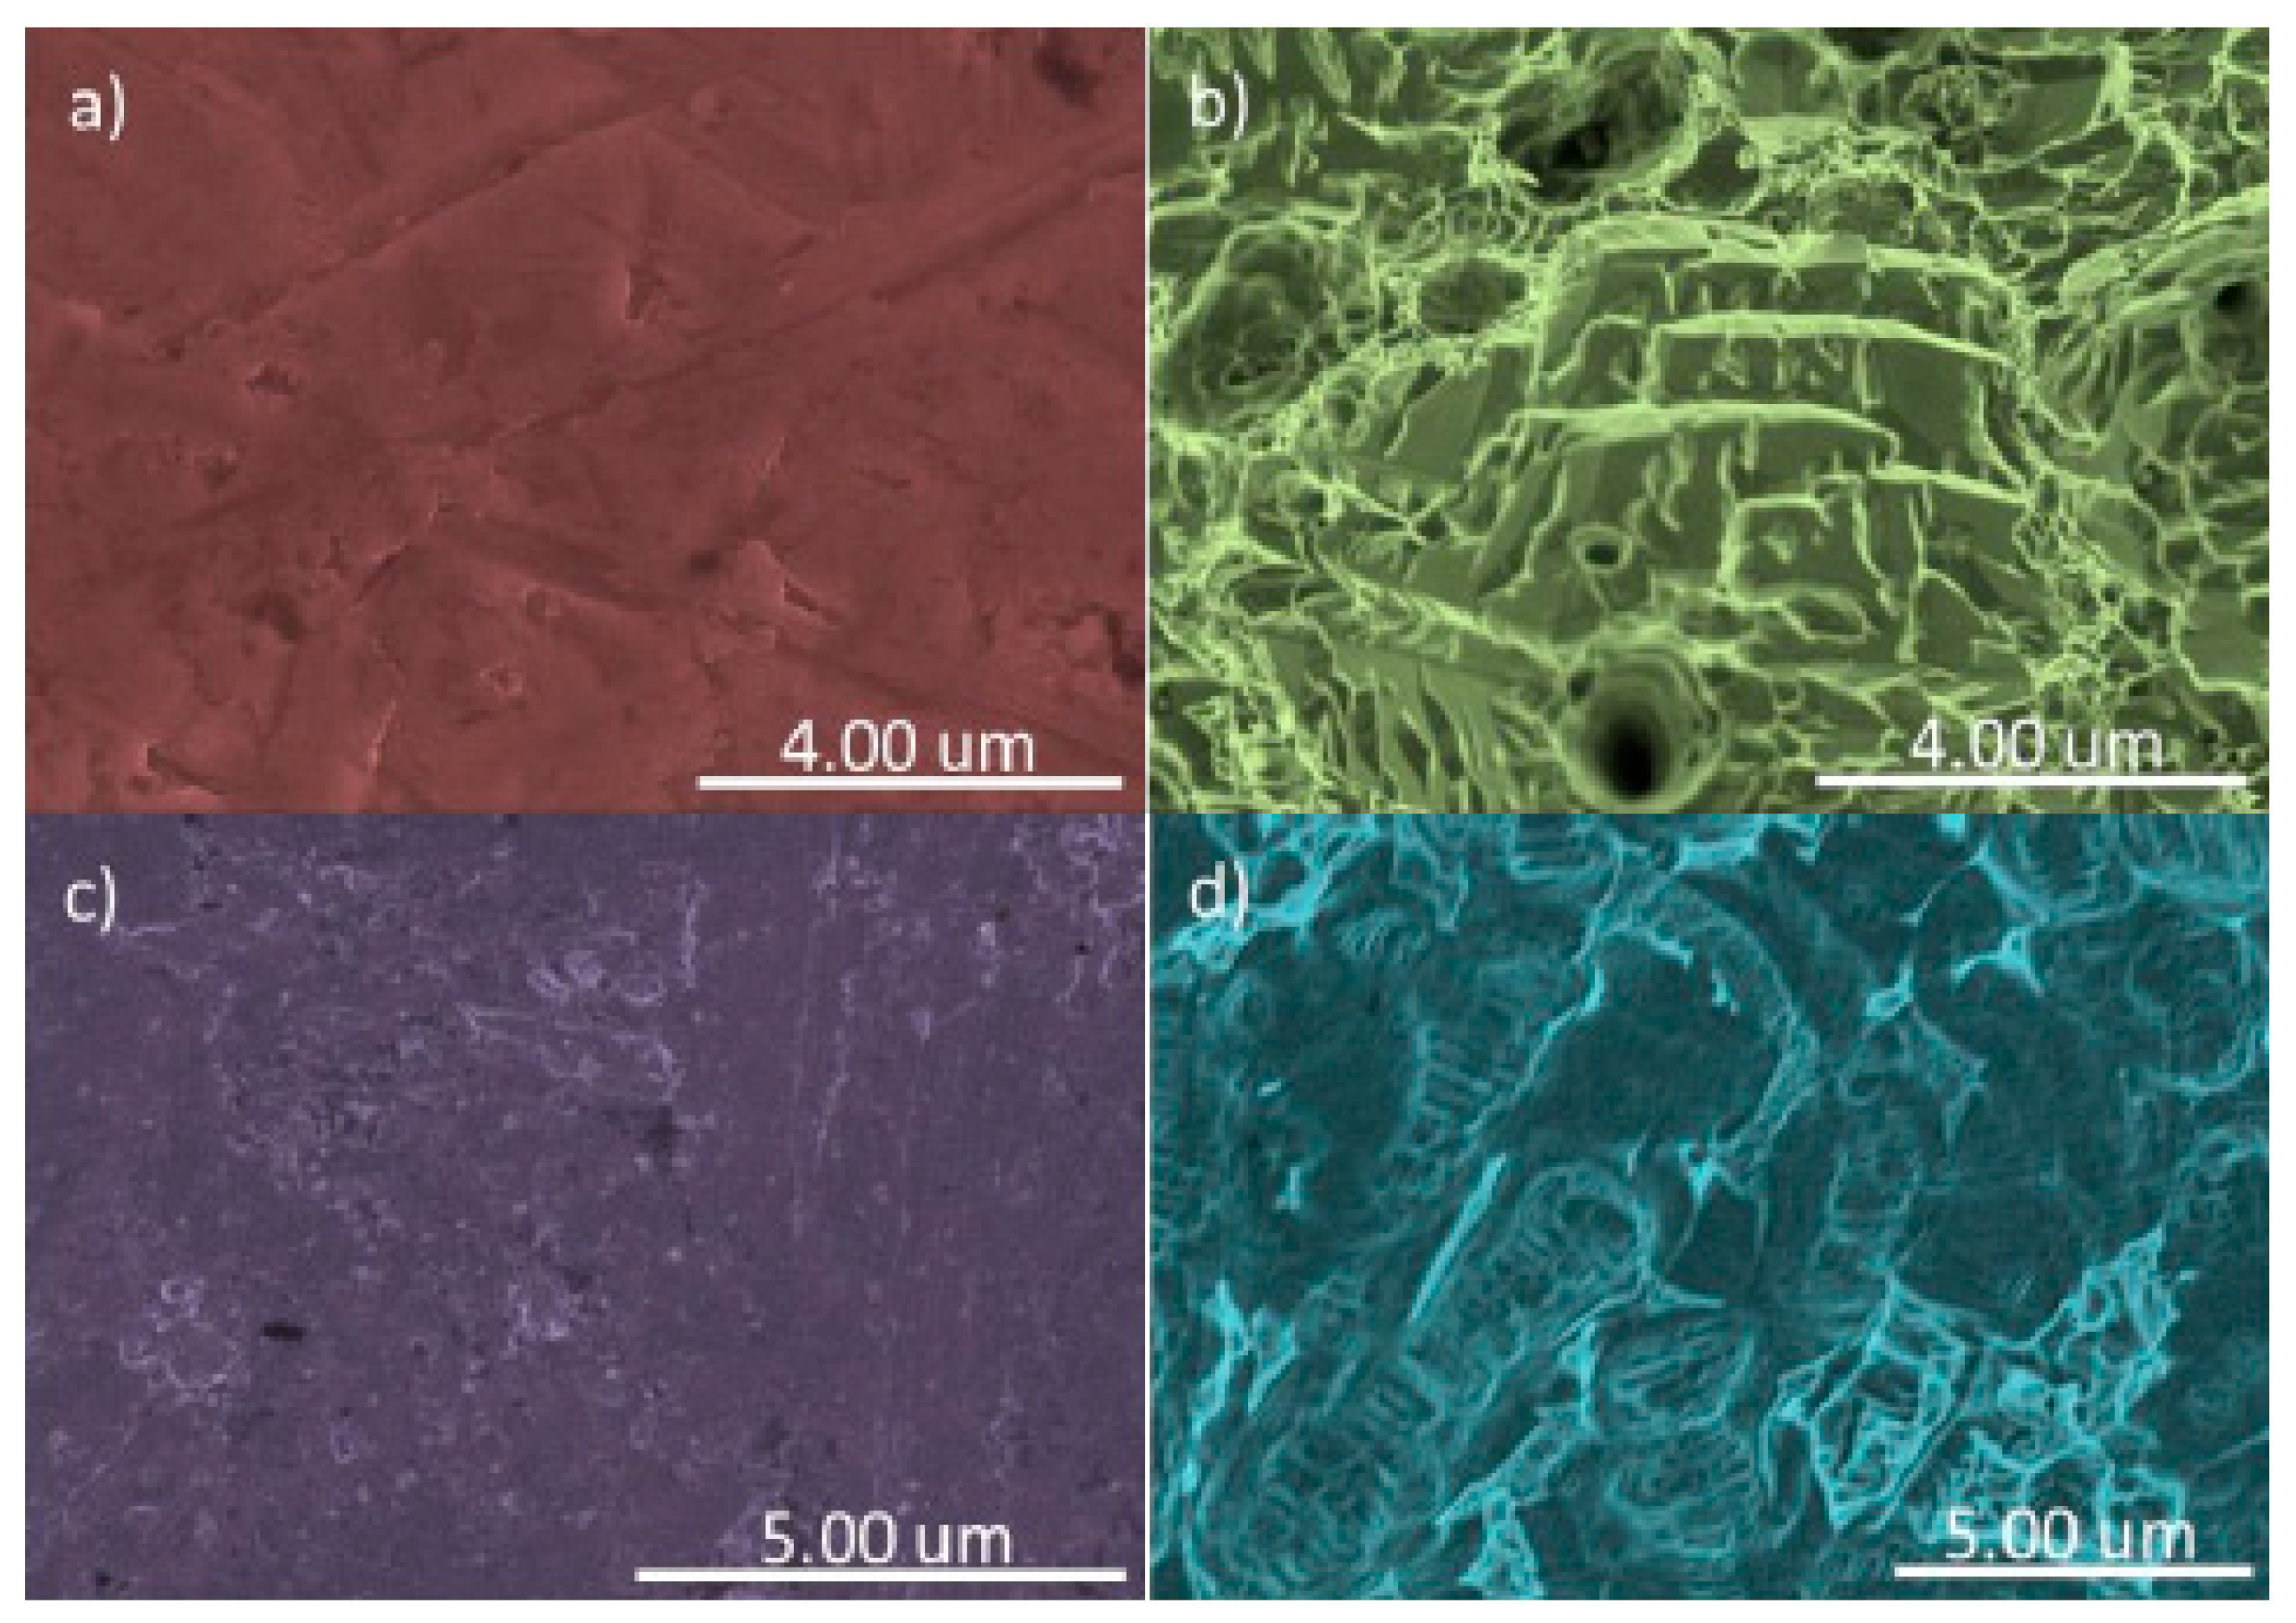
3.2. Surface Analysis of Samples by Scanning Electron Microscopy (SEM)
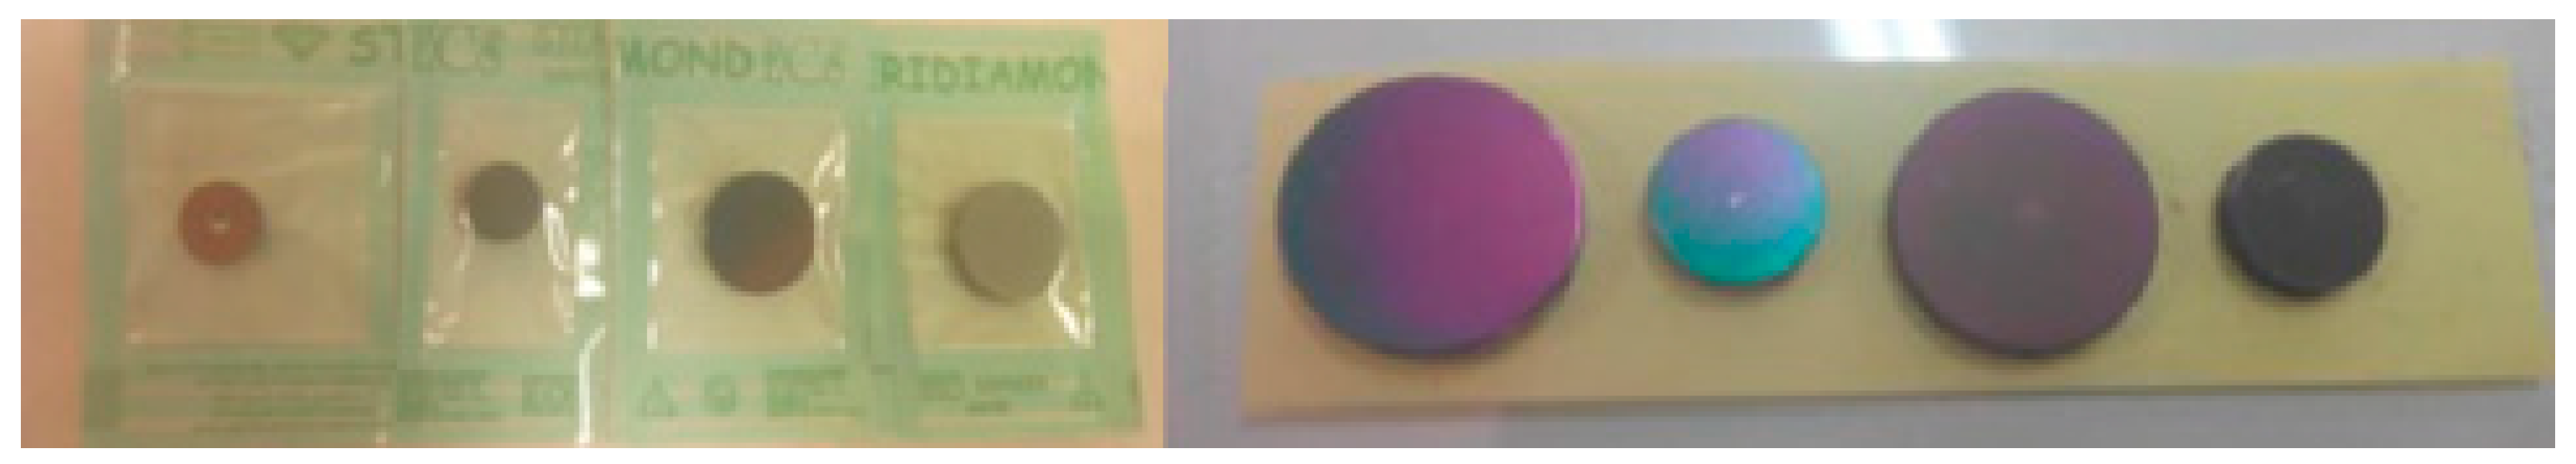
On the untreated grade IV samples, a homogeneous surface with low roughness was present, whereby no repeated patterns are seen on the surface and it presents typical machining defects, differing from the treated grade IV sample, where an image can be seen with greater surface roughness with unevenness, crests, and flat areas of the order of a micron (1–4) distributed evenly over the surface due to the double etching electrolytic treatment, patterns repeated across the surface. In the untreated grade V sample, a slightly rough and homogeneous structure can be seen, just as in the untreated grade IV sample, with characteristic machining marks and defects; at the same time, the treated grade V sample presents surface roughness in the form of small hillocks and hollows of around 500 nm uniformly distributed over the surface, these patterns repeating on the surface due to texturing treatment.
Figure 6 and
Figure 7 show the surfaces of the samples using SEM.
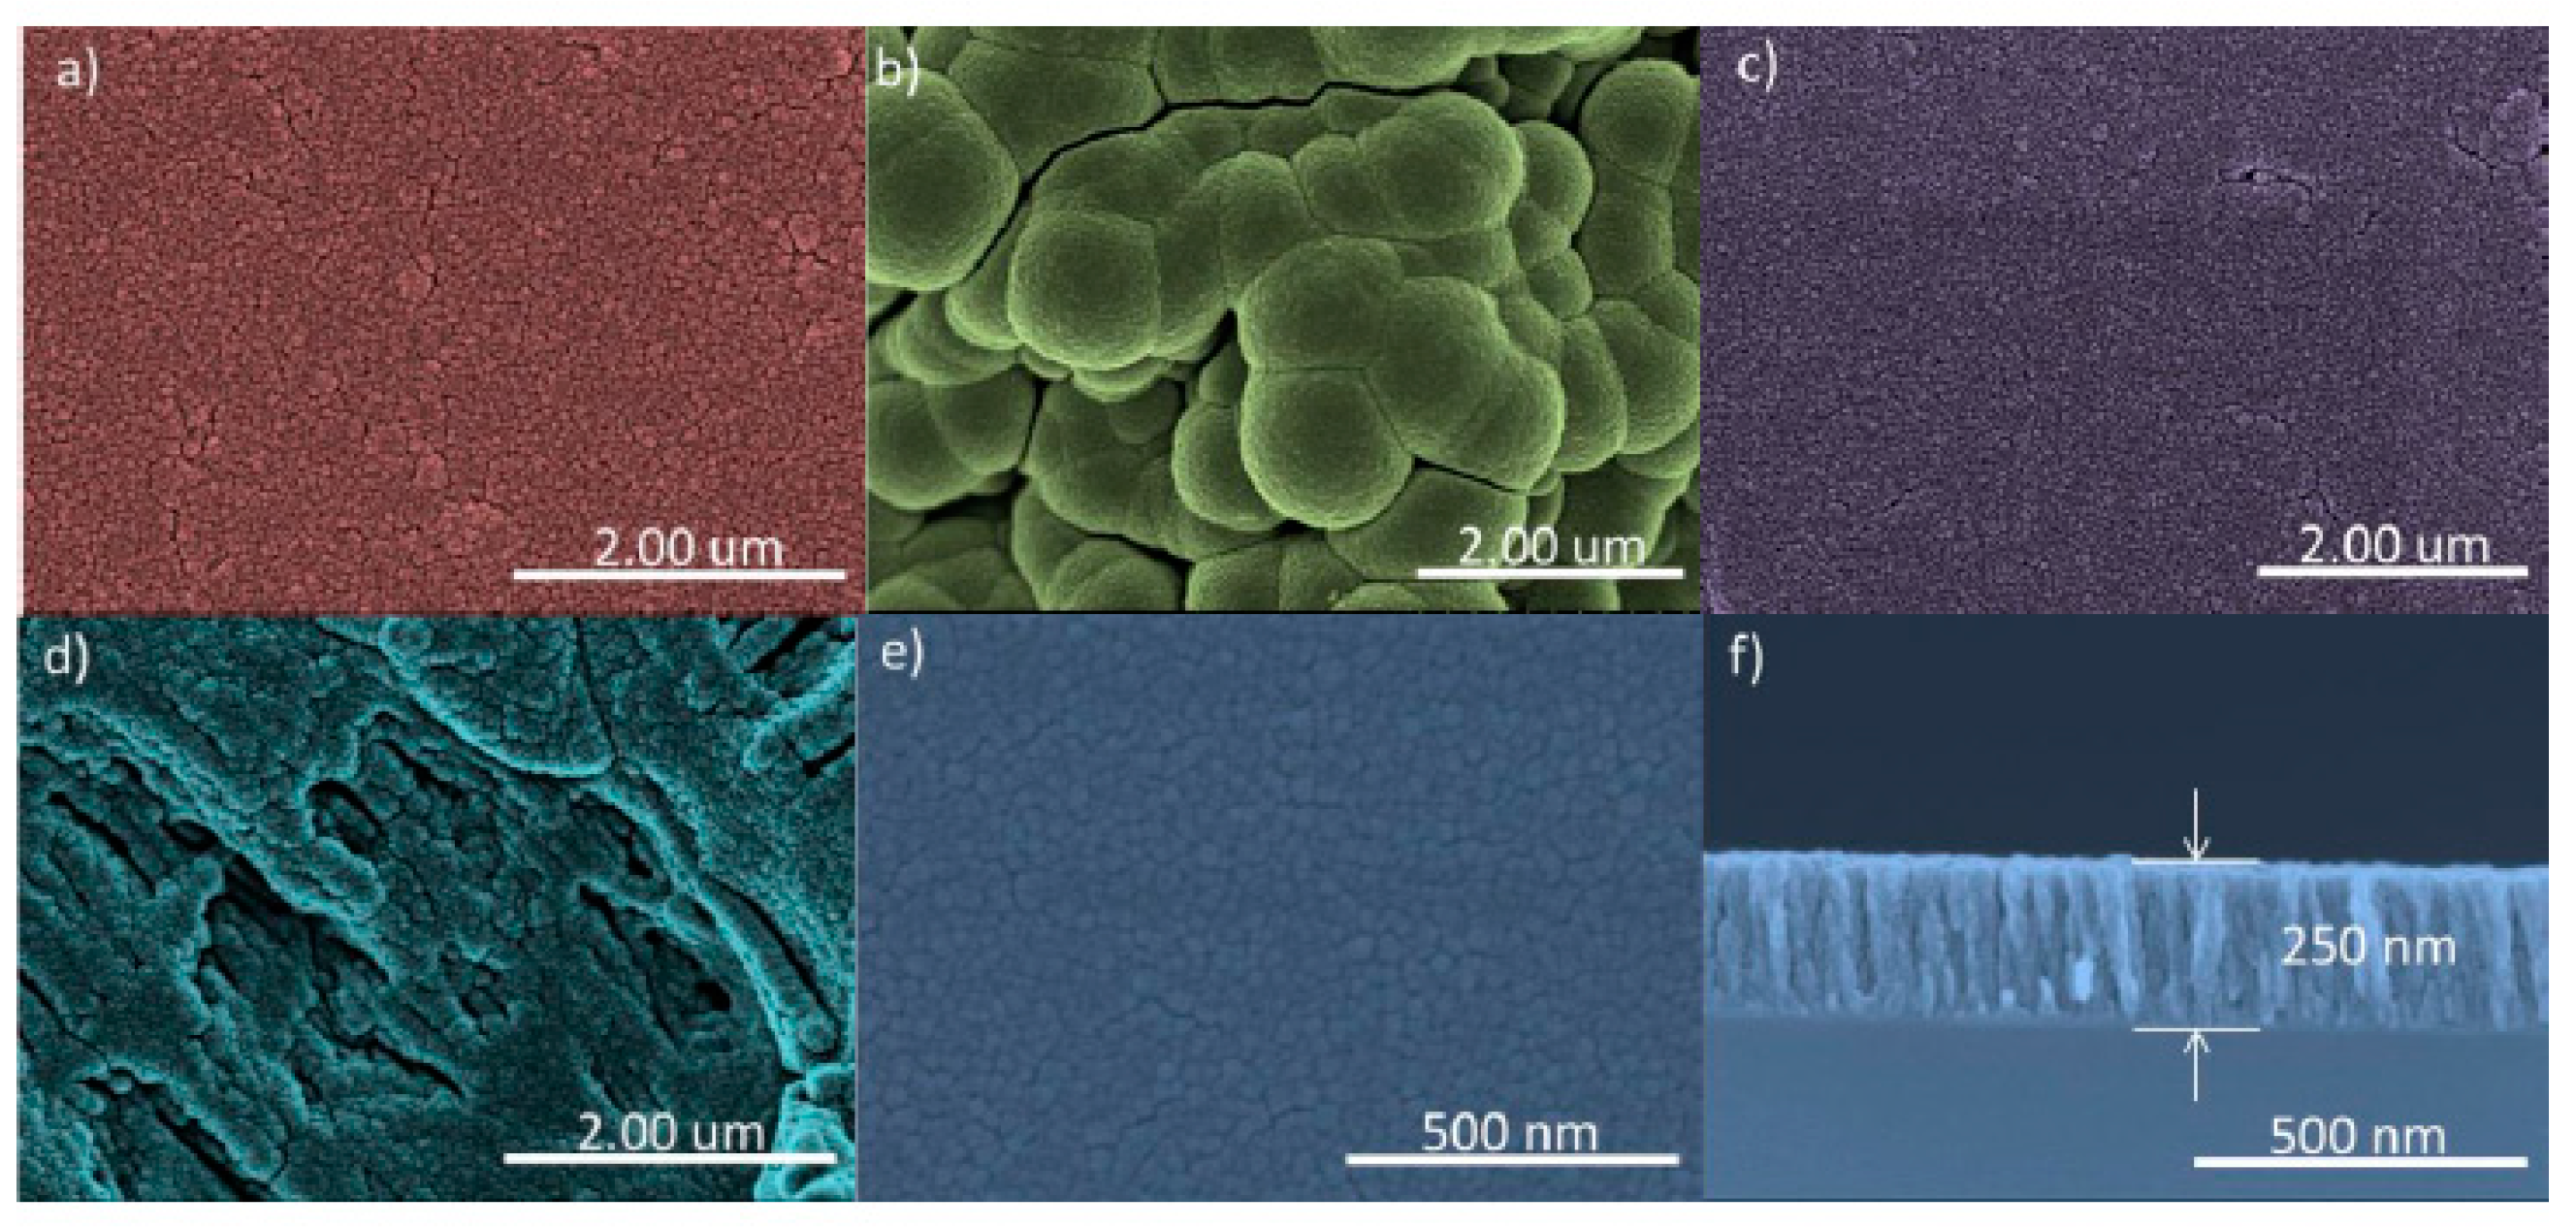
Compared to the surface analysis of the samples on which a nanocolumnar film of TiO
2 was created using scanning electron microscopy (SEM), to calculate the thickness of these films of nanocolumnar titanium oxide, a reference sample of silicon was used. The cross-section of the silicon reference sample (100) can be seen and the thickness value of the film was obtained, which was around 250 nm. The grade IV NT SI and grade V NT SI samples presented a homogeneous surface (
Table 4 and
Table 5). The distribution of the pillars of titanium oxide over the whole surface can be seen. On the other hand, in the grade V NT SI sample, on the front and cross-section images of the TiO
2 film on the silicon wafer (100), a clear difference in the morphology and the size of the film patterns can be observed. The grade IV T SI sample presents a new morphology with globular agglomerations of the pillar arrays of TiO
2, distributed over the surface. These new patterns must be due to the initially treated surface of the sample favoring the growth over the troughs and crests of the sample. However, in the grade V T SI, the obtained image shows that the surface troughs and crests were accentuated compared to the grade V T, coating the troughs and crests of the original surface of the sample.
Figure 7 shows the surfaces of the TiO
2 samples using SEM. The roughness profiles can be seen in
Figure 8 and
Figure 9.
3.5. Measurement of Surface Energy and Wettability of the Samples
Table 8 shows the total surface tension and their two components, dispersive and polar, contact angles and roughness factor. It can be seen that the surface tension of the treated grade IV sample was much greater than the other tensions, the untreated grade IV sample being the one with the lowest surface tension. The grade V samples presented a similar surface tension to each other (37.8 and 39.4 mN/m). On the other hand, it can be seen that the water contact angles were greater in the treated grade IV and V samples compared to the untreated ones. Regarding diiodomethane contact angles, the grade IV T sample presents the lowest angle (more oleophilic behavior) and the grade V T sample the greatest angle (less oleophilic), presenting a similar value in the case of the untreated ones of both grades. On the other hand, it can be seen that the Rw roughness factor increased in the treated sample, as did its ideal water contact angle.
The untreated samples presented hydrophilic surfaces and were less oleophilic than the treated ones. Furthermore, the Rw roughness factor and the contact angle were present, involving a totally flat surface without roughness.
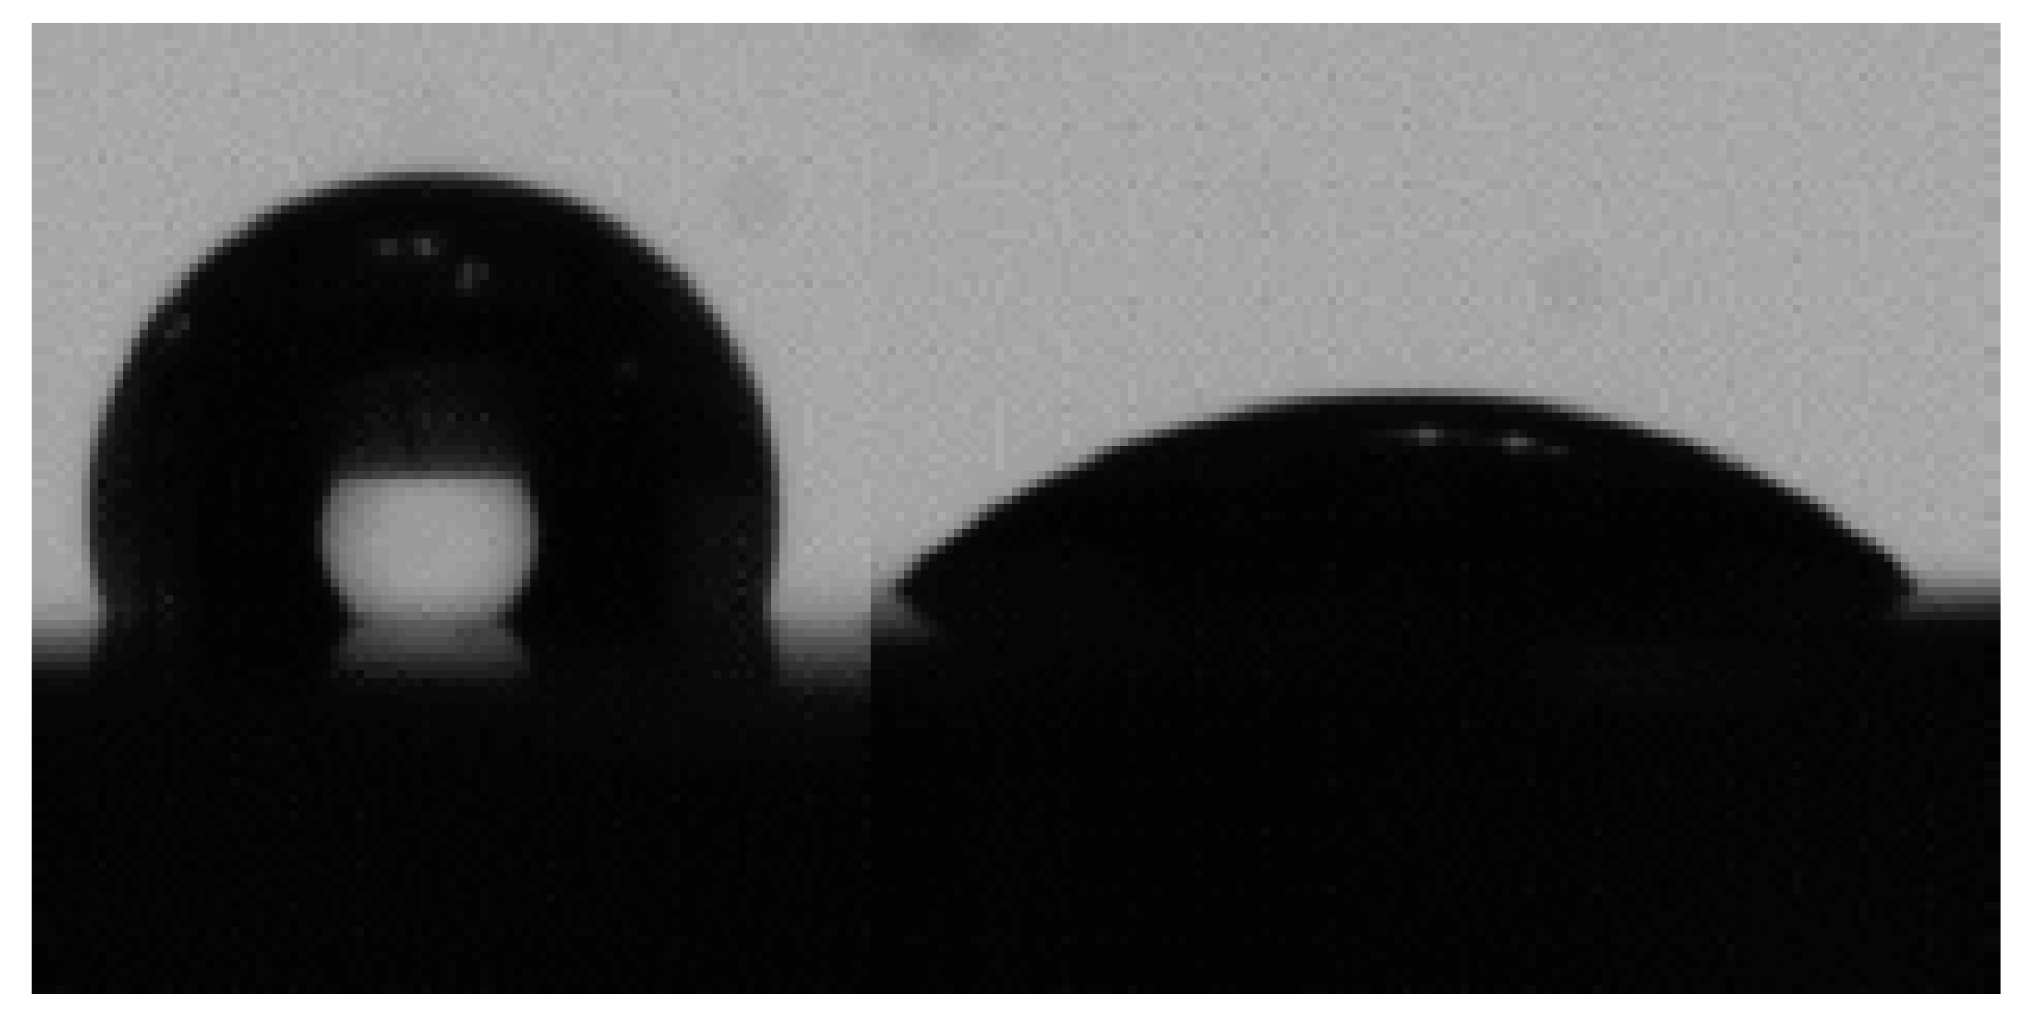
Regarding the measurement of surface energy and the wettability of the nanocolumnar TiO
2 treated samples, in
Figure 10, we can see a drop of water (left) and a drop of diiodomethane (right) on the grade IV TiO
2 treated sample, observing the hydrophobic behavior with a water contact angle greater than 90° (106.7°). This value, as well as the surface tension, increased compared to the same untreated sample. The drop of diiodomethane presented a low contact angle (43.6°), corresponding to an oleophilic behavior and remaining constant compared to the sample with no titanium oxide film. Surface tension enhancement was accompanied by an increase of its polar component with the TiO
2 coating. However, the dispersive component only increased for the grade V T SI, which led to the greatest surface tension.
The grade IV T SI sample is a special case which presented a lower surface tension than the grade V T SI sample, which may be due to the greater concentration of surface carbon. On the other hand, the contact angle or the wetting of the surface both with water and diiodomethane from which the surface tension was determined is shown. It can be seen that the samples with prior treatment both the grade IV and the grade V ones were much more hydrophobic and less oleophilic than the ones that did not present initial treatment. On comparing the roughness factor and ideal angle values, the ratio between roughness and contact angles can be seen, confirming the increase in hydrophobicity by the addition of the titanium oxide film, thus increasing roughness (
Table 9).
3.6. Study of Photoactivity of the Sample Surfaces Using UV Irradiation
A decrease in the water contact angle was observed over time by irradiating the samples, with UV irradiation of 0.038–0.048 Wcm−2.
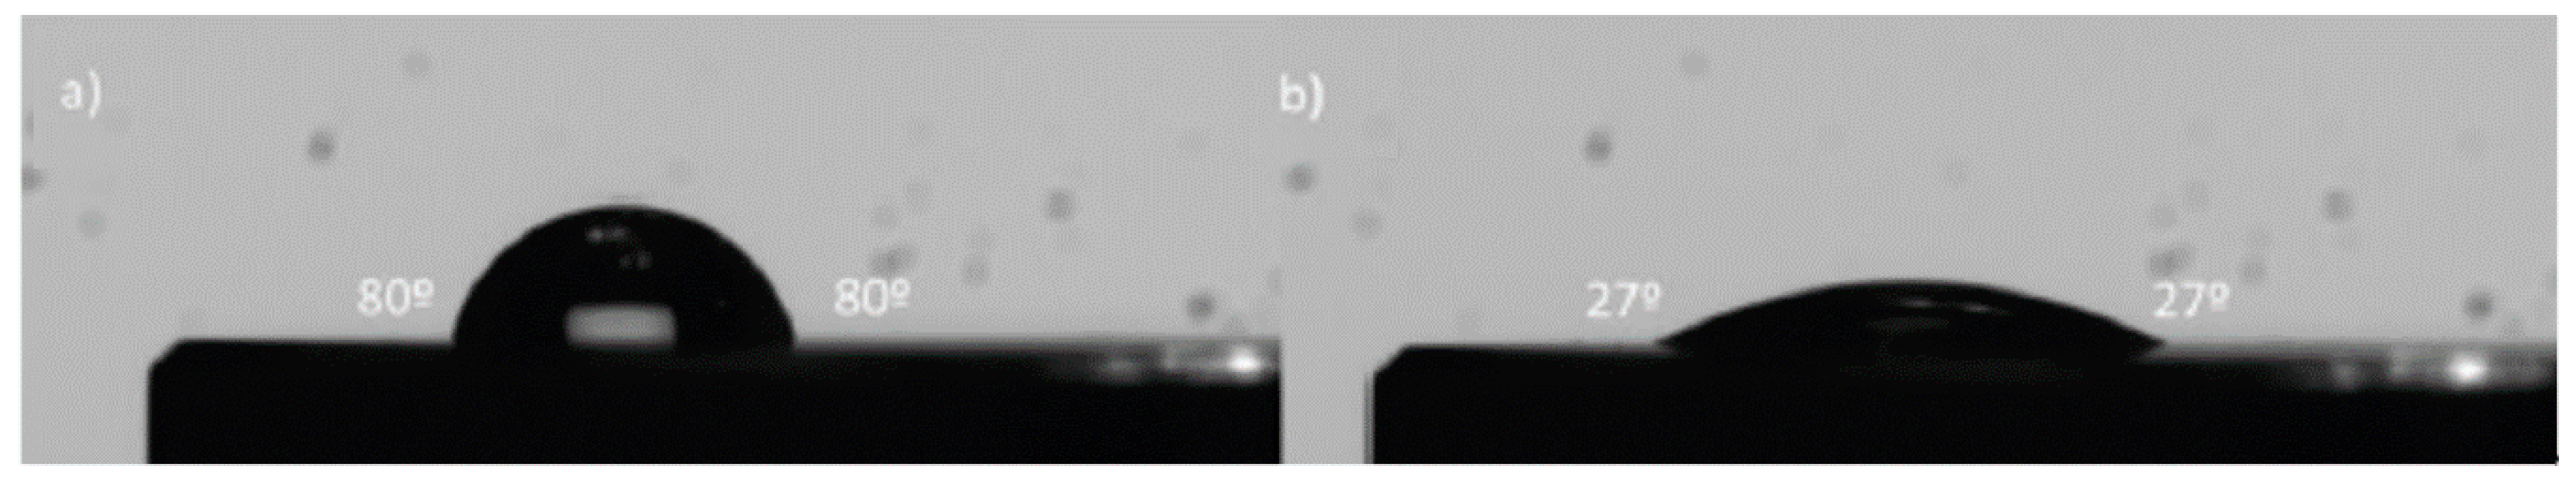
In
Figure 11, we can see, on the left, an image showing (a) the initial grade IV T sample with its water contact angle and (b) a decreased water contact angle after the application of UV irradiation to the surface for 8298 s. In
Table 10, we can see the initial contact angles of the non-irradiated samples and the final angles of the samples after irradiation with UV light. The UV irradiation time counted until the water contact angles remained constant (
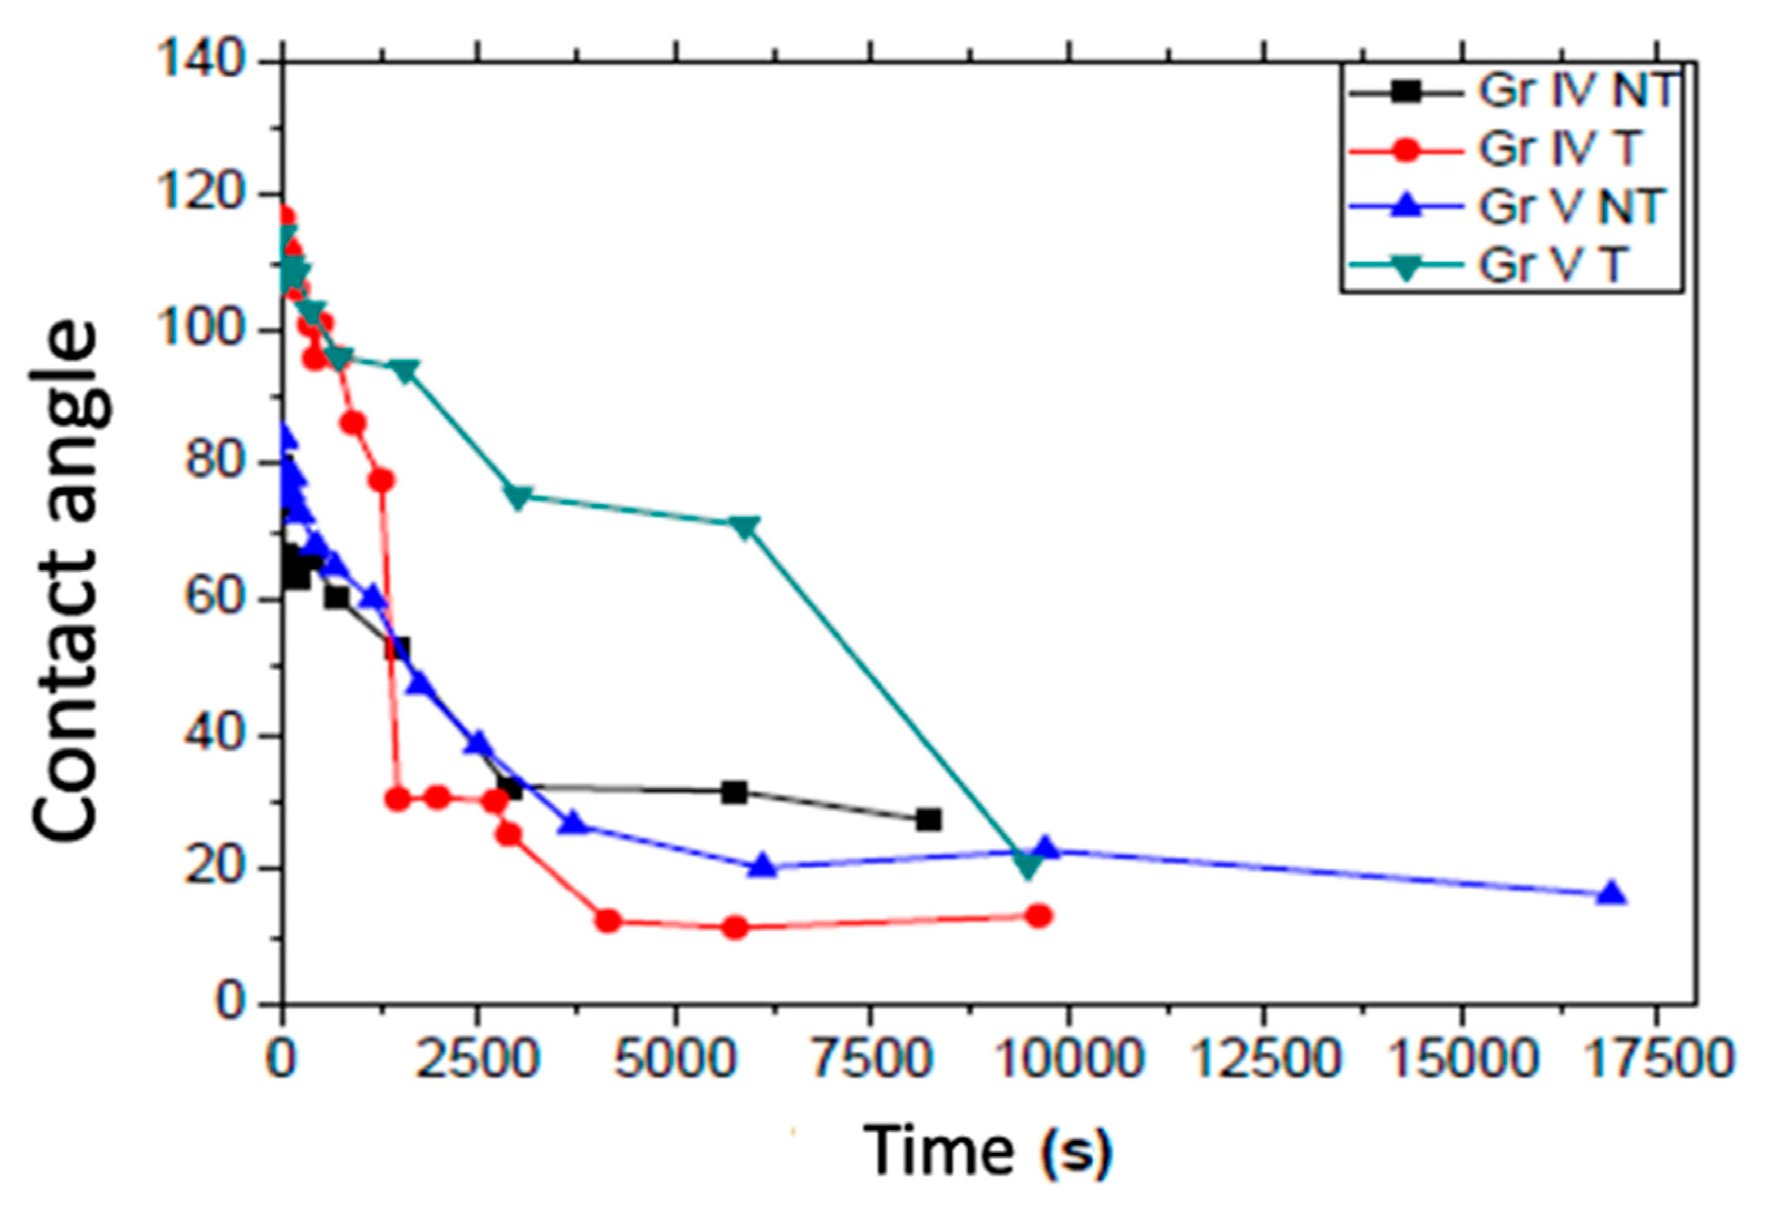
Figure 12).
Initially, the treated samples were much more hydrophobic than the untreated ones, both in grade IV and in grade V. Nevertheless, the water contact angle of the grade IV samples decreased much more rapidly after applying UV light. All the samples presented a gradual decrease in the contact angle to the superhydrophilic values of the contact angle by application of ultraviolet irradiation on the surface of the samples at small intervals of exponential time (30–180 s).
Figure 12 shows that all the samples became hydrophilic after accumulating two hours of UV exposure. In addition, the treated samples presented greater initial hydrophobic behavior compared to the untreated ones, and furthermore, a sharper decrease of the contact angle, much higher for the treated grade IV sample compared to the treated grade V one.
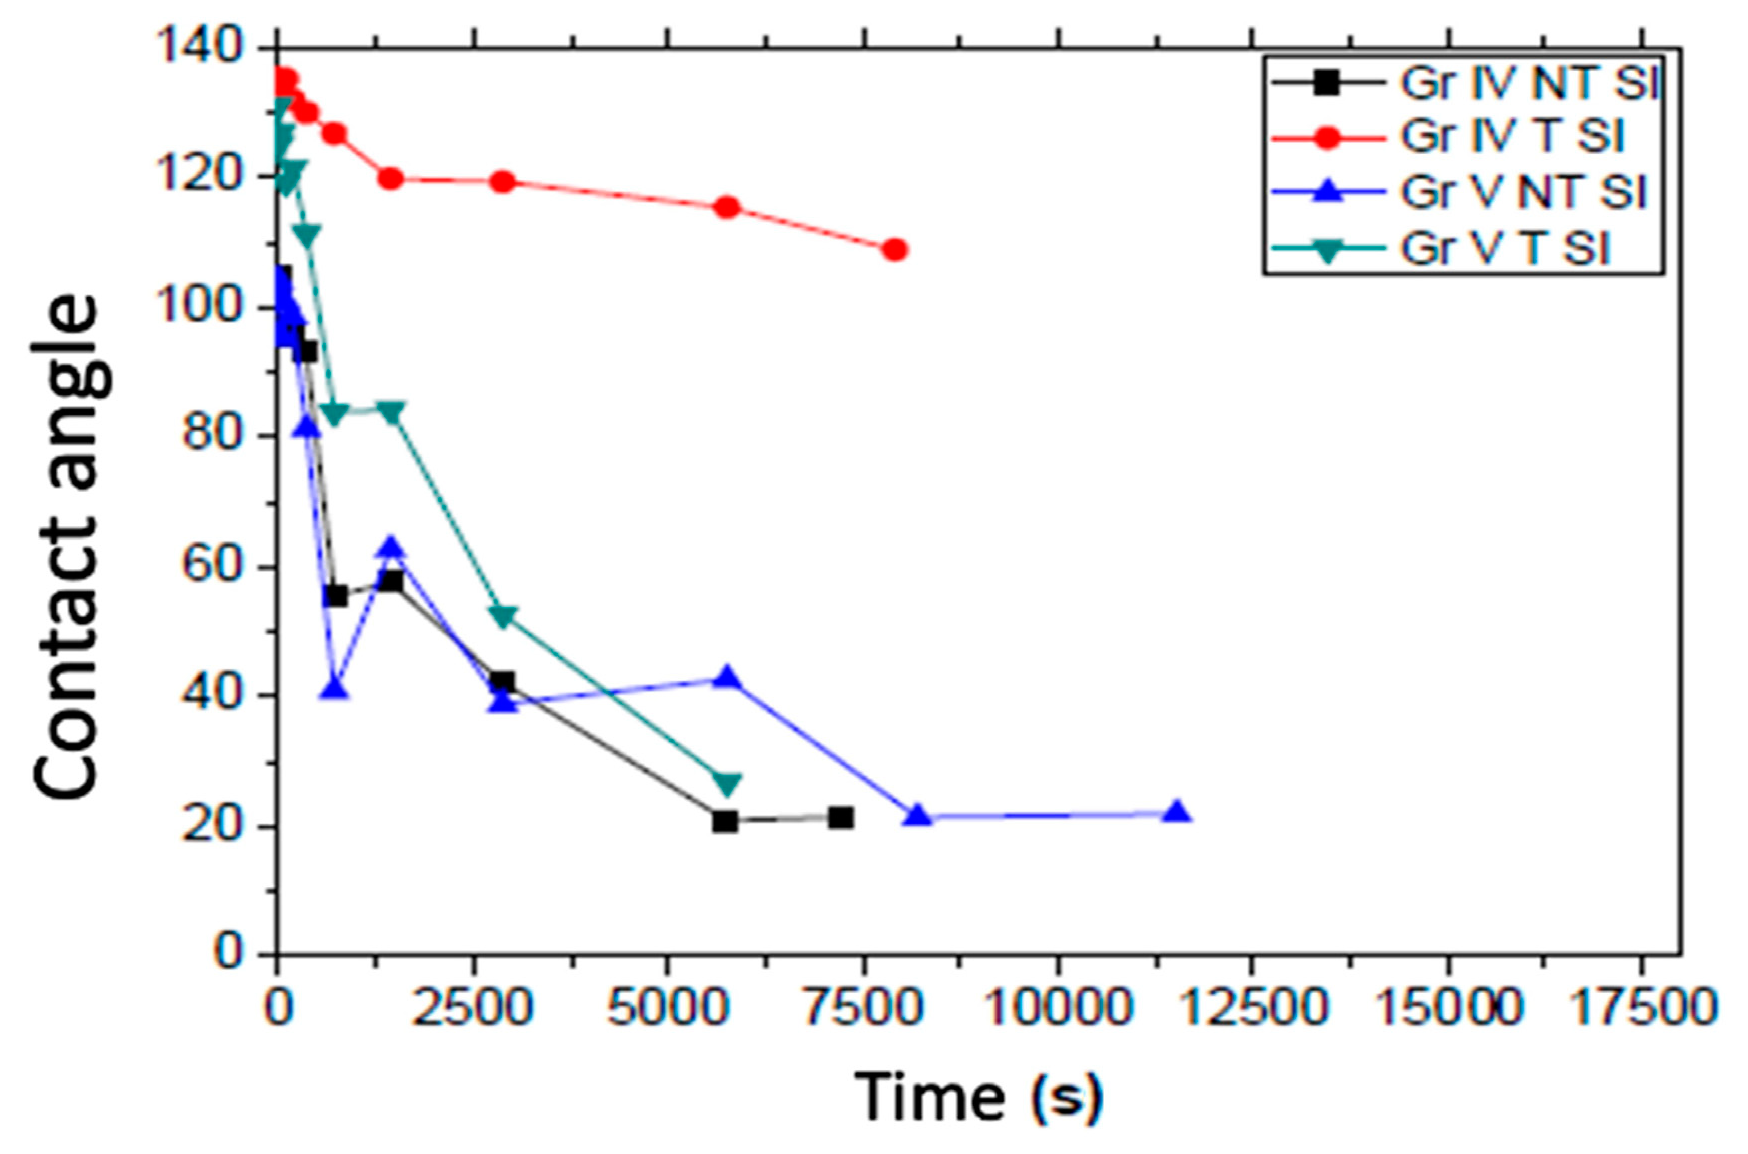
Regarding the study of the photoactivity of the surfaces modified with nanocolumns of TiO
2 by UV irradiation (
Figure 13,
Table 11), in
Table 11, we can see the initial and final water contact angles of the samples with the deposition of TiO
2, the surfaces with prior roughness (treated) being again more hydrophobic and the initial contact angle increasing in all cases. A significant decrease in the contact angle after UV irradiation can be seen in all the samples except the SI treated grade IV sample, which presents a more gradual decrease in the contact angle over time as can be seen in
Figure 13. As occurred with the original samples in
Figure 12, when comparing the samples with each other, it can be observed that not all the samples presented the same speed in the hydrophilic photoactivation, since the grade IV T SI and the grade V T SI samples start from higher angles than grade IV NT SI and grade V NT SI. Furthermore, the reduction in the water contact angle in grade IV NT SI and grade V NT SI presented the same rate, whereas the rate in the grade V T SI sample was slightly higher, unlike the grade V T, with the higher rate (
Figure 12).
3.7. Study of the Results of the Sample Cell Cultures
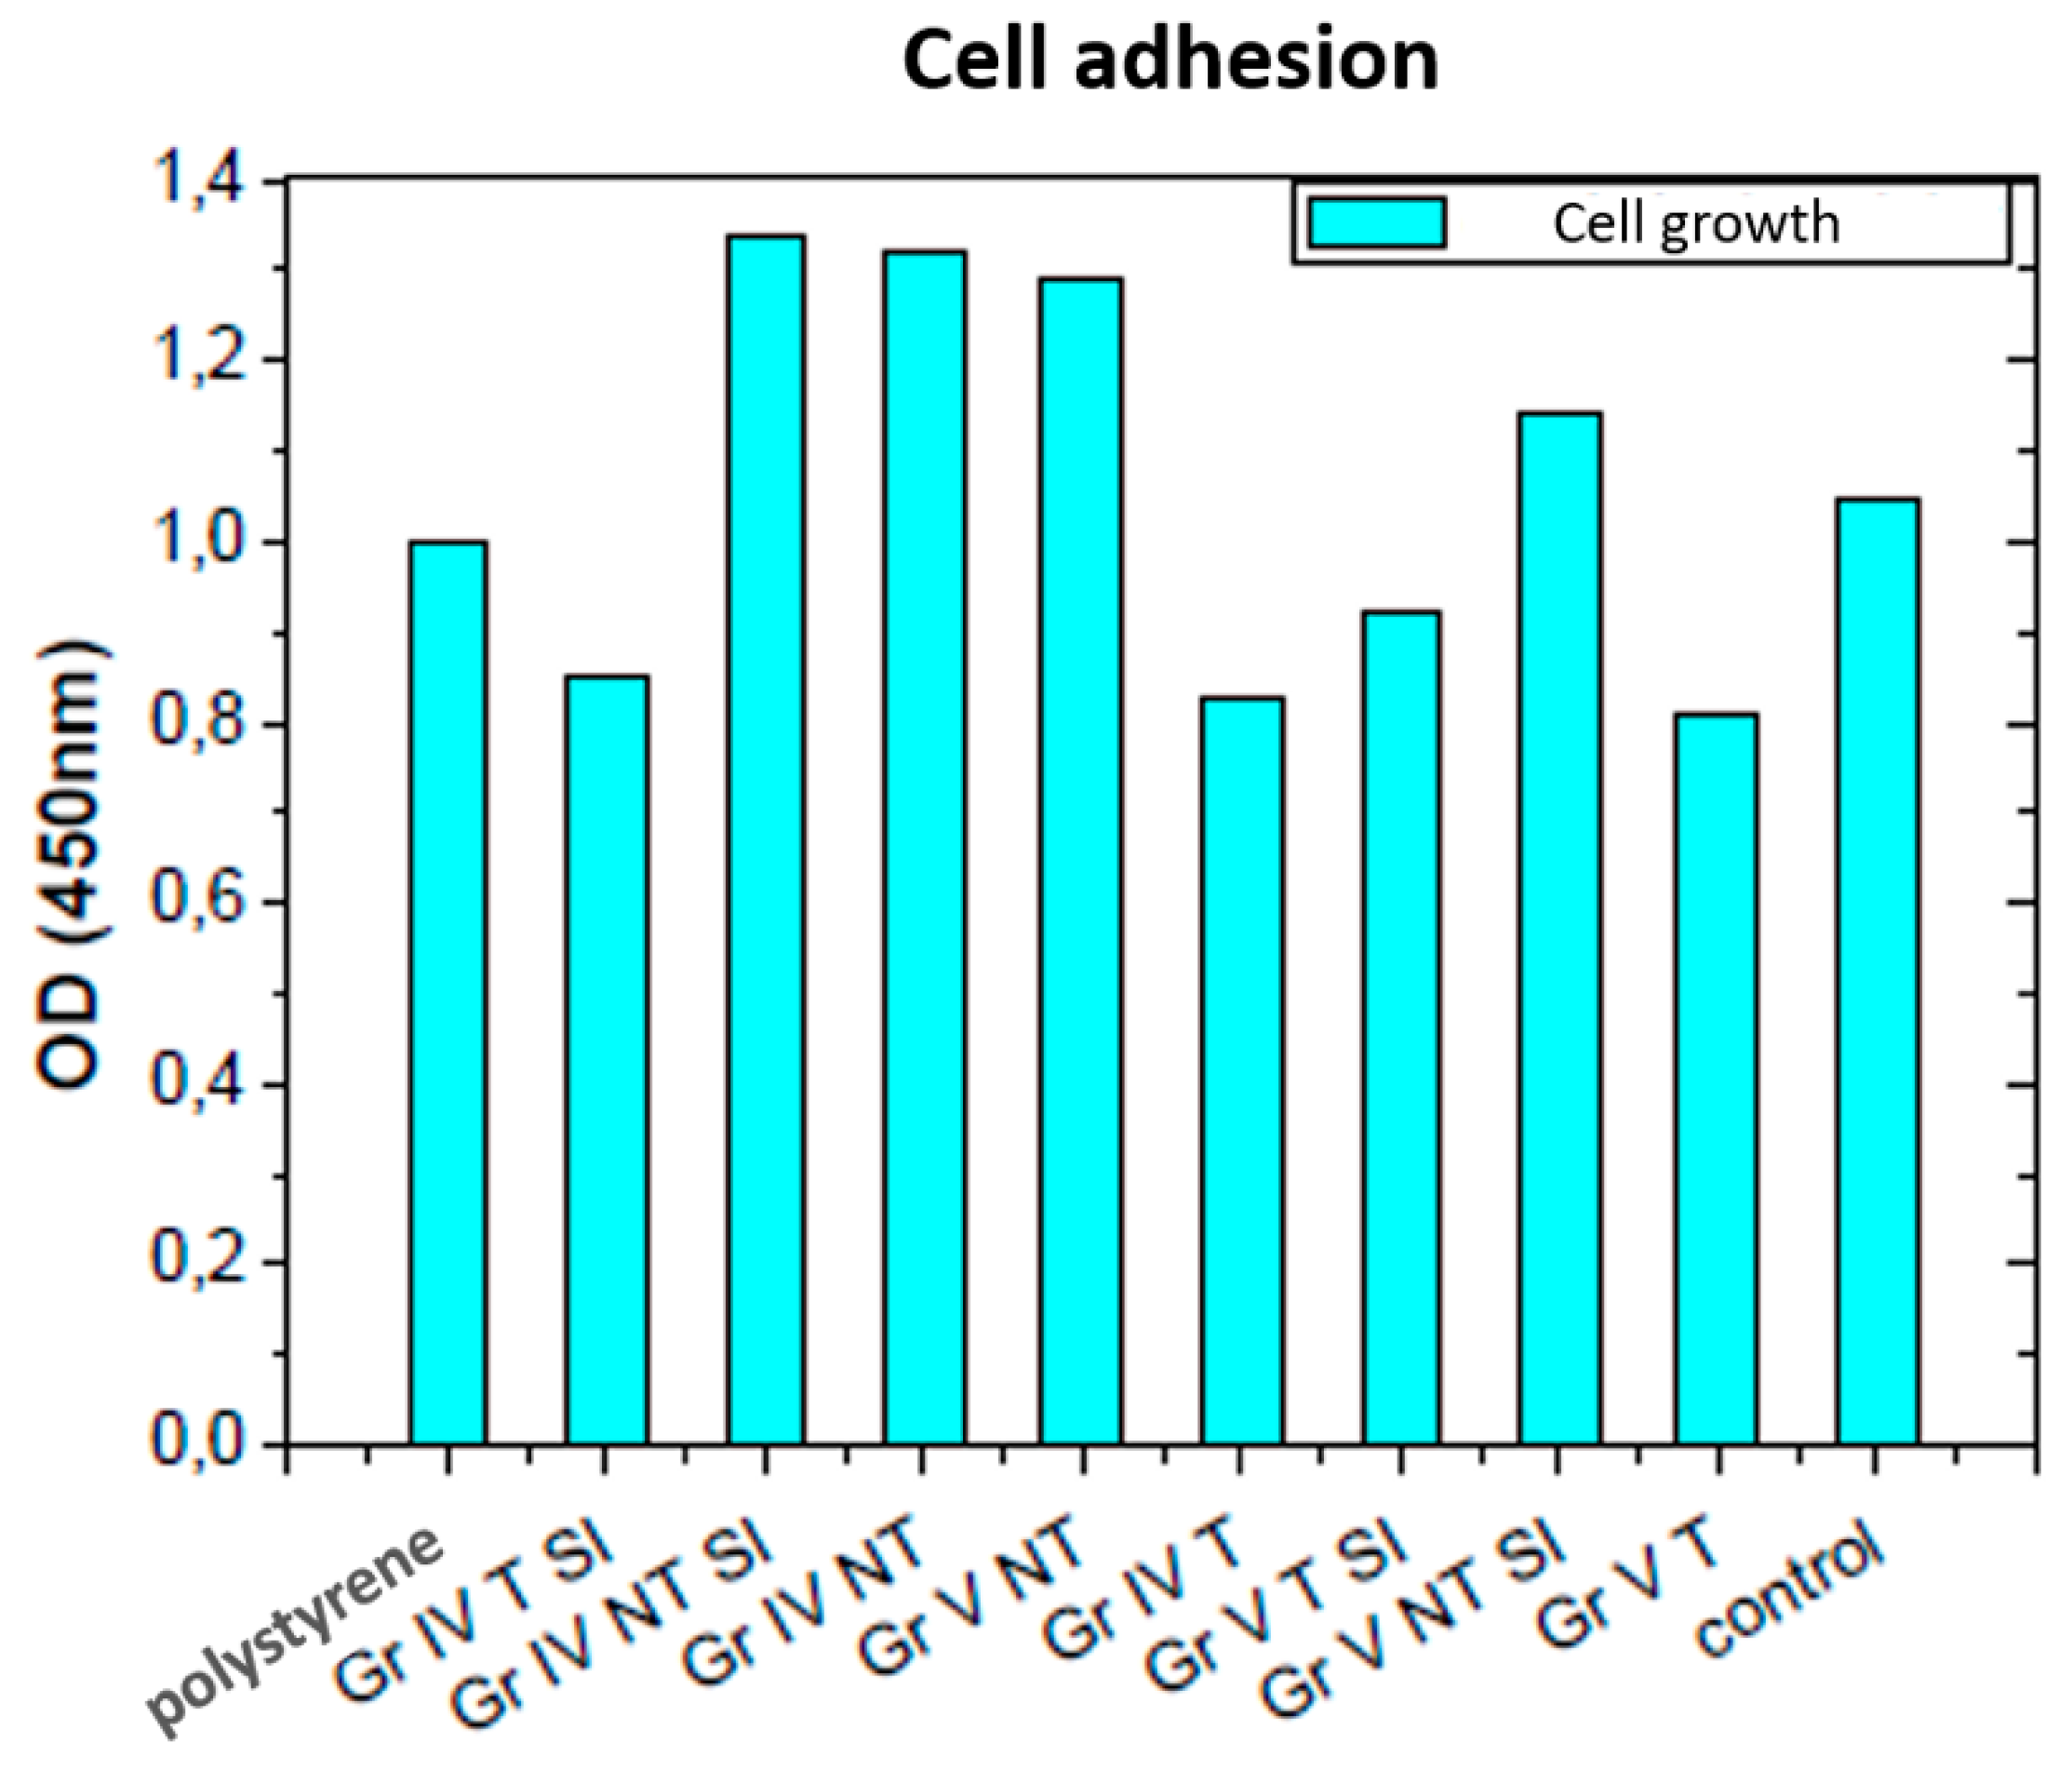
Figure 14 shows polystyrene (growth reference), the original samples and with titanium oxide and the second control (surface of the culture flask). Polystyrene is a plastic used as a positive control. All the samples were biocompatible and enabled cell growth on them, the greatest growth being on the sample with the grade IV NT SI titanium oxide film, followed by the grade IV NT, which presented very similar growth patterns. The grade IV T SI sample presented a slight increase in growth compared to the grade IV T. However, the grade V NT sample had higher growth than the sample with the titanium oxide film, grade V NT SI. Finally, the grade V T SI sample improved its growth in comparison with the original grade V T sample, as can be seen in
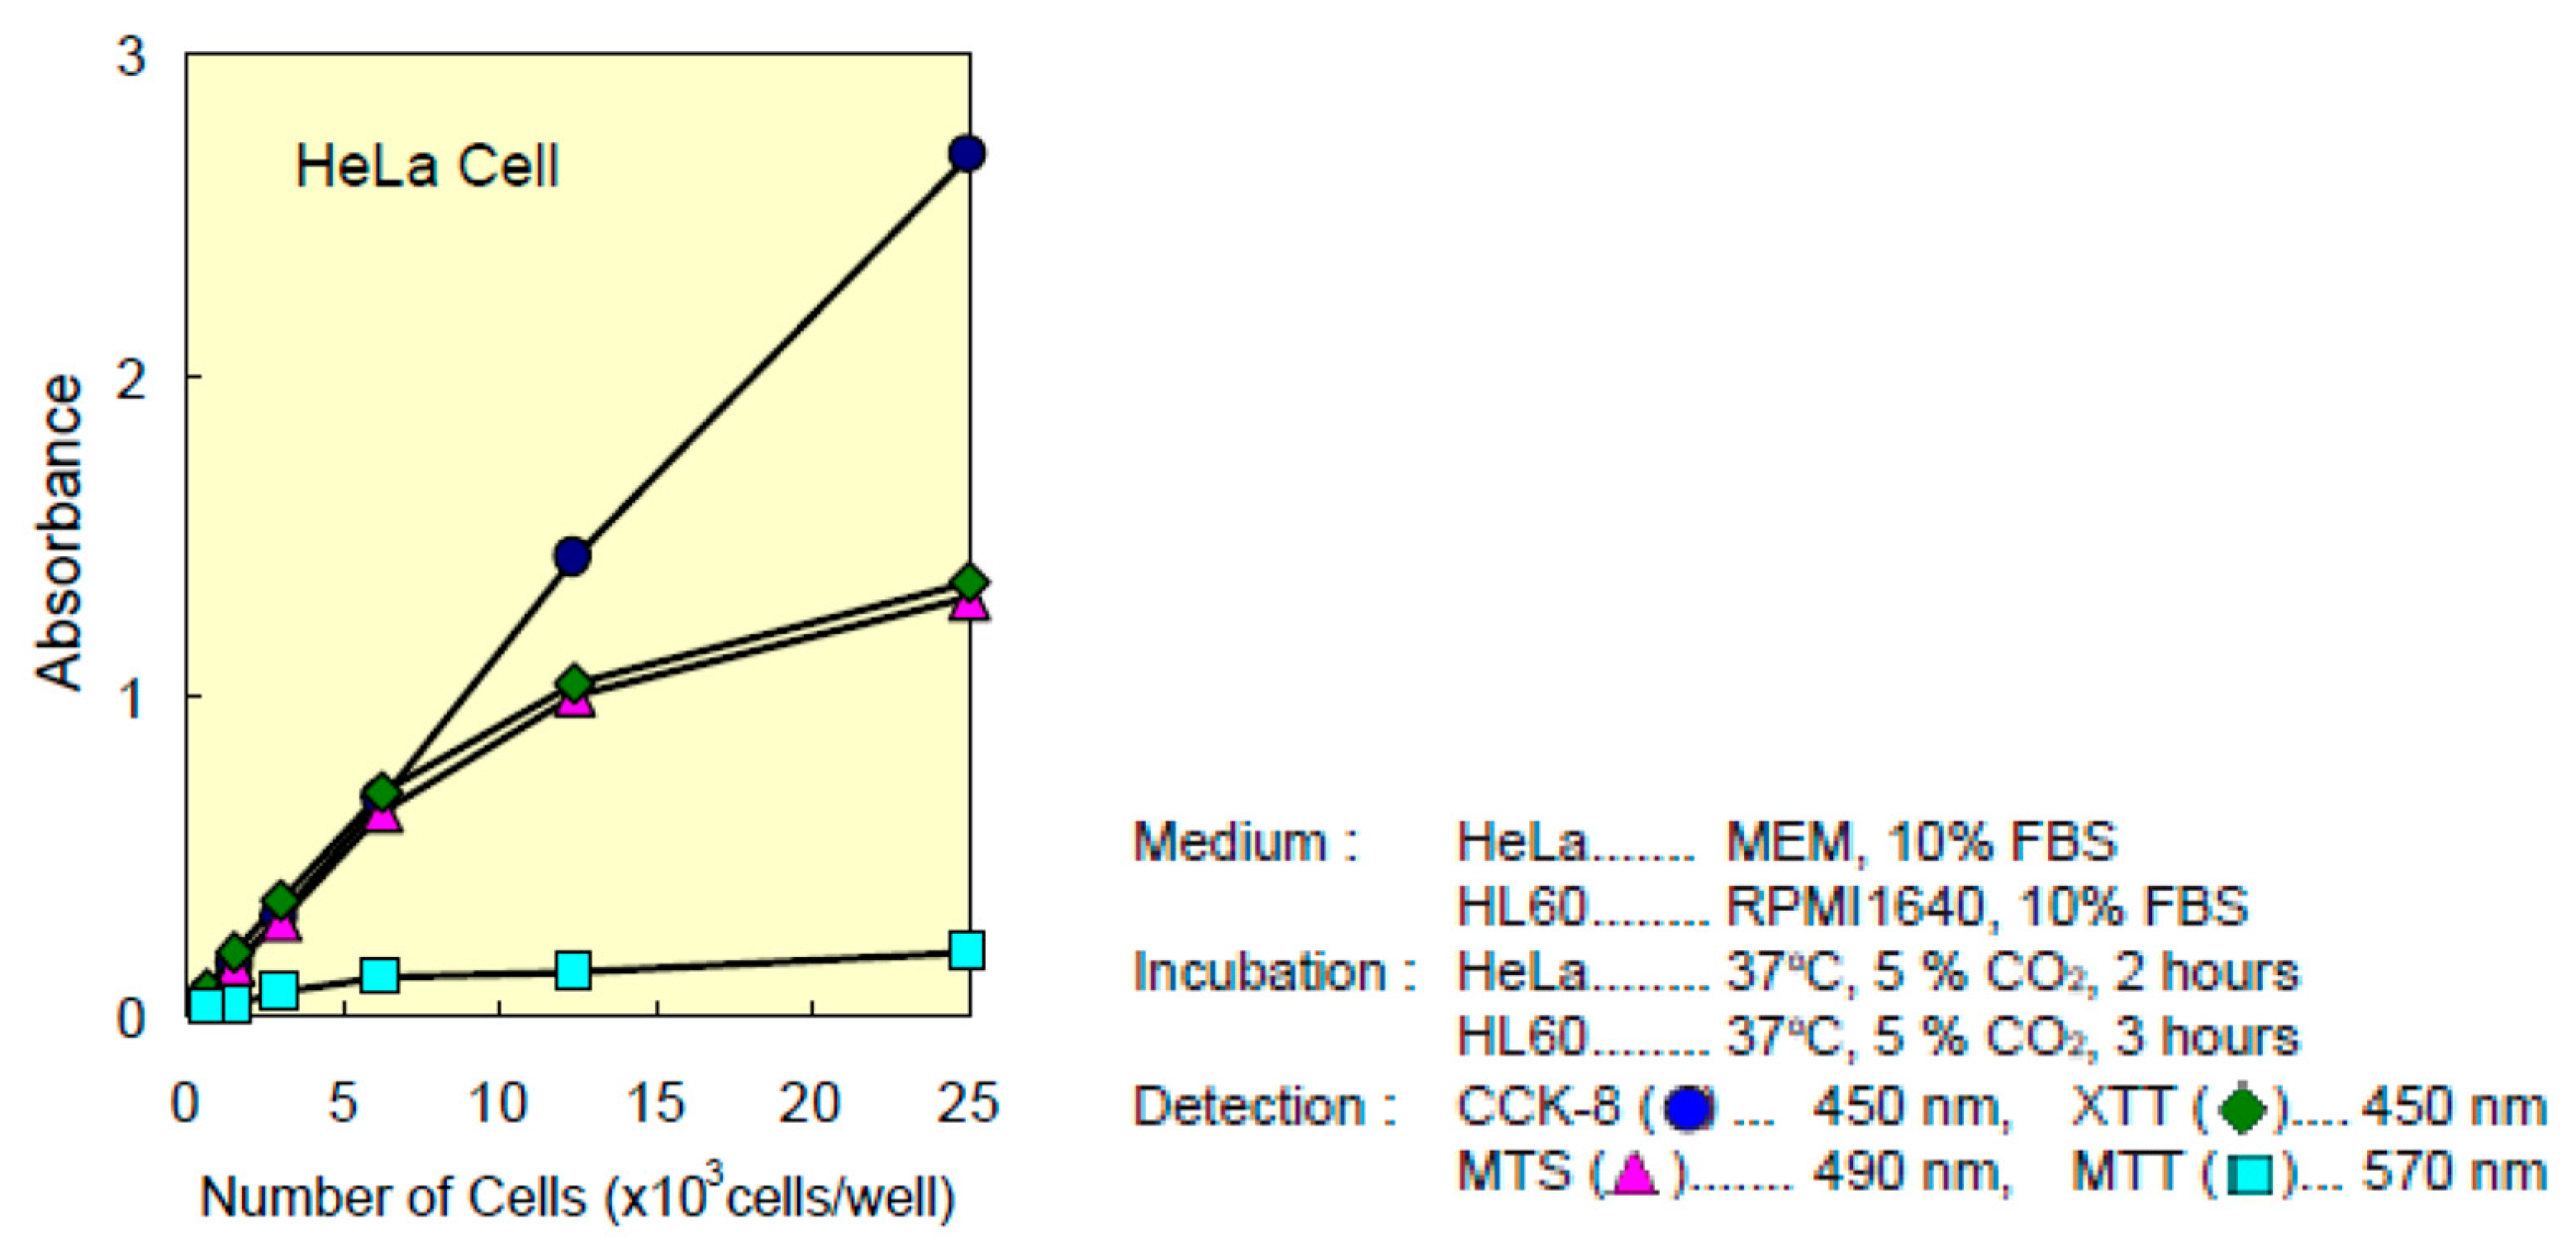
Table 12, where the absorbance values obtained in
Figure 14 are presented, and the corresponding number of adhered cells obtained by interpolation from the HeLa cell graph in
Figure 15.
It can be seen that the grade IV samples presented similar behavior, with a significant improvement in the ones that presented the titanium oxide film, and in the grade V samples, the original untreated one presented a better behavior and the one that presented a film of titanium oxide in the case of the treated one.
From this, we can deduce that the untreated grade IV titanium samples are the ones that presented the best cell growth, this being greater in the samples containing the titanium dioxide film. The untreated grade V sample is the one that occupies the third place regarding growth, followed by the grade V sample not treated with titanium dioxide.
The fifth place for growth is awarded to the control group, followed by the treated titanium V sample coated with titanium dioxide. The treated grade IV samples come next, where the sample coated with titanium dioxide had slightly larger growth. The sample with least growth was the treated grade V one.
Therefore, only the grade IV NT, grade IV NT SI, grade V NT, and grade V NT SI presented more growth than the control sample. In these samples, only in the untreated grade IV ones did cell growth improve by adding a layer of titanium dioxide.
The treated grade IV and V samples had less growth than the control sample. Hence, it can be deduced that sand blasting treatment and double acid etching did not have a beneficial effect when it comes to increasing cell growth, although cell proliferation improved on addition of titanium dioxide to these samples.
The absorbance for the group of samples without modification SI was 1.04 ± 0.28 compared to 1.05 ± 0.20 in the group of samples with said modification (p = 0.989; Mann–Whitney U). Regarding the number of adhered cells, this was 9.34 × 10³ ± 2.49 × 10³ in the sample group are SI modification, compared to 9.37 × 10³ ± 1.85 × 10³ in the group with SI modification (p = 0.988; U of Mann–Whitney) Therefore, we can deduce, with the limitations of our study, that the biocompatibility of the samples was not altered by our modification.


 ,
, 


