Experimental Evaluation on the Heating Efficiency of Magnetoferritin Nanoparticles in an Alternating Magnetic Field


1
Biogeomagnetism Group, Paleomagnetism and Geochronology Laboratory, Key Laboratory of Earth and Planetary Physics, Institute of Geology and Geophysics, Chinese Academy of Sciences, Beijing 100029, China
2
Institutions Earth Science, Chinese Academy of Sciences, Beijing 100029, China
3
College of Earth and Planetary Sciences, University of Chinese Academy of Sciences, Beijing 100049, China
*
Author to whom correspondence should be addressed.
Nanomaterials 2019, 9(10), 1457; https://doi.org/10.3390/nano9101457
Submission received: 17 September 2019
/
Revised: 6 October 2019
/
Accepted: 10 October 2019
/
Published: 14 October 2019
Abstract
:The superparamagnetic substance magnetoferritin is a potential bio-nanomaterial for tumor magnetic hyperthermia because of its active tumor-targeting outer protein shell, uniform and tunable nanosized inner mineral core, monodispersity and good biocompatibility. Here, we evaluated the heating efficiency of magnetoferritin nanoparticles in an alternating magnetic field (AMF). The effects of core-size, Fe concentration, viscosity, and field frequency and amplitude were investigated. Under 805.5 kHz and 19.5 kA/m, temperature rise (ΔT) and specific loss power (SLP) measured on magnetoferritin nanoparticles with core size of 4.8 nm at 5 mg/mL were 14.2 °C (at 6 min) and 68.6 W/g, respectively. The SLP increased with core-size, Fe concentration, AMF frequency, and amplitude. Given that: (1) the SLP was insensitive to viscosity of glycerol-water solutions and (2) both the calculated effective relaxation time and the fitted relaxation time were closer to Néel relaxation time, we propose that the heating generation mechanism of magnetoferritin nanoparticles is dominated by the Néel relaxation. This work provides new insights into the heating efficiency of magnetoferritin and potential future applications for tumor magnetic hyperthermia treatment and heat-triggered drug release.
1. Introduction
Iron-oxide magnetic nanoparticles (MNPs) have been widely used in various biomedical applications, including tumor detection, imaging and therapy because of their excellent magnetic, optic and electric properties, biocompatibility and biodegradability [1,2,3]. In particular, MNPs show promising applications in magnetic hyperthermia therapy (MHT) for cancer treatment as an individual treatment or an adjuvant treatment combined with chemotherapeutic and/or radiotherapeutic agents [4,5]. It has been shown that MNPs can convert the magnetic energy into thermal energy through hysteresis loss or Néel/Brownian relaxation process in an alternating magnetic field [6,7,8]. For superparamagnetic iron oxide nanoparticles, the energy conversion is mostly based on relaxation process [9]. To distinguish the relaxation process between Néel relaxation and Brownian relaxation, a gel or glycerol system which has the different viscosity was usually used [10,11]. Alternatively, comparing the fitted effective relaxation time (obtained by SLP vs. frequency fitting) with Néel relaxation time and Brownian relaxation time (obtained by calculation) has been proposed [12].
In order to achieve a higher thermal energy intra tumor, MNPs in delivery systems for targeting deep or multiple tumor are requested [13]. To this end, linking ligands are applied, but it makes the synthesis process more tedious and ultimately results in lower productivity with higher cost. Over the past decade, a few cage-like proteins have been used for synthesis of nanosized magnetic minerals inside their cavity [14]. One of these MNPs is magnetoferritin, consisting of a recombinant ferritin shell and a magnetite inner core [15,16]. Outer protein shell ferritin composed of human heavy-chain ferritin has shown a great ability to actively targeting lots of tumors in vivo and in vitro through the transferrin receptor 1 which is over expressed on most tumor cell membrane [17,18,19]. The concept of using magnetoferritin for MHT was proposed by Babincová [20]. Recently, Fantechi and co-workers reported that a 6.8 nm sized and 5% Co-doped iron oxide core of magnetoferritin killed ~70% B16 melanoma cells in vitro by MHT [21]. Massner and co-workers have shown that magnetoferritin with 4 nm iron oxide core caused ~10% mortality of human embryonic kidney 293T cells in vitro [22]. Nevertheless, the heating efficiency and influencing factors of magnetoferritin in aqueous solution have not been studied in detail yet. In the present work, we carried out a systematic study to investigate the influences of core-size, Fe concentration, AMF amplitude and frequency on the specific loss power (SLP) and intrinsic loss power (ILP) of magnetoferritin in aqueous. We also measured the heating efficiency in media of different viscosity (glycerol-water mixture) to identify the heat generation mechanisms of magnetoferritin.
2. Materials and Methods
2.1. Preparation of Recombinant Human Ferritin (HFn)
The Pichia pastoris X-33 containing recombinant plasmid pPICZ A-HFn was constructed in the Beijing Biogeomagnetic Laboratory (Beijing, China). The expression of HFn was determined according to the EasySelectTM Pichia Expression Kit user’s manual (Invitrogen, Carlsbad, CA, USA).
2.2. Synthesis of Magnetoferritin (MHFn)
The MHFn nanoparticles were synthesized according to our previous work [23]. Briefly, a deoxygenated solution of 0.1 M NaCl (40 mL) with HFn (0.5 mg/mL) was injected into a reaction vessel, kept the temperature at 65 °C and pH 8.5. Freshly prepared Fe (II) (25 mM (NH4)2Fe(SO4)2‧6H2O) and H2O2 (8.3 mM) were added to the vessel in a rate of 50 Fe/(protein‧min). To prepare MHFn nanoparticles with different mineral core sizes, different theoretical amounts of iron atoms per protein cage were added into the reaction vessel. The whole reactions were under an anaerobic atmosphere to the end. The synthesized MHFn nanoparticles were centrifuged to remove the aggregated nanoparticles. Finally, the MHFn nanoparticles were kept in an aqueous medium for further use.
2.3. Mineral Core Characterization
To characterize the mineral core’s size and crystallinity, the mineralized MHFn nanoparticles in aqueous medium were dried on an ultra-thin amorphous-carbon film and analyzed by transmission electron microscopy (TEM, JEOL JEM-2100, Tokyo, Japan) with an accelerating voltage of 200 kV. The inner core size of MHFn for each sample was averaged from about 1000 separated particles. Here, we measured the area of the single grain and then calculated the diameter with D = (4‧area/π)1/2. High-resolution TEM (HR-TEM) images and selected area electron diffraction (SAED) patterns were taken to analyze the crystallinity of mineral core of MHFn nanoparticles.
2.4. Magnetic Measurements of MHFn Nanoparticles
MHFn nanoparticles were freeze dried with an Alpha 1–2 LD plus freeze dryer (Martin Christ Gefriertrocknungsanlagen GmbH, Osterode am Harz, Germany). The dried samples were placed in a non-magnetic capsule with a copper spoon. The measurements were performed on a Quantum Design MPMS SQUID magnetometer (model XP-XL5, with magnetic moment sensitivity of 5.0 × 10⁻¹⁰ A‧m2, Quantum Design North America, San Diego, CA, America). Briefly, the hysteresis loops were measured in fields of ± 3T at 5 K and 300 K, respectively. Zero-filed cooled (ZFC) and filed-cooled (FC) curves were measured in a filed of 1.5 mT from 5 K to 200 K, the blocking temperatures (TB) was determined from the maximum of the ZFC curves. The acquisition of isothermal remanent magnetization (IRM) and dc demagnetization curves were measured in a fields of 0–1 T at 5 K.
2.5. Dynamic Light Scattering (DLS) Measurements and Thermogravimetric (TG) Analysis
The hydrodynamic diameter of the samples in aqueous medium were measured by dynamic light scattering (DynaPro NanoStar, Wyatt Technology Corporation, Goleta, CA, USA). Samples (10 μL) at 1.5 mg[Fe]/mL were added to the holder and tested three times. Thermogravimetric analysis (TG/DTA 6300, Seiko instruments Inc., Chiba, Japan) was used to obtain the proportion of the inner mineral core of the entire MHFn nanoparticles. Samples were heated from room temperature to 800 °C at 10 °C/min under an air flow at 1 L/min.
2.6. Heating Efficiency Analyses
The heating efficiency of MHFn samples have been measured with a commercial system DM100 series (nB nanoScale Biomagnetics, Zaragoza, Spain) at Shanghai Normal University (Shanghai, China). A MHFn aqueous sample (0.5 mL) in a 2 mL glass chromatography vial was set in the middle of the coil. The temperature of all samples during magnetic treatment was recorded by an optic fiber temperature probe with a response temperature of 0.1 °C. The initial temperature of each sample has been controlled and stabilized to room temperature (about 22–23 °C controlled by air condition).
Two different test methods were used to evaluate repeatability of samples under H = 19.5 kA/m and f = 808.5 kHz at 5 mg[Fe]/mL. One of them, named single test method, is one by one test after cooling to room temperature and measured four times, the other named continuous test method is to turn off the AMF when temperature rise to 33 °C and turn on the AMF when temperature is low to 28 °C for four cycles. The effects of size and concentration on SLPs and ILPs have been measured at H = 19.5 kA/m and f = 808.5 kHz with 1.5 and 5 mg[Fe]/mL MHFn samples. The dependences of AMF parameters on SLPs have also been investigated. Two core sizes of MHFn samples at 5 mg[Fe]/mL were tested at 805.5 kHz with different AMF amplitudes (11.9, 13.9, 15.9, 17.9, 19.5 kA/m) and at 19.5kA/m with different frequencies (274.5, 405.5, 466.0, 546.5, 598.0, 737.0, 805.5 kHz), respectively. 4.3 nm MHFn sample at 2.5 mg[Fe]/mL and 4.8 nm MHFn sample at 1.5 mg[Fe]/mL in different glycerol-water mixtures (0, 50% and 70% glycerol ratio) were also measured. In this work, we set the moment that field amplitude reached the setting value as t = 0, and set the temperature (about 22–23 °C) at t = 0 as ∆T = 0.
The method proposed by Kallumadil and co-workers was used to calculate the heating efficiency [24]: fitting the curves of field applied time vs. temperature with Box-Lucas equation [] to calculate the ∆T/∆t at t = 0; the heating efficiency SLP was calculated with , where Cwater is the heat capacity of water (4.185 J‧g−1‧K−1) and cFe is the Fe concentration in aqueous solution; the intrinsic loss power (ILP) was calculated by ILP = SLP/(f‧H2). The Néel-Brownian relaxation time and the effective relaxation time were calculated with formula given by Rosensweig [6].
3. Results and Discussion
3.1. Core Size and Crystallinity
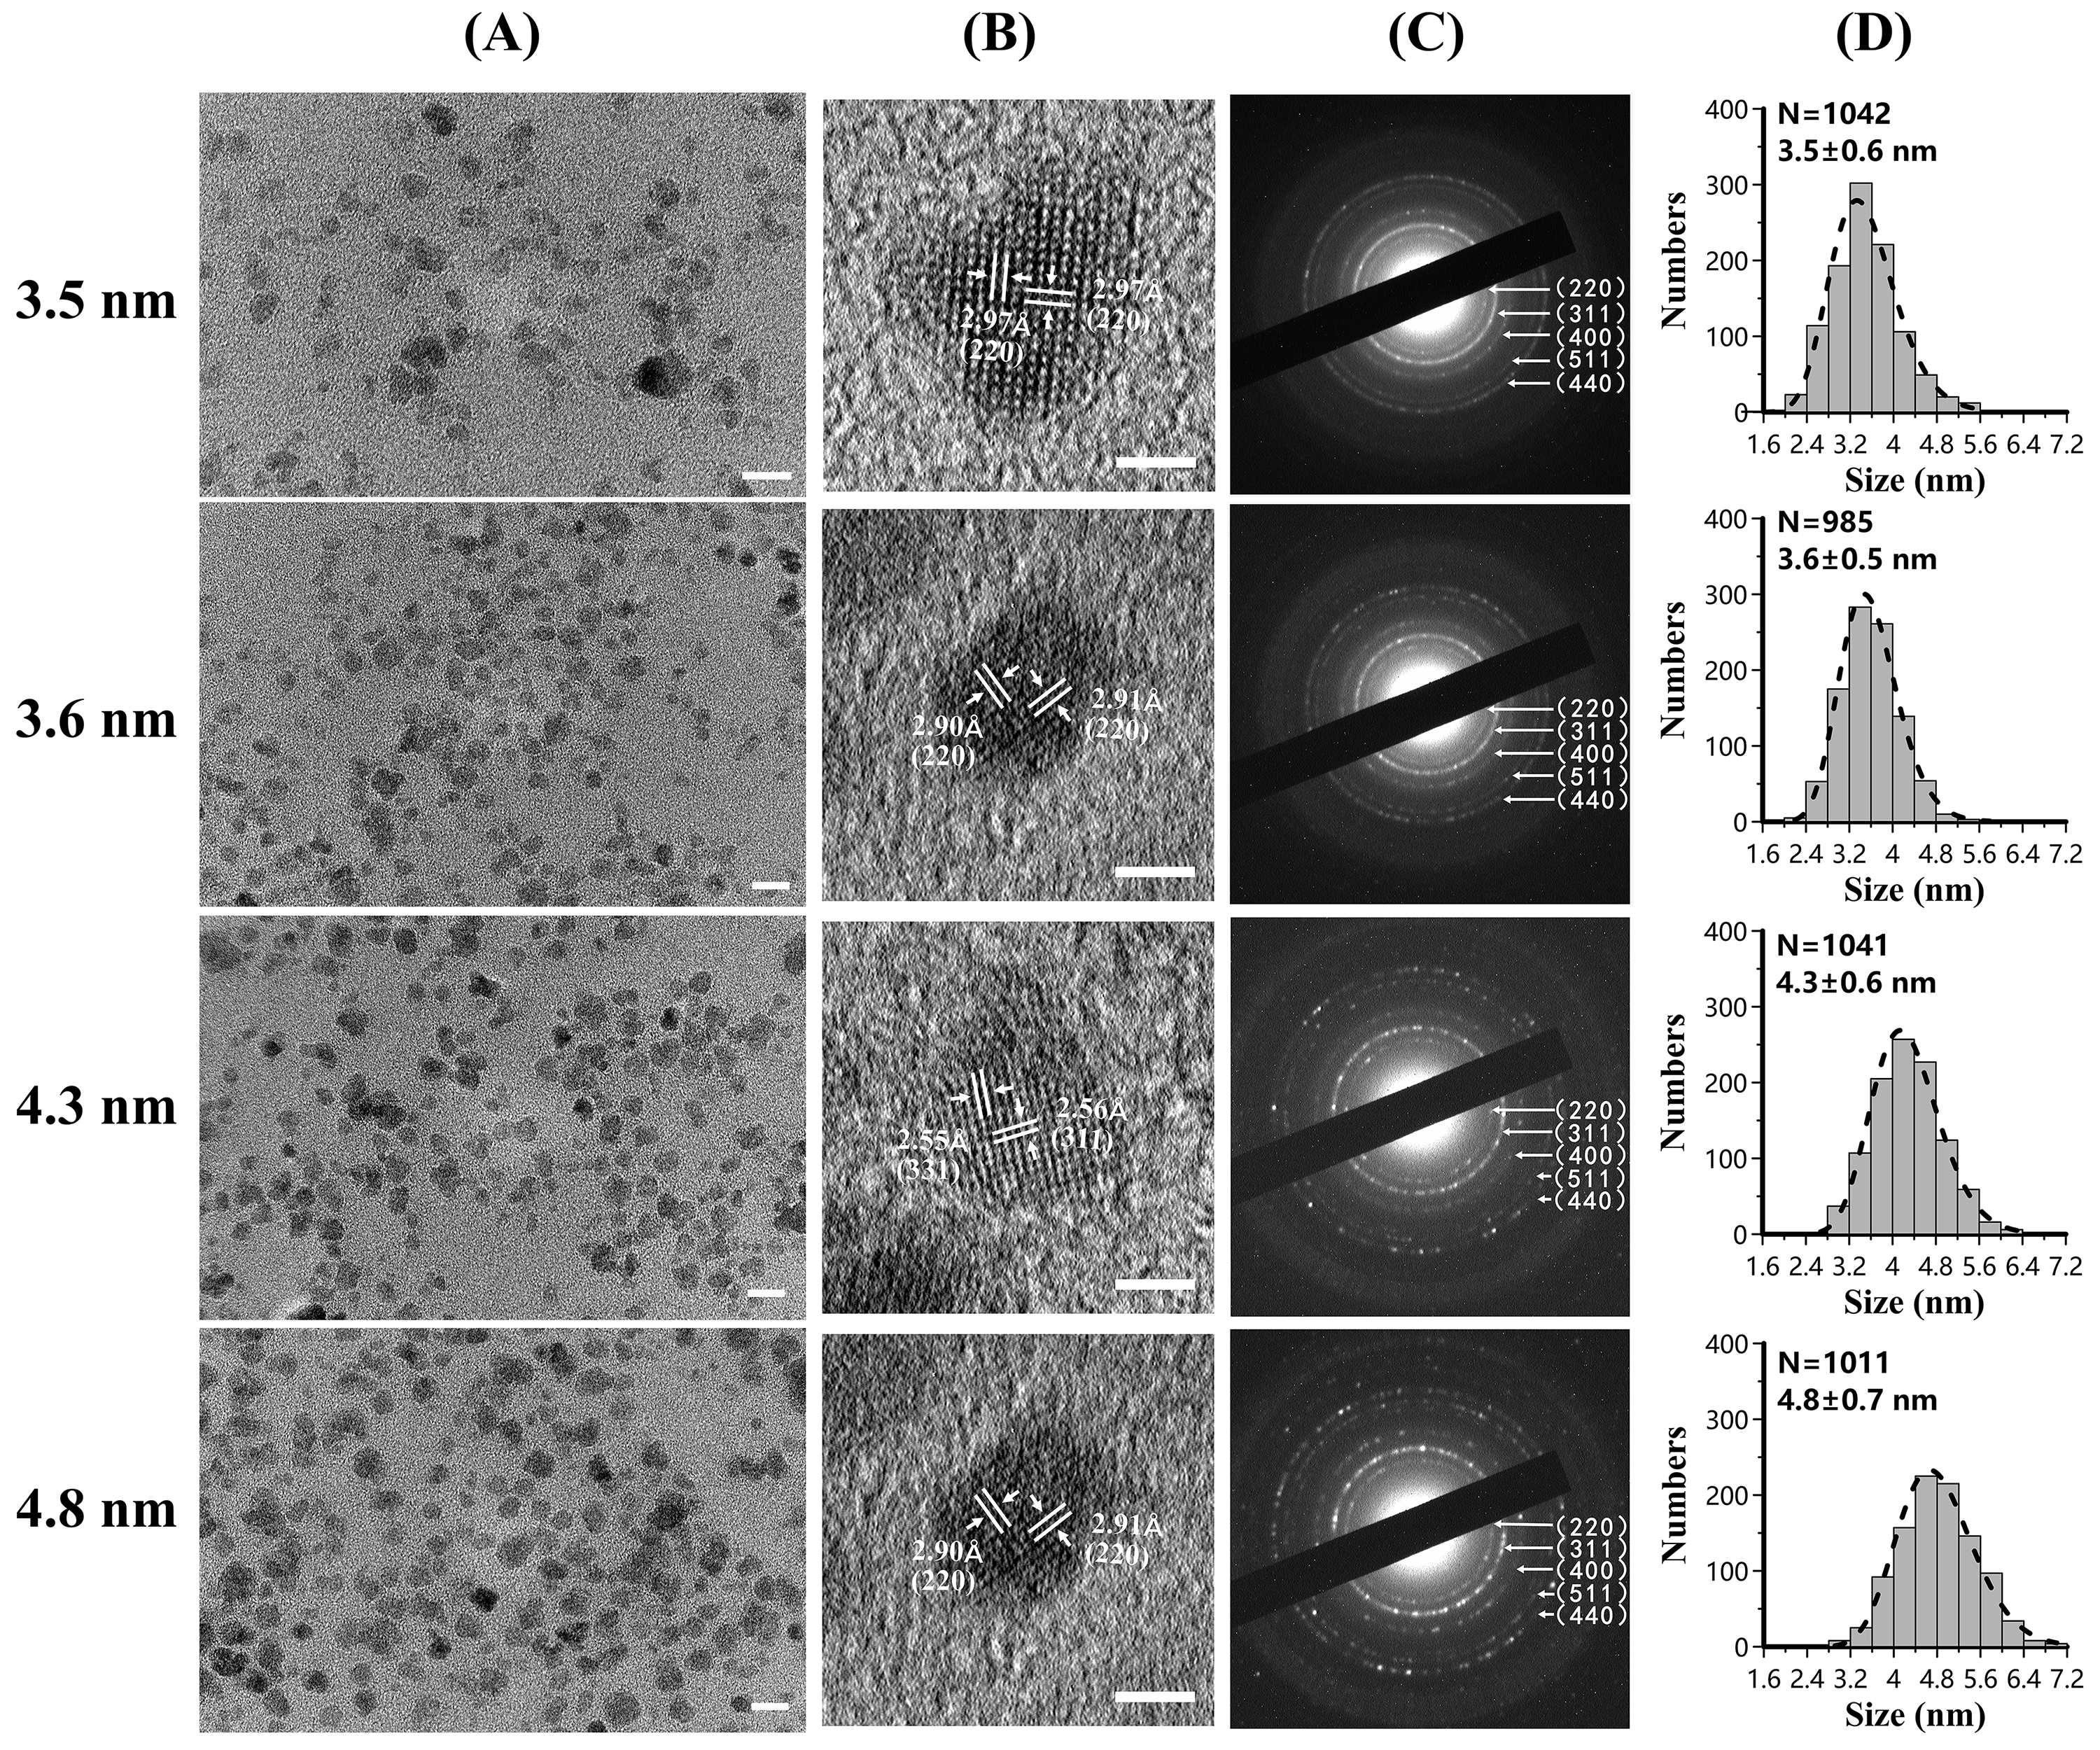
Low magnification TEM micrographs (Figure 1A) show that the MHFn nanoparticles were well dispersed. The HR-TEM micrographs (Figure 1B) show the clear lattices fringes without obvious lattice defects. The lattice fringes measured from HR-TEM micrographs matched with magnetite and/or maghemite. The diffraction rings in SAED pattern images (Figure 1C) were clear and sharp, which indicates the magnetic cores were crystalline. The mean size of MHFn cores are 3.5 ± 0.6 nm, 3.6 ± 0.5 nm, 4.3 ± 0.6 nm, 4.8 ± 0.7 nm (Figure 1D and Table 1), respectively, with a lognormal distribution (dotted lines).
3.2. Magnetic Properties
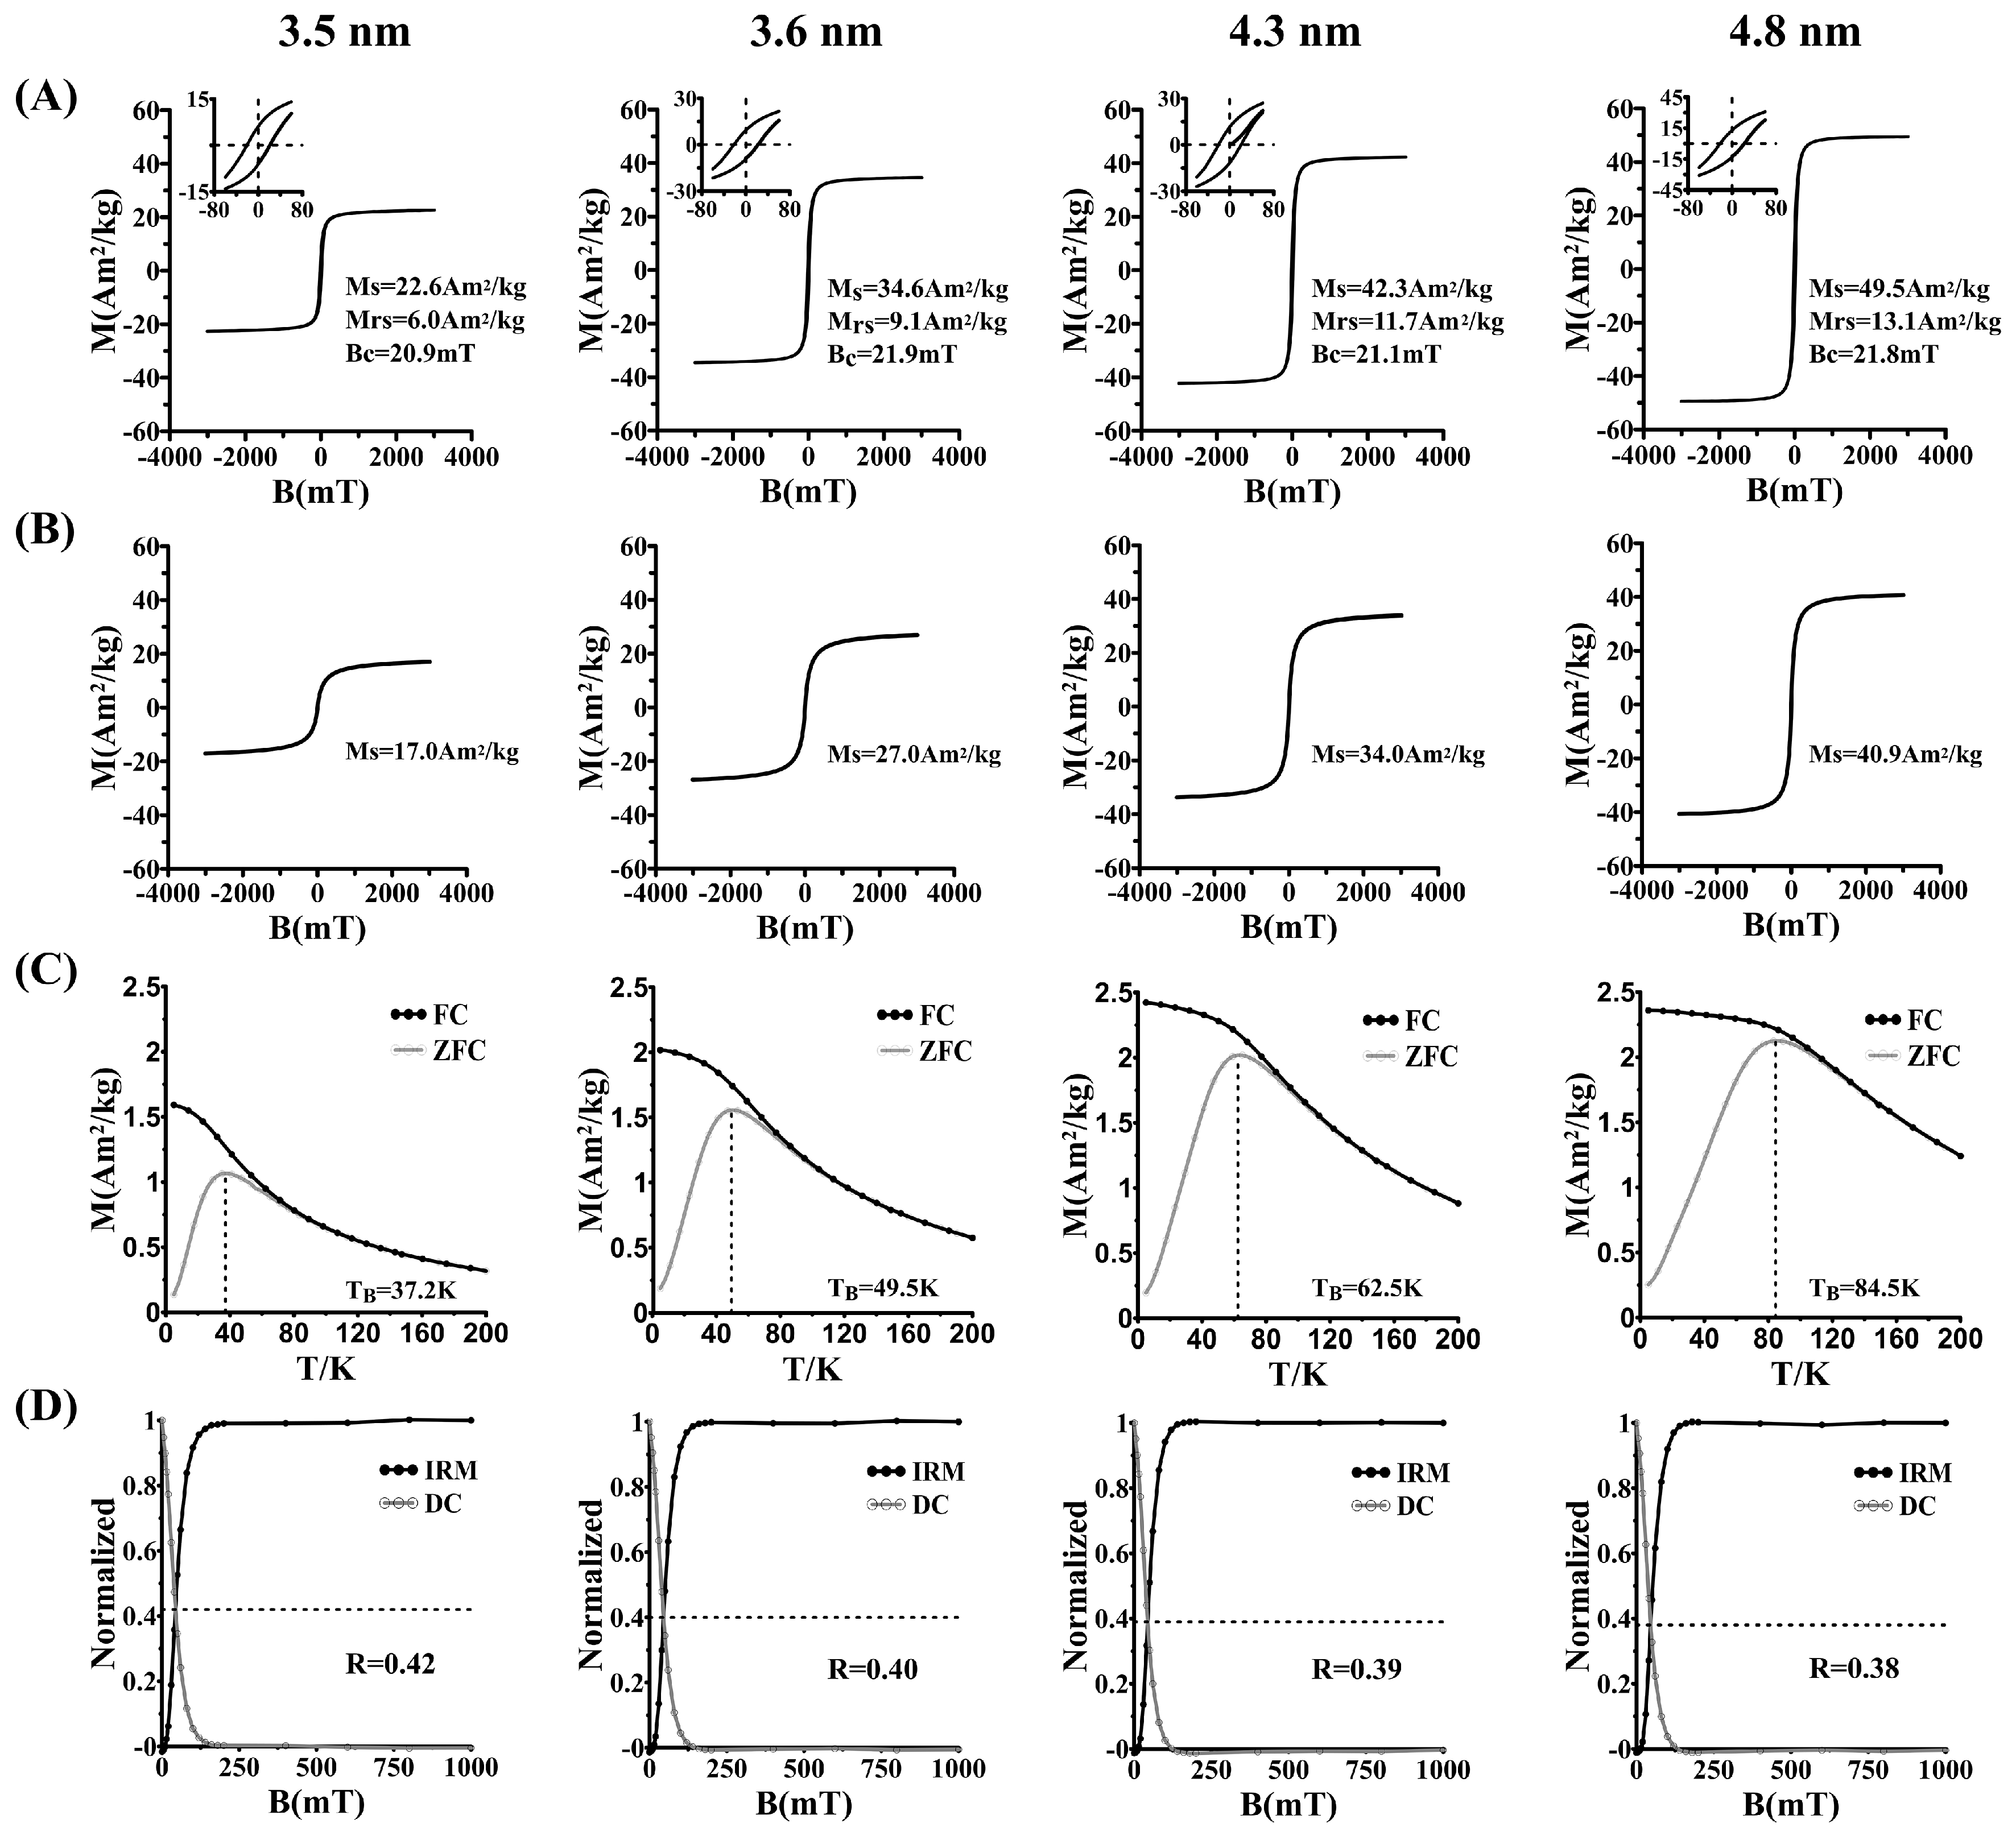
The saturation magnetization (Ms) measured at 5 K (Figure 2A) and 300 K (Figure 2B) and blocking temperature (TB) (Figure 2C) increased with increasing MHFn core size. The decrease of R-value (Figure 2D) suggests that the static magnetic interaction is slightly increased with core size. At 300 K, the magnetization hysteresis loops M (H) curves show that all MHFn nanoparticles are superparamagnetic (no measurable coercivity). The magnetic data is summarized in Table 1.
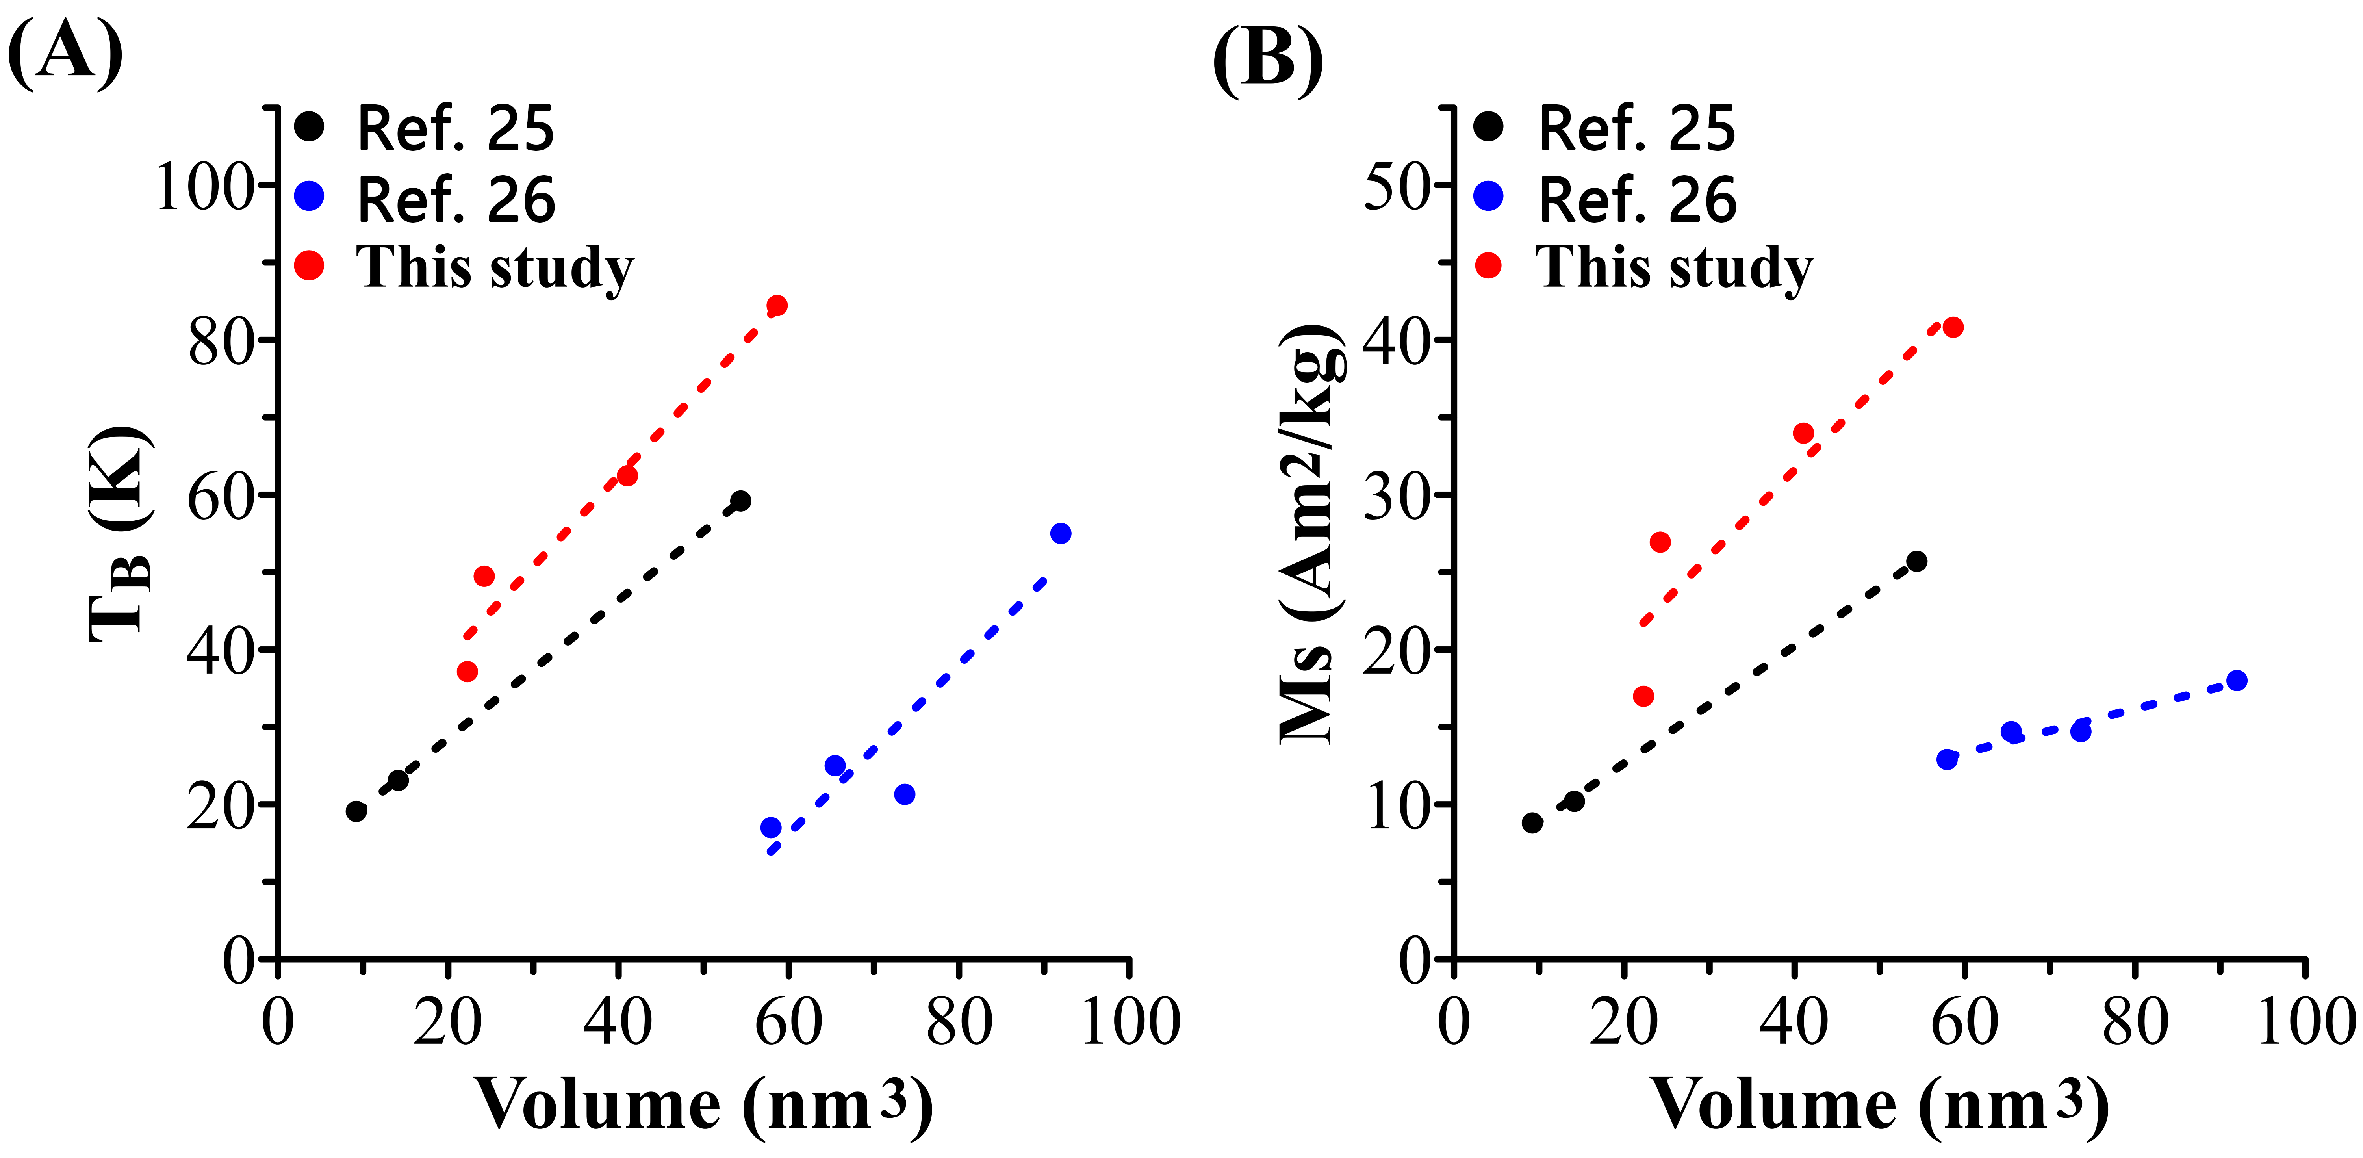
Interestingly, the TB increases linearly with the volume of MHFn (Figure 3A) in this study and our previous study [25,26]. The slope may be used to roughly calculate the effective anisotropic energy constant Keff (keffV = 25kBTB) [27]. The Ms measured at 300 K likely increases linearly with the volume of measured samples (Figure 3B).
3.3. Dynamic Light Scattering (DLS) Measurements and Thermogravimetric (TG) Analysis
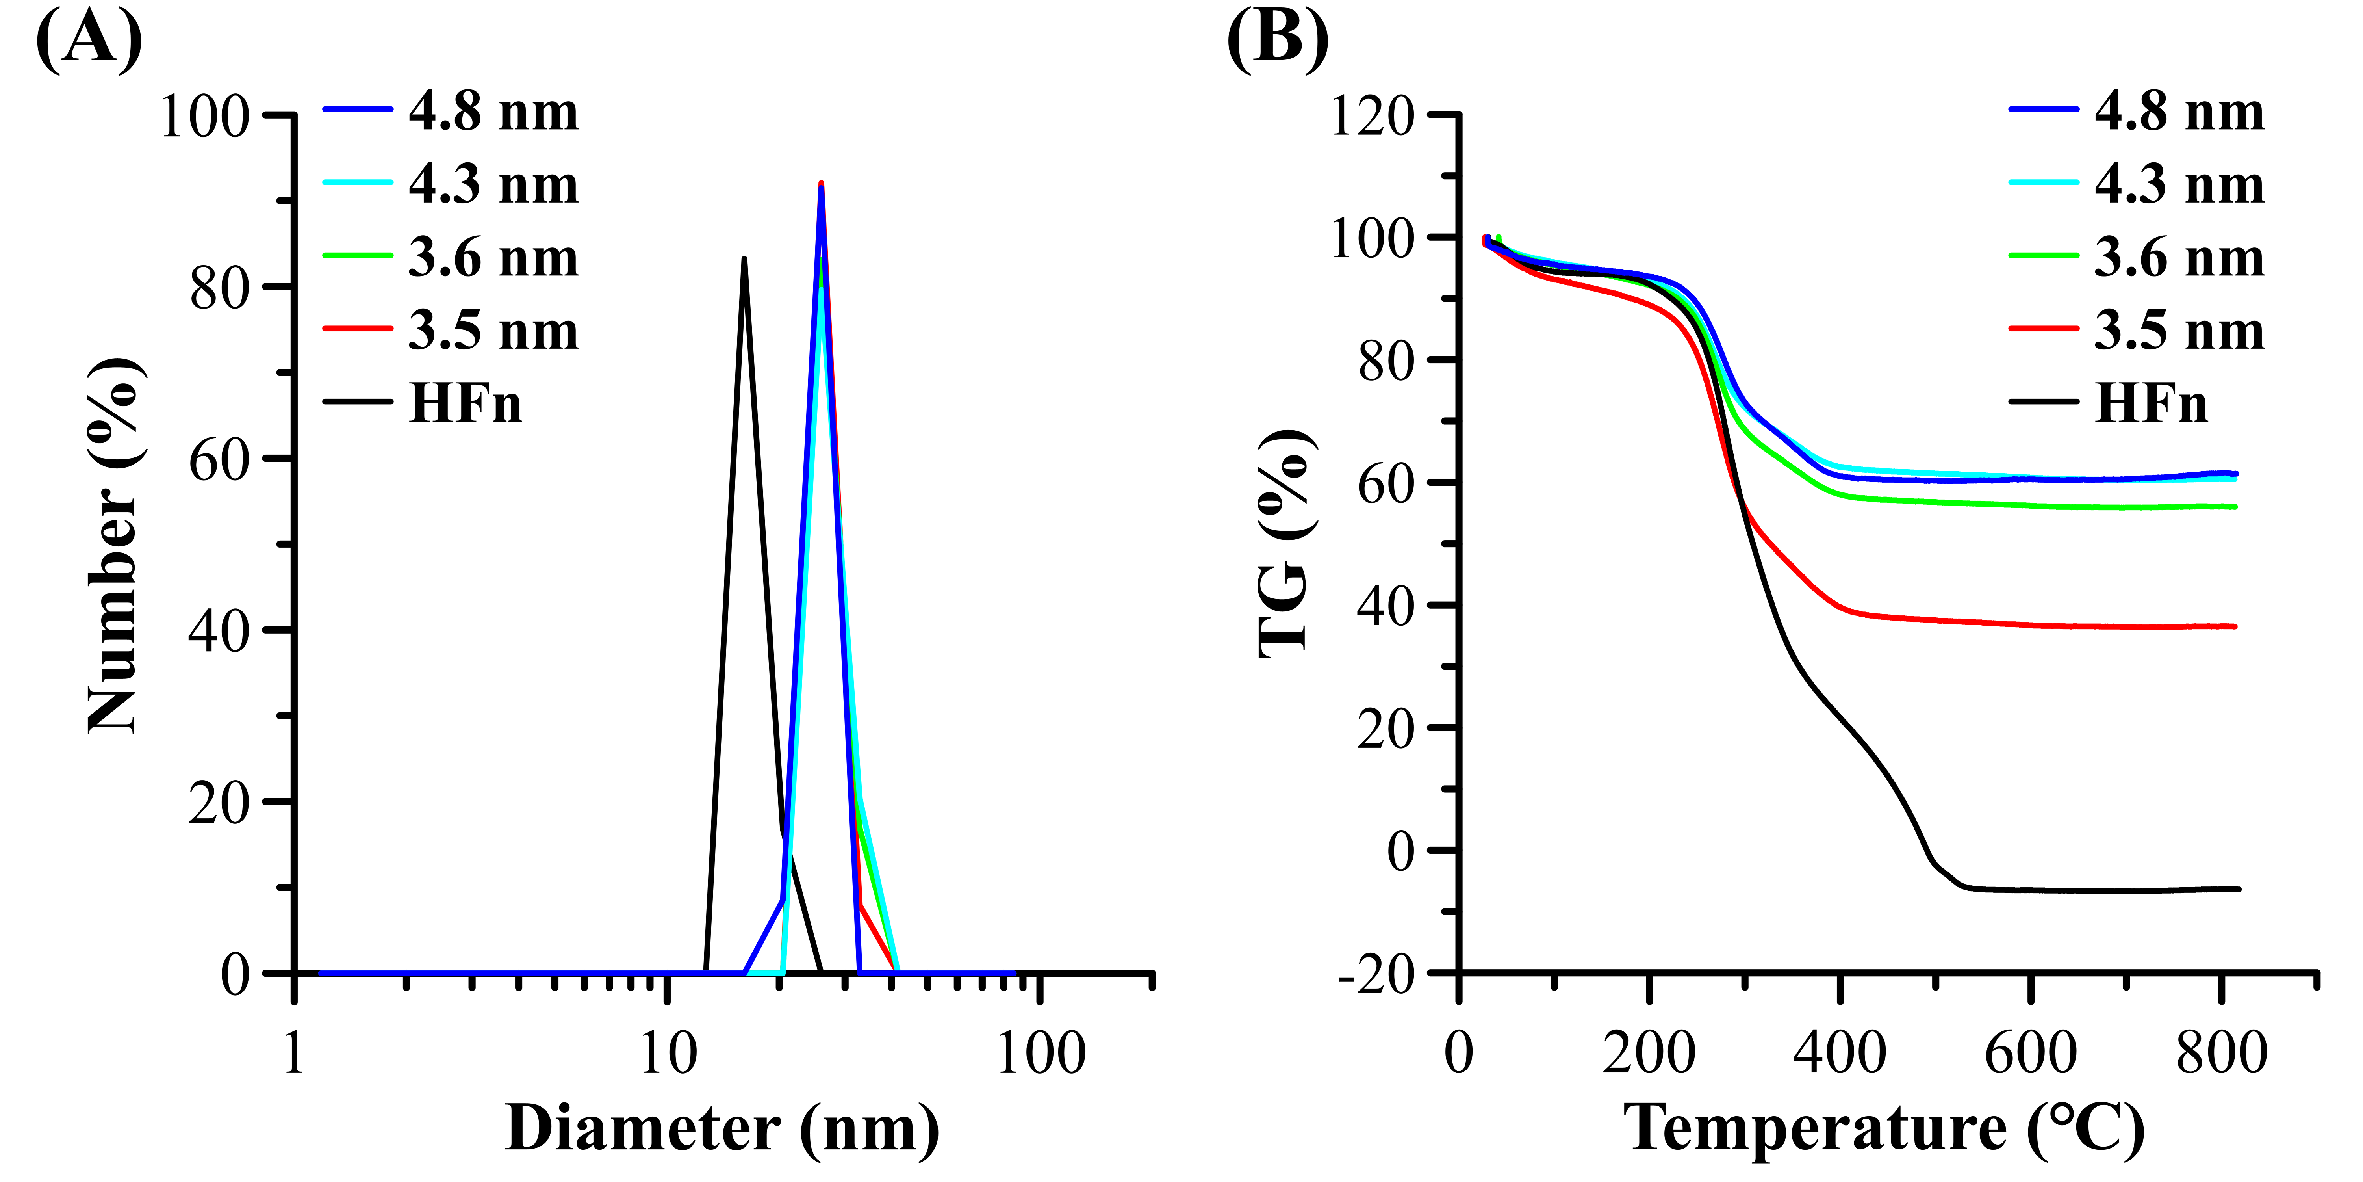
The hydrodynamic diameter of pure HFn is about 16 nm while the mineralized MHFn is about 26 nm, which is larger than the HFn (Figure 4A, Table 1). The inner mineral core may be responsible for this gap. As expected, the inner core mass proportion of particles was increased as core size increases (Figure 4B and Table 1). A clear weight loss from 200–300 °C may be related to protein shell loss.
3.4. Specific Loss Power and Intrinsic Loss Power
3.4.1. Stability of MHFn Nanoparticles in Aqueous
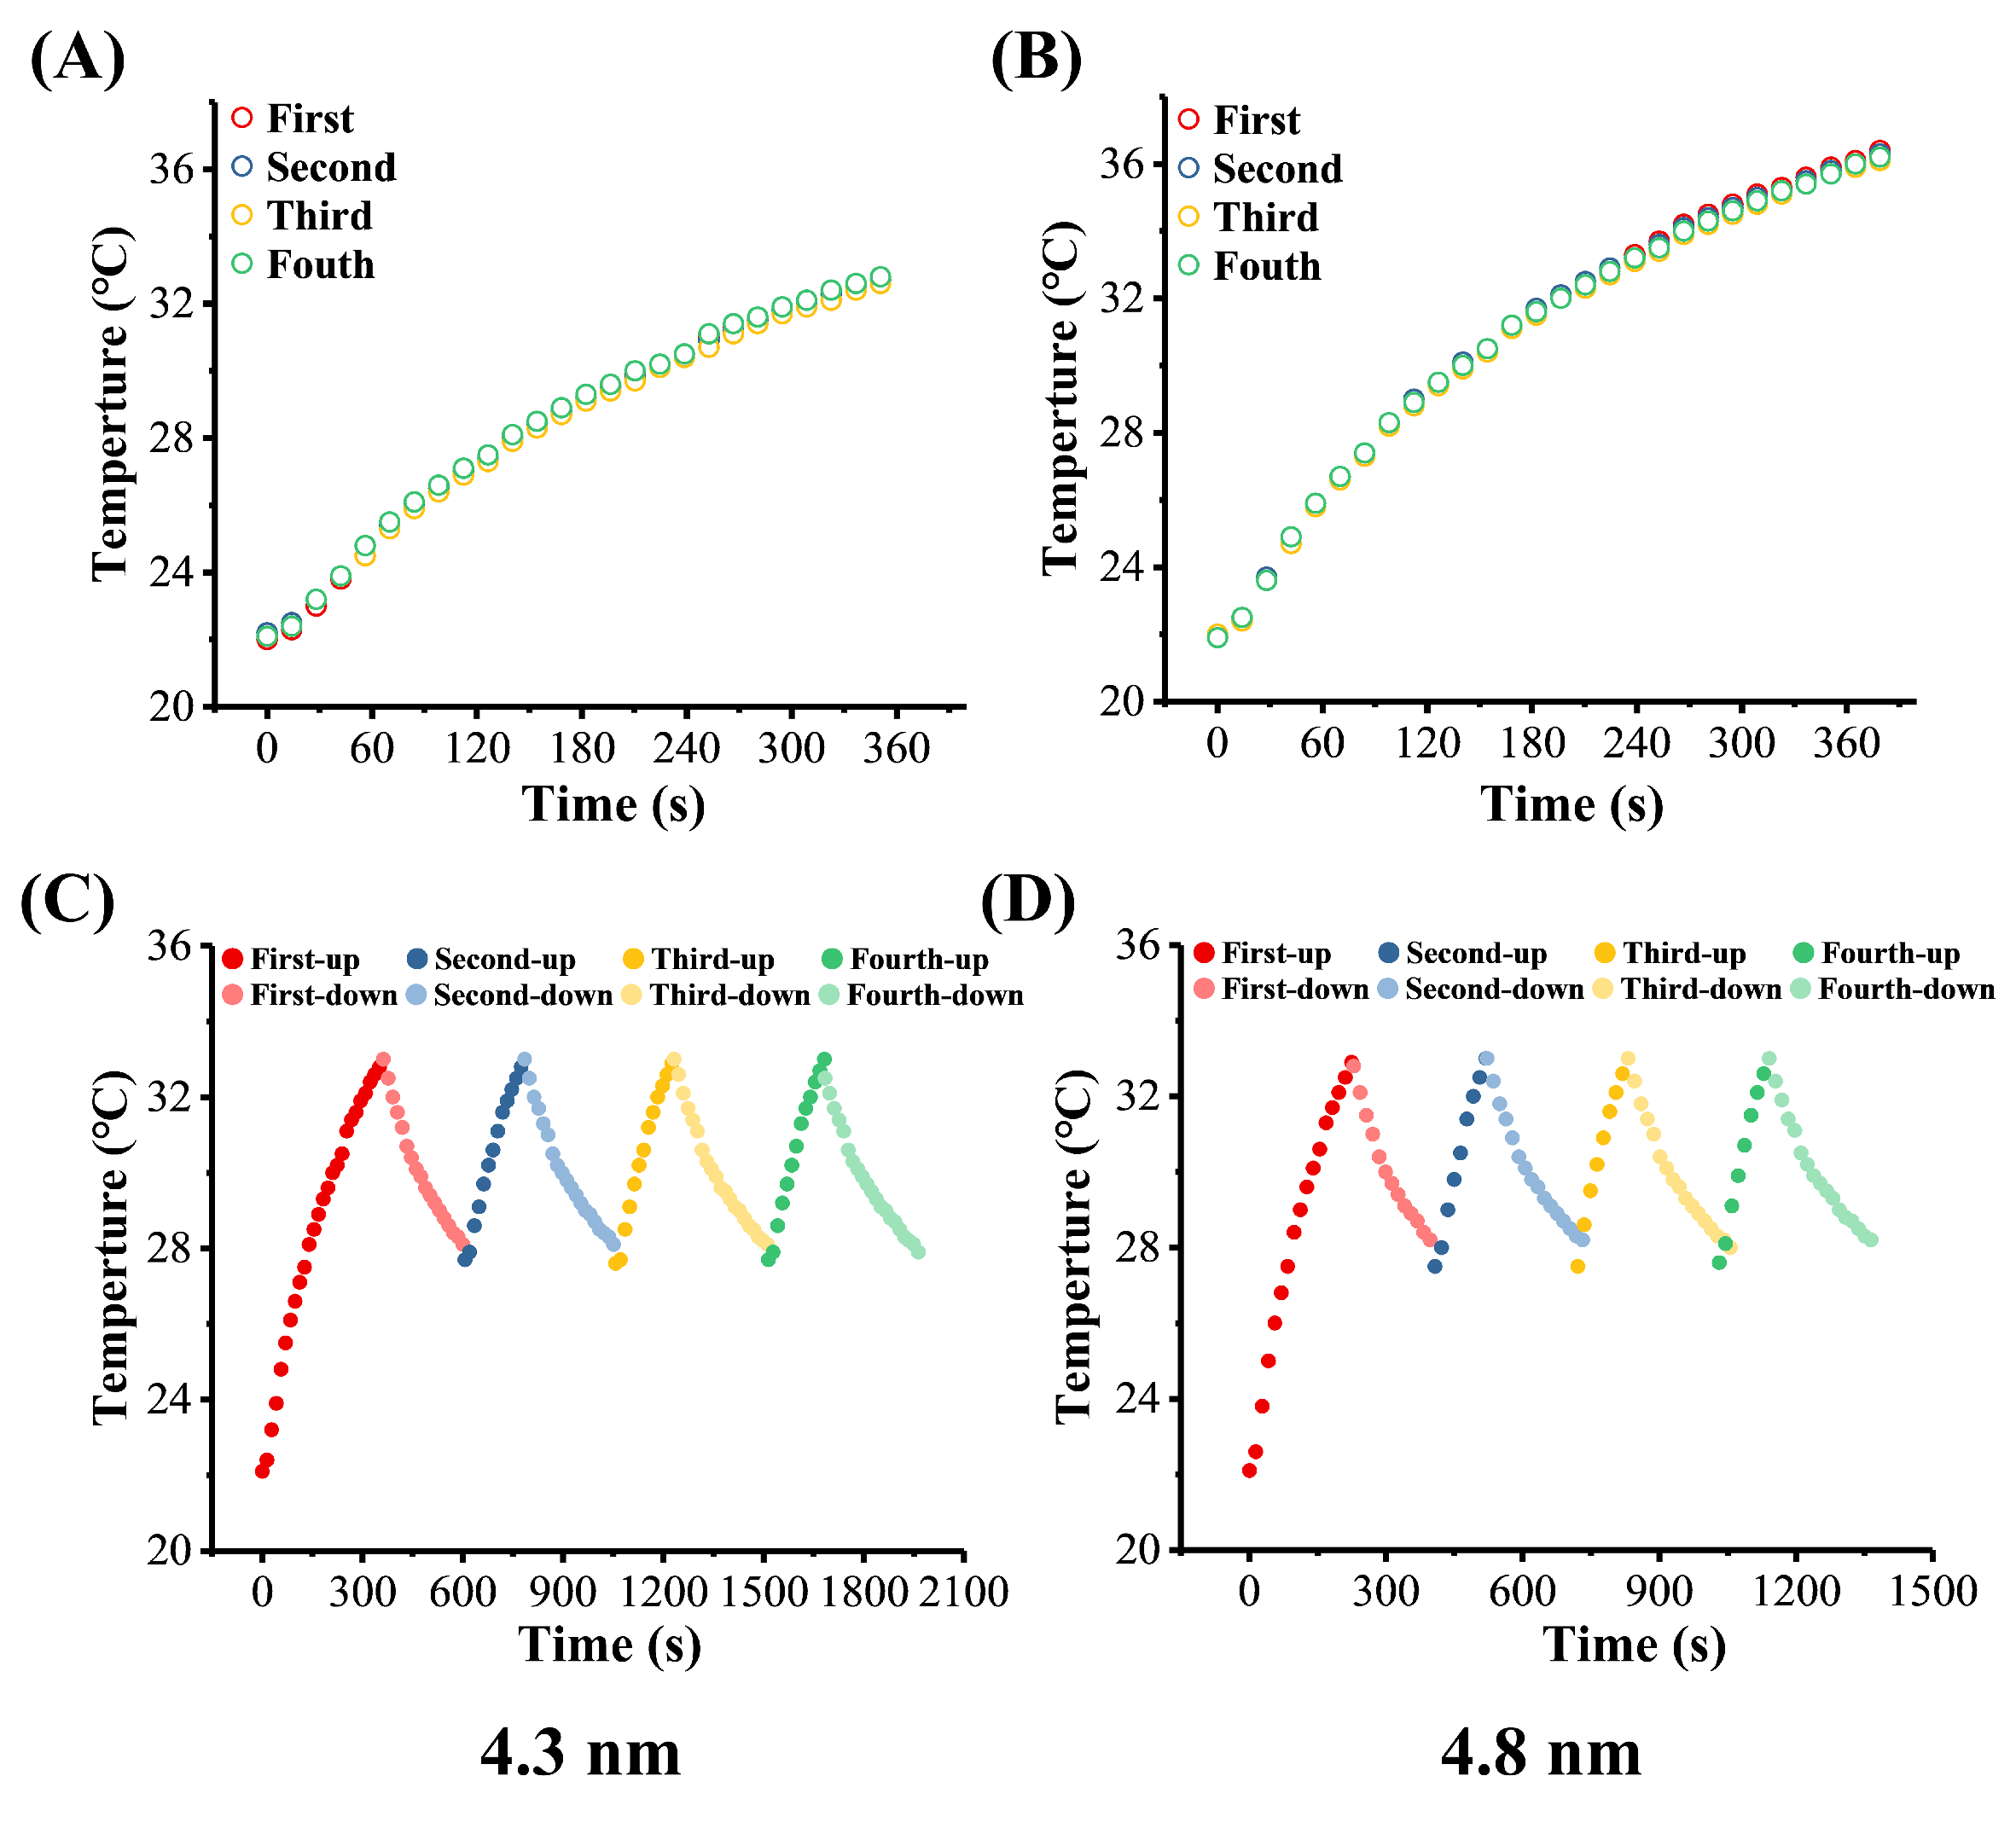
Samples with mean size of 4.3 nm and 4.8 nm were used for analysis. As shown in Figure 5, temperature rising curves of both 4.3 nm and 4.8 nm MHFn were all well overlapped by the single test method (Figure 5A,B), and the same periodical changes were obtained during the four cycles by continuous test method (Figure 5C,D) for both 4.3 nm and 4.8 nm MHFn. The results indicated that the MHFn are stable in aqueous medium during the AMF treatment.
3.4.2. Core-Size and Fe Concentration Effects
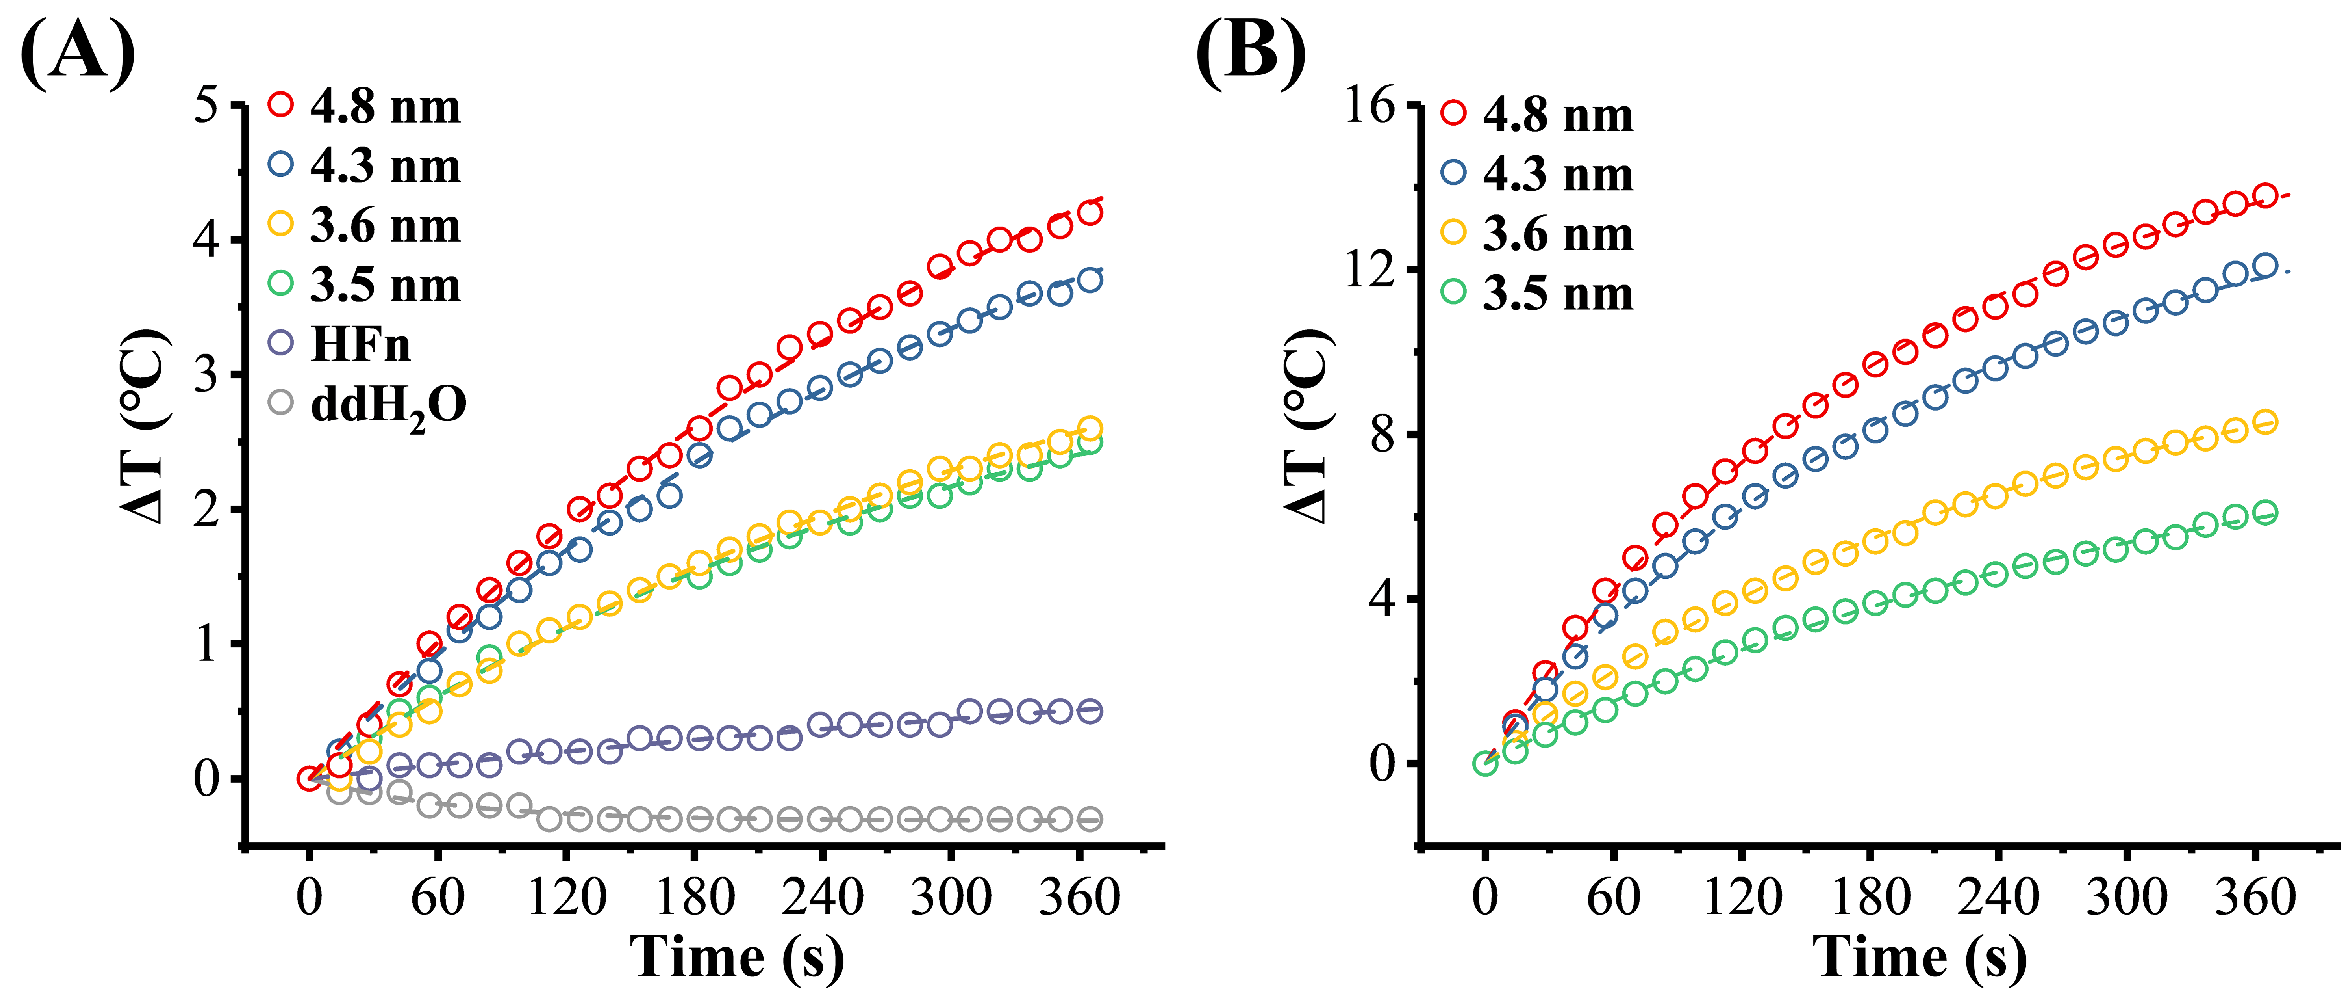
Figure 6 shows the effects of core-size and Fe concentration on the temperature rise of MHFn samples. In this study, two Fe concentrations were used, 1.5 mg[Fe]/mL (Figure 6A) and 5 mg[Fe]/mL (Figure 6B). The SLPs fitting results have been summarized in Table 2. The temperature rise (∆T) at 6 min increases from 2.5 to 4.2 °C with core size increases at 1.5 mg[Fe]/mL (Figure 6A and Table 2), while increases from 6.1 to 13.8 °C at 5 mg[Fe]/mL (Figure 6B and Table 2).
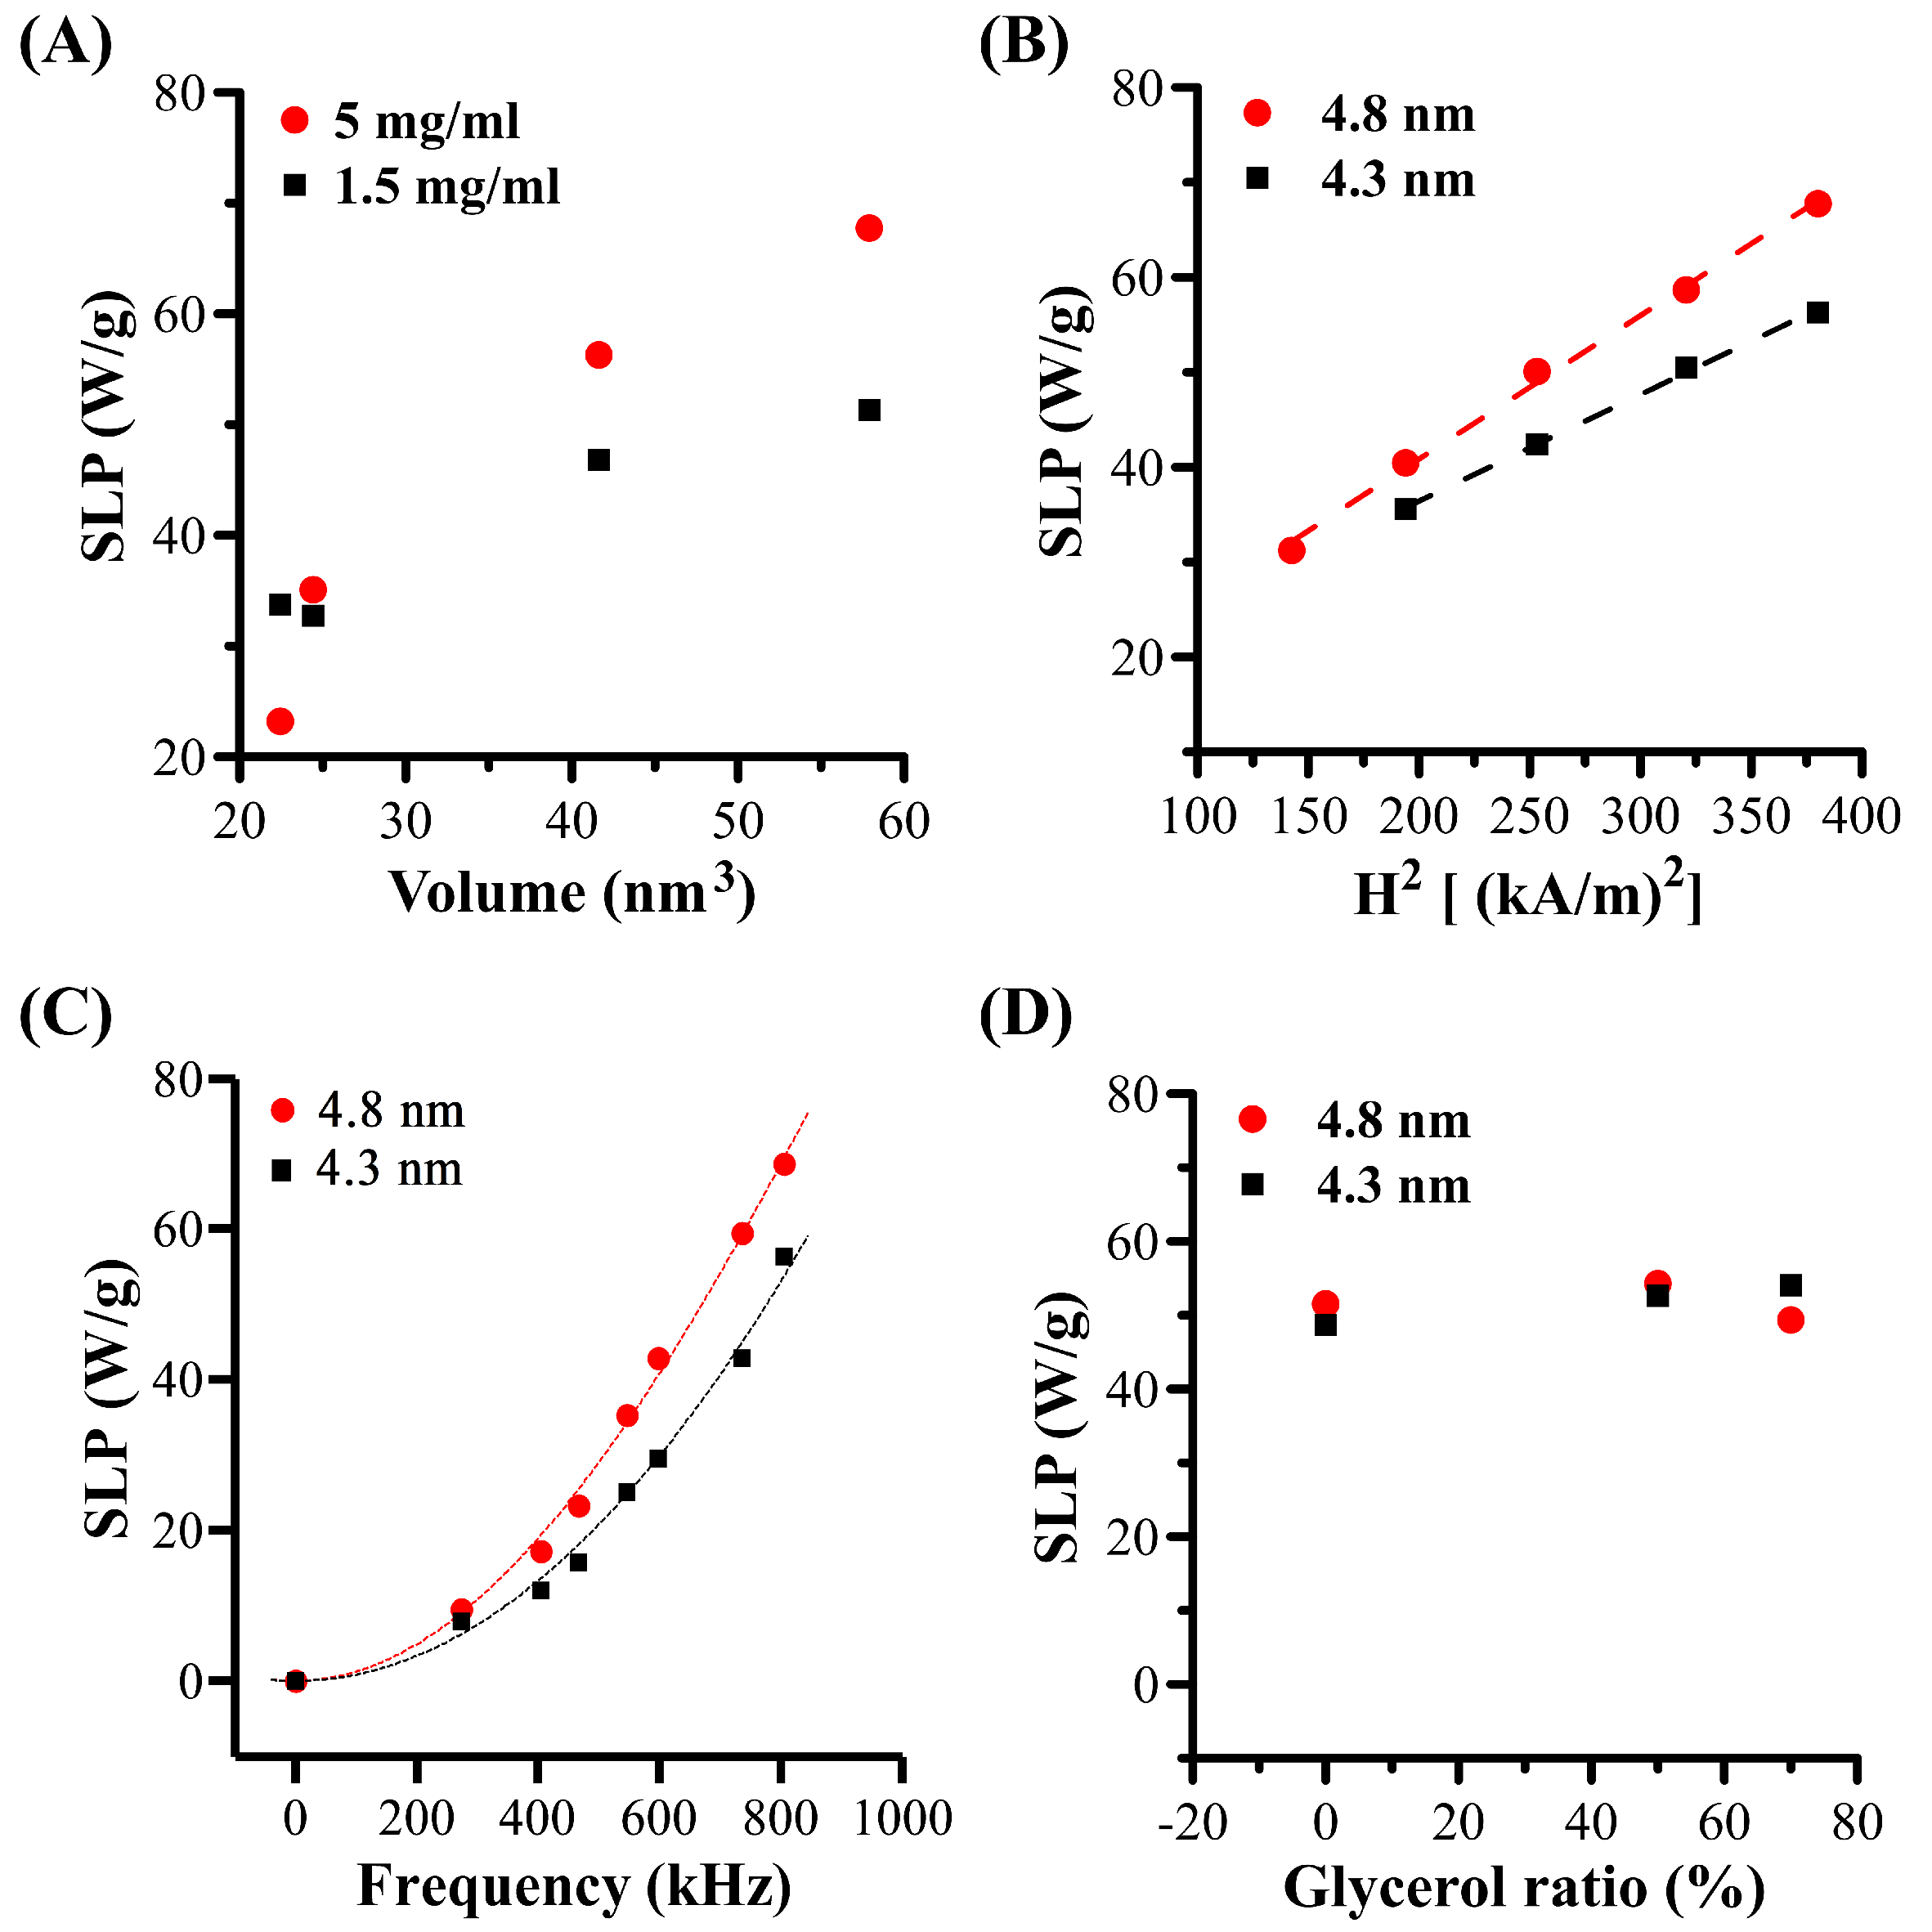
SLP also increases from 32.7 to 51.3 W/g[Fe] at 1.5 mg[Fe]/mL (Figure 7A and Table 2) and from 23.2 to 67.7 W/g[Fe] at 5 mg[Fe]/mL (Figure 7A and Table 2).
Our results show that SLPs of MHFn samples were increased with increasing Fe concentration. However, previous works have shown that SLPs were increased [28,29] or decreased [30,31] with the increasing Fe or nanoparticle concentration. Furthermore, some works have shown that SLPs were independent of Fe or nanoparticle concentration [12,32]. These inconsistent findings may indicate a complicated mechanism of Fe concentration effects on SLP for different MNPs. Nevertheless, for most MNPs, it is believed that increasing the concentration will increase the dipolar interaction while increasing the magnetic anisotropy energy, which results in the SLP increasing gradually to a maximum and then starting to decrease [33]. Generally, as the concentration increases, SLP increases for the smaller particles and decreases for the lager particles with the increasing Fe concentration [34]. Studies on MHFn samples in this work suggest the increasing of SLP with increasing Fe concentration to some extent.
3.4.3. Magnetic Field Effects and the Néel Relaxation
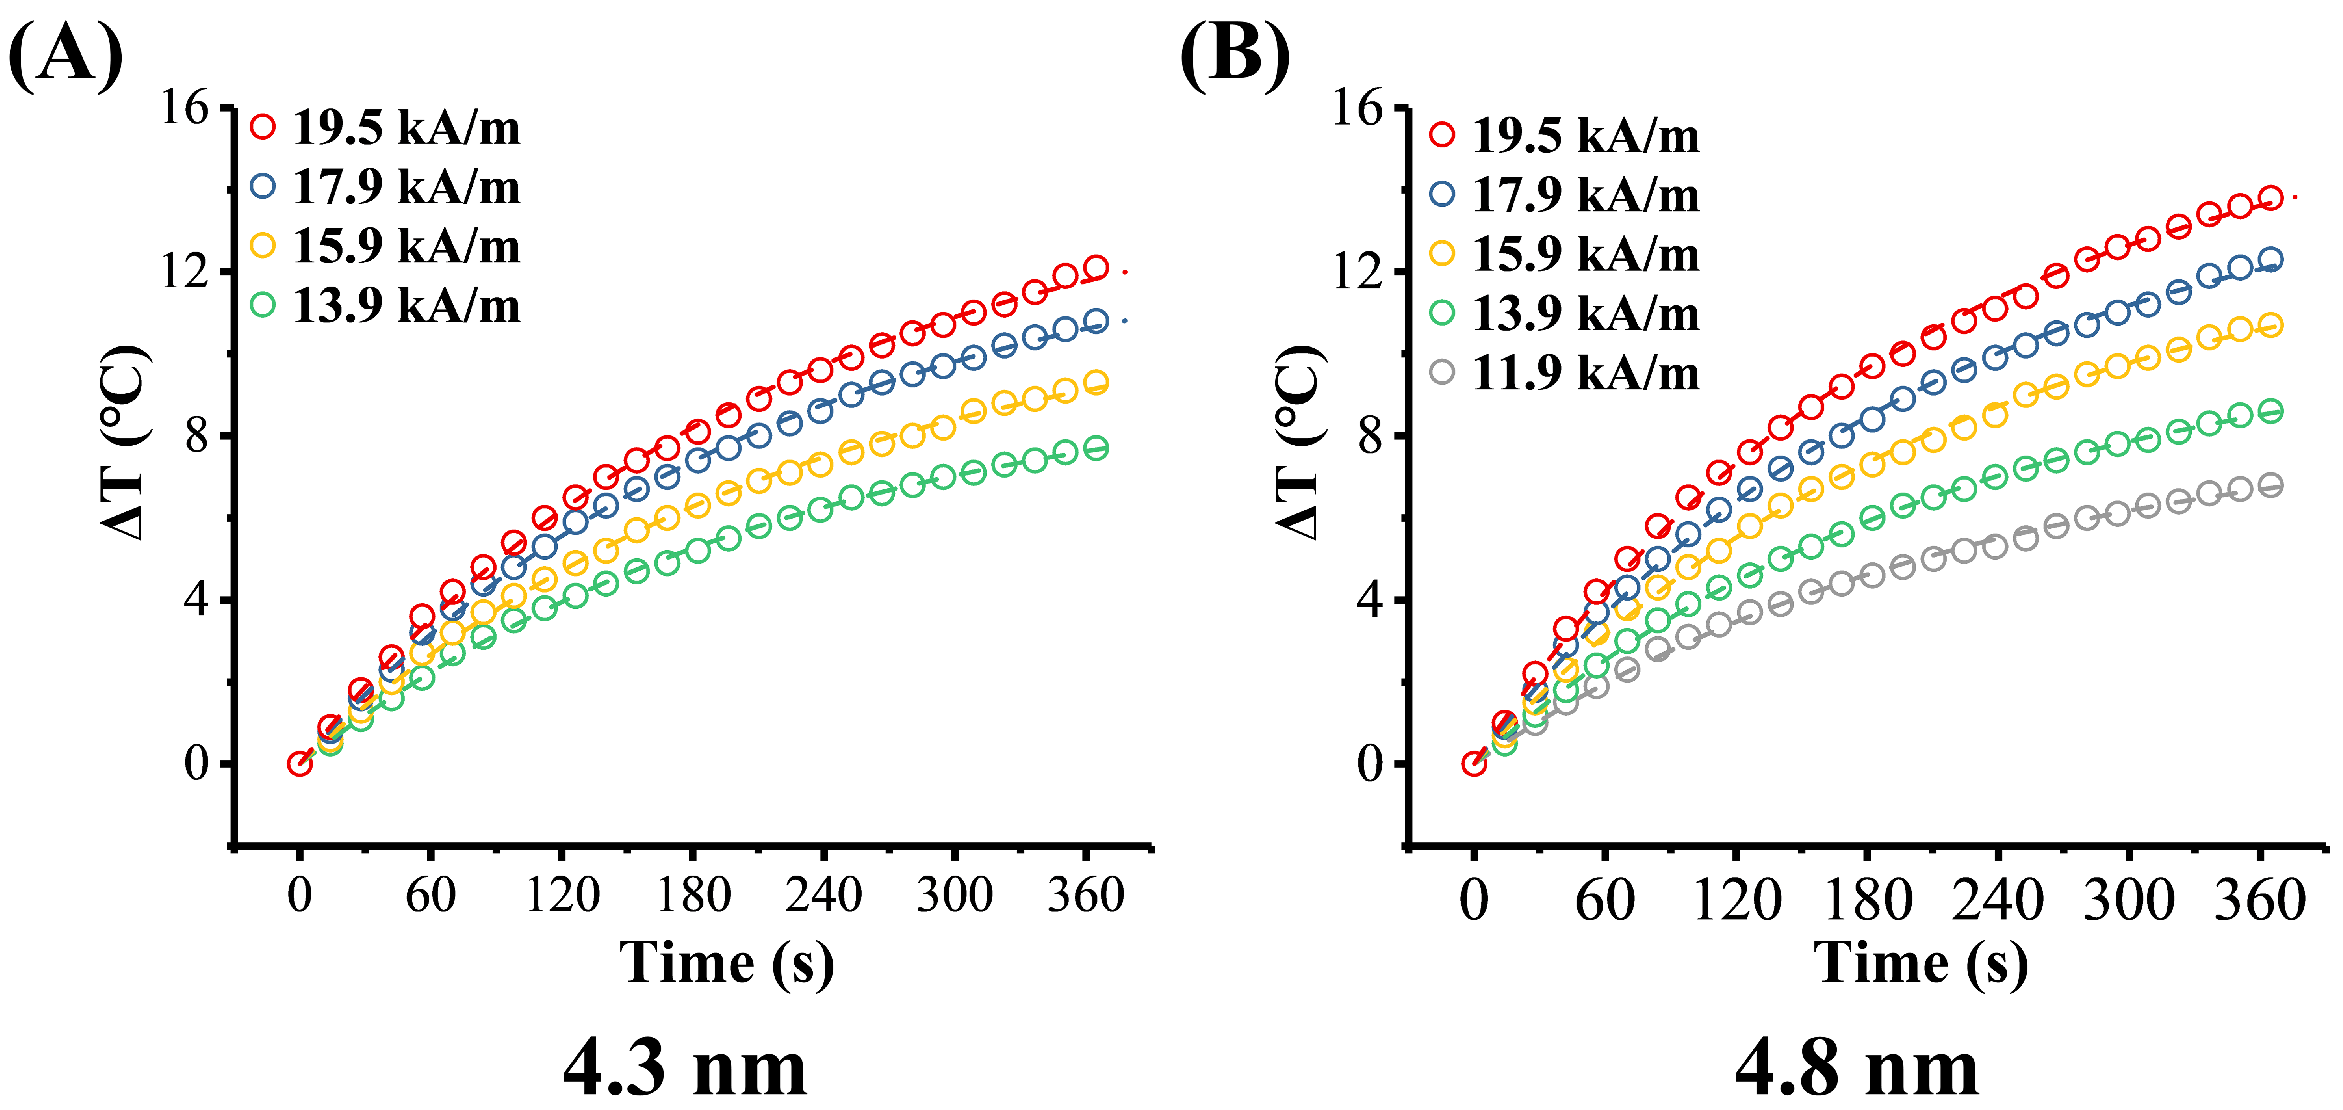
Due to the better temperature rising effect of 4.3 nm and 4.8 nm sized MHFn, we mainly focused on this two samples in the following studies. The effect of the AMF parameter on temperature rise of 4.3 nm and 4.8 nm MHFn samples were carried out at 5 mg[Fe]/mL in aqueous medium. As AMF amplitude increases from 11.9 to 19.5 kA/m under a frequency of 805.5 kHz, the ∆T of 4.3 nm MHFn at 6 min increased from 7.7 to 12.0 °C (Figure 8A and Table 2), and from 6.8 to 13.8 °C for 4.8 nm (Figure 8B and Table 2), respectively. SLPs also increase from 35.6 to 56.3 W/g for 4.3 nm MHFn and from 31.2 to 67.8 W/g for 4.8 nm MHFn (Figure 7B and Table 2). Based on linear response theory (LRT), we fitted the SLP vs. amplitude data with the equation SLPs = afH2 + b and found that the data were well characterized with a R2 > 0.99 (Figure 7B). Note that the slope a is directly the ILP value proposed by Kallumadil [24].
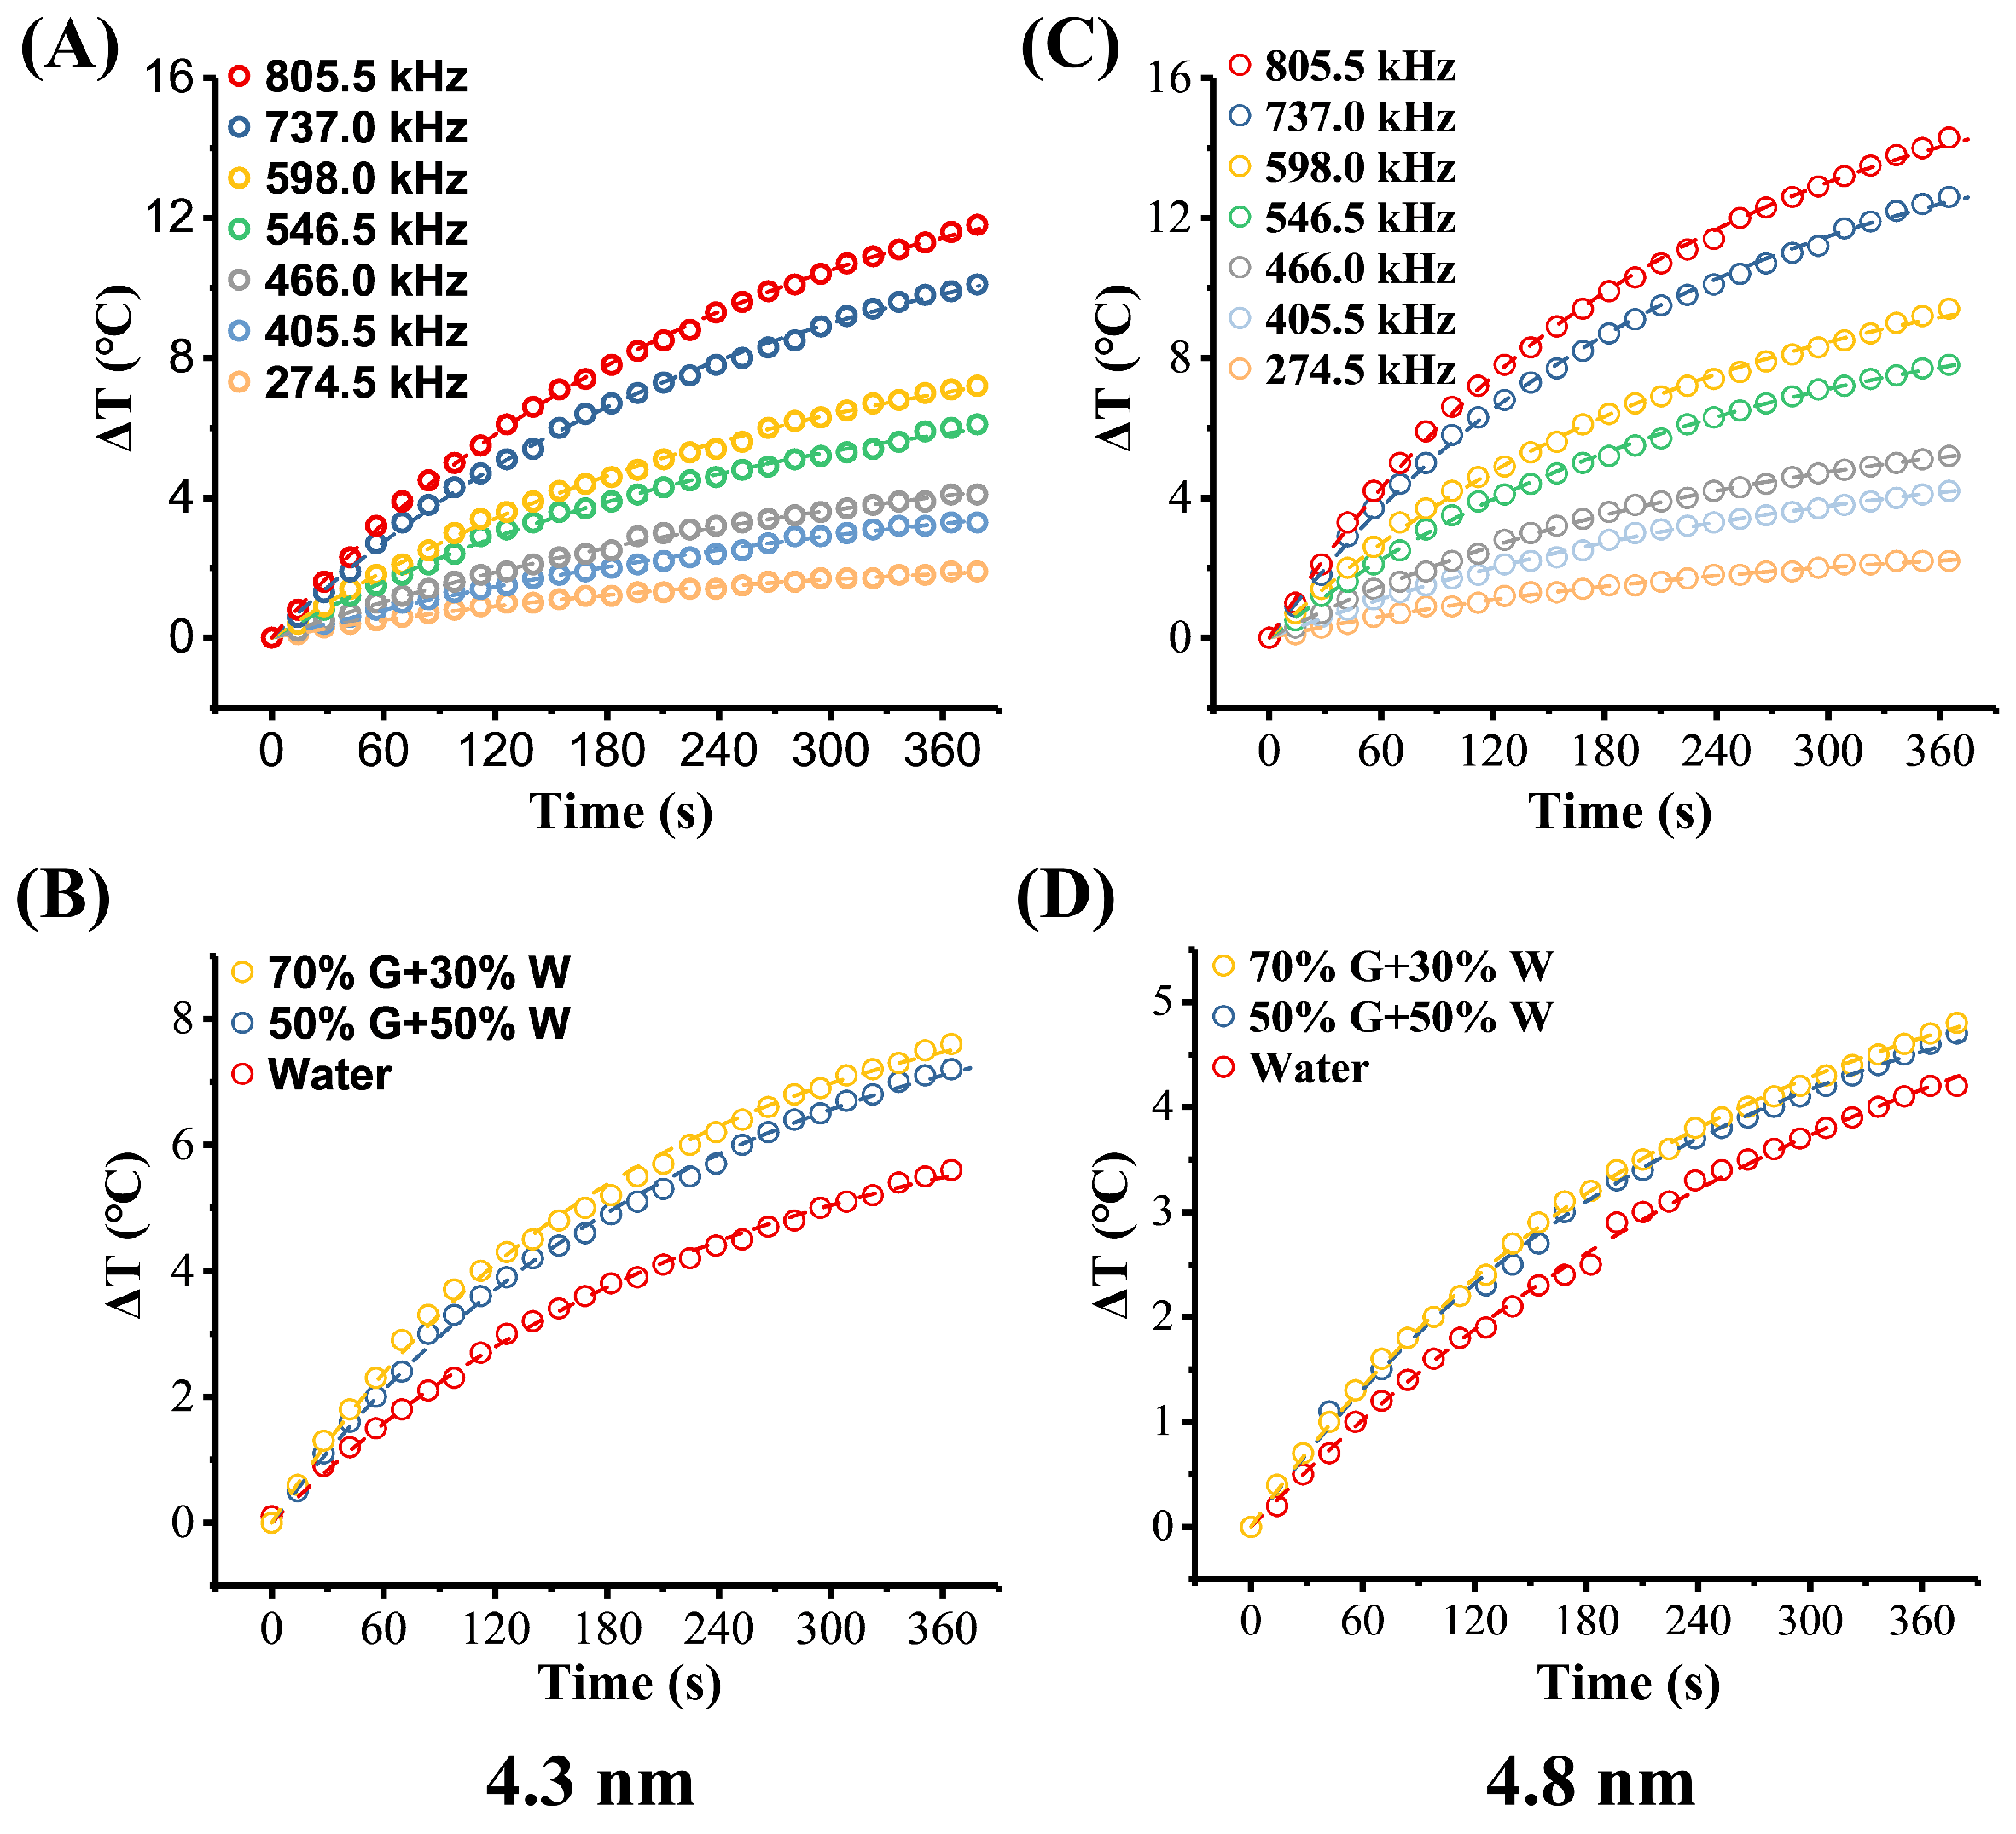
Figure 9A,B and Table 2 show the effect of AMF frequency on temperature rise for this two MHFn samples. The ΔT at 6 min increased about six-fold (from 1.9 °C to 11.5 for 4.3 nm MHFn and from 2.2 to 14.2 °C for 4.8 nm MHFn) when AMF frequency increases from 274.5 to 805.5 kHz under amplitude 19.5 kA/m (Figure 9A,B). It was noted that the SLP also significantly increased with increasing frequency for both 4.3 nm (from 7.9 to 56.3W/g) and 4.8 nm (from 9.5 to 68.6W/g) samples (Figure 7C and Table 2). Here, we fitted the SLPs vs. frequency curve with the formula below [12]:
where A is a parameter about the magnetic property of sample, τfit is fitted effective relaxation time. As shown in Figure 7C, the data were well described by the equation with R2 > 0.99. The fitted relaxation time τfit were shown in Table 3.
The theoretical Néel and Brownian relaxation timew were calculated with the equations developed by Rosensweig [6]. Comparing the relaxation time between fitted relaxation time (τfit), calculated Néel relaxation time (τN), Brownian relaxation time (τB) and effective relaxation time τeff (Table 3), we found both τeff and τfit is comparable to τN.
Additionally, we also measured the temperature rise of MHFn samples in different glycerol ratio solutions (Figure 9B for 4.3 nm MHFn and Figure 9B for 4.8 nm MHFn) to simulate different viscosities. Although the coefficients of viscosity were increased from 1.0 to 22.5 mPa‧s (at 20 °C) [35], SLPs were basically unchanged for both 4.3 nm and 4.8 nm samples (low than 10%) (Figure 7D and Table 2), which is obviously different from previous studies where the SLPs would significantly decrease with increasing viscosity based on a Brownian mechanism [10,36]. Combined the results of theoretical calculated relaxation time and actual measurements under different viscosity conditions, we propose that heat generation mechanism for both 4.3 nm and 4.8 nm MHFn samples is dominated by Néel relaxation.
3.4.4. Intrinsic Loss Power (ILP)
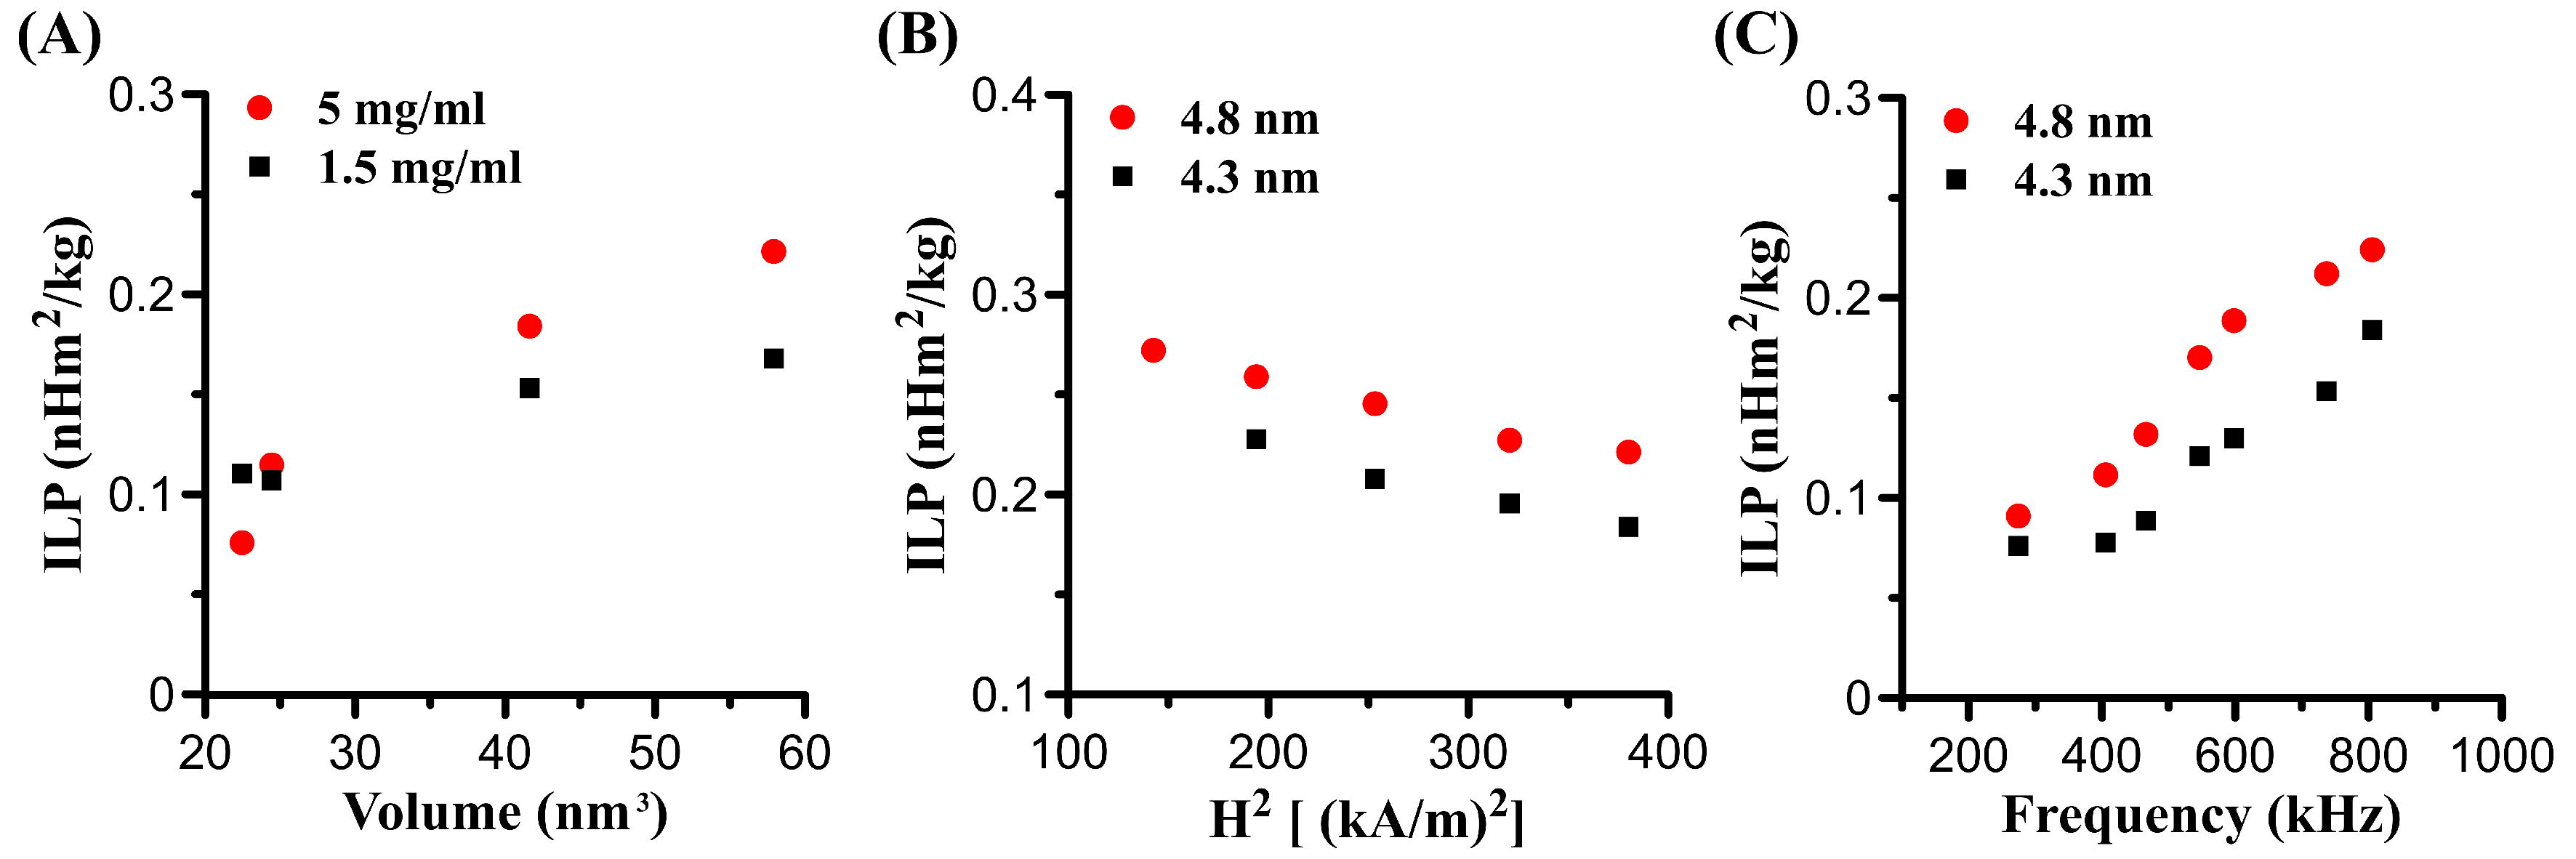
Like SLP, ILP increases with size or volume and increasing Fe concentration (Figure 10A and Table 2). Figure 10C shows the effect of AMF frequency on ILP. We note that the ILP increases with increasing frequency, which indicates that SLPs are not linear with frequency for the measured samples, consistent with a previous study [37]. However, ILP may be independent of frequency for those MNPs whose SLPs are linear with frequency [38].
As we mentioned in Section 3.4.3, ILP can be obtained by fitting SLPs vs. amplitude. We found the ILP decreases with increasing amplitude for both 4.3 nm and 4.8 nm MHFn samples (Figure 10B), which is consistent with previous studies [39,40]. Nevertheless, in the formula ILP = SLP/fH2, if we consider the intercept b in SLP (SLP = afH2 + b), the ILP could be calculated with ILP = (afH2 + b)/fH2 = a + b/fH2. Obviously, the relationship between ILP and amplitude is closely related to the value of intercept b. If b = 0, ILP is independent of amplitude; if b > 0, ILP will decrease with increasing amplitude; oppositely, if b < 0, ILP will increase with increasing amplitude. In this work, ILP decreases with increasing amplitude, and the reason may be the positive intercept b obtained for 4.3 nm MHFn (b = 14.0) and for 4.8 nm MHFn (b = 10.6). Considering these effects on ILP, it may not advisable to calculate the ILP of the particles directly under a single AMF parameter test.
3.5. Physical Model
The equation of motion for spherical MHFn particles in a viscous medium is given by:
where I is the moment of inertia, ω is the angular velocity vector, fr is the rotational viscous friction coefficient, μ is the magnetic moment, H is the applied field, and ξB is the random perturbation torque associated with Brownian motion. The maximum magnitude of the magnetic torque relative to the viscous torque can be evaluated assuming for a sphere with hydrodynamic radius ah in a medium with dynamic viscosity η, and for the magnetic moment of the MHFn’s magnetic core with spontaneous magnetization μs and radius am. Equating with the frequency of the applied field, the ratio between magnetic and viscous torques becomes:
Near-unit values are obtained with maghemite-like (i.e., μs = 380 kA/m), uncoated (i.e., am = ah) particles in water (η = 0.001 Pa⋅s) at the lowest frequency (274.5 kHz) used in these experiments. However, the much smaller magnetic core in MHFn ensures that the magnetic torque is at least two orders of magnitude smaller than the viscous drag, meaning that the magnetic moment is affected only by Néel’s relaxation in the applied field, as for with static magnetic measurements of Figure 2 for mechanically blocked particles.
Heat generation is thus related to the energy loss ∆U of the hysteresis loop M(H) of mechanically blocked particles by:
where the integral represents the area enclosed by the loop. It is therefore possible to compare Equation (4) with the generated heat power if room-temperature hysteresis loops measured at the same frequency and same maximum field as the heat-generating field were available. Because the hysteresis opening is proportional to the amount of blocked particles, one can use Néel’s magnetic relaxation theory to find measurement time τ and temperature T combinations that yield the same fraction of blocked particles and thus the same hysteresis opening. These combinations obey the simple relation:
with τ0 ≈ 0.1 ns being the atomic reorganization time. Using T1 ≈ 300 K and for the room-temperature heating experiments, one gets the temperature:
of equivalent static hysteresis measurements such as those of Figure 2, where τ2 is the total time needed for the measurements. For instance, f = 805.5 kHz and τ2 = 6 h (the typical measurement time required by a MPMS SQUID magnetometer) yields T2 = 85 K. A hysteresis measurement performed at this temperature using the same maximum field H0 of the heating experiments can be used to estimate the hysteresis loss power with Equation (4), after correcting for the temperature dependence of Ms, that is:
This model will likely explain the dependence of SLP on (the opening of Rayleigh loops is proportional to ), as well as the quadratic dependence of SLP on f, since the loop opening depends on the fraction of blocked particles, which increases at larger frequencies.
4. Conclusions
Based on this study, the following conclusions can be drawn:
- (1)
- The heating efficiency SLP of MHFn nanoparticles increased with the core-size, Fe concentration, AMF frequency, and amplitude.
- (2)
- The fitted relaxation time τfit and calculated effective relaxation time τeff were closer to calculated the Néel relaxation time τN, and the SLP of 4.3 nm and 4.8 nm MHFn basically unchanged in different viscosity glycerol-water mixtures. This indicates that the AMF heating generation mechanism of MHFn nanoparticles is dominated by Néel relaxation.
- (3)
- The calculated ILP of MHFn nanoparticles under different AMF frequency and amplitude conditions varied.
- (4)
- The max temperature rise on 6 min measured is 14.2 °C for 4.8 nm MHFn at 5 mg[Fe]/mL under 805 kHz and 19.5 kA/m. This suggests that MHFn nanoparticles may be applied to medical treatments in future for tumor magnetic hyperthermia, heat-triggered drug release with consideration of good biocompatibility and active targeting to various tumors.
Author Contributions
H.X. and Y.P. designed the project. H.X. performed the experiment, and analyzed the data. H.X. and Y.P. wrote this manuscript.
Funding
This work was supported by the National Natural Science Foundation of China (no.: 41621004) and Key Program of Chinese Academy of Sciences (QYZDJ-SSW-DQC024).
Acknowledgments
We thank Shiping Yang, Ping Zhou and Guang Deng at Shanghai Normal University for help in the heating measurement, and Yao Cai for help improving the manuscript. We thank Ramon Egli and the anonymous reviewer for their constructive comments on the manuscript and special thanks to R.E. for providing the physical model in Section 3.5.
Conflicts of Interest
The authors declare no conflict of interest.
References
- Lu, A.H.; Salabas, E.L.; Schuth, F. Magnetic nanoparticles: Synthesis, protection, functionalization, and application. Angew. Chem. Int. Ed. 2007, 46, 1222–1244. [Google Scholar] [CrossRef]
- Dadfar, S.M.; Roemhild, K.; Drude, N.I.; Von Stillfried, S.; Knuchel, R.; Kiessling, F.; Lammers, T. Iron oxide nanoparticles: Diagnostic, therapeutic and theranostic applications. Adv. Drug Deliv. Rev. 2019, 138, 302–325. [Google Scholar] [CrossRef] [PubMed]
- Ma, Y.; Chen, T.; Iqbal, M.Z.; Yang, F.; Hampp, N.; Wu, A.; Luo, L. Applications of magnetic materials separation in biological nanomedicine. Electrophoresis 2019, 40, 2011–2028. [Google Scholar] [CrossRef] [PubMed]
- Das, P.; Colombo, M.; Prosperi, D. Recent advances in magnetic fluid hyperthermia for cancer therapy. Colloids Surf. B Biointerfaces 2019, 174, 42–55. [Google Scholar] [CrossRef] [PubMed]
- Perigo, E.A.; Hemery, G.; Sandre, O.; Ortega, D.; Garaio, E.; Plazaola, F.; Teran, F.J. Fundamentals and advances in magnetic hyperthermia. Appl. Phys. Rev. 2015, 2, 041302. [Google Scholar] [CrossRef] [Green Version]
- Rosensweig, R.E. Heating magnetic fluid with alternating magnetic field. J. Magn. Magn. Mater. 2002, 252, 370–374. [Google Scholar] [CrossRef]
- Ortega, D.; Pankhurst, Q.A. Magnetic hyperthermia. In Nanoscience: Volume 1: Nanostructures through Chemistry; The Royal Society of Chemistry: London, UK, 2013; Volume 1, pp. 60–88. [Google Scholar]
- Hergt, R.; Dutz, S.; Muller, R.; Zeisberger, M. Magnetic particle hyperthermia: Nanoparticle magnetism and materials development for cancer therapy. J. Phys. Condens. Matter 2006, 18, 38. [Google Scholar] [CrossRef]
- Dutz, S.; Hergt, R. Magnetic nanoparticle heating and heat transfer on a microscale: Basic principles, realities and physical limitations of hyperthermia for tumour therapy. Int. J. Hyperth. 2013, 29, 790–800. [Google Scholar] [CrossRef]
- Fortin, J.P.; Wilhelm, C.; Servais, J.; Menager, C.; Bacri, J.C.; Gazeau, F. Size-sorted anionic iron oxide nanomagnets as colloidal mediators for magnetic hyperthermia. J. Am. Chem. Soc. 2007, 129, 2628–2635. [Google Scholar] [CrossRef]
- Fortin, J.P.; Gazeau, F.; Wilhelm, C. Intracellular heating of living cells through Neel relaxation of magnetic nanoparticles. Eur. Biophys. J. 2008, 37, 223–228. [Google Scholar] [CrossRef]
- De La Presa, P.; Luengo, Y.; Multigner, M.; Costo, R.; Morales, M.P.; Rivero, G.; Hernando, A. Study of Heating Efficiency as a Function of Concentration, Size, and Applied Field in γ-Fe2O3 Nanoparticles. J. Phys. Chem. C 2012, 116, 25602–25610. [Google Scholar] [CrossRef]
- Palanisamy, S.; Wang, Y.-M. Superparamagnetic Iron oxide Nanoparticulate System: Synthesis, Targeting, Drug Delivery and Therapy in Cancer. Dalton Trans. 2019, 48, 9490–9515. [Google Scholar] [CrossRef] [PubMed]
- Klem, M.T.; Young, M.; Douglas, T. Biomimetic magnetic nanoparticles. Mater. Today 2005, 8, 28–37. [Google Scholar] [CrossRef]
- Uchida, M.; Flenniken, M.L.; Allen, M.; Willits, D.A.; Crowley, B.E.; Brumfield, S.; Willis, A.F.; Jackiw, L.; Jutila, M.; Young, M.J.; et al. Targeting of cancer cells with ferrimagnetic ferritin cage nanoparticles. J. Am. Chem. Soc. 2006, 128, 16626–16633. [Google Scholar] [CrossRef]
- Uchida, M.; Terashima, M.; Cunningham, C.H.; Suzuki, Y.; Willits, D.A.; Willis, A.F.; Yang, P.C.; Tsao, P.S.; McConnell, M.V.; Young, M.J.; et al. A human ferritin iron oxide nano-composite magnetic resonance contrast agent. Magn. Reson. Med. 2008, 60, 1073–1081. [Google Scholar] [CrossRef]
- Fan, K.L.; Cao, C.Q.; Pan, Y.X.; Lu, D.; Yang, D.L.; Feng, J.; Song, L.; Liang, M.M.; Yan, X.Y. Magnetoferritin nanoparticles for targeting and visualizing tumour tissues. Nat. Nanotechnol. 2012, 7, 459–464. [Google Scholar] [CrossRef]
- Cao, C.; Wang, X.; Cai, Y.; Sun, L.; Tian, L.; Wu, H.; He, X.; Lei, H.; Liu, W.; Chen, G.; et al. Targeted In Vivo Imaging of Microscopic Tumors with Ferritin- based Nanoprobes Across Biological Barriers. Adv. Mater. 2014, 26, 2566–2571. [Google Scholar] [CrossRef]
- Li, L.; Fang, C.J.; Ryan, J.C.; Niemi, E.C.; Lebron, J.A.; Bjorkman, P.J.; Arase, H.; Torti, F.M.; Torti, S.V.; Nakamura, M.C.; et al. Binding and uptake of H-ferritin are mediated by human transferrin receptor-1. Proc. Natl. Acad. Sci. USA 2010, 107, 3505–3510. [Google Scholar] [CrossRef] [Green Version]
- Babincova, M.; Leszczynska, D.; Sourivong, P.; Babinec, P. Selective treatment of neoplastic cells using ferritin-mediated electromagnetic hyperthermia. Med. Hypotheses 2000, 54, 177–179. [Google Scholar] [CrossRef]
- Fantechi, E.; Innocenti, C.; Zanardelli, M.; Fittipaldi, M.; Falvo, E.; Carbo, M.; Shullani, V.; Di Cesare Mannelli, L.; Ghelardini, C.; Ferretti, A.M.; et al. A smart platform for hyperthermia application in cancer treatment: Cobalt-doped ferrite nanoparticles mineralized in human ferritin cages. ACS Nano 2014, 8, 4705–4719. [Google Scholar] [CrossRef]
- Massner, C.; Sigmund, F.; Pettinger, S.; Seeger, M.; Hartmann, C.; Ivleva, N.P.; Niessner, R.; Fuchs, H.; de Angelis, M.H.; Stelzl, A.; et al. Genetically Controlled Lysosomal Entrapment of Superparamagnetic Ferritin for Multimodal and Multiscale Imaging and Actuation with Low Tissue Attenuation. Adv. Funct. Mater. 2018, 28. [Google Scholar] [CrossRef]
- Cao, C.; Tian, L.; Liu, Q.; Liu, W.; Chen, G.; Pan, Y. Magnetic characterization of noninteracting, randomLy oriented, nanometer-scale ferrimagnetic particles. J. Geophys. Res. 2010, 115. [Google Scholar] [CrossRef]
- Kallumadil, M.; Tada, M.; Nakagawa, T.; Abe, M.; Southern, P.; Pankhurst, Q.A. Suitability of commercial colloids for magnetic hyperthermia. J. Magn. Magn. Mater. 2009, 321, 1509–1513. [Google Scholar] [CrossRef]
- Cai, Y.; Wang, Y.; Xu, H.; Cao, C.; Zhu, R.; Tang, X.; Zhang, T.; Pan, Y. Positive magnetic resonance angiography using ultrafine ferritin-based iron oxide nanoparticles. Nanoscale 2019, 11, 2644–2654. [Google Scholar] [CrossRef] [PubMed]
- Yang, C.; Cao, C.; Cai, Y.; Xu, H.; Zhang, T.; Pan, Y. Effects of PEGylation on biomimetic synthesis of magnetoferritin nanoparticles. J. Nanopart. Res. 2017, 19. [Google Scholar] [CrossRef]
- Moskowitz, B.M.; Frankel, R.B.; Walton, S.A.; Dickson, D.P.E.; Wong, K.K.W.; Douglas, T.; Mann, S. Determination of the preexponential frequency factor for superparamagnetic maghemite particles in magnetoferritin. J. Geophys. Res. Solid Earth 1997, 102, 22671–22680. [Google Scholar] [CrossRef] [Green Version]
- Martinez-Boubeta, C.; Simeonidis, K.; Makridis, A.; Angelakeris, M.; Iglesias, O.; Guardia, P.; Cabot, A.; Yedra, L.; Estrade, S.; Peiro, F.; et al. Learning from nature to improve the heat generation of iron-oxide nanoparticles for magnetic hyperthermia applications. Sci. Rep. 2013, 3, 1652. [Google Scholar] [CrossRef]
- Salas, G.; Camarero, J.; Cabrera, D.; Takacs, H.; Varela, M.; Ludwig, R.; Dahring, H.; Hilger, I.; Miranda, R.; Morales, M.d.P.; et al. Modulation of Magnetic Heating via Dipolar Magnetic Interactions in Monodisperse and Crystalline Iron Oxide Nanoparticles. J. Phys. Chem. C 2014, 118, 19985–19994. [Google Scholar] [CrossRef]
- Simeonidis, K.; Martinez-Boubeta, C.; Balcells, L.; Monty, C.; Stavropoulos, G.; Mitrakas, M.; Matsakidou, A.; Vourlias, G.; Angelakeris, M. Fe-based nanoparticles as tunable magnetic particle hyperthermia agents. J. Appl. Phys. 2013, 114. [Google Scholar] [CrossRef]
- Serantes, D.; Baldomir, D.; Martinez-Boubeta, C.; Simeonidis, K.; Angelakeris, M.; Natividad, E.; Castro, M.; Mediano, A.; Chen, D.X.; Sanchez, A.; et al. Influence of dipolar interactions on hyperthermia properties of ferromagnetic particles. J. Appl. Phys. 2010, 108. [Google Scholar] [CrossRef]
- Phong, P.T.; Nam, P.H.; Manh, D.H.; Lee, I.-J. Mn0.5Zn0.5Fe2O4 nanoparticles with high intrinsic loss power for hyperthermia therapy. J. Magn. Magn. Mater. 2017, 433, 76–83. [Google Scholar] [CrossRef]
- Landi, G.T. Role of dipolar interaction in magnetic hyperthermia. Phys. Rev. B 2014, 89. [Google Scholar] [CrossRef]
- Jonasson, C.; Schaller, V.; Zeng, L.; Olsson, E.; Frandsen, C.; Castro, A.; Nilsson, L.; Bogart, L.; Southern, P.; Pankhurst, Q.; et al. Modelling the effect of different core sizes and magnetic interactions inside magnetic nanoparticles on hyperthermia performance. J. Magn. Magn. Mater. 2018. [Google Scholar] [CrossRef]
- Segur, J.B.; Oberstar, H.E. Viscosity of Glycerol and Its Aqueous Solutions. Ind. Eng. Chem. 1951, 43, 2117–2120. [Google Scholar] [CrossRef]
- Phong, P.T.; Nguyen, L.H.; Phong, L.T.H.; Nam, P.H.; Manh, D.H.; Lee, I.J.; Phuc, N.X. Study of specific loss power of magnetic fluids with various viscosities. J. Magn. Magn. Mater. 2017, 428, 36–42. [Google Scholar] [CrossRef]
- Ota, S.; Yamada, T.; Takemura, Y. Magnetization Reversal and Specific Loss Power of Magnetic Nanoparticles in Cellular Environment Evaluated by AC Hysteresis Measurement. J. Nanomater. 2015, 2015, 1–8. [Google Scholar] [CrossRef] [Green Version]
- Iglesias, G.R.; Jabalera, Y.; Peigneux, A.; Checa Fernandez, B.L.; Delgado, A.V.; Jimenez-Lopez, C. Enhancement of Magnetic Hyperthermia by Mixing Synthetic Inorganic and Biomimetic Magnetic Nanoparticles. Pharmaceutics 2019, 11. [Google Scholar] [CrossRef]
- Monnier, C.A.; Crippa, F.; Geers, C.; Knapp, E.; Rothen-Rutishauser, B.; Bonmarin, M.; Lattuada, M.; Petri-Fink, A. Lock-In Thermography as an Analytical Tool for Magnetic Nanoparticles: Measuring Heating Power and Magnetic Fields. J. Phys. Chem. C 2017, 121, 27164–27175. [Google Scholar] [CrossRef] [Green Version]
- Kumar, R.; Chauhan, A.; Jha, S.K.; Kuanr, B.K. Encapsulated lanthanum strontium manganese oxide in mesoporous silica shell: Potential for cancer treatment by hyperthermia therapy. J. Alloys Compd. 2019, 790, 433–446. [Google Scholar] [CrossRef]
Figure 1.
Transmission electron microscopy (TEM) characterization for synthesized MHFn nanoparticles. Column (A). low resolution TEM images. Scale bar: 10 nm. Column (B). high resolution TEM images. Scale bar: 2 nm. Column (C). selected area electron diffraction images. Column (D). size distribution. N, number of particles measured. Dotted line is the lognormal distribution fitting.

Figure 2.
Magnetism characterization for synthesized MHFn nanoparticles. Row (A). hysteresis loops measured at 5 K. Subgraph is an enlargement of the field at ±80 mT. Row (B). hysteresis loops measured at 300 K. Row (C). ZFC/FC magnetization curves. Row (D). normalized IRM acquisition and DC demagnetization of SIRM measured at 5 K.

Figure 3.
(A) influence of nanoparticle volumes on blocking temperature (TB) and (B) saturation magnetization (Ms) (300 K). Dotted line is the linear fitting of the data.
Figure 3.
(A) influence of nanoparticle volumes on blocking temperature (TB) and (B) saturation magnetization (Ms) (300 K). Dotted line is the linear fitting of the data.

Figure 4.
Dynamic light scattering (A) and Thermogravimetry (B) characterization of MHFn nanoparticles.
Figure 4.
Dynamic light scattering (A) and Thermogravimetry (B) characterization of MHFn nanoparticles.

Figure 5.
Repeatability of heating efficiency of the MHFn in aqueous under AMF treatment. (A,B) Single measurement of temperature rise for four times for 4.3 and 4.8 nm samples, respectively. (C,D) Continuous measurement of temperature rise on heating to 33 °C and cooling to 28 °C for four cycles. All the measurements were performed at c = 5 mg[Fe]/mL, magnetic field H = 19.5 kA/m and f = 805.5 kHz.

Figure 6.
Heating efficiency of MHFn nanoparticles with different core sizes at (A) 1.5 mg[Fe]/mL and (B) 5 mg[Fe]/mL. All the measurements were performed in a magnetic field H = 19.5 kA/m and f = 805.5 kHz. Dotted lines are the fitting results of Box-Lucas equation.
Figure 6.
Heating efficiency of MHFn nanoparticles with different core sizes at (A) 1.5 mg[Fe]/mL and (B) 5 mg[Fe]/mL. All the measurements were performed in a magnetic field H = 19.5 kA/m and f = 805.5 kHz. Dotted lines are the fitting results of Box-Lucas equation.

Figure 7.
The Special Loss Power (SLP) vs. different factors. (A) SLP vs. MHFn particles volume. Measurements were performed at H = 19.5 kA/m and f = 805.5 kHz. (B) SLP vs. amplitude. Measurements were performed at c(4.8 nm) = c(4.3 nm) = 5 mg[Fe]/mL, f = 805.5 kHz. Dotted lines were linear fitting with SLP = afH2 + b. (C) SLP vs. frequency. Measurements were performed at c(4.8 nm) = c(4.3 nm) = 5 mg[Fe]/mL, H = 19.5 kA/m. Lines were represent fits results of equation (1). (D) SLP vs. glycerol ratio. Measurements were performed at c(4.8 nm) = 1.5 mg[Fe]/mL, c(4.3 nm) = 2.5 mg[Fe]/mL, H = 19.5 kA/m and f = 805.5 kHz.

Figure 8.
Magnetic field amplitude dependence on heating efficiency of 4.3 nm (A) and 4.8 nm (B) MHFn nanoparticle samples at 5 mg[Fe]/mL. All the measurements were performed at 805.5 kHz. Dotted lines are the fitting results of Box-Lucas equation.
Figure 8.
Magnetic field amplitude dependence on heating efficiency of 4.3 nm (A) and 4.8 nm (B) MHFn nanoparticle samples at 5 mg[Fe]/mL. All the measurements were performed at 805.5 kHz. Dotted lines are the fitting results of Box-Lucas equation.

Figure 9.
Effects of magnetic field frequency and viscosity on heating efficiency of 4.3 nm (A,B) and 4.8 nm (C,D) samples. Dependence of AMF frequency on heating efficiency of (A) 4.3 nm and (C) 4.8 nm MHFn nanoparticles with concentration of 5 mg[Fe]/mL, measured at 19.5 kA/m. Temperature rise measurement in different glycerol-water mixture of (B) 4.3 nm sample at 2.5 mg[Fe]/mL and (D) 4.8 nm sample at 1.5 mg[Fe]/mL performed at magnetic field H = 19.5 kA/m and f = 805.5 kHz. Dotted lines are the fitting results of Box-Lucas equation.

Figure 10.
The intrinsic loss power (ILP) vs. different factors. (A) ILP vs. particles volume. Measurements were performed at H = 19.5 kA/m and f = 805.5 kHz. (B) ILP vs. frequency. Measurements were performed at c(4.8 nm) = c(4.3 nm) = 5 mg[Fe]/mL, H = 19.5 kA/m. (C) ILP vs. amplitude. Measurements were performed at c(4.8 nm) = c(4.3 nm) = 5 mg[Fe]/mL, f = 805.5 kHz.


Table 1.
Core size, magnetic properties of the synthesized MHFn nanoparticles.
| Sample | Core Size (nm) | Dh(PDI) a (nm) | TB (K) | R value | 5 K-Hysterisis | 300 K-Hysterisis | TG (%) | |
|---|---|---|---|---|---|---|---|---|
| Ms (Am2/kg) | Bc (mT) | Ms (Am2/kg) | ||||||
| A | 3.5 ± 0.6 | 16.8(0.10) | 37.2 | 0.42 | 22.6 | 20.9 | 17.0 | 36.5 |
| B | 3.6 ± 0.5 | 26.5(0.07) | 49.5 | 0.40 | 34.6 | 21.9 | 27.0 | 56.1 |
| C | 4.3 ± 0.6 | 27.1(0.10) | 62.5 | 0.39 | 42.3 | 21.1 | 34.0 | 60.6 |
| D | 4.8 ± 0.7 | 25.4(0.06) | 84.5 | 0.38 | 49.5 | 21.8 | 40.9 | 61.5 |
a Dh: hydrodynamic diameter, PDI: polydispersity index.
Table 2.
Summary of temperature rise, SLP and ILP under different Fe concentration, medium and AMF parameter measurement condition.
Table 2.
Summary of temperature rise, SLP and ILP under different Fe concentration, medium and AMF parameter measurement condition.
| Core Size (nm) | Fe Concentration (mg[Fe]/mL) | Solution | Frequency (kHz) | Amplitude (kA/m) | ΔT at 6 mins (°C) | SLP (W/g[Fe]) | ILP (nHm2/kg) |
|---|---|---|---|---|---|---|---|
| 4.8 | 1.5 | Water | 805.5 | 19.5 | 4.2 | 51.3 | 0.17 |
| 4.3 | 1.5 | Water | 805.5 | 19.5 | 3.7 | 46.8 | 0.15 |
| 3.6 | 1.5 | Water | 805.5 | 19.5 | 2.6 | 32.7 | 0.11 |
| 3.5 | 1.5 | Water | 805.5 | 19.5 | 2.5 | 33.7 | 0.11 |
| 4.8 | 5 | Water | 805.5 | 19.5 | 13.8 | 67.7 | 0.22 |
| 4.3 | 5 | Water | 805.5 | 19.5 | 12.0 | 56.3 | 0.18 |
| 3.6 | 5 | Water | 805.5 | 19.5 | 8.2 | 35.1 | 0.11 |
| 3.5 | 5 | Water | 805.5 | 19.5 | 6.1 | 23.2 | 0.08 |
| 4.3 | 5 | Water | 805.5 | 13.9 | 7.7 | 35.6 | 0.23 |
| 4.3 | 5 | Water | 805.5 | 15.9 | 9.2 | 42.4 | 0.21 |
| 4.3 | 5 | Water | 805.5 | 17.9 | 10.7 | 50.5 | 0.20 |
| 4.3 | 5 | Water | 805.5 | 19.5 | 12.0 | 56.3 | 0.18 |
| 4.8 | 5 | Water | 805.5 | 11.9 | 6.8 | 31.2 | 0.27 |
| 4.8 | 5 | Water | 805.5 | 13.9 | 8.5 | 40.4 | 0.26 |
| 4.8 | 5 | Water | 805.5 | 15.9 | 10.7 | 50.1 | 0.25 |
| 4.8 | 5 | Water | 805.5 | 17.9 | 12.3 | 58.7 | 0.23 |
| 4.8 | 5 | Water | 805.5 | 19.5 | 13.8 | 67.8 | 0.22 |
| 4.3 | 5 | Water | 274.5 | 19.5 | 1.9 | 7.9 | 0.08 |
| 4.3 | 5 | Water | 405.5 | 19.5 | 3.3 | 12.0 | 0.08 |
| 4.3 | 5 | Water | 466.0 | 19.5 | 4.0 | 15.7 | 0.09 |
| 4.3 | 5 | Water | 546.5 | 19.5 | 6.0 | 25.1 | 0.12 |
| 4.3 | 5 | Water | 598.0 | 19.5 | 7.0 | 29.5 | 0.13 |
| 4.3 | 5 | Water | 737.0 | 19.5 | 9.9 | 42.9 | 0.15 |
| 4.3 | 5 | Water | 805.5 | 19.5 | 11.5 | 56.3 | 0.18 |
| 4.8 | 5 | Water | 274.5 | 19.5 | 2.2 | 9.5 | 0.09 |
| 4.8 | 5 | Water | 405.5 | 19.5 | 4.2 | 17.2 | 0.11 |
| 4.8 | 5 | Water | 466.0 | 19.5 | 5.2 | 23.3 | 0.13 |
| 4.8 | 5 | Water | 546.5 | 19.5 | 7.8 | 35.7 | 0.17 |
| 4.8 | 5 | Water | 598.0 | 19.5 | 9.3 | 42.9 | 0.19 |
| 4.8 | 5 | Water | 737.0 | 19.5 | 12.6 | 59.4 | 0.21 |
| 4.8 | 5 | Water | 805.5 | 19.5 | 14.2 | 68.6 | 0.22 |
| 4.3 | 2.5 | 100% water + 0 glycerol | 805.5 | 19.5 | 5.5 | 48.7 | 0.16 |
| 4.3 | 2.5 | 50% water + 50% glycerol | 805.5 | 19.5 | 7.2 | 52.6 | 0.17 |
| 4.3 | 2.5 | 30% water + 70% glycerol | 805.5 | 19.5 | 7.6 | 54.1 | 0.18 |
| 4.8 | 1.5 | 100% water + 0 glycerol | 805.5 | 19.5 | 4.2 | 51.5 | 0.17 |
| 4.8 | 1.5 | 50% water + 50% glycerol | 805.5 | 19.5 | 4.6 | 54.3 | 0.18 |
| 4.8 | 1.5 | 30% water + 70% glycerol | 805.5 | 19.5 | 4.7 | 49.3 | 0.16 |
Table 3.
Calculated relaxation time.
| Sample | τB (s) | τN (s) | τeff-cal | τfit |
|---|---|---|---|---|
| 4.3 nm | 6.5 × 10⁻⁶ | 7.3 × 10⁻⁸ | 7.2 × 10⁻⁸ | 1.1 × 10⁻⁸ |
| 4.8 nm | 6.5 × 10⁻⁶ | 4.0 × 10⁻⁷ | 3.8 × 10⁻⁷ | 7.5 × 10⁻⁸ |
© 2019 by the authors. Licensee MDPI, Basel, Switzerland. This article is an open access article distributed under the terms and conditions of the Creative Commons Attribution (CC BY) license (http://creativecommons.org/licenses/by/4.0/).
Share and Cite
MDPI and ACS Style
Xu, H.; Pan, Y. Experimental Evaluation on the Heating Efficiency of Magnetoferritin Nanoparticles in an Alternating Magnetic Field. Nanomaterials 2019, 9, 1457. https://doi.org/10.3390/nano9101457
AMA Style
Xu H, Pan Y. Experimental Evaluation on the Heating Efficiency of Magnetoferritin Nanoparticles in an Alternating Magnetic Field. Nanomaterials. 2019; 9(10):1457. https://doi.org/10.3390/nano9101457
Chicago/Turabian StyleXu, Huangtao, and Yongxin Pan. 2019. "Experimental Evaluation on the Heating Efficiency of Magnetoferritin Nanoparticles in an Alternating Magnetic Field" Nanomaterials 9, no. 10: 1457. https://doi.org/10.3390/nano9101457
Note that from the first issue of 2016, this journal uses article numbers instead of page numbers. See further details here.