Article

Short-Range Correlated Magnetic Core-Shell CrO2/Cr2O3 Nanorods: Experimental Observations and Theoretical Considerations

1
Department of Physics, National Dong Hwa University, Hualien 97401, Taiwan
2
National Synchrotron Radiation Research Center, Hsinchu 300, Taiwan
*
Author to whom correspondence should be addressed.
Nanomaterials 2018, 8(5), 312; https://doi.org/10.3390/nano8050312
Submission received: 14 March 2018 / Revised: 1 May 2018 / Accepted: 7 May 2018 / Published: 9 May 2018
(This article belongs to the Special Issue Ferromagnetic and Magnetic Properties of Nanostructures)

Abstract

:
With the evolution of synthesis and the critical characterization of core-shell nanostructures, short-range magnetic correlation is of prime interest in employing their properties to develop novel devices and widespread applications. In this regard, a novel approach of the magnetic core-shell saturated magnetization (CSSM) cylinder model solely based on the contribution of saturated magnetization in one-dimensional CrO2/Cr2O3 core-shell nanorods (NRs) has been developed and applied for the determination of core-diameter and shell-thickness. The nanosized effect leads to a short-range magnetic correlation of ferromagnetic core-CrO2 extracted from CSSM, which can be explained using finite size scaling method. The outcome of this study is important in terms of utilizing magnetic properties for the critical characterization of core-shell nanomagnetic materials.

Graphical Abstract

1. Introduction

A usual approach in nanoscience generally involves two steps: first, the fabrication and characterization of nanomaterials, and second, employing their properties for the development of novel devices and widespread applications. In recent years, the fabrication and critical characterization of core-shell nanostructures has attracted enormous attention because of their widespread applications [1,2,3,4,5]. The enormous progress made in the field of high-density recording and nanotechnology make the study of exchange bias (EB) ferromagnetic (FM)/Antiferromagnetic (AF) core/shell system important. Among different EB systems, exchange coupled CrO2/Cr2O3 are the least explored nanostructures due to difficulty in the critical characterization of constitute phases [6,7,8]. CrO2 is a half-metallic ferromagnetic (FM) [9] material with a Curie temperature (TC) of ~394 K, well above room temperature, which was used widely as an information storage material for magnetic recording tapes [10,11]. Recently, the half-metallic properties [12] of CrO2 such as spin-dependent magnet-transport [13,14], double exchange coupling interactions due to the self-doping effect [15], the large magnetoresistance effect [16,17], and anomalous transport properties [18], etc., have attracted enormous interest. On the other hand, Cr2O3 is a low-anisotropy easy axis antiferromagnetic (AF) material with a Neel temperature (TN) of ~307 K [19,20]. It exhibits piezomagnetic and magnetoelectric effects, and can be used in a device involving EB coupling, which makes it a promising material for the future spintronic-based applications [21,22,23]. The core-shell CrO2/Cr2O3 nanostructures can easily be formed even at room temperature simply by the surface reduction of CrO2 to Cr2O3 when exposed to air for a prolonged period of time [24]. Such an insulating Cr2O3 surface layer was treated as a tunneling barrier between CrO2 particles by EB coupling [25]. The interface-driven magnetoelectric effect has also been reported from granular CrO2 due to the formation of AF-Cr2O3 surface layer [26,27]. The core diameter d c o r e of CrO2 and shell-thickness t s h e l l of Cr2O3 can be further tuned simply by a thermal treatment in an ambient atmosphere at an elevated temperature. With the increase of reduction temperature, the long-range AF spin correlation of the Cr2O3 phase strengthens at the expense of the core CrO2 phase, resulting in a short-range FM spin correlation. Therefore, due to the reduction of CrO2 to Cr2O3, the magnetic configuration of the system is expected to experience the coexistence and competition of AF and FM interactions. However, the most difficult part is its critical characterization, particularly estimating the values of d c o r e and t s h e l l parameters.
In this work, the effect of thermal treatment resulting in the surface reduction of CrO2 nanorods (NRs) to Cr2O3 phase is studied via the Rietveld refined X-ray diffraction (XRD) spectra and magnetic measurements. We have demonstrated utilization of magnetic properties of FM-CrO2 as a tool to estimate the values of d c o r e and t s h e l l of CrO2/Cr2O3 core-shell NRs. The observed finite size scaling behavior from core diameter d c o r e the dependency of TC, confirmed the validity of used magnetic property-based theoretical expression.

2. Synthesis of CrO2/Cr2O3 Nanostructures

In the synthesis of CrO2-core with Cr2O3-shell NRs, we have carried out the reduction of pristine CrO2 NRs simply by thermal treatment at 450, 500, 550, and 600 °C for a duration of 1 h in an ambient atmosphere. The pristine CrO2 NRs were obtained commercially from Sigma-Aldrich (St. Louis, MO, USA) under the name of Magnetrieve. The reduction is carried out in a tube furnace with a heating rate of 5 K/min and allowed to cool down naturally. Note that thermal treatment at and above 650 °C resulted in a complete reduction of CrO2 into pure AF Cr2O3 phase [28]. Structural properties were studied using synchrotron radiation XRD (SRXRD) (λ = 0.7749 Å) at National Synchrotron Radiation Research Center (NSRRC) beamline BL01C2 in Taiwan. Further analysis of the structural properties was carried out by selective area diffraction pattern (SAED) using JEOL 2010 TEM (Peabody, MA, USA) working at 200 kV. The analysis of SAED pattern was done by CaRIne Crystallography 3.1 software. Field-emission scanning electron microscopy (FE-SEM, JEOL JSM-6500F, Peabody, MA, USA) was utilized for the estimation of diameter distribution and morphological analysis. The mean diameter distribution was estimated from relative SEM images using Nano Measurer version 1.2.5. The temperature dependences of zero-field-cooled (ZFC) and field-cooled (FC) magnetization, thermoremanent magnetization (TRM) decay, and isothermal field dependences of magnetization measurements were carried out using a quantum design MPMS-SQUID-VSM magnetometer (San Diego, CA, USA).

3. Results and Discussion

3.1. X-ray Diffraction Analysis

Figure 1 displays the SRXRD spectra for the pristine CrO2 NRs and 450, 500, 550, and 600 °C samples (spectra are shifted vertically for clear visibility). The diffraction spectrum of the pristine NRs is assigned to pure CrO2 phase indexed with space group P42/mnm [25]. Along with CrO2 phase, SRXRD spectra of 450 °C sample display additional peaks assigned to Cr2O3 phase indexed with space group R3-c [28]. 500, 550, and 600 °C samples do not show any noticeable diffraction peaks for CrO2 phase, as can be clearly visualized from magnified spectrum shown in the supporting Figure S1a. For further detailed structural analysis, Rietveld [29] refinement of SRXRD spectra was carried out using GSAS [30] software package. The solid black line in Figure 1 is the fitted curve, and fitting parameters are tabulated in Supporting Table S1. From Rietveld refinement, we confirm that (i) only CrO2 phase (a = b = 4.4215 Å, c = 2.9177 Å) existed in the pristine sample; (ii) both CrO2 (a = b = 4.4715 Å, c = 2.9206 Å; weight fraction 0.33%) and Cr2O3 (a = b = 4.9595 Å, c = 13.5684 Å; weight fraction 99.67%) phases existed in 450 °C sample; and (iii) only Cr2O3 phase existed in 500 to 600 °C samples. The variation in the lattice constant (a = b, c) of Cr2O3 phase with respect to the annealing temperature (TA) is depicted in supporting Figure S1b. As compared to bulk Cr2O3 (a = b = 4.959 Å, c = 13.589 Å), sample reduced at 450 °C shows a noticeable lattice contraction along c-axis, whereas lattice constants along a-, b-axis have a value close to bulk. The observed contraction along c-axis could be attributed to finite size effect or defects [28].

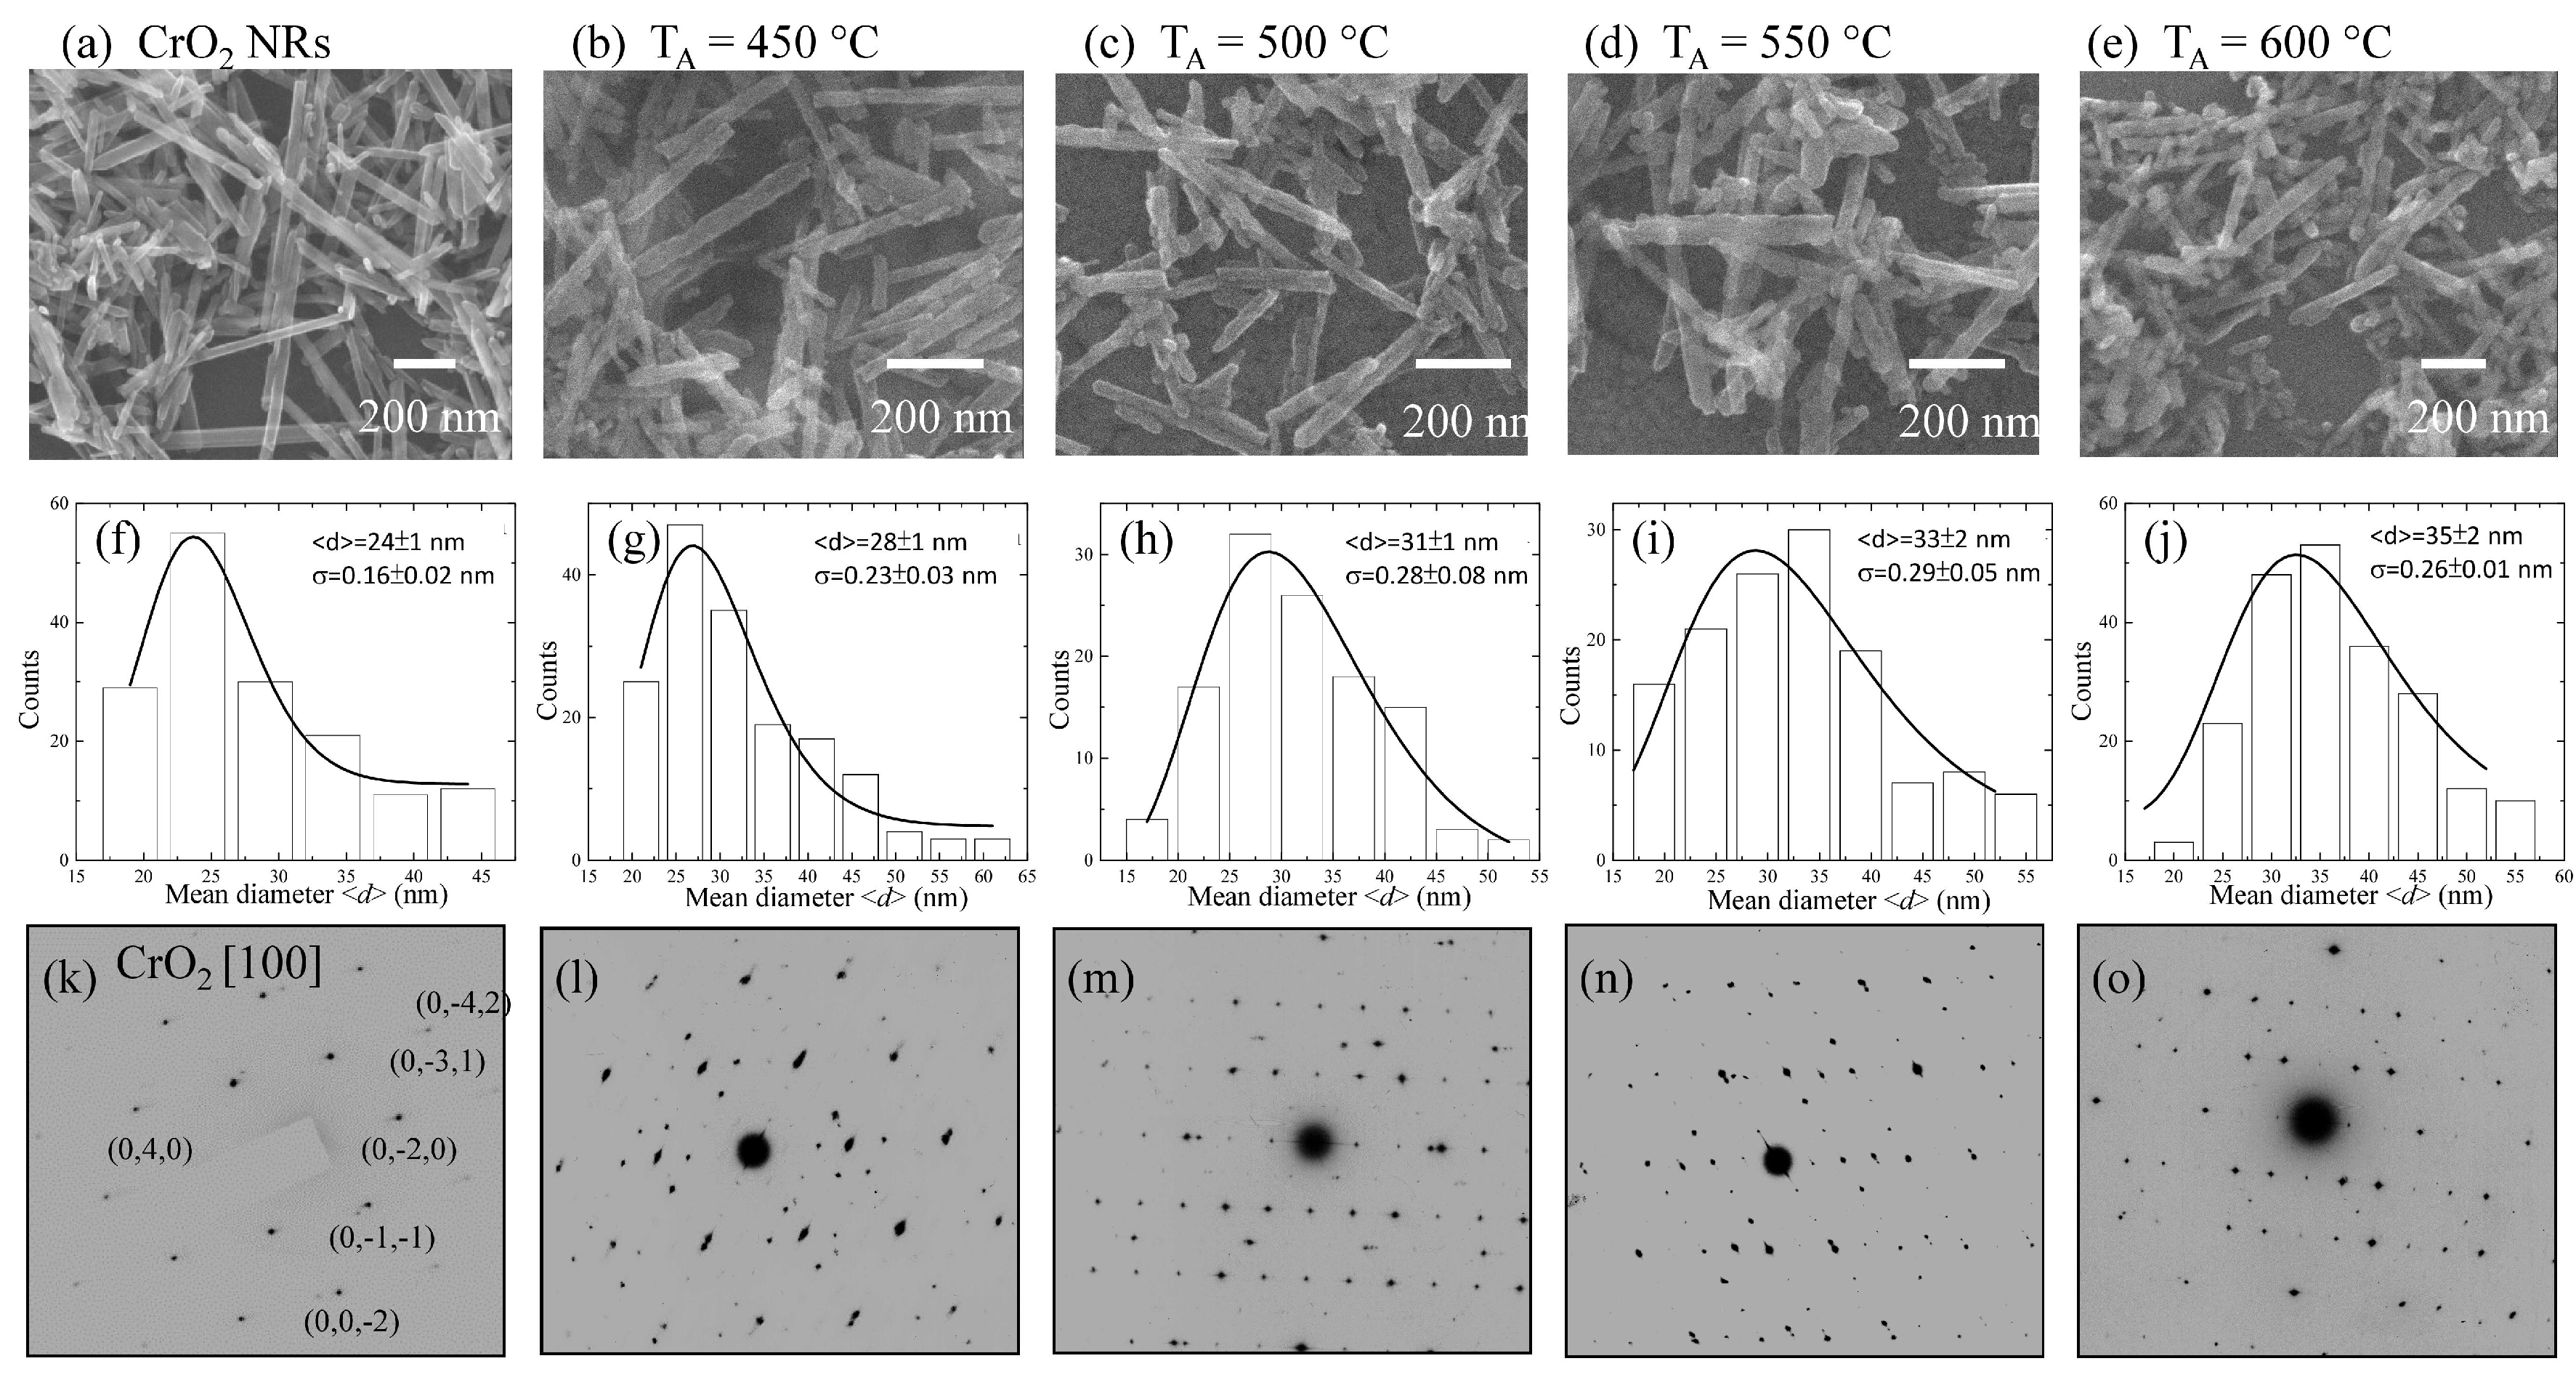
3.2. Morphological and Structural Analysis

The SEM images in Figure 2a–e show the nanorod-like morphology of pristine and 450, 500, 550, and 600 °C samples, respectively. The effect of reduction resulted in the increase of NRs diameter, but with relatively smaller length than that of pristine NRs. The mean diameter <d> of the asymmetrically distributed NRs can be obtained by fitting log-normal distribution function:
f ( d ) = 1 2 π d σ exp [ ( ln d ln < d > ) 2 2 σ 2 ]
in which σ is a standard deviation of the fitted function to the histogram of NRs diameter obtained from SEM images (Figure 2f–j). The fitted values of (<d>, σ) of CrO2 NRs and 450, 500, 550, and 600 °C samples are (24 ± 1 nm, 0.16 ± 0.02 nm), (28 ± 1 nm, 0.23 ± 0.03 nm), (31 ± 1 nm, 0.28 ± 0.08 nm), (33 ± 2 nm, 0.29 ± 0.05 nm), and (35 ± 2 nm, 0.26 ± 0.01 nm), respectively. As an effect of the increase of TA, the mean diameter of CrO2/Cr2O3 NRs increases and the diameter distribution widens. These changes could also be accompanied by an increase of reduction rate of CrO2 to Cr2O3 with the increase of TA [31]. Note that thermal reduction at 650 °C resulted in the formation of pure Cr2O3 NRs with <d> = 35 ± 1 nm [28].
For further structural characterization, the SAED pattern of pristine NRs, reduced samples, and Cr2O3 NRs [28] was examined. The SAED patterns in Figure 2k can be ascribed to the tetragonal-CrO2 oriented along the [100] zone axis. Interestingly, along with 450 °C, the SAED pattern of 500, 550, and 600 °C samples displayed the existence of mix crystalline phases, as shown in Figure 2l–o. The observed mix phases in CrO2-reduced samples were ascribed to the tetragonal-CrO2 and hexagonal-Cr2O3 phases oriented along the [100] and [−101] zone axis, respectively. However, observed mixed phase SAED pattern of 500, 550, and 600 °C samples contradict with the SRXRD spectra in which only Cr2O3 phase was noted, since SAED is a local technique and hence gives structural information only from a limited area. On the contrary, SRXRD, which is a global technique, gives average structural information. In 500 to 600 °C reduced samples, the weight percent of CrO2 is <0.33%, which is far below the SRXRD detection limit of ~1%. Similar discrepancy was also reported in our previous work on 14 nm Ni/NiO nanoparticles in which tiny amount of Ni phase (<0.7%) was detected through SAED and static/dynamic magnetic measurements but was hard to detected using SRXRD [32]. Since magnetic moment of FM-CrO2 is about 10,000 times that of AF-Cr2O3, in order to gain a detailed understanding of thermal reduction effects on CrO2 NRs, we have carried out both field- and temperature-dependent magnetization measurements.

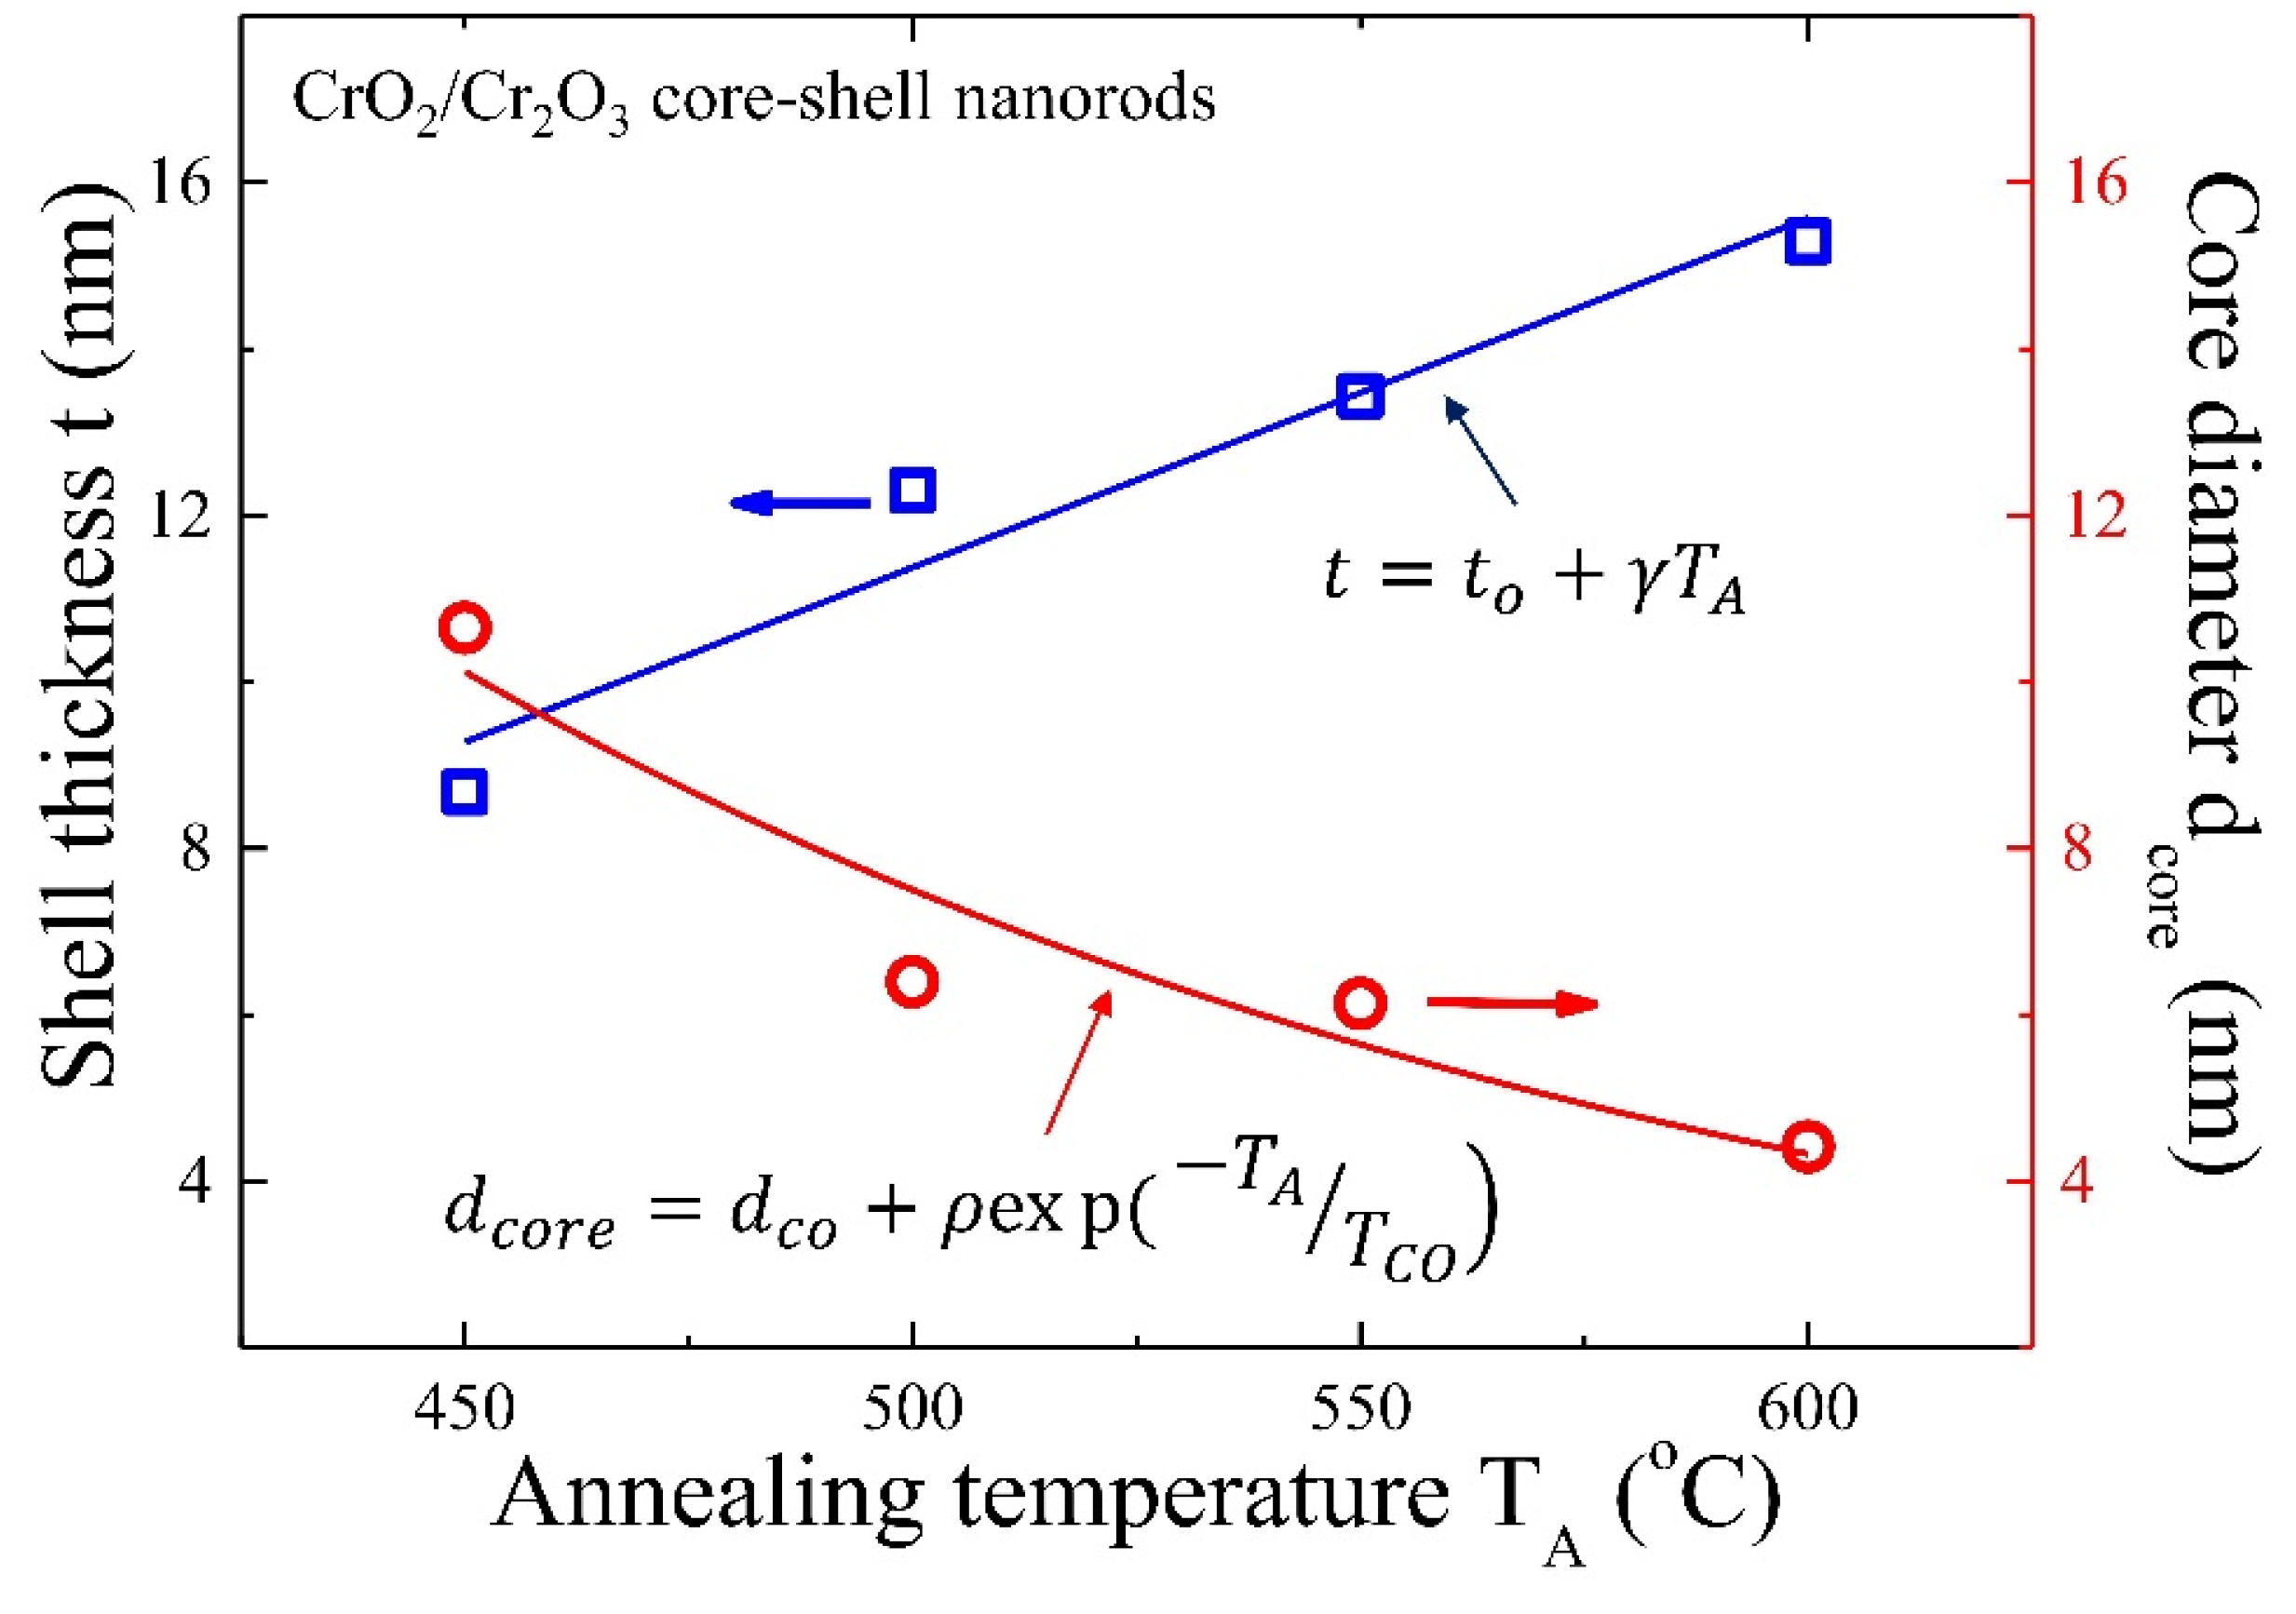
3.3. Determination of Core-Diameter and Shell-Thickness from the Saturated Magnetization

In the core-shell magnetic nanomaterials, usually, a large variety of possible magnetic behaviors can be encountered that vary with the type of material, the magnetic system (FM, ferrimagnetic, AF, superparamagnetic, etc.), inter- and intra-particle interactions, interface coupling, size, and morphologies. In such complex systems, it very difficult to distinguish the intrinsic physical properties with respect to the size that is often obtained only from few nanowires or nanoparticles using TEM or SEM images. Therefore, from the macroscopic point of view, necessity of a characteristic magnetic ‘fingerprint’ arises such that different magnetic core-shell systems can be classified and distinguished to determine the core-diameter and shell-thickness. Saturated magnetization is a good candidate for a fingerprint for the FM-AF core-shell nanosized system. In general, according to Néel, the thermal fluctuations will affect the magnetization of a single domain ferromagnetic particle, resulting in its decay towards the thermal equilibrium. However, he has neglected the contribution from magnetic anisotropy. Later, Néel-Brown introduces a thermally activated magnetization reversal model to describe a single domain magnetic particle with two equivalent ground states of opposite magnetization separated by an energy barrier, which is due to the shape and crystalline anisotropy. Within the framework, we establish a core-shell saturated magnetization (CSSM) cylinder model to describe the moment contribution in saturated magnetization at the lowest temperature. A schematic of the side view and cross view of thermally reduced core-shell nanorod is shown in Figure 3a, such that atoms of Cr2O3-shell and CrO2-core give rise to a net surface macro-moment m2 and a net inner macro-moment m1. Quantitative analysis for the CSSM was applied to the saturated magnetization M S at various annealing temperatures TA, as shown in Figure 3b. In the theoretical modeling, we assume that contribution from the magnetic moments of Cr2O3 phase to the saturation magnetization ( M S ) in CrO2/Cr2O3 core-shell NRs is very weak, such that it can be neglected, and therefore only FM-CrO2 phase contributes to the M S . We propose that the saturated magnetization at the lowest temperature, which was computed from the saturated moment divided by the mass of CrO2 content from elemental analysis, can be described as
M S M S C r O 2 = [ N C r O 2 N C r O 2 + N C r 2 O 3 ]
in which M S C r O 2 is the saturation magnetization of CrO2 NRs. N C r O 2 and N C r 2 O 3 are the average number of CrO2 and Cr2O3 atoms per gm at the core and in the shell, which can be calculated using bulk densities (δ) of CrO2 and Cr2O3 (4.89 g/cm3, 5.22 g/cm3) as
N C r O 2 = δ C r O 2 V C r O 2 N A
N C r 2 O 3 = δ C r 2 O 3 V C r 2 O 3 N A = c δ C r O 2 V C r 2 O 3 N A
in which c = δ C r 2 O 3 δ C r O 2 ; NA is Avogadro’s number. Combining Equations (1)–(3) gives
V C r O 2 V C r O 2 + c V C r 2 O 3 = M S M S C r O 2
considering that a CrO2/Cr2O3 core-shell NRs has a concentric cylinder, the total radius (r) will be given by the sum of core radius (r1) and shell thickness (t), as shown in Figure 3a. The volume of a cylinder is given by V = π r 2 l , in which l is a length of the nanorod. Considering n as any positive number, the length of a cylinder can be expressed as l = n r . The volume of core and shell can be written separately as V C r O 2 = π r 1 2 ( n r 2 t ) and V C r 2 O 3 = π n r 3 V C r O 2 = π n r 3 π r 1 2 ( n r 2 t ) , respectively, and, combined with Equation (4), we can obtain a relation between the thickness and saturated magnetization as
t = r [ 1 1 ( n r 2 t ) n r [ ( M S C r O 2 c M S 1 c ) + 1 ] ]
The nanorod length is much larger than the shell thickness; we can take ( n r 2 t ) n r , which resulted in the simplified CSSM model as
t = r [ 1 1 ( M S C r O 2 c M S 1 c ) + 1 ]
Above expression gives the useful relation between the Cr2O3 shell thickness t and the total radius r = d c o r e 2 + t of CrO2/Cr2O3 core-shell NRs. The above simplified CSSM model was used to calculate Cr2O3 shell thickness and CrO2 core diameter as tabulated in Supporting Table S2. As shown in Figure 4, the core diameter d c o r e decreases with the increase of annealing temperature TA, which can be described very well by fitting an exponential decay function d c o r e = d c o + ρ exp ( T A T C O ) , in which d c o = 1.13 ± 0.03 nm, ρ = 200 nm, and T C O = 145 ± 12 °C represent the initial constants and the fitted parameters, respectively. The observed linear increasing behavior of Cr2O3 shell thickness can be described using growth function t = t o + γ T A , in which t o = −9.6 ± 3.8 nm and γ = 0.042 ± 0.007 nm/°C. The above finding indicates that the surface reduction of CrO2 to Cr2O3 begins around TA ~229 °C, and a self-terminated layer of ~17.5 nm was obtained at TA ~650 °C [28]. It is noteworthy that the shell thickness can also be estimated from TEM results, but with less accuracy, because CrO2 NRs on TEM substrate film are more susceptible to oxidation than samples for magnetometer measurement that were stored in a capsule.

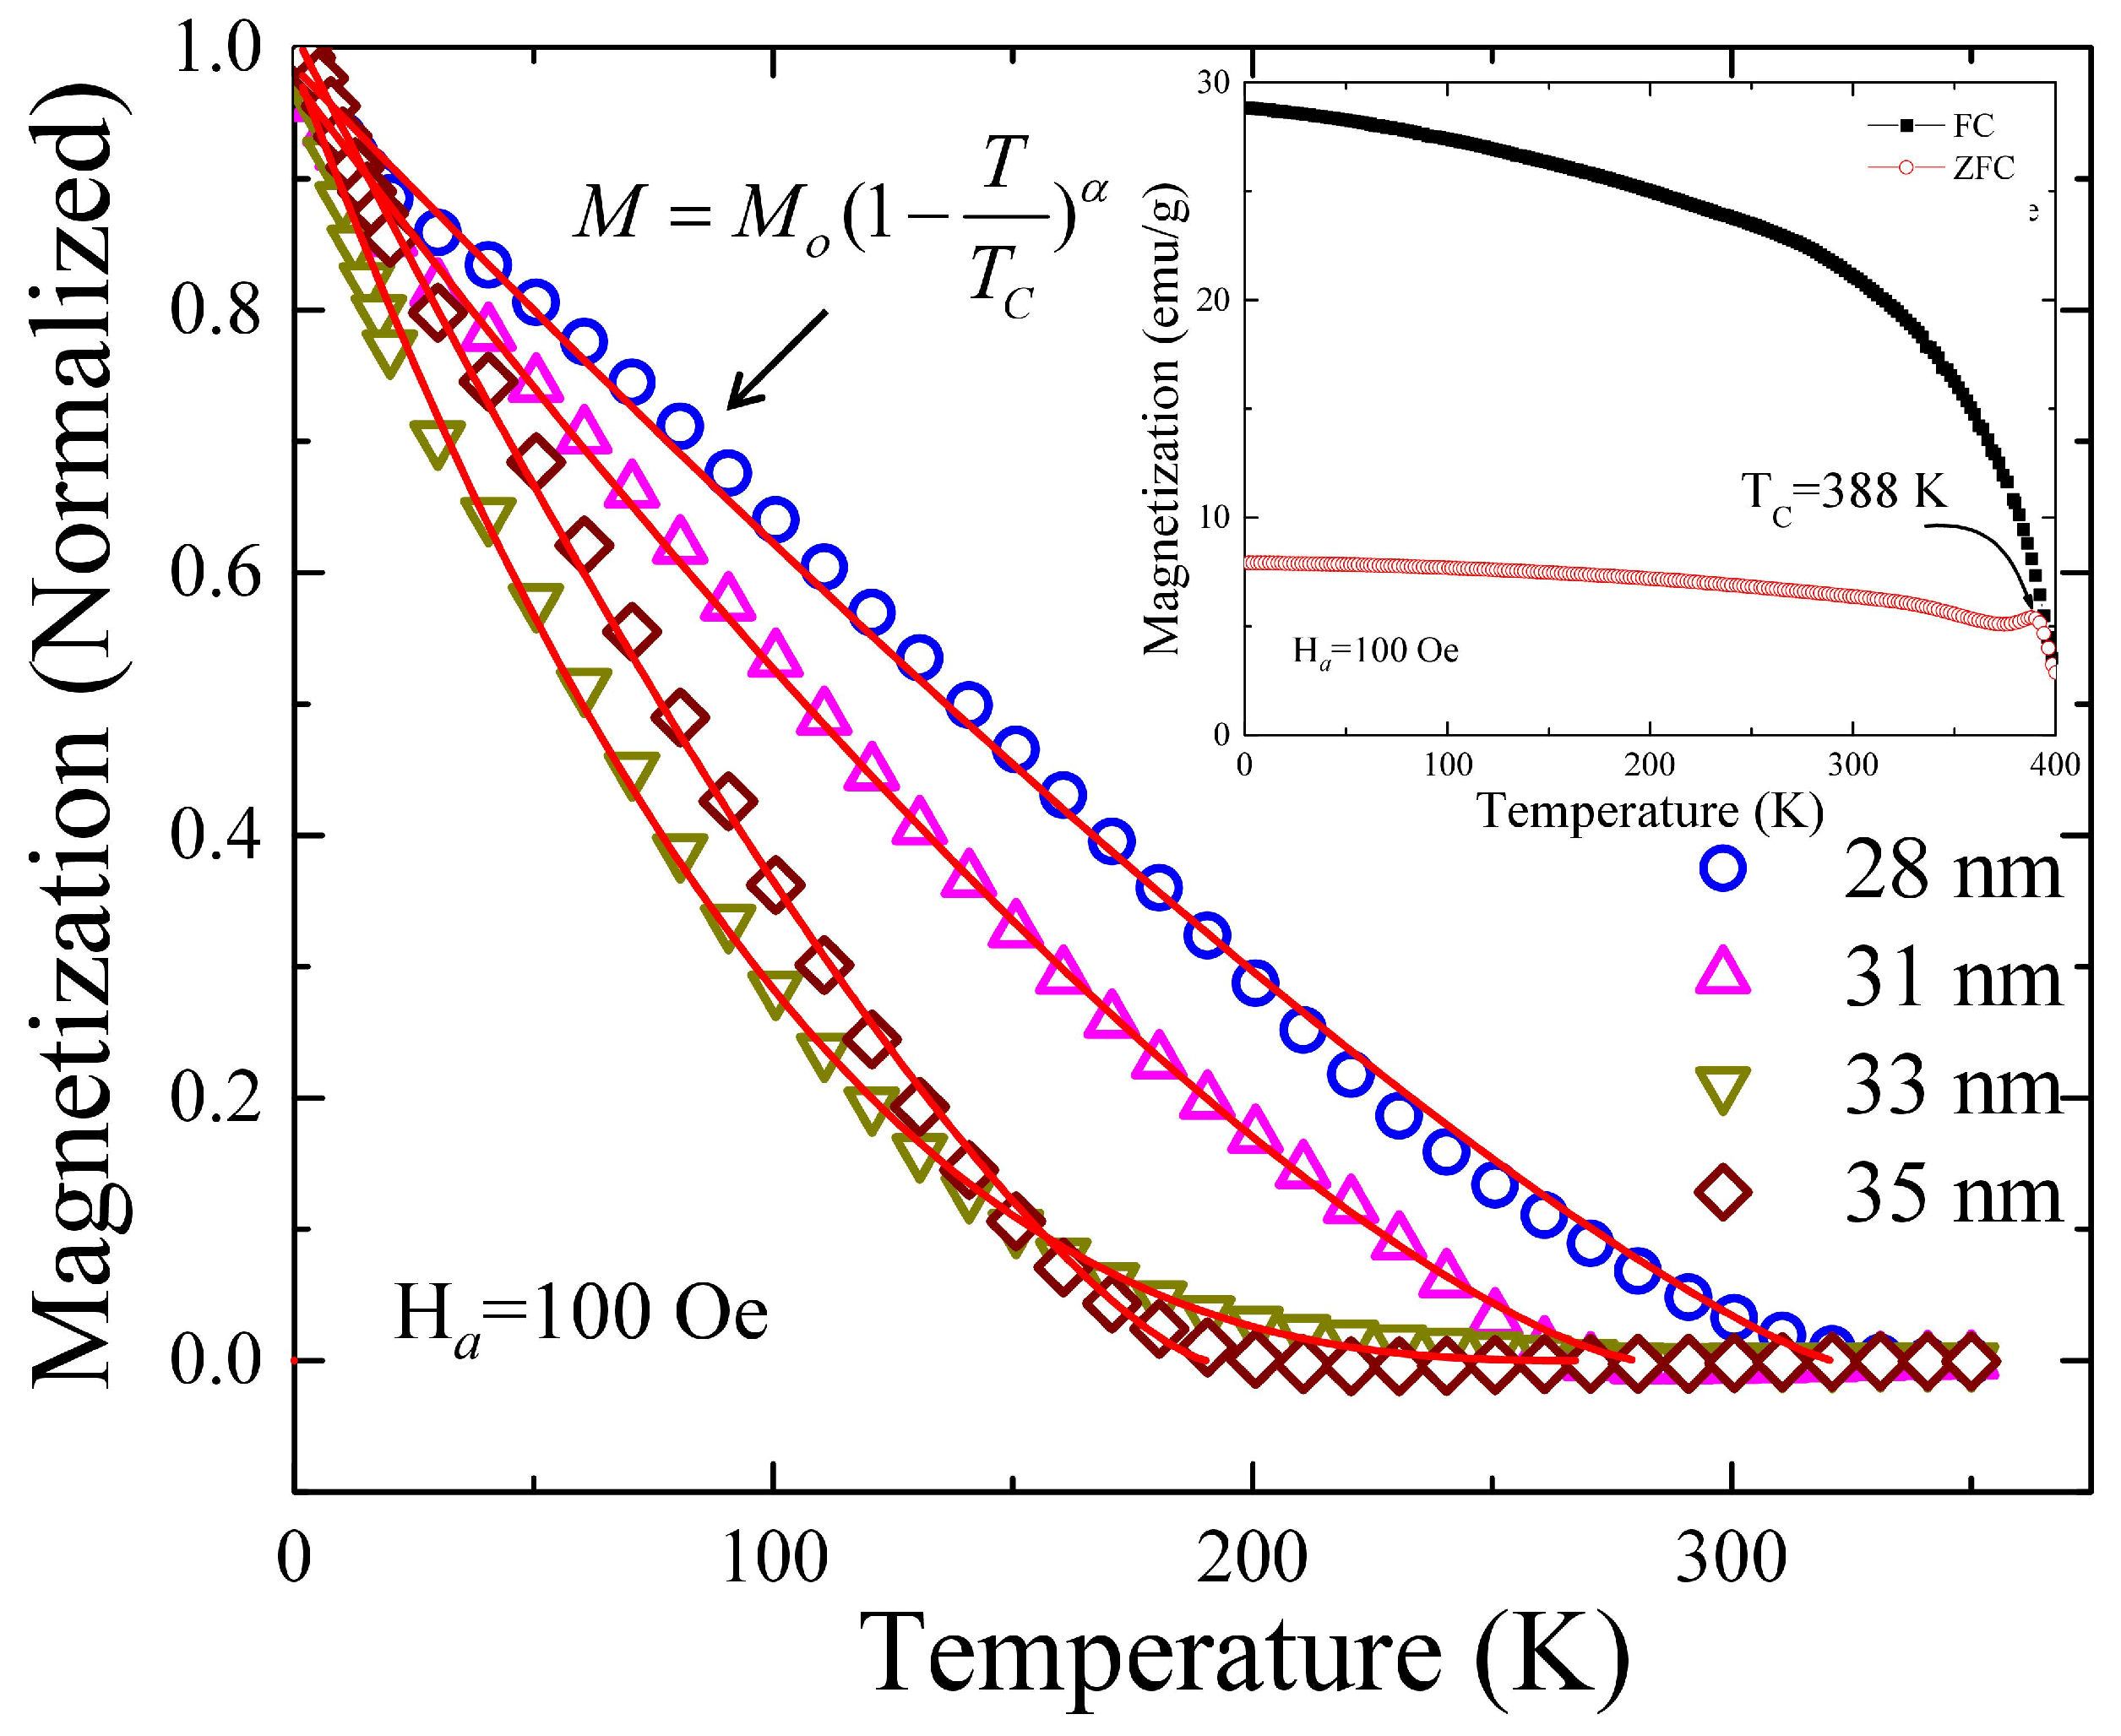
3.4. Temperature Dependence of Thermoremanent Magnetization (TRM)

In general, in a superparamagnetic (SPM) nanoscaled system, thermoremanence is related to the distribution of energy barriers. At a given measuring temperature and after removing the applied field, only the particles that are in the blocked regime will contribute to the remanent magnetization. To estimate the effect of thermal treatment on TC of CrO2 phase, TRM decay measurements of 450 to 600 °C samples were undertaken. Initially, sample was cooled down from 350 to 1.8 K under an applied magnetic field of Ha = 100 Oe. Once temperature stabilized, the magnetic field was switched off using oscillating mode, and subsequently magnetization decay with respect to temperature T was recorded while warming the sample in a zero field. Figure 5 shows the normalized plot of TRM curve, indicating the presence of irreversible contributions in the low-temperature region. A monotonically decreasing behavior reflecting the expected thermally induced decay of magnetization was observed and vanished above a characteristic temperature. The value of TC from CrO2/Cr2O3 core-shell NRs was obtained by fitting TRM curve using M ( T ) = M o ( 1 T T C ) α , in which α is a power law factor. The solid line in Figure 5 represents the fitted curve using above expression, and fitting parameters are tabulated in Supporting Table S2. The fitted value of TC matches with ferromagnetic ordering temperature, which marks the ordering temperature of the FM cores, i.e., 321 ± 5, 281 ± 5, 271 ± 15, and 191 ± 14 K for <d> = 28, 31, 33, and 35 nm NRs, respectively. The amount of reduction of CrO2 to Cr2O3 increases with the increase of TA up to 600 °C, above which a pure Cr2O3 phase was obtained. Therefore, observed decreases of TC with an increase se of TA could be resulted from the finite size effect, which will be discussed further in the text. The value of TC ~388 K of pristine CrO2 NRs is defined from a point at which ZFC-FC curve overlaps and above which it retains superparamagnetic behavior such as magnetization decay with the increase of T as shown in the inset of Figure 5. Note that obtained value of TC from pristine CrO2 NRs is very close to the report value of 394 K.

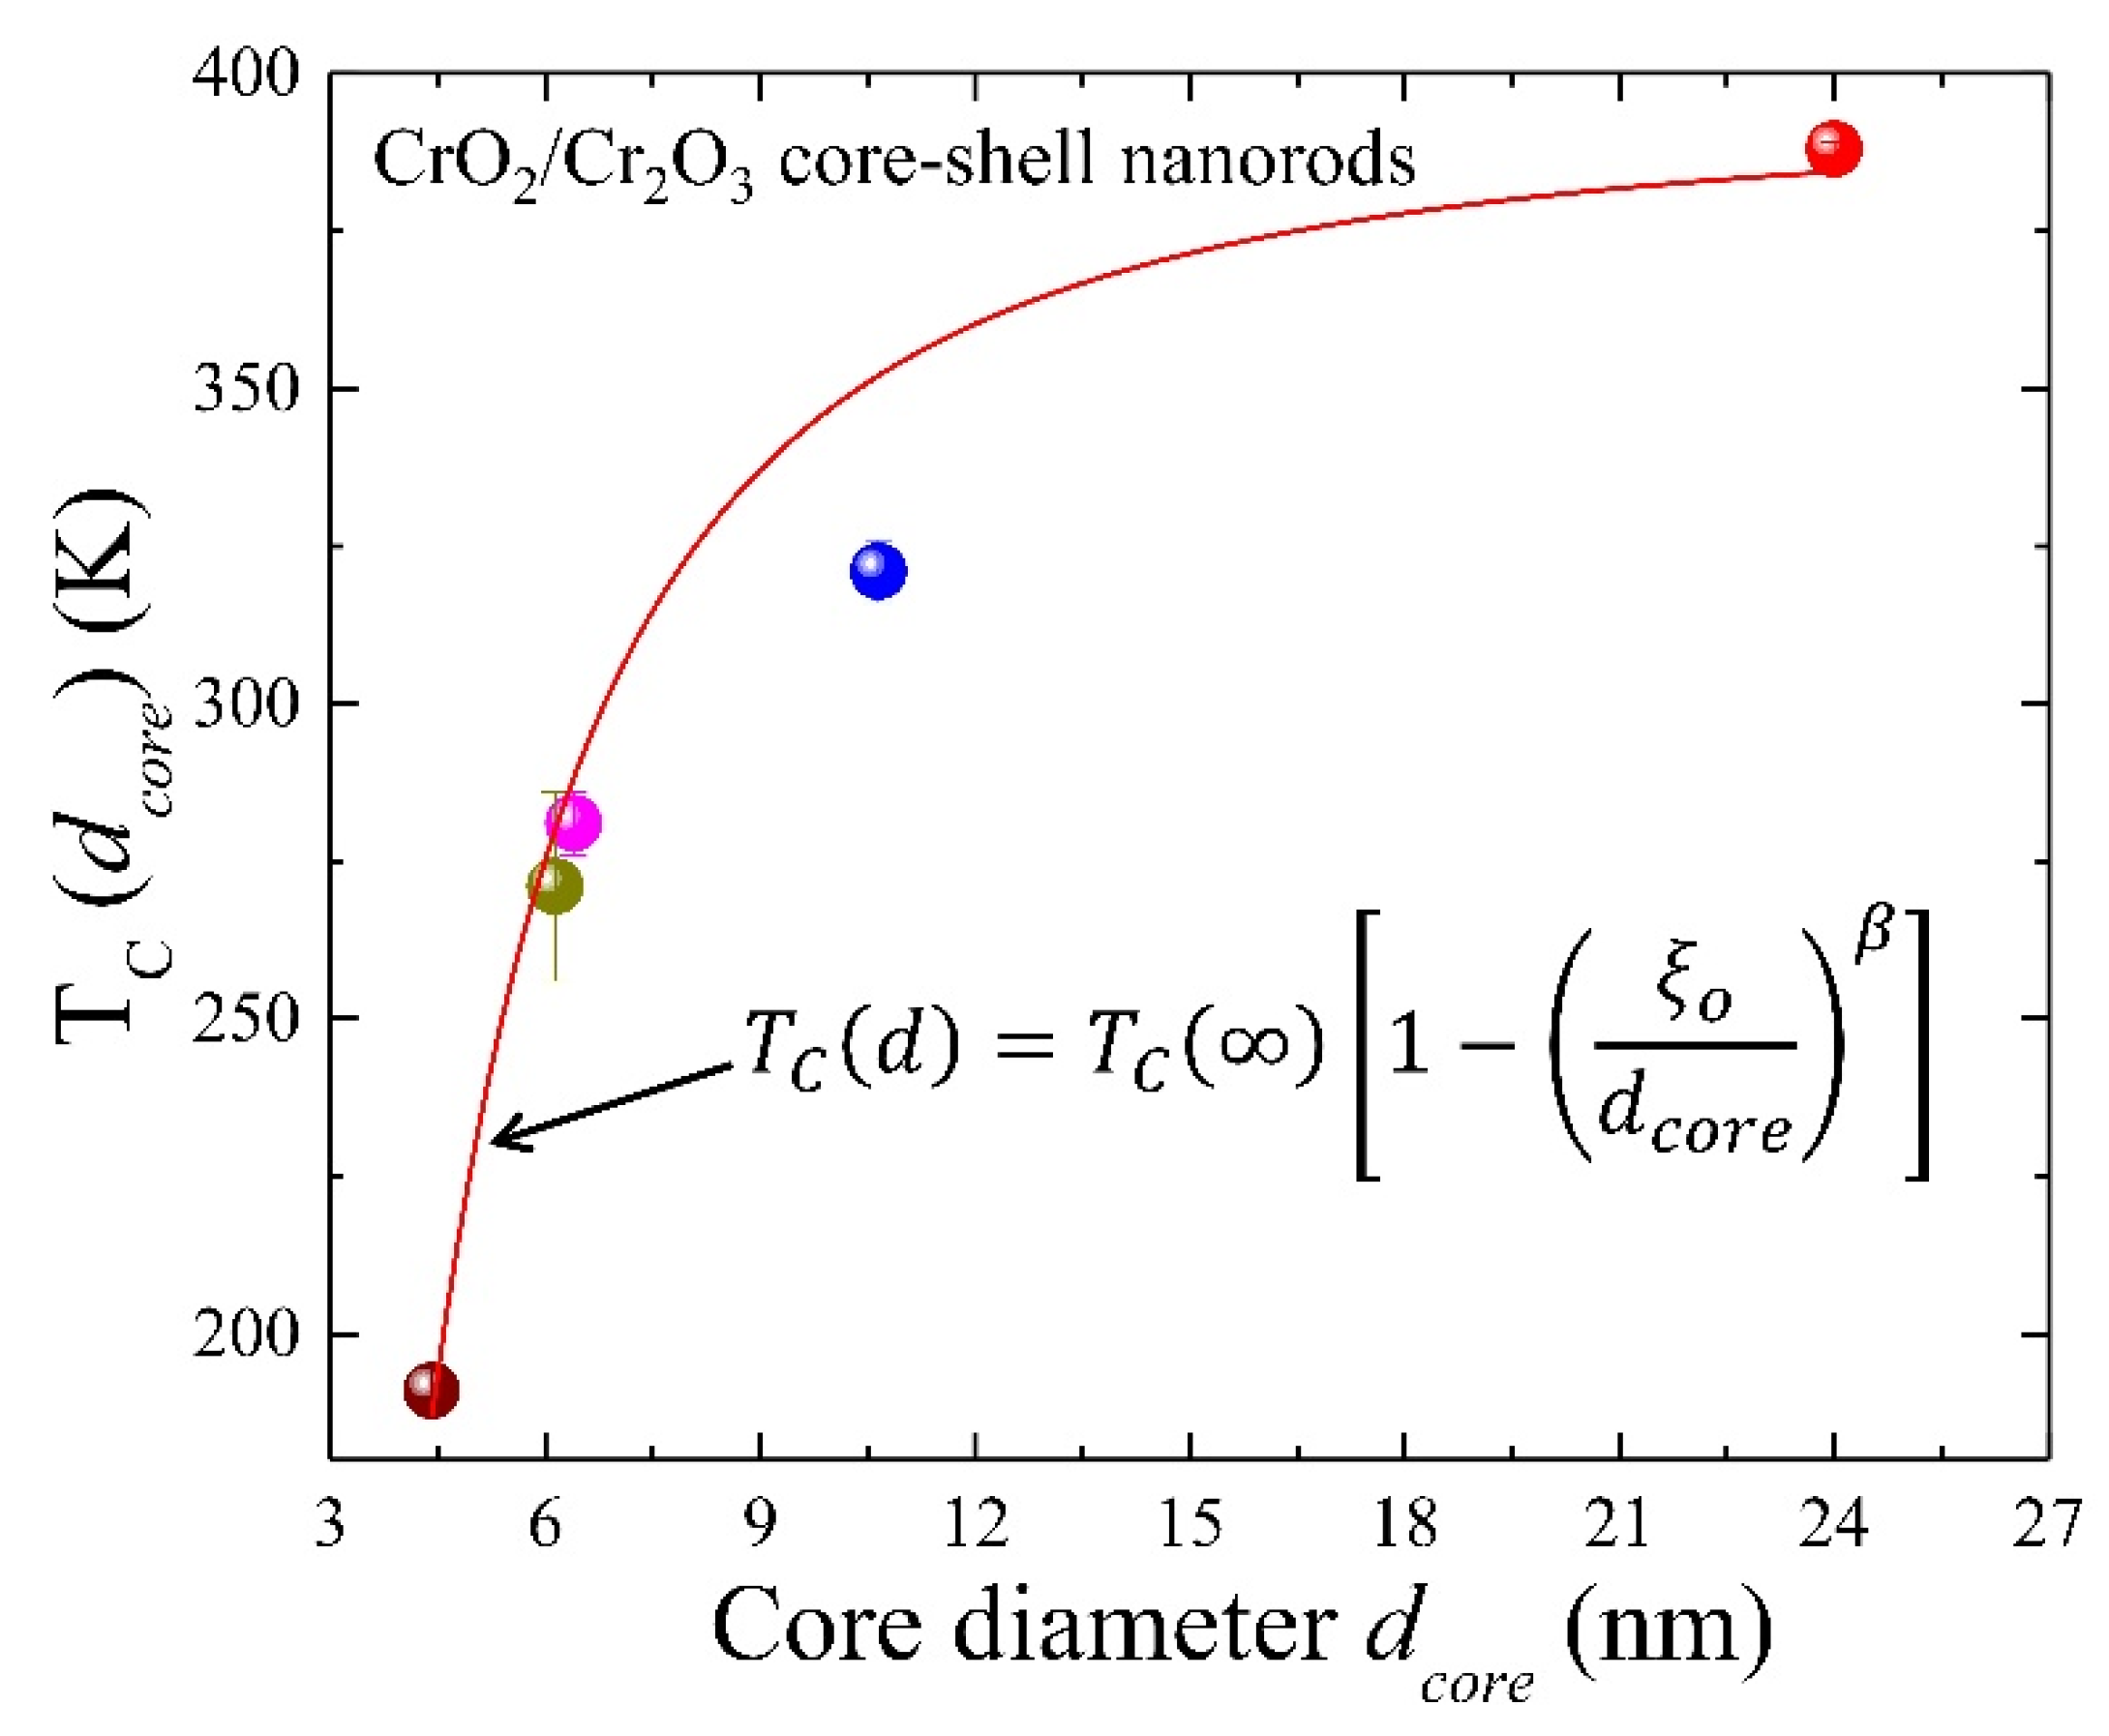
3.5. Finite Size Scaling Method

The values of TC decrease from 388 to 191 K with the decrease of CrO2 diameter d c o r e from 24 to 4.42 nm as shown in Figure 6, signaling a strong size effect. In a nanoscaled FM-core system, the finite size scaling method can be used to extract the values for the critical exponents by observing how measured quantities vary as the size d of the system studied changes. However, the technique we used for those calculations required us to perform simulations exactly at the critical temperature of the model, which in turn requires us to know TC. The diameter dependence of TC can be explained using finite size scaling formula [33] T C ( d ) = T C ( ) [ 1 ( ξ o d c o r e ) β ] , in which T C ( ) = 394 K for bulk CrO2, ξ o is the characteristic microscope dimension of the system at zero temperature, and the exponent is related to the correlation length by β = 1/λ. Fitting TC vs. d c o r e of core-shell NRs yields ξ o = 3.1 ± 0.2 nm, which is roughly ~0.70 and ~1.06 times the lattice constant a = b and c. The value of the characteristic microscopic length scale indicates that growth of CrO2 NRs is along the c-axis. The obtained value λ = 0.56 (β = 1.8 ± 0.2) is close to the value predicted using isotropic 3D Heisenberg model (0.65 ≤ λ ≤ 0.733) [34]. Above finding shows that the finite size scaling formula can efficiently describe the shift in TC, giving validation of used magnetic property-based theoretical expression for the estimation of core and shell parameters.

4. Conclusions

The series of CrO2/Cr2O3 core-shell NRs with mean diameters varying from 28 to 35 nm were synthesized simply by thermal reduction technique. A new approach by means of DC magnetometer and a core-shell saturated magnetization (CSSM) cylinder model has been proposed for the estimation of core-CrO2 diameter and shell-Cr2O3 thickness, which is otherwise impossible to calculate using any conventional means. We observed that with the increase of reduction temperature from 450 to 600 °C, core-CrO2 diameter reduced from ~11 to 4 nm and shell-Cr2O3 thickness increased from ~9 to 15 nm, respectively. Finite size effect of FM-CrO2 leads to reduced Curie temperature TC of NRs, which can be explained further using the finite size scaling model, giving a short-range magnetic correlation length of = ξ o 3.1 ± 0.2 nm. This work is believed to be of importance, especially for researchers working on the magnetic core-shell nanostructures and their application in functional devices.

Supplementary Materials

The following are available online at https://www.mdpi.com/2079-4991/8/5/312/s1.

Author Contributions

S.Y.W. and A.C.G. wrote, conceived, and designed the experiments. A.C.G., T.-Y.L., and T.S.C. analyzed the data. T.S.C. contributed the experimental facilities for the X-ray measurements. All authors discussed the results, contributed to the text in the manuscript, commented on the manuscript, and approved the final version.

Acknowledgments

We would like to thank the Ministry of Science and Technology (MOST) of the Republic of China for their financial support of this research through project numbers MOST-106-2112-M-259-001 and 106-2731-M-259-001.

Conflicts of Interest

The authors declare no conflict of interest.

References

  1. Velasquez, E.A.; Lopez-Moreno, S.; Mazo-Zuluaga, J.; Mejia-Lopez, J. Fe/Ni core-shell nanowires and nanorods: A combined first-principles and atomistic simulation study. Phys. Chem. Chem. Phys. 2017, 19, 16267–16275. [Google Scholar] [CrossRef] [PubMed]
  2. Gandhi, K.; Chaudhary, R.P.; Mohapatra, J.; Koymen, A.R.; Liu, J.P. Giant exchange bias and its angular dependence in Co/CoO core-shell nanowire assemblies. Phys. Lett. A 2017, 381, 2092–2096. [Google Scholar] [CrossRef]
  3. Salazar-Alvarez, G.; Geshev, J.; Agramunt-Puig, S.; Navau, C.; Sanchez, A.; Sort, J.; Nogués, J. Tunable High-Field Magnetization in Strongly Exchange-Coupled Freestanding Co/CoO Core-Shell Coaxial Nanowires. ACS Appl. Mater. Interface 2016, 8, 22477–22483. [Google Scholar] [CrossRef] [PubMed]
  4. Liébana-Viñas, S.; Wiedwald, U.; Elsukova, A.; Perl, J.; Zingsem, B.; Semisalova, A.S.; Salgueiriño, V.; Spasova, M.; Farle, M. Structure-Correlated Exchange Anisotropy in Oxidized Co80Ni20 Nanorods. Chem. Mater. 2015, 27, 4015–4022. [Google Scholar] [CrossRef]
  5. Javed, K.; Li, W.J.; Ali, S.S.; Shi, D.W.; Khan, U.; Riaz, S.; Han, X.F. Enhanced exchange bias and improved ferromagnetic properties in Permalloy-BiFe0.95Co0.05O3 core-shell nanostructures. Sci. Rep. 2015, 5, 18203. [Google Scholar] [CrossRef] [PubMed]
  6. Singh, G.P.; Ram, S. Optical and electron paramagnetic resonance properties of native Cr2O3 surface over CrO2. J. Magn. Magn. Mater. 2010, 322, 1484–1487. [Google Scholar] [CrossRef]
  7. Zhao, Q.; Wen, G.; Liu, Z.; Yuan, J.; Li, D.; Zou, G.; Zheng, R.; Ringer, S.P.; Mao, H.-K. High-density, vertically aligned crystalline CrO2 nanorod arrays derived from chemical vapor deposition assisted by AAO templates. Chem. Commun. 2009, 14, 3949–3951. [Google Scholar] [CrossRef] [PubMed]
  8. Dho, J.; Ki, S.; Gubkin, A.F.; Park, J.M.S.; Sherstobitova, E.A. A neutron diffraction study of half-metallic ferromagnet nanorods. Solid State Commun. 2010, 150, 86–90. [Google Scholar] [CrossRef]
  9. Schwarz, K. CrO2 predicted as a half-metallic ferromagnet. J. Phys. F Met. Phys. 1986, 16, L211. [Google Scholar] [CrossRef]
  10. Coey, R.; Skomski, J.M.D. Permanent Magnetism; Taylor & Francis: New York, NY, USA, 1999. [Google Scholar]
  11. Skomski, R. Simple Models of Magnetism; Oxford University Press: Oxford, UK, 2008. [Google Scholar]
  12. Solovyev, I.V.; Kashin, I.V.; Mazurenko, V.V. Mechanisms and origins of half-metallic ferromagnetism in CrO2. Phys. Rev. B 2015, 92, 144407. [Google Scholar] [CrossRef]
  13. Coey, J.M.D.; Berkowitz, A.E.; Balcells, L.; Putris, F.F.; Barry, A. Magnetoresistance of Chromium Dioxide Powder Compacts. Phys. Rev. Lett. 1998, 80, 3815–3818. [Google Scholar] [CrossRef]
  14. Dai, J.; Tang, J. Junction-like magnetoresistance of intergranular tunneling in field-aligned chromium dioxide powders. Phys. Rev. B 2001, 63, 054434. [Google Scholar] [CrossRef]
  15. Shim, J.H.; Lee, S.; Dho, J.; Kim, D.-H. Coexistence of Two Different Cr Ions by Self-Doping in Half-Metallic CrO2 Nanorods. Phys. Rev. Lett. 2007, 99, 057209. [Google Scholar] [CrossRef] [PubMed]
  16. Hwang, H.Y.; Cheong, S.W. Enhanced Intergrain Tunneling Magnetoresistance in Half-Metallic CrO2 Films. Science 1997, 278, 1607–1609. [Google Scholar] [CrossRef] [PubMed]
  17. Biswas, S.; Singh, G.P.; Ram, S.; Fecht, H.J. Surface stabilized GMR nanorods of silver coated CrO2 synthesized via a polymer complex at ambient pressure. J. Magn. Magn. Mater. 2013, 339, 175–181. [Google Scholar] [CrossRef]
  18. Anwar, M.S.; Aarts, J. Anomalous transport in half-metallic ferromagnetic CrO2. Phys. Rev. B 2013, 88, 085123. [Google Scholar] [CrossRef]
  19. Corliss, L.M.; Hastings, J.M.; Nathans, R.; Shirane, G. Magnetic Structure of Cr2O3. J. Appl. Phys. 1965, 36, 1099–1100. [Google Scholar] [CrossRef]
  20. Brown, P.J.; Forsyth, J.B.; Lelièvre-Berna, E.; Tasset, F. Determination of the magnetization distribution in Cr2O3 using spherical neutron polarimetry. J. Phys. Condens. Matter 2002, 14, 1957. [Google Scholar] [CrossRef]
  21. Makhlouf, S.A.; Bakr, Z.H.; Al-Attar, H.; Moustafa, M.S. Structural, morphological and electrical properties of Cr2O3 nanoparticles. Mater. Sci. Eng. B 2013, 178, 337–343. [Google Scholar] [CrossRef]
  22. Sahoo, S.; Binek, C. Piezomagnetism in epitaxial Cr2O3 thin films and spintronic applications. Philos. Mag. Lett. 2007, 87, 259–268. [Google Scholar] [CrossRef]
  23. McGuire, T.R.; Scott, E.J.; Grannis, F.H. Antiferromagnetism in a Cr2O3 Crystal. Phys. Rev. 1956, 102, 1000–1003. [Google Scholar] [CrossRef]
  24. Das, P.; Bajpai, A.; Ohno, Y.; Ohno, H.; Müller, J. On the influence of nanometer-thin antiferromagnetic surface layer on ferromagnetic CrO2. J. Appl. Phys. 2012, 112, 053921. [Google Scholar] [CrossRef]
  25. Wang, Z.; Xi, L.; Yang, Y.; Li, Y.; Han, X.; Zuo, Y.; Wang, J. Spin-dependent Transport Properties of CrO2 Micro Rod. Nano-Micro Lett. 2014, 6, 365–371. [Google Scholar] [CrossRef]
  26. Bajpai, A.; Borisov, P.; Gorantla, S.; Klingeler, R.; Thomas, J.; Gemming, T.; Kleemann, W.; Büchner, B. Interface-driven magnetoelectric effects in granular CrO2. Eur. Phys. Lett. 2010, 91, 17006. [Google Scholar] [CrossRef]
  27. Bajpai, A.; Klingeler, R.; Wizent, N.; Nigam, A.K.; Cheong, S.W.; Büchner, B. Unusual field dependence of remanent magnetization in granular CrO2: The possible relevance of piezomagnetism. J. Phys. Condens. Matter 2010, 22, 096005. [Google Scholar] [CrossRef] [PubMed]
  28. Gandhi, A.C.; Wu, S.Y. Unidirectional anisotropy mediated giant memory effect in antiferromagnetic Cr2O3 nanorods. RSC Adv. 2017, 7, 25512–25518. [Google Scholar] [CrossRef]
  29. Rietveld, H. A profile refinement method for nuclear and magnetic structures. J. Appl. Crystallogr. 1969, 2, 65–71. [Google Scholar] [CrossRef]
  30. Von Dreele, R.B.; Larson, A.C. General Structure Analysis System (GSAS); Los Alamos National Laboratory Report LAUR 86-748; Los Alamos National Laboratory: Los Alamos, NM, USA, 2000; p. 221. [Google Scholar]
  31. Xu, X.N.; Wolfus, Y.; Shaulov, A.; Yeshurun, Y.; Felner, I.; Nowik, I.; Koltypin, Y.; Gedanken, A. Annealing study of Fe2O3 nanoparticles: Magnetic size effects and phase transformations. J. Appl. Phys. 2002, 91, 4611–4616. [Google Scholar] [CrossRef]
  32. Gandhi, A.C.; Cheng, H.-Y.; Chang, Y.-M.; Lin, J.G. Size confined magnetic phase in NiO nanoparticles. Mater. Res. Express 2016, 3, 035017. [Google Scholar] [CrossRef]
  33. Tang, Z.X.; Sorensen, C.M.; Klabunde, K.J.; Hadjipanayis, G.C. Size-dependent Curie temperature in nanoscale MnFe2O4 particles. Phys. Rev. Lett. 1991, 67, 3602–3605. [Google Scholar] [CrossRef] [PubMed]
  34. Kaul, S.N. Static critical phenomena in ferromagnets with quenched disorder. J. Magn. Magn. Mater. 1985, 53, 5–53. [Google Scholar] [CrossRef]
Figure 1. Synchrotron radiation XRD spectra of pristine CrO2 and 450 °C to 600 °C NRs (bottom to top), in which solid curve represents the Rietveld fit to the SRXRD spectrum.
Nanomaterials 08 00312 g001
Figure 2. (ae) SEM images; (fj) histogram of diameter distribution and (ko) SAED patterns of the CrO2/Cr2O3 core-shell NRs. The line in (fj) represents fit to the histogram using log-normal distribution function.
Nanomaterials 08 00312 g002
Figure 3. (a) A schematic illustration of side- and cross-view of CrO2/Cr2O3 core-shell nanorod; (b) magnetization versus applied magnetic field of CrO2 and 450 to 600 °C NRs measured at 2 K from 0 to 15 kOe.
Nanomaterials 08 00312 g003
Figure 4. A plot of the TA dependence of the obtained shell thickness t and the core diameter d c o r e . The solid curves represent linear and exponential fits to the experimental data.
Nanomaterials 08 00312 g004
Figure 5. Temperature dependency of thermoremanent magnetization of 450 to 600 °C NRs. The solid curve represents a fit using a model given in the text. Inset of the figure shows the ZFC-FC curve of pristine CrO2 NRs.
Nanomaterials 08 00312 g005
Figure 6. A plot of core diameter d c o r e dependence of the TC, in which solid curve represents a fit using finite size scaling model discussed in the text.
Nanomaterials 08 00312 g006

