Quantum-Mechanical Study of Nanocomposites with Low and Ultra-Low Interface Energies


1
Institute of Physics of Materials, Academy of Sciences of the Czech Republic, Žižkova 22, CZ-616 62 Brno, Czech Republic
2
Department of Materials Science, Montanuniversität Leoben, Franz-Josef-Strasse 18, A-8700 Leoben, Austria
3
Department of Chemistry, Faculty of Science, Masaryk University, Kotlářská 2, CZ-611 37 Brno, Czech Republic
4
Central European Institute of Technology, CEITEC MU, Masaryk University, Kamenice 5, CZ-625 00 Brno, Czech Republic
*
Author to whom correspondence should be addressed.
Nanomaterials 2018, 8(12), 1057; https://doi.org/10.3390/nano8121057
Submission received: 27 November 2018
/
Revised: 8 December 2018
/
Accepted: 12 December 2018
/
Published: 15 December 2018
(This article belongs to the Special Issue Modeling of Complex Interfaces: From Surface Chemistry to Nano Chemistry)
Abstract
:We applied first-principles electronic structure calculations to study structural, thermodynamic and elastic properties of nanocomposites exhibiting nearly perfect match of constituting phases. In particular, two combinations of transition-metal disilicides and one pair of magnetic phases containing the Fe and Al atoms with different atomic ordering were considered. Regarding the disilicides, nanocomposites MoSi/WSi with constituents crystallizing in the tetragonal C11 structure and TaSi/NbSi with individual phases crystallizing in the hexagonal C40 structure were simulated. Constituents within each pair of materials exhibit very similar structural and elastic properties and for their nanocomposites we obtained ultra-low (nearly zero) interface energy (within the error bar of our calculations, i.e., about 0.005 J/m). The interface energy was found to be nearly independent on the width of individual constituents within the nanocomposites and/or crystallographic orientation of the interfaces. As far as the nanocomposites containing Fe and Al were concerned, we simulated coherent superlattices formed by an ordered FeAl intermetallic compound and a disordered Fe-Al phase with 18.75 at.% Al, the -phase. Both phases were structurally and elastically quite similar but the disordered -phase lacked a long-range periodicity. To determine the interface energy in these nanocomposites, we simulated seven different distributions of atoms in the -phase interfacing the FeAl intermetallic compound. The resulting interface energies ranged from ultra low to low values, i.e., from 0.005 to 0.139 J/m. The impact of atomic distribution on the elastic properties was found insignificant but local magnetic moments of the iron atoms depend sensitively on the type and distribution of surrounding atoms.
1. Introduction
Ever increasing demand for energy-conversion units exhibiting a higher efficiency leads to increasing operating temperatures in these systems and, therefore, new materials, which would sustain such conditions, are needed. Because the development of these materials is highly complex and multi-faceted, combinations of often mutually-conflicting properties are rarely found in a single-phase structures. Composites then represent a critically important class of materials. In particular, coherent nanocomposites require optimum matching of constituting phases for their stability and rather low interface energies. In our study, we addressed three nanocomposites combining materials intended for high or elevated temperature applications: two pairs of transition-metal disilicides that are predicted to possess ultra-low interface energies and then a pair of two different phases from the Fe-Al system, which are expected to have the interface energies ranging from ultra low to low values.
Regarding the transition-metal silicides, they are currently considered as very promising bases for future high-temperature structural materials (see, e.g., Refs. [1,2,3,4]), in particular for operational temperatures above those of Ni-based superalloys. At high temperatures, transition-metal silicides are known to combine the ductility and thermal conductivity of metals with high strength and corrosion resistance of ceramics. As far as composites combining them are concerned, MoSi/WSi composite powders with different phase compositions are fabricated via a self-propagating high-temperature synthesis (SHS) method [5]. This approach is widely recognized as an effective manufacturing strategy for the fabrication of materials applied in high-temperature fields, in particular for refractories such as transition-metal carbides, nitrides, silicides, and borides [6]. Preparation of MoSi/WSi composites using elemental powders of Mo, W and Si by the thermal explosion mode of SHS have been theoretically calculated and investigated by experiments in Ref. [7]. Phase composition and microchemical area analyses were conducted by XRD, SEM and EDAX methods. Pure MoSi/WSi composites are fabricated by the thermal explosion mode of SHS, and MoSi/WSi exists as a solid solution of (Mo,W)Si but the chemical elements inside of individual grains are not uniformly distributed. As an alternative processing route, five kinds of WSi/MoSi composites are fabricated by mechanical alloying in [8]. WSi-reinforced MoSi composites are successfully prepared also by mechanical activation followed by in situ reactive spark plasma sintering of Mo, Si, and W elemental powders in [9]. The addition of W to the reactants leads to a finer microstructure than that obtained using pure MoSi, resulting in a significant improvement of mechanical properties. The Vicker’s hardness of 20 vol % WSi/MoSi is as high as 16.47 GPa. Nanocomposite of (Mo,W)Si/WSi was synthesized via mechanical alloying (MA) and heat treatment in Ref. [10]. Increasing the milling time to 80 h followed by the post-annealing at 1000 C caused the complete formation of (Mo,W)Si/WSi nanocomposite. MoSi/WSi composites were successfully prepared by pressureless sintering from mechanically-assisted combustion synthesized powders in [11].
Motivated by the above-mentioned studies of MoSi/WSi (nano)composites containing structurally and elastically very similar pair of materials crystallizing in the C11 structure, we also assessed another pair of matching materials, TaSi and NbSi, which are crystallizing in the C40 structure.
Finally, as a system with rather low interface energy, we studied nanocomposites formed by two phases from the Fe-Al binary system [12,13,14,15]. These materials are also considered as promising for elevated-temperature applications and as such they are intensively studied [16,17,18,19,20,21,22,23,24,25,26,27,28,29,30,31,32,33,34,35,36,37,38,39,40]. A sub-class of Fe-Al-based materials is represented by composites consisting of an ordered FeAl with the D0 structure and a disordered Fe-Al solid solution with about 18-19 at.% Al. The existence of these composites can be experimentally proved using, for example, Mössbauer spectroscopy [41] or transmission electron microscopy (TEM) techniques. The latter are sensitive to anti-phase boundaries (APBs), which have a different character in FeAl and the Fe-Al phase [42,43,44,45].
2. Methods
Our quantum-mechanical calculations were performed within the framework of density functional theory [46,47] using the Vienna Ab initio Simulation Package (VASP) [48,49] and projector augmented wave (PAW) pseudopotentials [50,51]. When studying the transition-metal disilicides, the exchange and correlation energy was treated in the local density approximation (LDA) [52] but, in the case of phases containing the Fe and Al atoms, the generalized gradient approximation (GGA) parameterized by Perdew and Wang [53] (PW91) with the Vosko–Wilk–Nusair correction [54] was necessary to correctly reproduce the ground-state D0 structure of FeAl. Regarding the MoSi and WSi, we used a plane-wave energy cut-off of 400 eV and the k-point Monkhorst–Pack [55] meshes contained 20 × 20 × 2 (10 × 10 × 8) k-points in the case of 24-atom supercells modeling the superlattices with stacking along the [001] ([100] and [110]) directions. The calculations for TaSi and NbSi required the cut-off energy of 480 eV and the 12 × 12 × 4 k-point mesh in the case of 18-atom supercells. When computing Fe-Al-based nanocomposites, the cut-off energy was equal to 350 eV and the sampling of the Brillouin zone was done using Monkhorst–Pack grids with 10 × 10 × 6 k-points in the case of computational supercells containing 32 atoms. All calculations had an estimated error-bar of about 0.001 eV/atom. Finally, the second-order elastic constants were determined using the stress-strain method [56].
3. Results
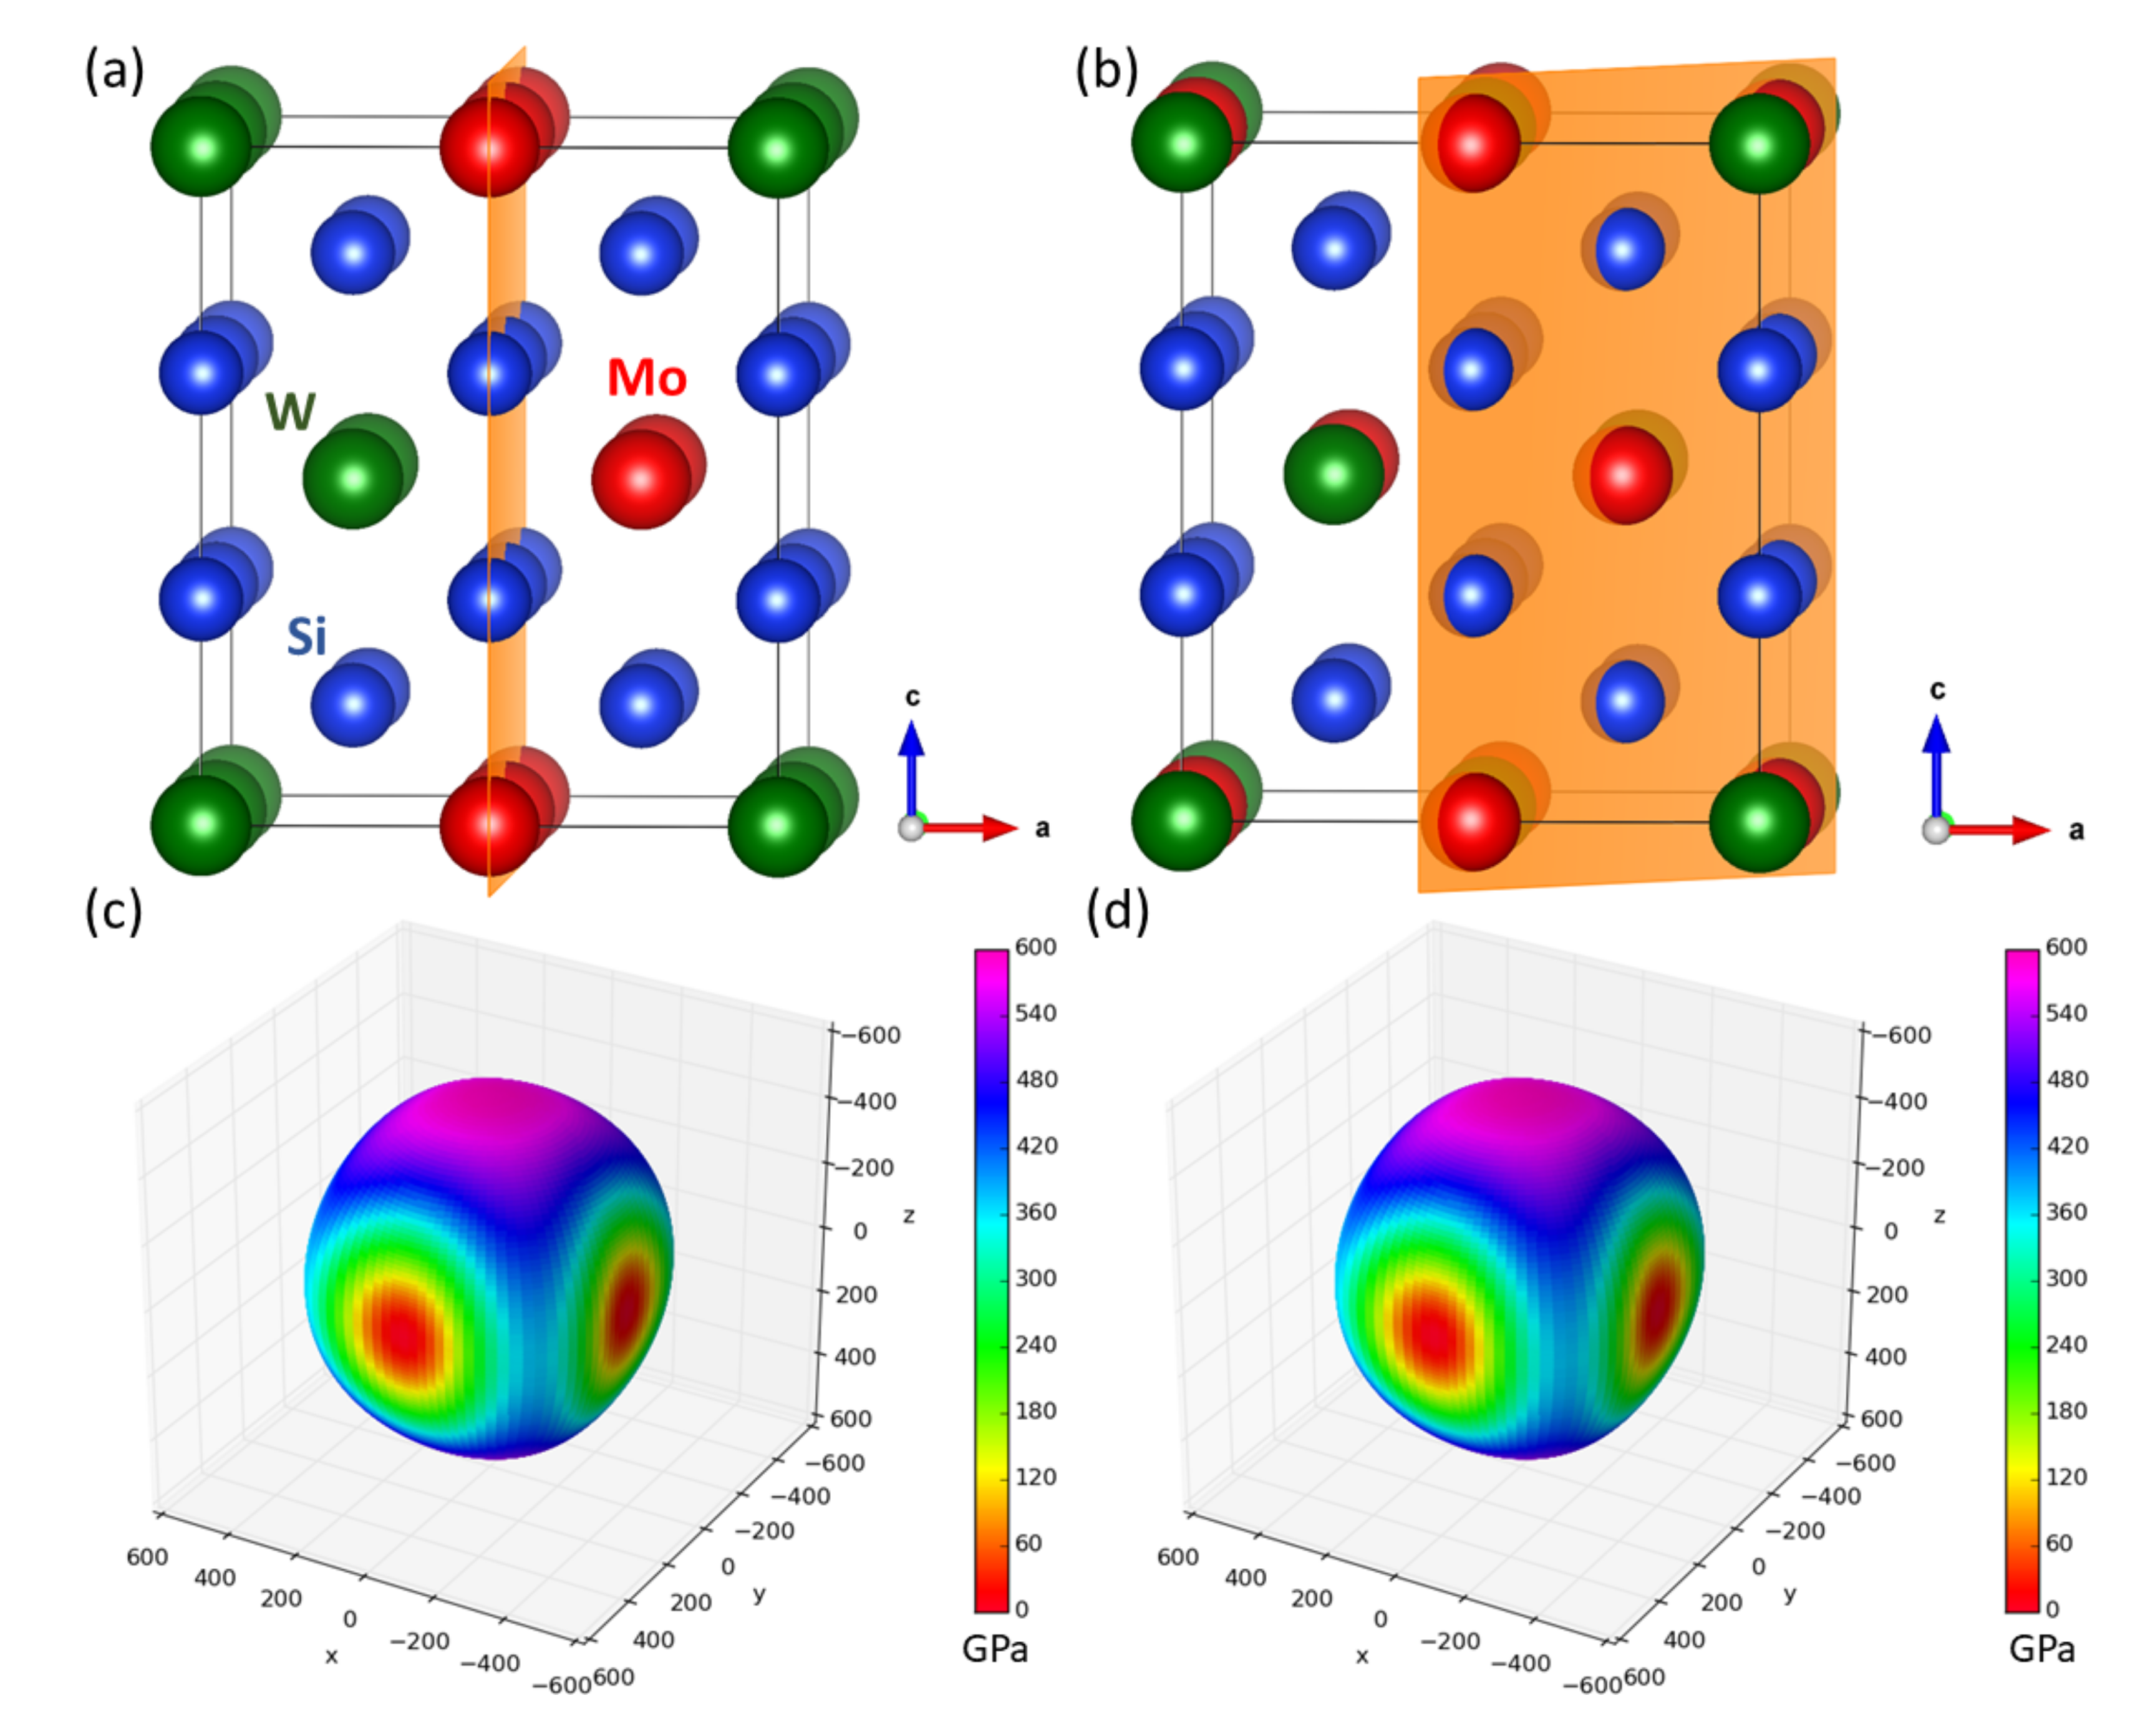
The first type of studied nanocomposite containing transition-metal disilicides is visualized in Figure 1a. WSi and MoSi, which crystallize in the tetragonal C11 structure, form a coherent nanocomposite where two conventional cells of each materials are stacked one on top of the other along the [001] direction (the interfaces are perpendicular to this direction) and alternate. It should be emphasized that, due to the periodic boundary conditions, which are applied to all nanocomposites in our calculations, the simulated nanocomposites form so-called superlattices [57,58,59,60,61,62,63,64,65,66,67,68,69,70,71,72,73,74,75,76,77,78] when the atomic planes continue from one phase into another.
As seen in Table 1, both disilicides have very similar lattice parameters a and c describing their tetragonal structure and also quite similar elastic properties. Our theoretical values are in excellent agreement with both experimental data and previous calculations. The elasticity of bulk phases is conveniently visualized in Figure 1b,c in the form of directional dependences of the Young’s modulus. The values for this composite with an equal amount of both phases are listed in Table 1 at the line for the composition (WSi)(MoSi).
As a consequence of the similarity of the elastic constants of both constituents, the overall elastic properties of their nanocomposites are quite similar, too.
Next, we evaluated the interface energy of the nanocomposites according to the formula:
using the energy of the supercell modeling the nanocomposite , which contains m formula units of and n formula units of , the energies of bulk phases of each constituent and and the area of the interface A. Importantly, very probably due to the similarity of both constituents, the interface energy was found to be ultra low, essentially zero within the error bar of our calculations, i.e., the energy differences in Equation (1) are smaller than 0.001 eV/atom and the interface energies are then smaller than about 0.005 J/m.
To examine how the ultra-low interface energies depend on the width of the layers containing individual constituents within the nanocomposite as well as on the ratio of amount of both materials, we simulated a series of seven other superlattices with varying width of the constituents, as visualized in Figure 2. The calculated structural and elastic parameters are summarized in Table 1. The lattice parameter a increased quite monotonously from the value calculated for bulk MoSi to that obtained for bulk WSi. The changes of the lattice parameter c are much smaller because the values found for bulk MoSi and WSi are only very slightly different. Rather monotonous changes appear also for the elastic constants with all of them increasing when increasing the amount of elastically stiffer WSi. Importantly, all the studied nanocomposites have again ultra low interface energies, which are essentially zero within the error-bar of our calculations. Next, as seen in the Appendix, the ultra low interface energies were nearly independent of the crystallographic orientation of the interface.
After examining the WSi/MoSi nanocomposites, which were experimentally reported to exist, we next drew our attention to another class of nanocomposites containing transition-metal disilicides, which were structurally and elastically very similar. The studied TaSi and NbSi crystallize in the hexagonal C40 structure and, therefore, we simulated a superlattice based on this structure (see Figure 3).
The nanocomposites have the interfaces perpendicular to the [0001] crystallographic direction. The lattice parameters a and c and elastic constants of both constituents in their bulk phases are summarized in Table 2. Our theoretical values are in an excellent agreement with both experimental data and previous calculations. Both disilicides have all the parameters very similar. The elasticity of bulk phases is conveniently visualized in Figure 3b,c in the form of directional dependences of the Young’s modulus. As the elastic properties are quite similar, the elasticity of the studied nanocomposite is not too different from that of the constituting phases (see Figure 3d). Importantly, the interface energy is ultra low for this superlattice, again zero within the error-bar of our calculations.
Similar to the case of the WSi/MoSi nanocomposites studied above, we examined how the ultra-low interface energies depend on the molar ratio of the constituting phases as well as on the width of the phases forming the superlattice (see Figure 4). We performed our calculations for a series of six other nanocomposites with different ratio of the TaSi and NbSi (see Figure 4a–f). Out of the six calculated superlattices shown in Figure 4, those shown in Figure 4c,d have the same ratio of the amount of both materials but a higher number of internal interfaces, six and four, respectively.
When evaluating the interface energies, they were again found to be ultra low, namely zero within the error-bar of our calculations. The lattice parameters a and c of the C40-based structure are concerned were rather monotonously increasing from their lower values in TaSi to higher values in NbSi. In contrast to this trend, the elastic constants rather monotonously decreased from their higher values in TaSi to lower values in NbSi.
The last systems studied here is that containing two different phases from the binary iron-aluminium system, in particular, an ordered FeAl intermetallic compound crystallizing in the D0 structure and a disordered solid solution of 18.75 at.% of Al with a body-centered cubic (bcc) ferromagnetic (FM) matrix, so-called -or B2 phase. The structure of the former was is derived from the bcc lattice and, therefore, both materials structurally match each other. The studied nanocomposite is schematically visualized in Figure 5a. FeAl was modeled by a 16-atom conventional cell depicted in the upper part of in Figure 5a. The -phase represents a challenge for quantum-mechanical calculations because it lacks any long-range periodicity. We used a 16-atom supercell with atoms distributed according to so-called special quasi-random structure (SQS) concept.
The nanocomposite was formed by stacking the FeAl on top of the -phase along the [001] direction (the interfaces are perpendicular to this direction). In contrast to the above-discussed cases of superlattices formed by pairs of ordered transition-metal disilicides, when the both interfaces in the simulation supercell were identical, the supercells modeling the Fe-Al-based nanocomposites have different interfaces due to different distribution of atoms in the disordered -phase. The interface energies were then averaged values related to the two interfaces. As another difference between the pairs of structurally and elastically nearly identical disilicides discussed above, the two constituting phases have clearly distinguishable elastic properties. Again, they are conveniently visualized in the form of directional dependences of the Young’s modulus in Figure 5b,c for the FeAl and the Fe-Al -phase, respectively. The calculated values of elastic constants for FeAl compound are = 211 GPa, = 161 GPa and = 139 GPa. The elastic constants calculated for the disordered Fe-Al -phase were projected onto a set of elastic constants possessing a cubic symmetry according to the rigorous mathematical theory by Moakher and Norris [87]. Similar concepts are often used in case of systems with any form of disorder (see, e.g., Refs. [59,88,89,90,91]). The resulting cubic-symmetry elastic constants are = 217 GPa, = 131 GPa and = 120 GPa. Both phases exhibit 〈001〉 directions as elastically soft and 〈111〉 directions as elastically hard (i.e., with the minimum and maximum values of the Young’s modulus, respectively). The FeAl is also apparently elastically more anisotropic. The overall elasticity of their composite is then shown in Figure 5d.
Importantly, the interface energy was found to be ultra low again, only 0.005 J/m, which represents an energy difference appearing in Equation ((1)) smaller than 0.001 eV/atom, i.e., within the error-bar of our calculations. To determine an impact of distribution of atoms in the disordered Fe-Al -phase on the interface energies, we performed a series of six additional calculations for supercells which have the same stoichiometry but differ in distributions of atoms in the Fe-Al -phase (see Figure 6). In fact, the structure of coordination shells of atoms remain the same. For example, considering the Al atoms, their distribution in the part corresponding to the Fe-Al -phase in the structural variants in Figure 6 are the same but the part of the supercell corresponding to the Fe-Al -phase is either rotated and/or the atomic planes are permuted. As far as the latter process is concerned, if the atomic planes perpendicular to the [001] direction in the -phase part of Figure 5a would be numbered 1, 2, 3, 4, then by a permutation is meant, e.g., an arrangement 2, 3, 4, 1. Importantly, if being in a single-phase bulk, such permutation of atomic planes within the periodically repeated cell or rotations of the whole cell would not change the energy because the position of the origin of coordinates (and the attached coordinate frame) can be arbitrarily shifted with respect to the crystal lattice.
The situation is, on the other hand, different in nanocomposites because the interface represents a reference point not existing in the single-phase bulk. The calculated energies are covering a broader range: 0.055 J/m (Figure 6a), 0.021 J/m (Figure 6b), 0.032 J/m (Figure 6c), 0.006 J/m (Figure 6d), 0.139 J/m (Figure 6e), and 0.014 J/m (Figure 6f). While this sensitivity on the atomic distribution is rather significant, the elastic properties of nanocomposites shown in Figure 6 are very similar. The computed values of elastic constants are summarized in Table 3.
As both phases appearing in the studied nanocomposites are magnetic, we further examined local magnetic moments of the iron atoms in configurations visualized in Figure 6a–f. The magnitude of local magnetic moments are shown in Figure 7 by the diameter of the spheres representing the Fe atoms. The lowest and the highest value (1.8 and 2.44 ) are explicitly mentioned in Figure 7a to demonstrate a scaling, by which the magnitude of the local magnetic moment is indicated by the diameter of the spheres. Importantly, the magnetic properties of the Fe atoms turned out to be very sensitive to the distribution of atoms (they are reduced when the Al atoms are nearby).
4. Discussion
The above-discussed ultra low interface energies in the MoSi/WSi nanocomposites may also indicate that both constituents are prone to mixing even at the atomic level. Indeed, it seems that longer annealing times lead to formation of solid-solution phases rather than (nano)composites. For example, MoSi/WSi powders are synthesized by means of self-propagating high temperature combustion in [92] but solid solutions of MoSi/WSi and MoSi/WSi are found. In [93], it is also reported that it is hard to distinguish MoSi and WSi phases and (W,Mo)Si mainly in solid solution is found in Ref. [94]. The difficulties to distinguish MoSi and WSi Bragg peaks can be attributed to tetragonal MoSi and WSi phase having a long-range structure with very similar lattice constants (a is equal to 0.3202 nm and 0.3211, c amounts to 0.7855nm and 0.7835nm, respectively) [83]. It is also confirmed that MoSi/WSi solid solution powder with nanometric (Mo,W)Si structure forms via combustion synthesis method from the mechanical activated powder mixture [95].
To test the scenario of a random solid solution of Mo and W within a C11 lattice, we performed a series of calculations for supercells modeling these states (see Figure 8a–d). The corresponding enthalpies of mixing (evaluated with respect to the energy of MoSi and WSi as reference end-members) are shown in Figure 8e and all of them are between zero and −0.001 eV/atom, i.e., within the error-bar of our calculations and comparable to the energy differences obtained when simulating the MoSi/WSi nanocomposites.
The above-discussed competition between formation of two-phase nanocomposites on the one hand and single-phase solid solutions on the other hand probably explains why a suitable preparation route is still being searched for in the case of TaSi/NbSi nanocomposites when Nb solubility in TaSi extremely large [97]. Our results related to the TaSi/NbSi nanocomposites are intended as a motivation for future studies of this interesting system.
5. Conclusions
We performed a first-principles study of structural, thermodynamic and elastic properties of nanocomposites exhibiting ultra low or low interface energies. As examples of systems with predominantly covalent interatomic bonds, we studied two combinations of transition-metal disilicides: (i) MoSi/WSi nanocomposites with individual constituents crystallizing in the tetragonal C11 structure; and (ii) TaSi/NbSi with the two components crystallizing in the hexagonal C40 structure. The constituents within each pair of materials exhibit very similar structural and elastic properties and we obtained ultra low (nearly zero) interface energy for their nanocomposites (within the error bar of our calculations, i.e., about 0.005 J/m). The interface energy was found to be nearly independent on the width of individual constituents within the nanocomposites and/or crystallographic orientation of the interfaces.
As an example of a magnetic system, a pair of metallic phases containing from the Fe-Al system with different atomic ordering was considered. In particular, we simulated coherent superlattices formed by an ordered FeAl intermetallic compound and a disordered Fe-Al phase with 18.75 at.% Al, the -phase. Both constituents are structurally and elastically rather similar (but less than the two pairs of studied disilicides). To estimate the interface energy in the nanocomposite containing the disordered -phase, which lacks a long-range periodicity, we simulated seven different distributions of atoms in the -phase interfacing the FeAl intermetallic compound. The resulting interface energies were again either ultra low or low, from 0.005 to 0.139 J/m. While the impact of atomic distribution on the elastic properties was found insignificant, the local magnetic moments of the iron atoms sensitively depended on the type and the distribution of surrounding atoms.
Author Contributions
Conceptualization, M.F.; Methodology, D.H.; Resources, M.Š. and M.F.; Writing—Original Draft Preparation, M.F.; Writing—Review and Editing, D.H. and M.Š.; Visualization, M.F.; Supervision, M.Š.; Project Administration, M.Š. and M.F.; and Funding Acquisition, M.Š. and M.F.
Funding
The authors acknowledge the Czech Science Foundation for the financial support received under the Project Nos. 16-24711S (M.Š.) and 17-22139S (M.F.). Additional resources were provided by the Academy of Sciences of the Czech Republic through the Fellowship of J. E. Purkyně (M.F.) and by the Ministry of Education, Youth and Sports of the Czech Republic under the Project CEITEC 2020, LQ1601 (M.Š). D.H. acknowledges financial support from the Austrian Science Fund (FWF), Project Number P30341-N36. The computational results presented have been achieved in part using the Vienna Scientific Cluster (VSC).
Acknowledgments
M.F. and M.Š. acknowledge the support from the Academy of Sciences of the Czech Republic (Institutional Project No. RVO:68081723) and from the Ministry of Education, Youth and Sports of the Czech Republic via the research infrastructure IPMINFRA, LM2015069. Computational resources were made available by the Ministry of Education, Youth and Sports of the Czech Republic under the Projects CESNET (Project No. LM2015042), CERIT-Scientific Cloud (Project No. LM2015085) and IT4Innovations National Supercomputer Center (Project No. LM2015070) within the program Projects of Large Research, Development and Innovations Infrastructures. Figure 1a, Figure 2, Figure 3a, Figure 4, Figure 5a, Figure 6, Figure 8a–d, and Figure A1a,b were visualized using the VESTA package [98].
Conflicts of Interest
The authors declare no conflict of interest.
Appendix A
To analyze the dependence of the ultra-low interface energies in the MoSi/WSi nanocomposites on the crystallographic orientation of the interface, we computed properties of two other superlattices with the interfaces perpendicular to the [010] and [110] directions, respectively. The corresponding supercells modeling these nanocomposites are shown in Figure A1a,b, respectively. The elastic properties of these superlattices are visualized in the form of directional dependences of the Young’s modulus in Figure A1c,d. It is obvious that they are again very similar to each other and also very similar to that of the superlattice with the interfaces perpendicular to the [001] direction.
Figure A1.
Schematics of computational supercells of MoSi/WSi nanocomposites (superlattices) with the stacking along (and the interfaces perpendicular to) the [010] (a) and [110] (b) directions within the C11 lattice, respectively. The interface planes are marked by orange color. The calculated elastic constants for these superlattices are shown as directional dependences of the Young’s modulus for the composite with the [010] stacking direction (c) as well as that with the [110] stacking direction (d). Parts (c,d) were visualized by the SC-EMA [79,80,81] library (scema.mpie.de) based on ab initio computed elastic constants.

References
- Yamaguchi, M.; Inui, H.; Ito, K. High-temperature structural intermetallics. Acta Mater. 2000, 48, 307–322. [Google Scholar] [CrossRef]
- Umakoshi, Y.; Nakano, T.; Kishimoto, K.; Furuta, D.; Hagihara, K.; Azuma, M. Strength and deformation mechanism of C40-based single crystal and polycrystalline silicides. Mater. Sci. Eng. A 1999, 261, 113–121. [Google Scholar] [CrossRef]
- Petrovic, J.; Vasudevan, A. Key developments in high temperature structural silicides. Mater. Sci. Eng. A 1999, 261, 1–5. [Google Scholar] [CrossRef]
- Inui, H.; Moriwaki, M.; Yamaguchi, M. Plastic deformation of single crystals of VSi2 and TaSi2with the C40 structure. Intermetallics 1998, 6, 723–728. [Google Scholar] [CrossRef]
- Zhou, Y.; Zhang, Z.; Jin, X.; Ye, G.; Liu, C. Fabrication and Composition Investigation of WSi2/MoSi2 Composite Powders Obtained by a Self-Propagating High-Temperature Synthesis Method. Arabian J. Sci. Eng. 2016, 41, 2583–2587. [Google Scholar] [CrossRef]
- Deevi, S.C. Self-propagating high-temperature synthesis of molybdenum disilicide. J. Mater. Sci. 1991, 26, 3343–3353. [Google Scholar] [CrossRef]
- Ke, P.; Yi, M.; Ran, L. Reaction thermodynamics of MoSi2-WSi2 composites in the thermal explosion mode of SHS. Rare Met. Mater. Eng. 2006, 35, 554–558. [Google Scholar]
- Zhang, H.; Chen, P.; Wang, M.; Liu, X. Room-temperature mechanical properties of WSi2/MoSi2 composites. Rare Met. 2002, 21, 304–307. [Google Scholar]
- Chen, F.; Xu, J.; Liu, Y.; Cai, L. In situ reactive spark plasma sintering of WSi2/MoSi2 composites. Ceram. Int. 2016, 42, 11165–11169. [Google Scholar] [CrossRef]
- Zamani, S.; Bakhsheshi-Rad, H.R.; Kadir, M.R.A.; Shafiee, M.R.M. Synthesis and kinetic study of (Mo,W)Si2-WSi2 nanocomposite by mechanical alloying. J. Alloys Compd. 2012, 540, 248–259. [Google Scholar] [CrossRef]
- Xu, J.; Wang, Y.; Weng, B.; Chen, F. Preparation and Characterization of MoSi2/WSi2Composites from MASHSed Powder. Mater. Trans. 2015, 56, 313–316. [Google Scholar] [CrossRef]
- Kattner, U.; Burton, B. Al-Fe (Aluminium-Iron). In Phase Diagrams of Binary Iron Alloys; Okamoto, H., Ed.; ASM Internationa: Materials Park, OH, USA, 1993; pp. 12–28. [Google Scholar]
- Sauthoff, G. Intermetallics; VCH Verlagsgesellschaft: Weinheim, Germany, 1995. [Google Scholar]
- Liu, C.T.; Stringer, J.; Mundy, J.N.; Horton, L.L.; Angelini, P. Ordered intermetallic alloys: An assessment. Intermetallics 1997, 5, 579–596. [Google Scholar] [CrossRef]
- Stoloff, N.S. Iron aluminides: Present status and future prospects. Mater. Sci. Eng. A 1998, 258, 1–14. [Google Scholar] [CrossRef]
- Palm, M.; Inden, G.; Thomas, N. The Fe-Al-Ti system. J. Phase Equilib. 1995, 16, 209–222. [Google Scholar] [CrossRef]
- Palm, M.; Lacaze, J. Assessment of the Al-Fe-Ti system. Intermetallics 2006, 14, 1291–1303. [Google Scholar] [CrossRef]
- Palm, M.; Sauthoff, G. Deformation behaviour and oxidation resistance of single-phase and two-phase L21-ordered Fe-Al-Ti alloys. Intermetallics 2004, 12, 1345–1359. [Google Scholar] [CrossRef]
- Sundman, B.; Ohnuma, I.; Dupin, N.; Kattner, U.R.; Fries, S.G. An assessment of the entire Al-Fe system including D0(3) ordering. Acta Mater. 2009, 57, 2896–2908. [Google Scholar] [CrossRef]
- Stein, F.; Palm, M. Re-determination of transition temperatures in the Fe-Al system by differential thermal analysis. Int. J. Mater. Res. 2007, 98, 580–588. [Google Scholar] [CrossRef]
- Palm, M. Fe-Al materials for structural applications at high temperatures: Current research at MPIE. Int. J. Mater. Res. 2009, 100, 277–287. [Google Scholar] [CrossRef]
- Watson, R.E.; Weinert, M. Transition-metal aluminide formation: Ti, V, Fe, and Ni aluminides. Phys. Rev. B 1998, 58, 5981–5988. [Google Scholar] [CrossRef]
- Gonzales-Ormeno, P.; Petrilli, H.; Schon, C. Ab-initio calculations of the formation energies of BCC-based superlattices in the Fe-Al system. Calphad 2002, 26, 573. [Google Scholar] [CrossRef]
- Friák, M.; Neugebauer, J. Ab initio study of the anomalous volume-composition dependence in Fe-Al alloys. Intermetallics 2010, 18, 1316–1321. [Google Scholar] [CrossRef]
- Amara, H.; Fu, C.C.; Soisson, F.; Maugis, P. Aluminum and vacancies in α-iron: Dissolution, diffusion, and clustering. Phys. Rev. B 2010, 81, 174101. [Google Scholar] [CrossRef]
- Liu, S.; Duan, S.; Ma, B. First-principles calculation of vibrational entropy for Fe-Al compounds. Phys. Rev. B 1998, 58, 9705–9709. [Google Scholar]
- Kulikov, N.I.; Postnikov, A.V.; Borstel, G.; Braun, J. Onset of magnetism in B2 transition-metal aluminides. Phys. Rev. B 1999, 59, 6824–6833. [Google Scholar] [CrossRef]
- Fähnle, M.; Drautz, R.; Lechermann, F.; Singer, R.; Diaz-Ortiz, A.; Dosch, H. Thermodynamic properties from ab-initio calculations: New theoretical developments, and applications to various materials systems. Phys. Status Solidi B-Basic Solid State Phys. 2005, 242, 1159–1173. [Google Scholar] [CrossRef]
- Friák, M.; Deges, J.; Krein, R.; Frommeyer, G.; Neugebauer, J. Combined ab initio and experimental study of structural and elastic properties of Fe3Al-based ternaries. Intermetallics 2010, 18, 1310. [Google Scholar] [CrossRef]
- Kirklin, S.; Saal, J.E.; Hegde, V.I.; Wolverton, C. High-throughput computational search for strengthening precipitates in alloys. Acta Mater. 2016, 102, 125–135. [Google Scholar] [CrossRef] [Green Version]
- Airiskallio, E.; Nurmi, E.; Heinonen, M.H.; Vayrynen, I.J.; Kokko, K.; Ropo, M.; Punkkinen, M.P.J.; Pitkanen, H.; Alatalo, M.; Kollar, J.; Johansson, B.; Vitos, L. High temperature oxidation of Fe-Al and Fe-Cr-Al alloys: The role of Cr as a chemically active element. Corros. Sci. 2010, 52, 3394–3404. [Google Scholar] [CrossRef]
- Medvedeva, N.I.; Park, M.S.; Van Aken, D.C.; Medvedeva, J.E. First-principles study of Mn, Al and C distribution and their effect on stacking fault energies in fcc Fe. J. Alloy. Compd. 2014, 582, 475–482. [Google Scholar] [CrossRef]
- Čížek, J.; Lukáč, F.; Procházka, I.; Kužel, R.; Jirásková, Y.; Janičkovič, D.; Anwand, W.; Brauer, G. Characterization of quenched-in vacancies in Fe-Al alloys. Physica B 2012, 407, 2659–2664. [Google Scholar] [CrossRef]
- Ipser, H.; Semenova, O.; Krachler, R. Intermetallic phases with DO3-structure: A statistical-thermodynamic model. J. Alloy. Compd. 2002, 338, 20–25. [Google Scholar] [CrossRef]
- Miháliková, I.; Slávik, A.; Friák, M.; Všianská, M.; Koutná, N.; Holec, D.; Šob, M. First-principles study of interface energies in Fe-Al-based superalloy nanocomposites. In NANOCON 2017 Conference Proceedings (9th International Conference on Nanomaterials—Research & Application, Brno, Oct. 18–20, 2017); Tanger Ltd.: Ostrava, Czech Republic, 2017; pp. 69–74. [Google Scholar]
- Šesták, P.; Friák, M.; Holec, D.; Všianská, M.; Šob, M. Strength and Brittleness of Interfaces in Fe-Al Superalloy Nanocomposites under Multiaxial Loading: An ab initio and Atomistic Study. Nanomaterials 2018, 8, 873. [Google Scholar] [CrossRef] [PubMed]
- Lechermann, F.; Welsch, F.; Elsässer, C.; Ederer, C.; Fähnle, M.; Sanchez, J.; Meyer, B. Density-functional study of Fe3Al: LSDA versus GGA. Phys. Rev. B 2002, 65, 132104. [Google Scholar] [CrossRef]
- Connetable, D.; Maugis, P. First principle calculations of the kappa-Fe3AlC perovskite and iron-aluminium intermetallics. Intermetallics 2008, 16, 345–352. [Google Scholar] [CrossRef]
- Lechermann, F.; Fähnle, M.; Meyer, B.; Elsässer, C. Electronic correlations, magnetism, and structure of Fe-Al subsystems: An LDA+U study. Phys. Rev. B 2004, 69, 165116. [Google Scholar] [CrossRef]
- Kellou, A.; Grosdidier, T.; Raulot, J.M.; Aourag, H. Atomistic study of magnetism effect on structural stability in Fe3Al and Fe3AlX (X = H, B, C, N, O) alloys. Phys. Status Solidi B-Basic Solid State Phys. 2008, 245, 750–755. [Google Scholar] [CrossRef]
- Jiraskova, Y.; Pizurova, N.; Titov, A.; Janickovic, D.; Friak, M. Phase separation in Fe-Ti-Al alloy—Structural, magnetic, and Moessbauer study. J. Magn. Magn. Mater. 2018, 468, 91–99. [Google Scholar] [CrossRef]
- Wang, K.; Wang, Y.; Cheng, Y. The Formation and Dynamic Evolution of Antiphase Domain Boundary in FeAl Alloy: Computational Simulation in Atomic Scale. Mater. Res. Ibero-Am. J. Mater. 2018, 21, e20171048. [Google Scholar] [CrossRef]
- Balagurov, A.M.; Bobrikov, I.A.; Sumnikov, V.S.; Golovin, I.S. Antiphase domains or dispersed clusters? Neutron diffraction study of coherent atomic ordering in Fe3Al-type alloys. Acta Mater. 2018, 153, 45–52. [Google Scholar] [CrossRef]
- Murakami, Y.; Niitsu, K.; Tanigaki, T.; Kainuma, R.; Park, H.S.; Shindo, D. Magnetization amplified by structural disorder within nanometre-scale interface region. Nat. Commun. 2014, 5, 4133. [Google Scholar] [CrossRef] [PubMed] [Green Version]
- Oguma, R.; Matsumura, S.; Eguchi, T. Kinetics of B2-and D03 type ordering and formation of domain structures in Fe-Al alloys. J. Phys. Cond. Matter 2008, 20, 275225. [Google Scholar] [CrossRef] [PubMed]
- Hohenberg, P.; Kohn, W. Inhomogeneous electron gas. Phys. Rev. 1964, 136, B864–B871. [Google Scholar] [CrossRef]
- Kohn, W.; Sham, L.J. Self-consistent equations including exchange and correlation effects. Phys. Rev. 1965, 140, A1133–A1138. [Google Scholar] [CrossRef]
- Kresse, G.; Hafner, J. Ab initio molecular dynamics for liquid metals. Phys. Rev. B 1993, 47, 558–561. [Google Scholar] [CrossRef]
- Kresse, G.; Furthmüller, J. Efficient iterative schemes for ab initio total-energy calculations using a plane-wave basis set. Phys. Rev. B 1996, 54, 11169–11186. [Google Scholar] [CrossRef]
- Blöchl, P.E. Projector augmented-wave method. Phys. Rev. B 1994, 50, 17953–17979. [Google Scholar] [CrossRef] [Green Version]
- Kresse, G.; Joubert, D. From ultrasoft pseudopotentials to the projector augmented-wave method. Phys. Rev. B 1999, 59, 1758. [Google Scholar] [CrossRef]
- Ceperley, D.M.; Alder, B.J. Ground State of the Electron Gas by a Stochastic Method. Phys. Rev. Lett. 1980, 45, 566–569. [Google Scholar] [CrossRef] [Green Version]
- Perdew, J.P.; Wang, Y. Accurate and simple analytic representation of the electron-gas correlation energy. Phys. Rev. B 1992, 45, 13244–13249. [Google Scholar] [CrossRef]
- Vosko, S.H.; Wilk, L.; Nusair, M. Accurate spin-dependent electron liquid correlation energies for local spin density calculations: A critical analysis. Can. J. Phys. 1980, 58, 1200. [Google Scholar] [CrossRef]
- Monkhorst, H.J.; Pack, J.D. Special points for Brillouin-zone integrations. Phys. Rev. B 1976, 13, 5188–5192. [Google Scholar] [CrossRef]
- Zhou, L.; Holec, D.; Mayrhofer, P.H. First-principles study of elastic properties of Cr-Al-N. J. Appl. Phys. 2013, 113, 043511. [Google Scholar] [CrossRef]
- Mayrhofer, P.H.; Fischer, F.D.; Boehm, H.J.; Mitterer, C.; Schneider, J.M. Energetic balance and kinetics for the decomposition of supersaturated Ti1−xAlxN. Acta Mater. 2007, 55, 1441–1446. [Google Scholar] [CrossRef]
- Wu, L.; Chen, M.; Li, C.; Zhou, J.; Shen, L.; Wang, Y.; Zhong, Z.; Feng, M.; Zhang, Y.; Han, K.; et al. Ferromagnetism and matrix-dependent charge transfer in strained LaMnO3-LaCoO3 superlattices. Mater. Res. Lett. 2018, 6, 501–507. [Google Scholar] [CrossRef]
- Koutná, N.; Holec, D.; Friák, M.; Mayrhofer, P.H.; Šob, M. Stability and elasticity of metastable solid solutions and superlattices in the MoN-TaN system: First-principles calculations. Mater. Des. 2018, 144, 310–322. [Google Scholar] [CrossRef]
- Jiang, M.; Xiao, H.Y.; Peng, S.M.; Yang, G.X.; Liu, Z.J.; Zu, X.T. A comparative study of low energy radiation response of AlAs, GaAs and GaAs/AlAs superlattice and the damage effects on their electronic structures. Sci. Rep. 2018, 8, 2012. [Google Scholar] [CrossRef] [Green Version]
- Wen, Y.N.; Gao, P.F.; Xia, M.G.; Zhang, S.L. Half-metallic ferromagnetism prediction in MoS2-based two-dimensional superlattice from first-principles. Mod. Phys. Lett. B 2018, 32, 1850098. [Google Scholar] [CrossRef]
- Friák, M.; Tytko, D.; Holec, D.; Choi, P.P.; Eisenlohr, P.; Raabe, D.; Neugebauer, J. Synergy of atom-probe structural data and quantum-mechanical calculations in a theory-guided design of extreme-stiffness superlattices containing metastable phases. New J. Phys. 2015, 17, 093004. [Google Scholar] [CrossRef] [Green Version]
- Dai, Q.; Eckern, U.; Schwingenschlog, U. Effects of oxygen vacancies on the electronic structure of the (LaVO3)6/SrVO3 superlattice: A computational study. New J. Phys. 2018, 20, 073011. [Google Scholar] [CrossRef]
- Jiang, M.; Xiao, H.; Peng, S.; Qiao, L.; Yang, G.; Liu, Z.; Zu, X. First-Principles Study of Point Defects in GaAs/AlAs Superlattice: the Phase Stability and the Effects on the Band Structure and Carrier Mobility. Nanoscale Res. Lett. 2018, 13, 301. [Google Scholar] [CrossRef]
- Chen, H.; Millis, A.J.; Marianetti, C.A. Engineering Correlation Effects via Artificially Designed Oxide Superlattices. Phys. Rev. Lett. 2013, 111, 116403. [Google Scholar] [CrossRef] [PubMed]
- Mottura, A.; Janotti, A.; Pollock, T.M. A first-principles study of the effect of Ta on the superlattice intrinsic stacking fault energy of L12-Co3(Al,W). Intermetallics 2012, 28, 138–143. [Google Scholar] [CrossRef]
- Rosengaard, N.; Skriver, H. Ab-initio study of antiphase boundaries and stacking-faults in L12 and D022 compounds. Phys. Rev. B 1994, 50, 4848–4858. [Google Scholar] [CrossRef]
- Torres-Pardo, A.; Gloter, A.; Zubko, P.; Jecklin, N.; Lichtensteiger, C.; Colliex, C.; Triscone, J.M.; Stephan, O. Spectroscopic mapping of local structural distortions in ferroelectric PbTiO3/SrTiO3 superlattices at the unit-cell scale. Phys. Rev. B 2011, 84, 220102. [Google Scholar] [CrossRef]
- Chawla, V.; Holec, D.; Mayrhofer, P.H. Stabilization criteria for cubic AlN in TiN/AlN and CrN/AlN bi-layer systems. J. Phys. D 2013, 46, 045305. [Google Scholar] [CrossRef]
- Cooper, V.R.; Rabe, K.M. Enhancing piezoelectricity through polarization-strain coupling in ferroelectric superlattices. Phys. Rev. B 2009, 79, 180101. [Google Scholar] [CrossRef]
- Chen, B.; Zhang, Q.; Bernholc, J. Si diffusion in GaAs and Si-induced interdiffusion in GaAs/AlAs superlattices. Phys. Rev. B 1994, 49, 2985–2988. [Google Scholar] [CrossRef]
- Schmid, U.; Christensen, N.; Cardona, M.; Lukes, F.; Ploog, K. Optical anisotropy in GaAs/AlSs(110) superlattices. Phys. Rev. B 1992, 45, 3546–3551. [Google Scholar] [CrossRef]
- Gibson, Q.D.; Schoop, L.M.; Weber, A.P.; Ji, H.; Nadj-Perge, S.; Drozdov, I.K.; Beidenkopf, H.; Sadowski, J.T.; Fedorov, A.; Yazdani, A.; Valla, T.; Cava, R.J. Termination-dependent topological surface states of the natural superlattice phase Bi4Se3. Phys. Rev. B 2013, 88, 081108R. [Google Scholar] [CrossRef]
- Park, C.; Chang, K. Structural and electronic-properties of GaP-AlP (001) superlattices. Phys. Rev. B 1993, 47, 12709–12715. [Google Scholar] [CrossRef]
- Romanyuk, O.; Hannappel, T.; Grosse, F. Atomic and electronic structure of GaP/Si(111), GaP/Si(110), and GaP/Si(113) interfaces and superlattices studied by density functional theory. Phys. Rev. B 2013, 88, 115312. [Google Scholar] [CrossRef]
- Abdulsattar, M.A. SiGe superlattice nanocrystal pure and doped with substitutional phosphorus single atom: Density functional theory study. Superlattices Microstruct. 2011, 50, 377–385. [Google Scholar] [CrossRef]
- Botti, S.; Vast, N.; Reining, L.; Olevano, V.; Andreani, L. Ab initio and semiempirical dielectric response of superlattices. Phys. Rev. B 2004, 70, 045301. [Google Scholar] [CrossRef]
- Rondinelli, J.M.; Spaldin, N.A. Electron-lattice instabilities suppress cuprate-like electronic structures in SrFeO3/OSrTiO3 superlattices. Phys. Rev. B 2010, 81, 085109. [Google Scholar] [CrossRef]
- Titrian, H.; Aydin, U.; Friák, M.; Ma, D.; Raabe, D.; Neugebauer, J. Self-consistent Scale-bridging Approach to Compute the Elasticity of Multi-phase Polycrystalline Materials. MRS Proc. 2013, 1524, rr06. [Google Scholar] [CrossRef]
- Friák, M.; Counts, W.; Ma, D.; Sander, B.; Holec, D.; Raabe, D.; Neugebauer, J. Theory-Guided Materials Design of Multi-Phase Ti-Nb Alloys with Bone-Matching Elastic Properties. Materials 2012, 5, 1853–1872. [Google Scholar] [CrossRef] [Green Version]
- Zhu, L.F.; Friák, M.; Lymperakis, L.; Titrian, H.; Aydin, U.; Janus, A.; Fabritius, H.O.; Ziegler, A.; Nikolov, S.; Hemzalová, P.; Raabe, D.; Neugebauer, J. Ab initio study of single-crystalline and polycrystalline elastic properties of Mg-substituted calcite crystals. J. Mech. Behav. Biomed. Mater. 2013, 20, 296–304. [Google Scholar] [CrossRef]
- Nakamura, M.; Matsumoto, S.; Hirano, T. Elastic constants of MoSi2and WSi2 single crystals. J. Mater. Sci. 1990, 25, 3309–3313. [Google Scholar] [CrossRef]
- Zhang, H.; Chen, P.; Yan, J.; Tang, S. Fabrication and wear characteristics of MoSi2 matrix composite reinforced by WSi2and La2O3. Int. J. Refract. Met. Hard Mater. 2004, 22, 271–275. [Google Scholar] [CrossRef]
- Chu, F.; Ming, L.; Maloy, S.A.; Mitchell, T.E.; Migliori, A.; Garrett, J. Single crystal elastic constants of NbSi2. Philos. Mag. B 1995, 71, 373–382. [Google Scholar] [CrossRef]
- Erturk, E.; Gurel, T. Ab initio study of structural, elastic, and vibrational properties of transition-metal disilicides NbSi2 and TaSi2 in hexagonal C40 structure. Phys. B Cond. Matter 2018, 537, 188–193. [Google Scholar] [CrossRef]
- Wan, B.; Xiao, F.; Zhang, Y.; Zhao, Y.; Wu, L.; Zhang, J.; Gou, H. Theoretical study of structural characteristics, mechanical properties and electronic structure of metal (TM=V, Nb and Ta) silicides. J. Alloys Compd. 2016, 681, 412–420. [Google Scholar] [CrossRef]
- Moakher, M.; Norris, A.N. The closest elastic tensor of arbitrary symmetry to an elasticity tensor of lower symmetry. J. Elast. 2006, 85, 215–263. [Google Scholar] [CrossRef]
- Tasnádi, F.; Abrikosov, I.A.; Rogström, L.; Almer, J.; Johansson, M.P.; Oden, M. Significant elastic anisotropy in Ti1-xAlxN alloys. Appl. Phys. Lett. 2010, 97, 231902. [Google Scholar] [CrossRef]
- Tasnádi, F.; Odén, M.; Abrikosov, I. Ab initio elastic tensor of cubic Ti0.5Al0.5N alloys: Dependence of elastic constants on size and shape of the supercell model and their convergence. Phys. Rev. B 2012, 85, 144112. [Google Scholar] [CrossRef]
- Von Pezold, J.; Dick, A.; Friák, M.; Neugebauer, J. Generation and performance of special quasirandom structures for studying the elastic properties of random alloys: Application to Al-Ti. Phys. Rev. B 2010, 81, 094203. [Google Scholar] [CrossRef]
- Holec, D.; Tasnádi, F.; Wagner, P.; Friák, M.; Neugebauer, J.; Mayrhofer, P.; Keckes, J. Macroscopic elastic properties of textured ZrN-AlN polycrystalline aggregates: From ab initio calculations to grainscale interactions. Phys. Rev. B 2014, 90, 184106. [Google Scholar] [CrossRef]
- Kou, K.; Yang, Y.; Ai, Y.; Chen, Y.; Kang, M. Self-propagating high-temperature combustion synthesis of MoSi2-WSi2 composite. Rare Met. Mater. Eng. 2000, 29, 190–192. [Google Scholar]
- Zhang, Y.; Zhang, P.; Ren, J.; Zhang, L.; Zhang, J. SiC nanowire-toughened MoSi2-WSi2-SiC-Si multiphase coating for improved oxidation resistance of C C composites. Ceram. Int. 2016, 42, 12573–12580. [Google Scholar] [CrossRef]
- Ai, Y.; Cheng, Y.; Yang, Y.; Kang, M.; Liu, C. Preparation and microstructure of WSi2/MoSi2composite heat element. Rare Met. Mater. Eng. 2005, 34, 962–965. [Google Scholar]
- Xu, J.; Wu, H.; Li, B. Synthesis of MoSi2/WSi2nanocrystalline powder by mechanical-assistant combustion synthesis method. Int. J. Refract. Met. Hard Mater. 2010, 28, 217–220. [Google Scholar] [CrossRef]
- Zunger, A.; Wei, S.; Ferreira, L.; Bernard, J. Special quasirandom structures. Phys. Rev. Lett. 1990, 65, 353–356. [Google Scholar] [CrossRef] [PubMed] [Green Version]
- Li, J.; Wang, C.; Yao, J.; Yang, S.; Kang, Y.; Shi, Z.; Liu, X. Experimental investigation of phase equilibria in the Nb-Si-Ta ternary system. Int. J. Mater. Res. 2016, 107, 1112–1120. [Google Scholar] [CrossRef]
- Momma, K.; Izumi, F. VESTA 3 for three-dimensional visualization of crystal, volumetric and morphology data. J. Appl. Crystallogr. 2011, 44, 1272–1276. [Google Scholar] [CrossRef]
Figure 1.
Visualization of a WSi/MoSi nanocomposite (a superlattice) with the stacking along (and the interfaces perpendicular to) the [001] direction within the C11 lattice (a) accompanied with directional dependences of the Young’s modulus of bulk WSi (b), bulk MoSi (c) and the composite WSi/MoSi (d) formed out of them. The parts (b–d) were visualized by the SC-EMA [79,80,81] library (scema.mpie.de) based on ab initio computed elastic constants.

Figure 2.
Schematic visualization of supercells modeling various nanocomposites with the stacking along (and the interfaces perpendicular to) the [001] direction. The mutual ratio of the constituents varies from 1:7, i.e., (WSi)(MoSi), in the case of sub-figure (a), via 2:6 (b) and 3:5 (c) further for the opposite ratios 5:3 (d) and 6:2 (e) to 7:1, i.e., (WSi)(MoSi), in the case of sub-figure (f).

Figure 3.
A top-view and a side-view of the computational supercell used in our calculations as a model of TaSi/NbSi nanocomposite (a superlattice) with the stacking along (and the interfaces perpendicular to) the [0001] direction within the C40 lattice (a) accompanied with directional dependences of the Young’s modulus of bulk TaSi (b), bulk NbSi (c) and their composite TaSi/NbSi (d).

Figure 4.
Schematic visualization of simulated NbSi/TaSi nanocomposites with the stacking along (and the interfaces perpendicular to) the [0001] direction. The mutual ratio of the amount of constituents varies from 1:5, i.e., (NbSi)(TaSi) in the case of (a) via 2:4 (b), 3:3 (c,d) to 4:2 (e) and 5:1, i.e., (NbSi)(TaSi) in the case of (f). Variants shown in (c,d) have an equal amount of both constituting phases (similar to the case of Figure 3a) but a different arrangement of atomic layers. Consequently, there is a higher number of internal interfaces (6 and 4 in the case of (c,d), respectively) and the layers with different constituents have different widths.

Figure 5.
Visualization of a FeAl/Fe-Al nanocomposite (a superlattice) with the stacking along (and the interfaces perpendicular to) the [001] direction (a) accompanied with directional dependences of the Young’s modulus of bulk FeAl (b), bulk Fe-Al (c) and the nanocomposite FeAl/Fe-Al (d) formed out of them. Parts (b–d) were visualized by the SC-EMA [79,80,81] library (scema.mpie.de) based on ab initio computed elastic constants.

Figure 6.
Schematic visualizations of different computed FeAl/Fe-Al nanocomposites. The computed variants shown in sub-figures (a–f) differ by the distribution of atoms in the disordered Fe-Al phase.
Figure 6.
Schematic visualizations of different computed FeAl/Fe-Al nanocomposites. The computed variants shown in sub-figures (a–f) differ by the distribution of atoms in the disordered Fe-Al phase.

Figure 7.
Calculated local magnetic moments of iron atoms (the magnitude is indicated by the diameter of the spheres representing the Fe atoms). The local magnetic moments shown in sub-figures (a–f) correspond to atomic distributions of nanocomposites visualized in sub-figures (a–f) of Figure 6, respectively.

Figure 8.
Schematic visualization of the supercells modeling random solid solutions of Mo and W within a C11 lattice in the case of Mo:W ratio equal to 1:7 (a), 2:6 (b), 3:5 (c), and 4:4 (d) together with the correspondingenthalpies of mixing (e). The supercells for the Mo:W ratios equal to 5:3, 6:2 and 7:1 were obtained by swapping Mo and W atoms in the supercells shown in sub-figures (a–c). The atoms in the 32-atom supercells (2 × 2 × 1 multiple of 6-atom conventional cell of the C11 structure) were distributed according to the special quasi-random structure (SQS) concept [96].


Table 1.
Calculated structural characteristics and elastic constants of bulk MoSi and WSi as well as of their composite MoSi/WSi with the stacking along (and the interfaces perpendicular to) the [001] direction within the C11 lattice. The computed values are complemented by experimental data from the literature. As far as the lattice parameters a and c of the C11 structure are concerned, the values for the c lattice parameters of the nanocomposites are marked by the symbol of an asterisk * because they are divided by a factor of 4 to be compared with the values for the bulk unit cells of the individual constituents (bulk MoSi and WSi). The simulated nanocomposites are shown in Figure 2 and, specifically for the equal amount of both phases, in Figure 1a. Experimental elastic constants of MoSi and WSi were taken from Refs. [82,83].
| Composition | a | c | ||||||
|---|---|---|---|---|---|---|---|---|
| (Å) | (Å) | (GPa) | (GPa) | (GPa) | (GPa) | (GPa) | (GPa) | |
| MoSi | 3.176 | 7.781 | 428 | 125 | 101 | 537 | 208 | 207 |
| 3.202 [83] | 7.855 [83] | 417.0 [82] | 104.2 [82] | 83.8 [82] | 514.5 [82] | 204.2 [82] | 193.6 [82] | |
| (WSi)/(MoSi) | 3.178 | 7.782 * | 433 | 126 | 101 | 542 | 210 | 209 |
| (WSi)/(MoSi) | 3.180 | 7.781 * | 437 | 127 | 102 | 546 | 210 | 210 |
| (WSi)/(MoSi) | 3.181 | 7.781 * | 440 | 127 | 102 | 551 | 211 | 212 |
| (WSi)/(MoSi) | 3.183 | 7.780 * | 444 | 127 | 103 | 555 | 212 | 213 |
| (WSi)/(MoSi) | 3.185 | 7.780 * | 447 | 127 | 103 | 560 | 212 | 214 |
| (WSi)/(MoSi) | 3.186 | 7.780 * | 450 | 128 | 106 | 565 | 213 | 216 |
| (WSi)/(MoSi) | 3.188 | 7.780 * | 453 | 128 | 106 | 570 | 213 | 217 |
| WSi | 3.188 | 7.778 | 456 | 131 | 105 | 576 | 214 | 217 |
| 3.211 [83] | 7.835 [83] | 442.8 [82] | 121.7 [82] | 81.0 [82] | 552.3 [82] | 211.6 [82] | 217.5 [82] |
Table 2.
Calculated structural characteristics and elastic constants of bulk TaSi and NbSi as well as of their nanocomposites TaSi/NbSi with the stacking along (and the interfaces perpendicular to) the [0001] direction within the C40 lattice. The computed values are complemented by both experimental data as well as by other theoretical results from literature. As far as the lattice parameters a and c of the C40 structure are concerned, the values of the lattice parameter c for the nanocomposites are marked by an asterisk * because they are divided by factor of 2 to be compared with the values for the bulk unit cells of the individual constituents (bulk TaSi and NbSi). Experimental elastic constants of TaSi and NbSi were taken from Ref. [84] and theoretical ones from Refs. [85,86].
| Composition | a | c | |||||
|---|---|---|---|---|---|---|---|
| (Å) | (Å) | (GPa) | (GPa) | (GPa) | (GPa) | (GPa) | |
| TaSi | 4.736 | 6.530 | 394 | 85 | 101 | 487 | 143 |
| 4.77 [84] | 6.55 [84] | 375.3 [84] | 78.4 [84] | 90.1 [84] | 467.7 [84] | 143.7 [84] | |
| 4.731 [85] | 6.501 [85] | 392.2 [85] | 78.3 [85] | 98.2 [85] | 484.6 [85] | 148.8 [85] | |
| – | – | 351.0 [86] | 84.0 [86] | 73.0 [86] | 461.0 [86] | 123.0 [86] | |
| (NbSi)/(TaSi)—Figure 4a | 4.739 | 6.534 * | 392 | 84 | 99 | 483 | 143 |
| (NbSi)/(TaSi)—Figure 4b | 4.742 | 6.539 * | 390 | 83 | 98 | 479 | 142 |
| (NbSi)/(TaSi)—Figure 3a | 4.745 | 6.543 * | 387 | 82 | 96 | 475 | 142 |
| (NbSi)/(TaSi)—Figure 4c | 4.745 | 6.543 * | 387 | 82 | 96 | 476 | 142 |
| (NbSi)/(TaSi)—Figure 4d | 4.745 | 6.543 * | 388 | 82 | 96 | 476 | 142 |
| (NbSi)/(TaSi)—Figure 4e | 4.748 | 6.547 * | 385 | 81 | 95 | 472 | 142 |
| (NbSi)/(TaSi)—Figure 4f | 4.751 | 6.551 * | 383 | 80 | 94 | 469 | 141 |
| NbSi | 4.754 | 6.555 | 380 | 79 | 92 | 465 | 141 |
| 4.79 [84] | 6.59 [84] | 380.2 [84] | 75.9 [84] | 88.3 [84] | 468.0 [84] | 145.3 [84] | |
| 4.747 [85] | 6.529 [85] | 378.9 [85] | 73.0 [85] | 90.2 [85] | 462.5 [85] | 144.6 [85] | |
| – | – | 344.0 [86] | 85.0 [86] | 69.0 [86] | 456.0 [86] | 115.0 [86] |
Table 3.
Calculated elastic constants of FeAl/Fe-Al nanocomposites with the stacking along (and the interfaces perpendicular to) the [001] direction. The nanocomposites are visualized in Figure 6.
Table 3.
Calculated elastic constants of FeAl/Fe-Al nanocomposites with the stacking along (and the interfaces perpendicular to) the [001] direction. The nanocomposites are visualized in Figure 6.
| Variant | |||||||||
|---|---|---|---|---|---|---|---|---|---|
| (GPa) | (GPa) | (GPa) | (GPa) | (GPa) | (GPa) | (GPa) | (GPa) | (GPa) | |
| FeAl/Fe-Al Figure 6a | 188 | 143 | 134 | 201 | 139 | 199 | 120 | 126 | 124 |
| FeAl/Fe-Al Figure 6b | 186 | 134 | 142 | 185 | 141 | 199 | 123 | 123 | 123 |
| FeAl/Fe-Al Figure 6c | 197 | 146 | 145 | 196 | 145 | 184 | 129 | 129 | 124 |
| FeAl/Fe-Al Figure 6d | 200 | 151 | 143 | 199 | 143 | 200 | 125 | 125 | 122 |
| FeAl/Fe-Al Figure 6e | 183 | 135 | 138 | 189 | 136 | 202 | 117 | 124 | 123 |
| FeAl/Fe-Al Figure 6f | 175 | 141 | 137 | 189 | 145 | 200 | 121 | 126 | 127 |
© 2018 by the authors. Licensee MDPI, Basel, Switzerland. This article is an open access article distributed under the terms and conditions of the Creative Commons Attribution (CC BY) license (http://creativecommons.org/licenses/by/4.0/).
Share and Cite
MDPI and ACS Style
Friák, M.; Holec, D.; Šob, M. Quantum-Mechanical Study of Nanocomposites with Low and Ultra-Low Interface Energies. Nanomaterials 2018, 8, 1057. https://doi.org/10.3390/nano8121057
AMA Style
Friák M, Holec D, Šob M. Quantum-Mechanical Study of Nanocomposites with Low and Ultra-Low Interface Energies. Nanomaterials. 2018; 8(12):1057. https://doi.org/10.3390/nano8121057
Chicago/Turabian StyleFriák, Martin, David Holec, and Mojmír Šob. 2018. "Quantum-Mechanical Study of Nanocomposites with Low and Ultra-Low Interface Energies" Nanomaterials 8, no. 12: 1057. https://doi.org/10.3390/nano8121057
Note that from the first issue of 2016, this journal uses article numbers instead of page numbers. See further details here.