Article

Design, Synthesis, and Structure-Property Relationships of Er3+-Doped TiO2 Luminescent Particles Synthesized by Sol-Gel

1
Dipartimento di Scienza Applicata e Tecnologia (DISAT) and INSTM UdR Torino Politecnico, Politecnico di Torino, Corso Duca degli Abruzzi 24, 10129 Torino, Italy
2
Istituto Superiore Mario Boella, Via P. C. Boggio 61, 10138 Torino, Italy
3
CE.RI.COL., Colorobbia Research Center, Via Pietramarina 53, 50053 Sovigliana-Vinci (FI), Italy
4
Laboratory of Photonics, Tampere University of Technology, Korkeakoulunkatu 3, 33720 Tampere, Finland
5
nLIGHT Corporation, Sorronrinne 9, 08500 Lohja, Finland
6
IFN–CNR, CSMFO Lab., Via alla Cascata 56/C, 38123 Povo (TN), Italy
*
Author to whom correspondence should be addressed.
Nanomaterials 2018, 8(1), 20; https://doi.org/10.3390/nano8010020
Submission received: 31 October 2017 / Revised: 22 December 2017 / Accepted: 28 December 2017 / Published: 2 January 2018

Abstract

:
Titania particles doped with various concentrations of Erbium were synthesized by the sol-gel method followed by different heat treatments. The shape and the grain growth of the particles were noticeably affected by the concentration of Erbium and the heat treatment conditions. An infrared emission at 1530 nm, as well as green and red up-conversion emissions at 550 and 670 nm, were observed under excitation at 976 nm from all of the synthesized particles. The emission spectra and lifetime values appeared to be strongly influenced by the presence of the different crystalline phases. This work presents important guidelines for the synthesis of functional Er3+-doped titania particles with controlled and tailored spectroscopic properties for photonic applications.

Graphical Abstract

1. Introduction

Titania (TiO2) is one of the most intensively studied materials owing to a series of interesting properties, such as its semiconducting behavior, low toxicity, biocompatibility, high chemical stability, and simple and economic production [1,2,3]. All these features enable TiO2 to be used in a wide range of application fields, such as biomedicine, photocatalysis, and photoluminescence [4,5,6].
TiO2 also shows the remarkable capability to host dopants able to modify its properties. In particular, its low phonon energy (<700 cm−1) reduces multiphonon relaxation, thus increasing the efficiency of the luminescent processes [7,8]. Indeed, the luminescence of Er3+ ions at 1540 nm makes Er3+-doped TiO2 systems suitable for optical planar waveguides, lasers, and fiber amplifiers for telecommunications [8,9,10,11]. In addition, red and green up-conversion emissions [12,13] make it a promising material for an even broader range of applications, such as photovoltaics, display technologies, medical diagnostics, and solid state lasers [14,15,16,17].
The properties of a bulk material are significantly different with respect to the ones exhibited by the micro-/nano-particles [17,18,19]. Among the different synthesis methods employed for the fabrication of the TiO2 particles, the sol-gel synthesis method has been demonstrated to allow a reliable and precise control of particle size and morphology [20,21,22,23]. The incorporation of rare-earth ions into the TiO2 nano-particles has drawn noticeable interest in recent times, demonstrating the potential of this type of material [24,25]. Despite the intense research efforts, a careful analysis of the effects of Er3+ doping on the TiO2 particles properties is still lacking. Alongside this, a deeper investigation of the main factors affecting the luminescence of those particles, such as their crystalline structure and the presence of hydroxyl ions, is needed.
The presence of OH– in the structure of the material is a major inconvenience which dramatically affects its luminescence properties. A heat treatment is usually performed to remove water and hydroxyl groups (Ti–OH) and thus to achieve an increase of its lifetime values and an improvement of its fluorescence properties [26]. For the different temperatures, three regimes can be distinguished. At calcination temperatures lower than 600 °C, the OH– is desorbed after the heat treatment but partial rehydration of the sample can still occur, thus leading to a decrease in the luminescence properties [27]. For treatments at temperatures between 800 and 1000 °C, the quenching phenomena are reduced by the removal of OH– but they are still present due to the different crystalline phases and concentrations of the Er3+ ions in the TiO2 matrix [28]. Full decomposition of hydroxyl groups can be achieved by a heat treatment at ~1000 °C, although the crystalline phases obtained are rutile and pyrochlore (Er2Ti2O7), which are detrimental for the luminescence properties [29]. The anatase to rutile phase transition usually occurs in the range 600–1000 °C [30,31], while at temperatures between 800 and 1000 °C [8,32] and at high concentrations of Er3+ (7.5 mol% Er2O3 [33]), the pyrochlore phase (Er2Ti2O7) starts to appear. This last compound has been reported to strongly affect the luminescence, giving very short lifetime values (<<1 ms) that have been related to the quenching caused by the high concentration of Er3+ ions [28].
In this paper, a systematic study on TiO2 micro-/nano-particles synthesized by sol-gel and doped with different concentrations of Er2O3 (0.5, 2, 5, 10, and 14.3 mol%) is reported. To remove the hydroxyl groups and control the crystalline structure of the particles, calcination temperatures ranging between 700 and 1000 °C were employed. The morphological, structural, and luminescence properties of the TiO2 particles, as a function of the calcination temperature and the concentration of Er2O3, are thoroughly investigated.

2. Results and Discussion

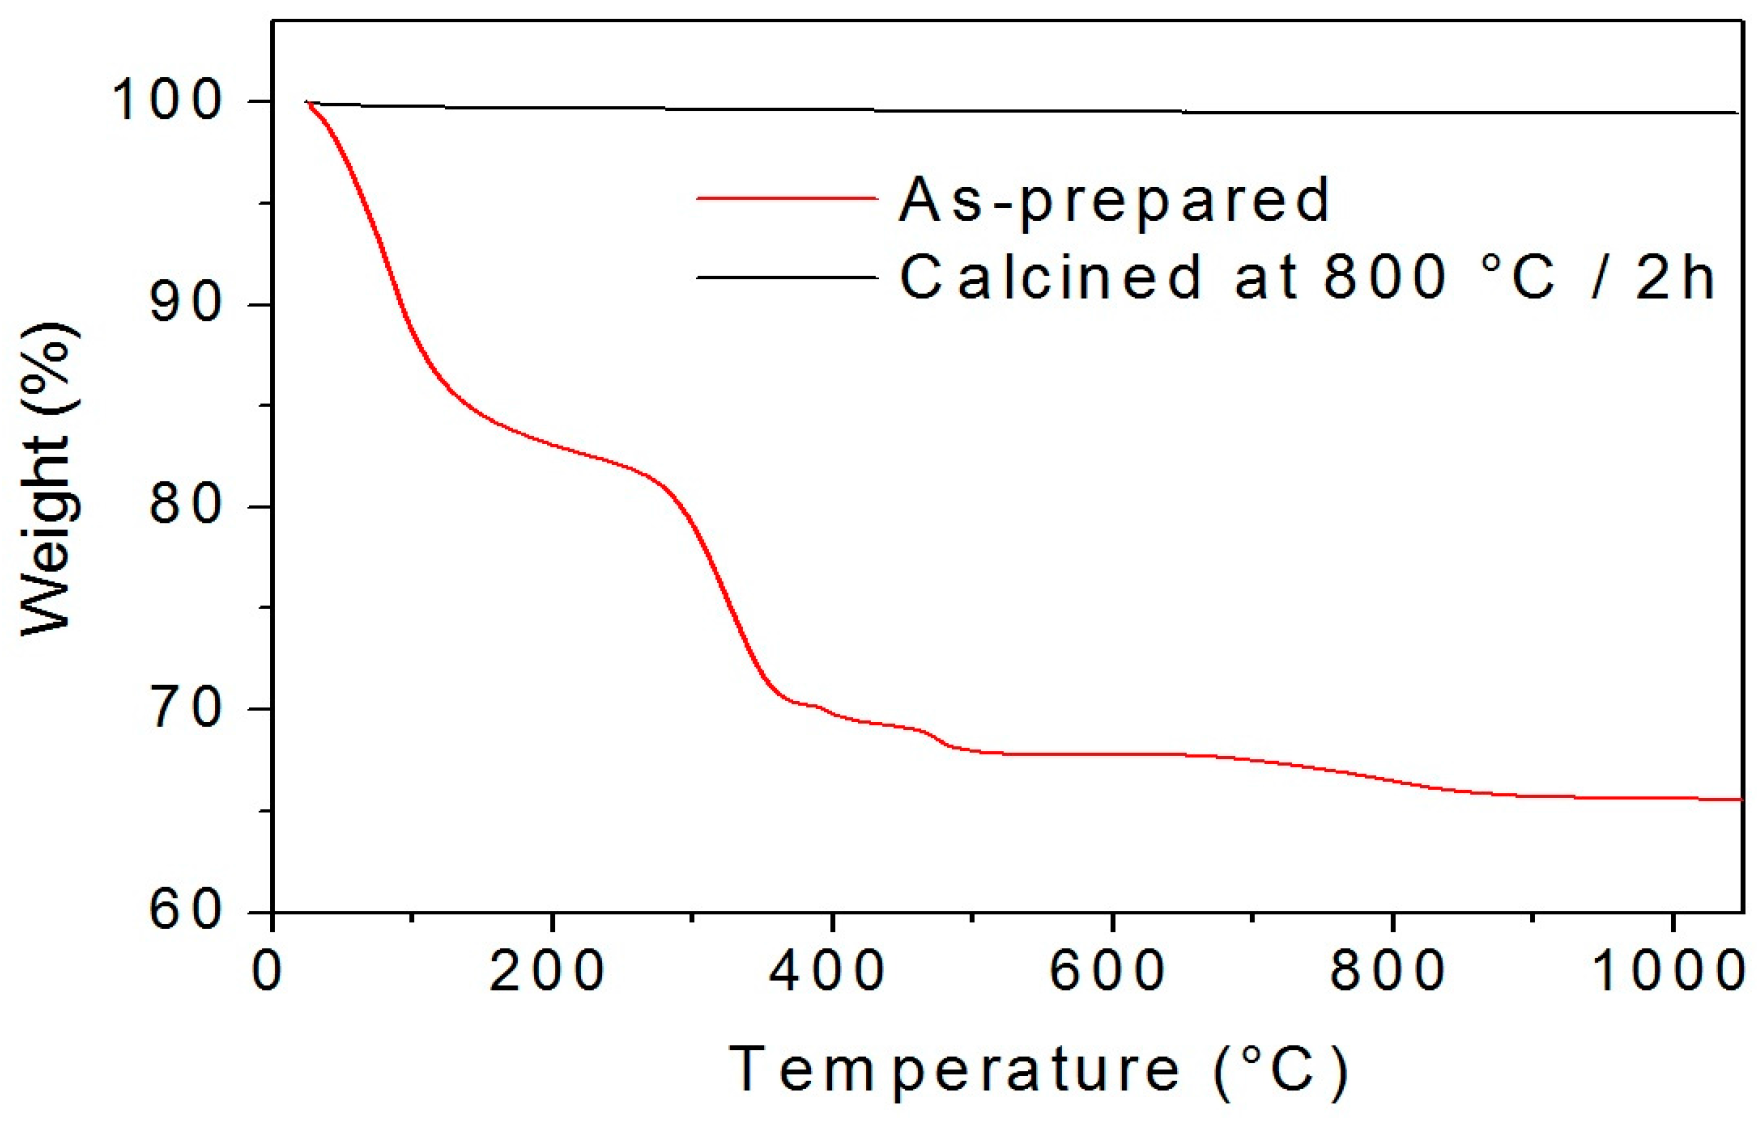
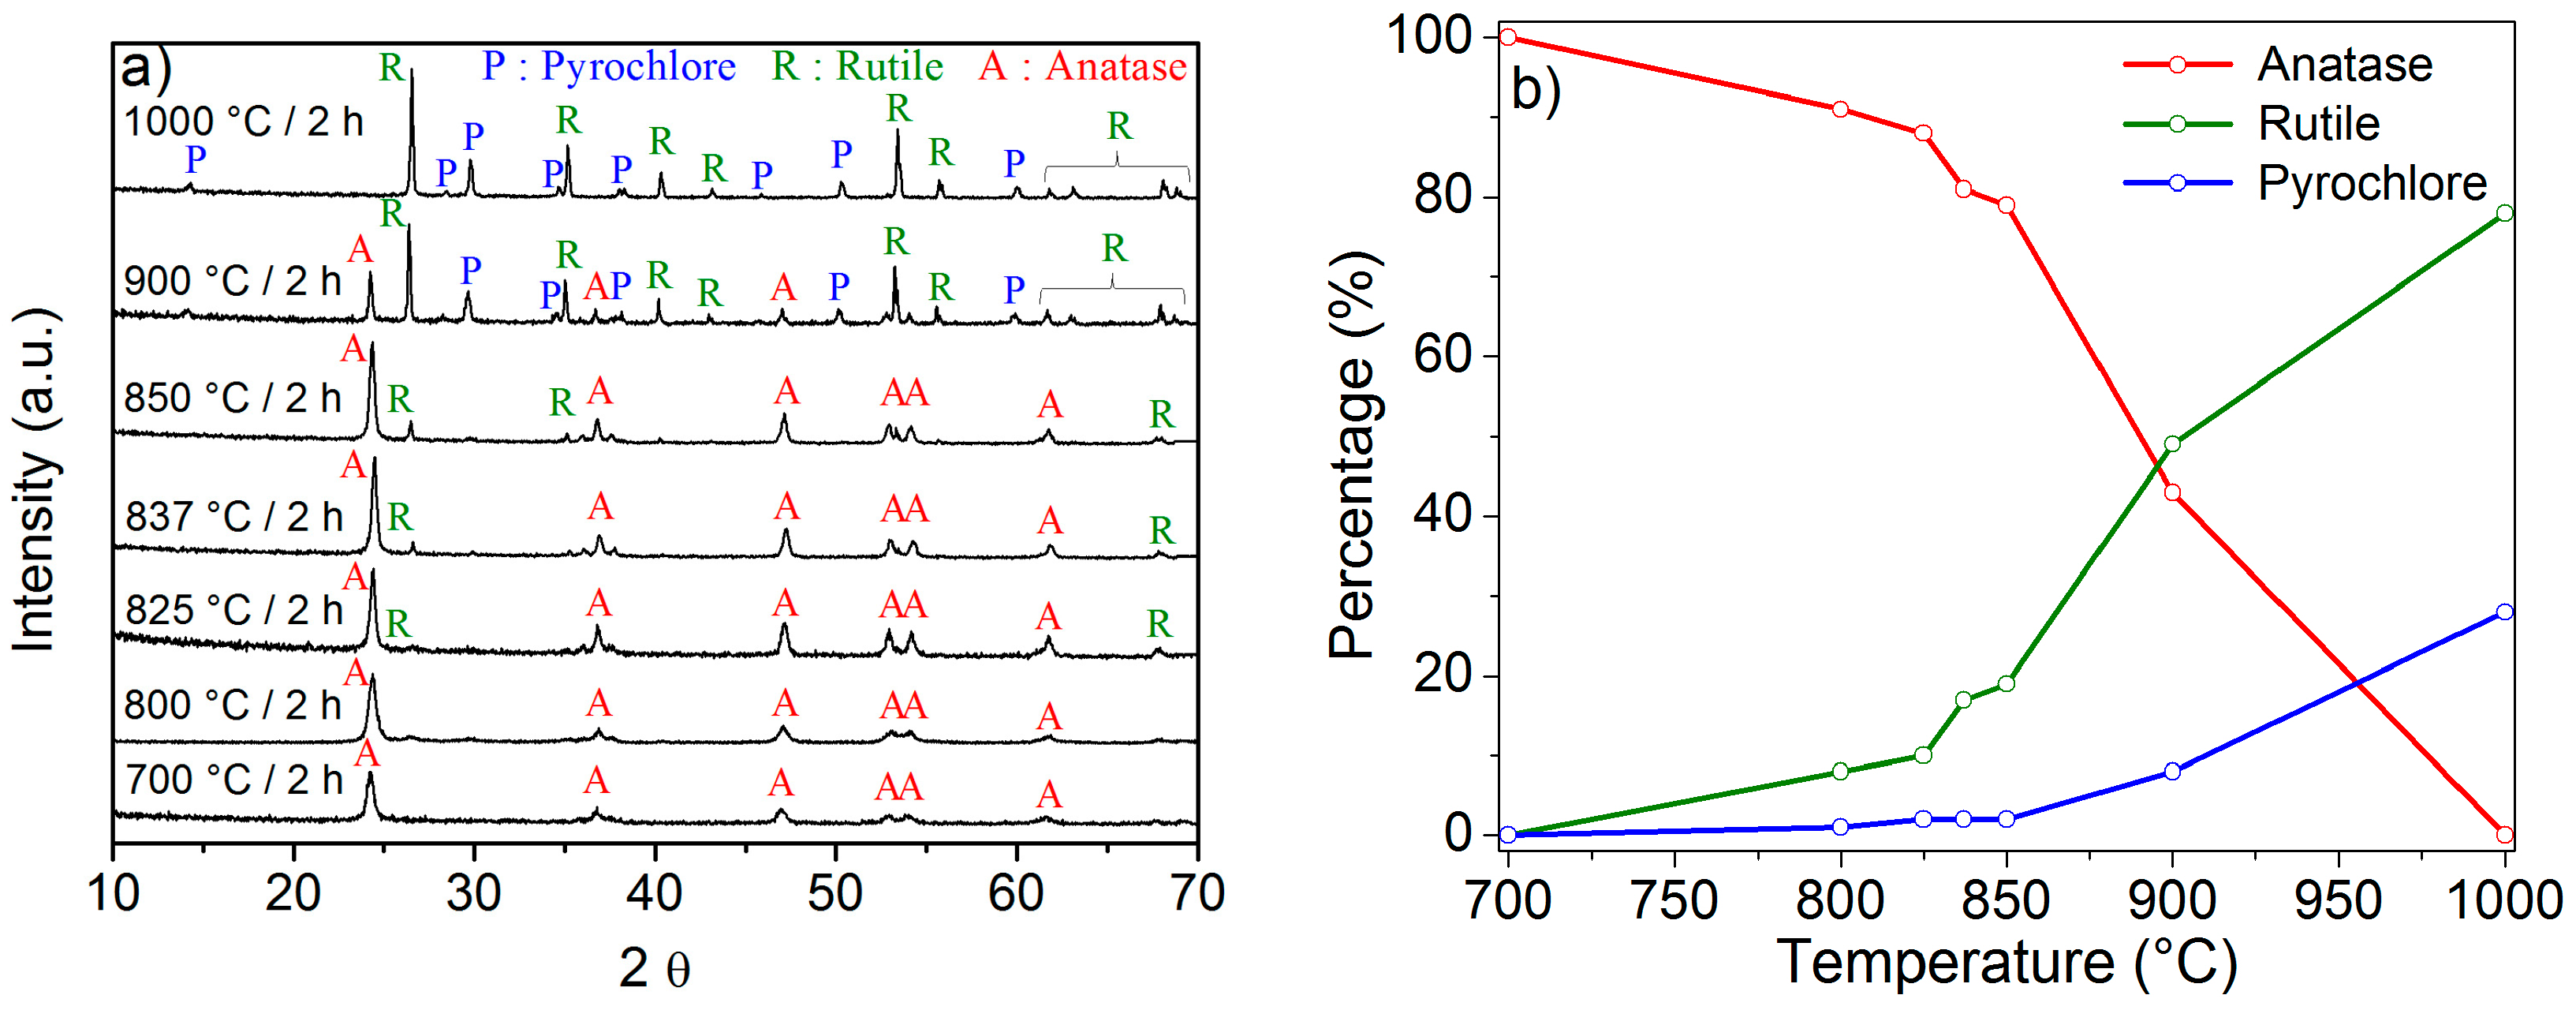
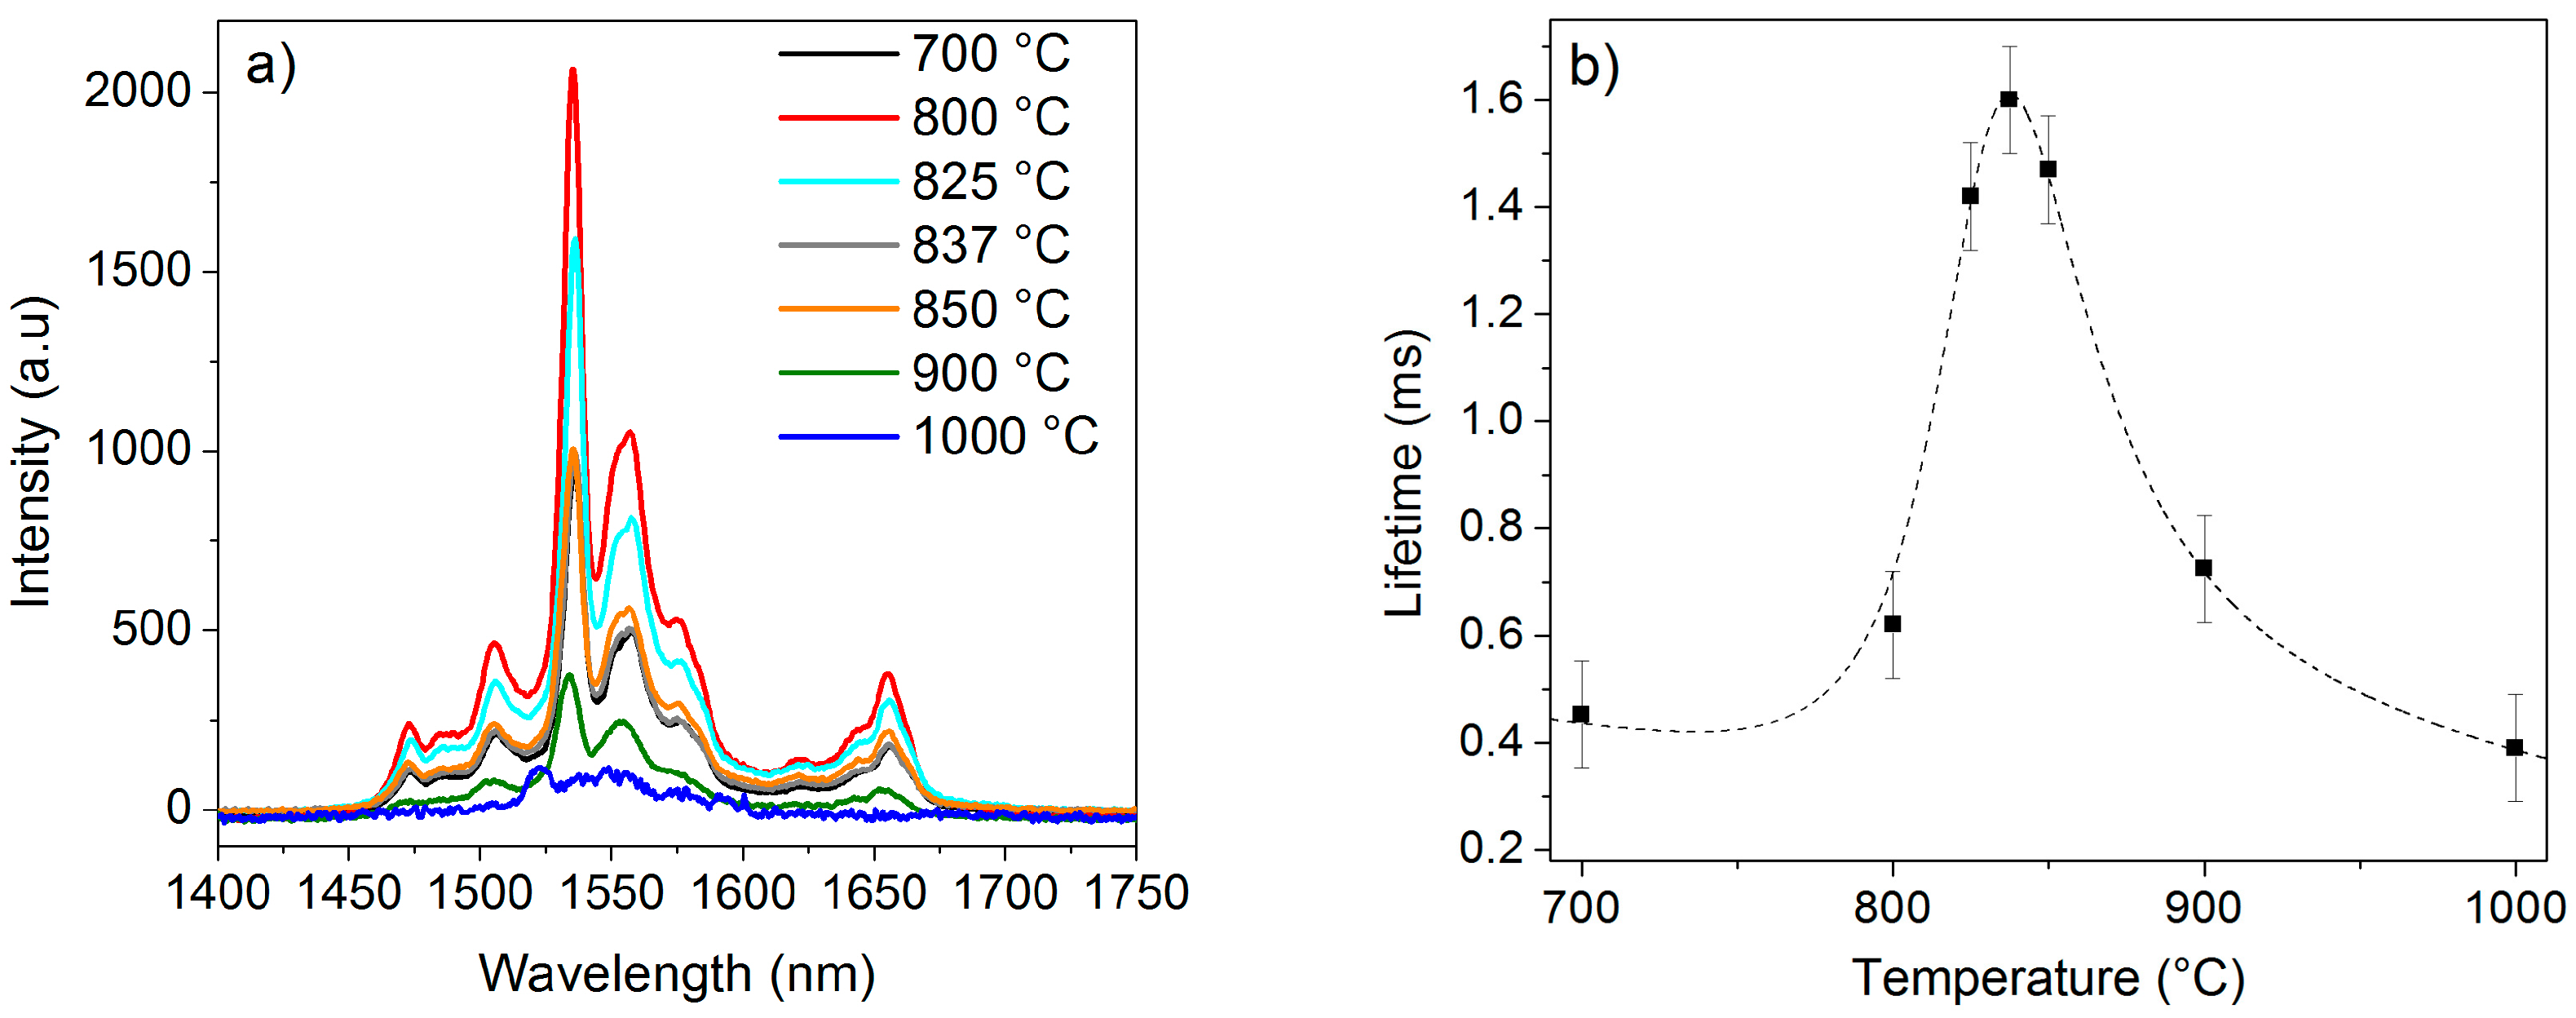
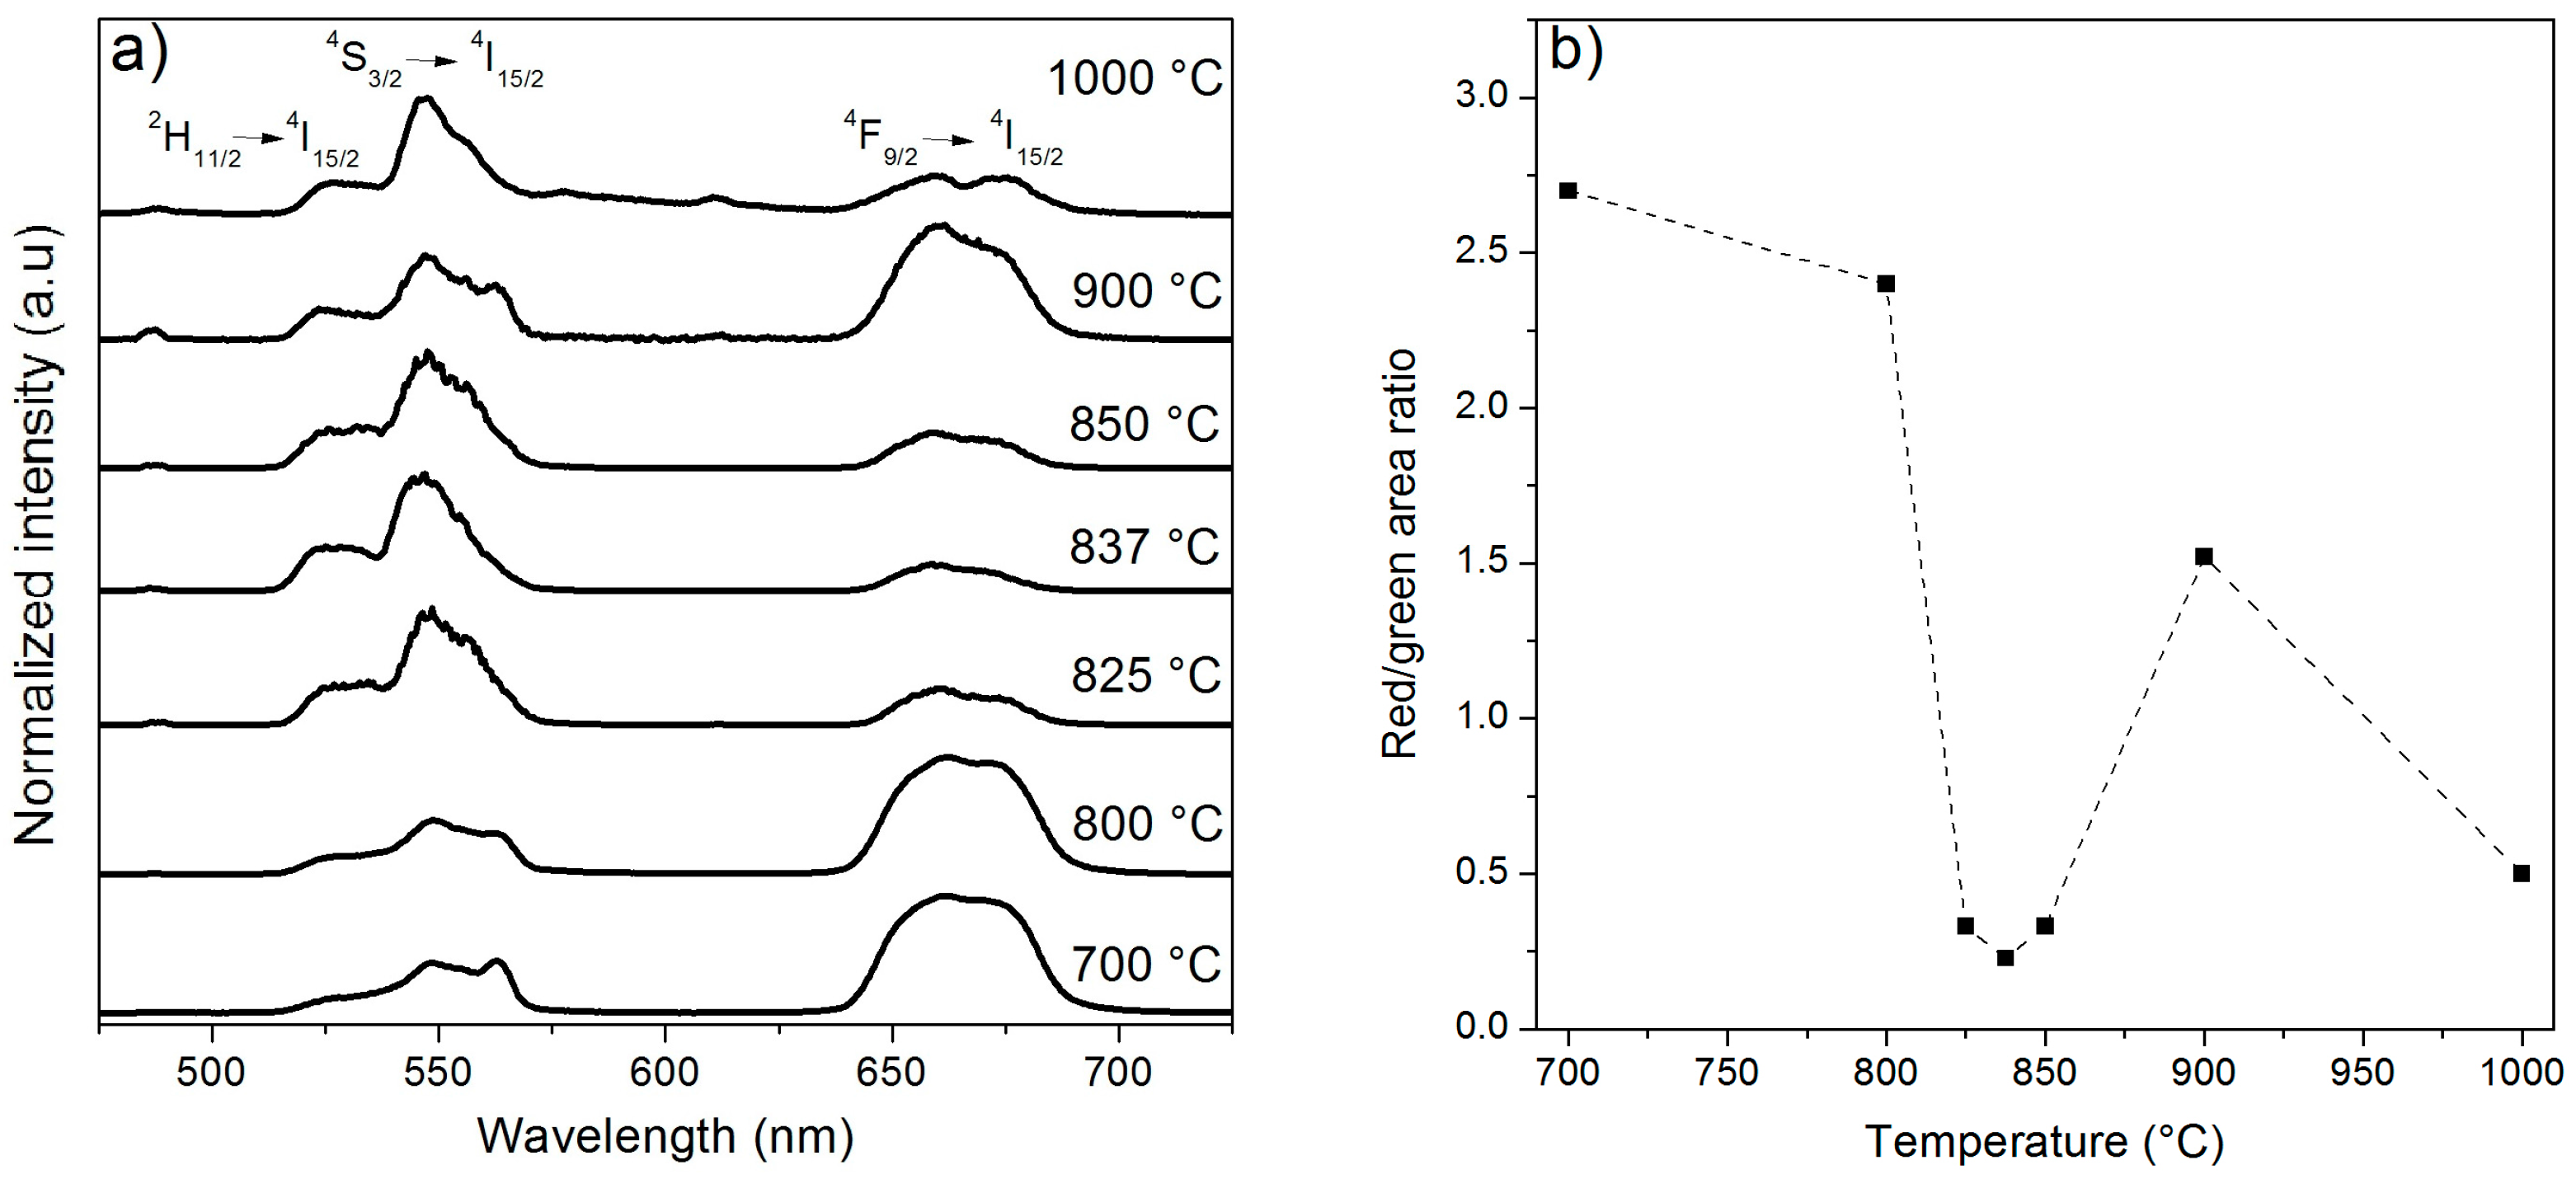
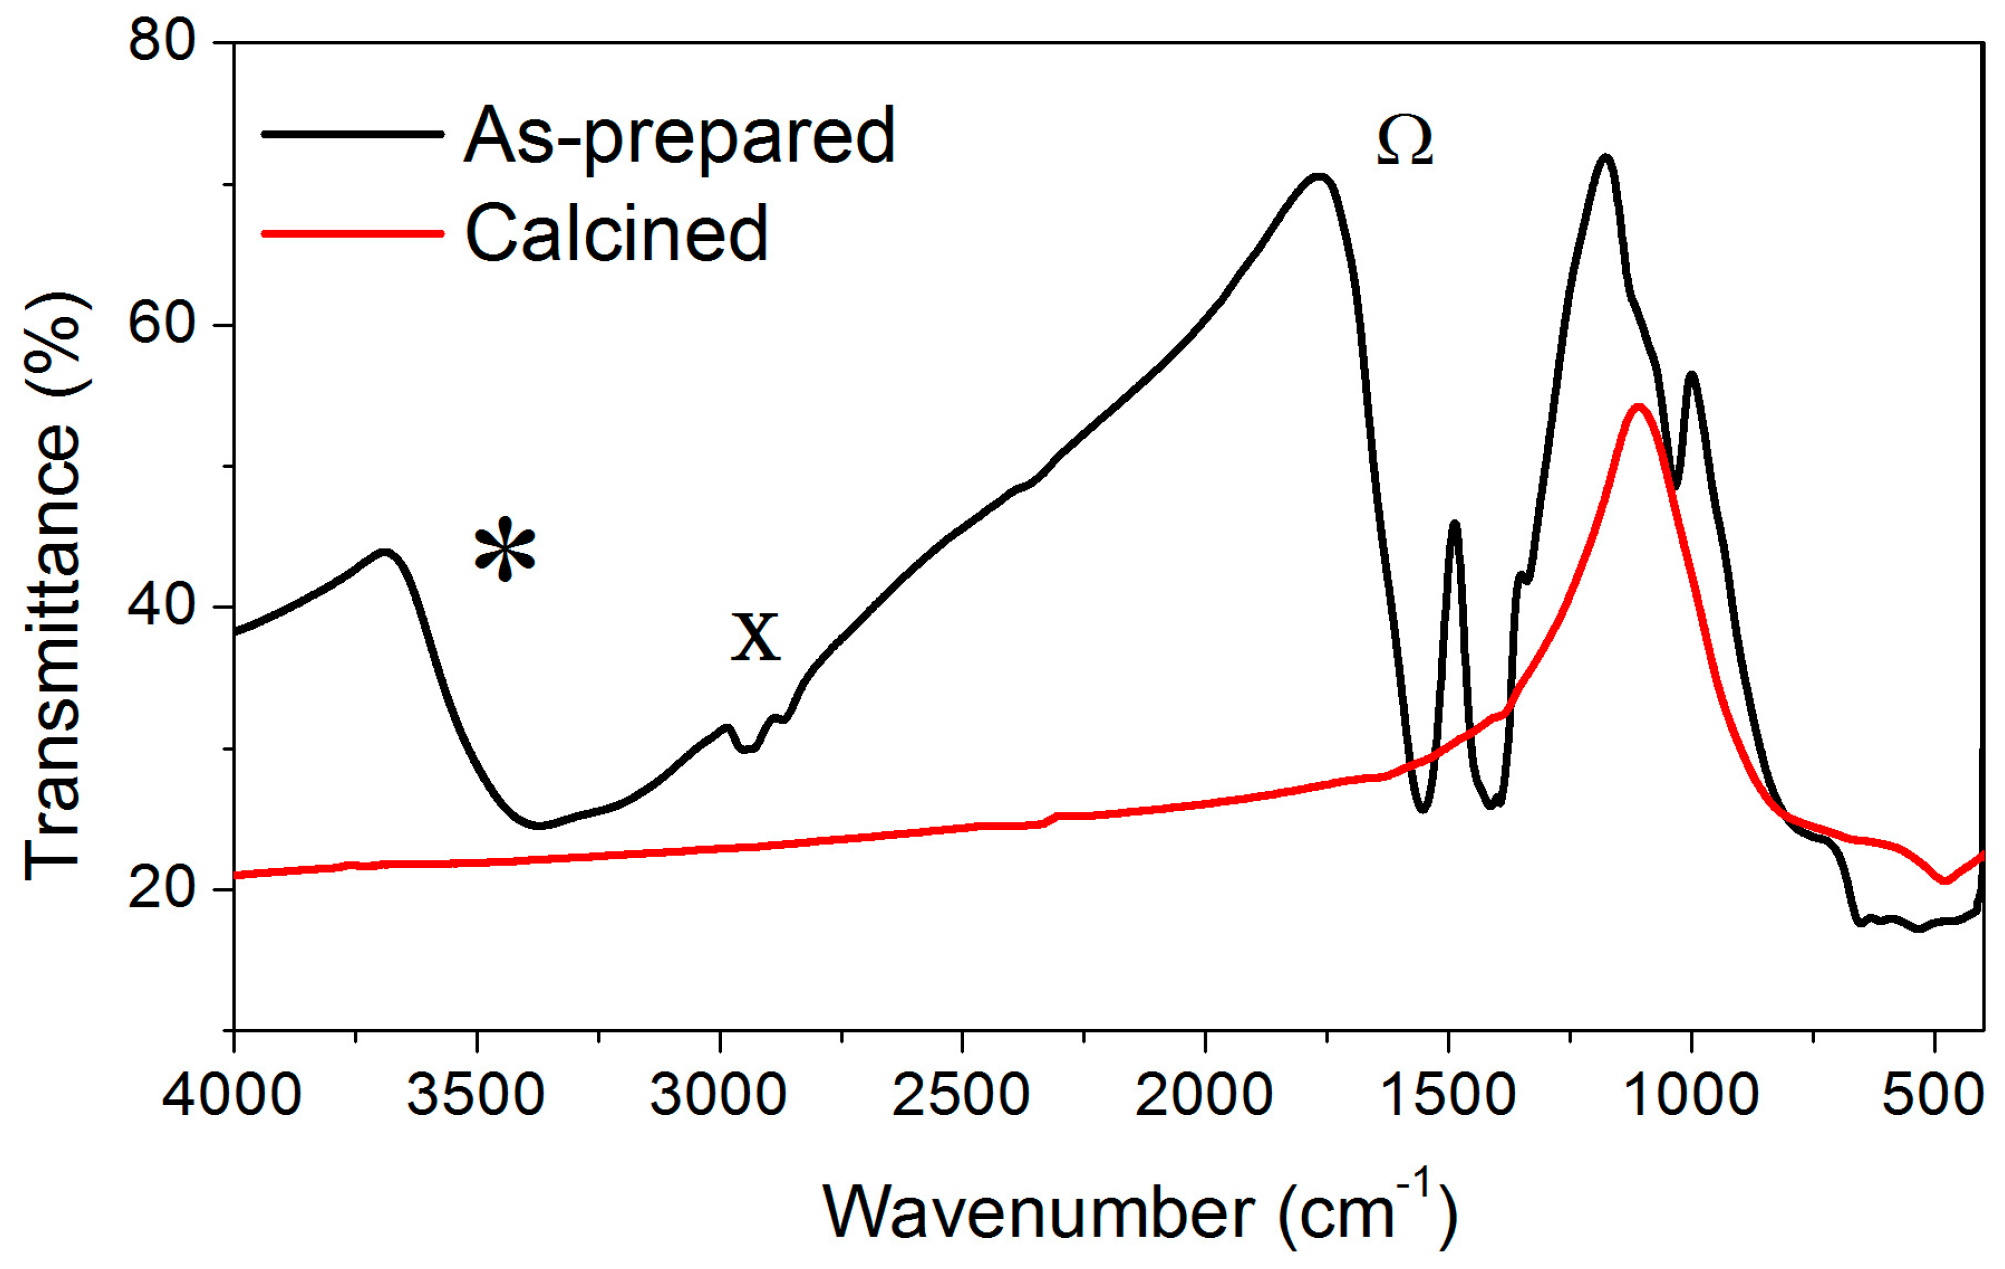
2.1. Effect of the Calcination Temperature on the Morphological, Structural, and Luminescence Properties of the TiO2 Particles

TiO2 powders synthesized by the sol-gel method typically result in an amorphous or poorly crystallized material. For this reason, an additional calcination step is required in order to control their crystallinity and to remove the luminescence quenching hydroxyl groups and organic residues. A thermogravimetric analysis (TGA) was performed on the synthesized particles to quantify the weight loss as a function of the temperature, and the results for the 2 mol% Er2O3-doped TiO2 particles as-prepared and calcined at 800 °C for 2 h are reported in Figure 1.
The curve of the as-prepared sample in Figure 1 shows several weight losses in the range between 300 and 500 °C, which could be ascribed to the removal of nitrates and acetates that are residuals from the synthesis. Additionally, the TGA curve highlights the different stages of the water removal, showing that almost no weight losses occur at temperatures higher than 850 °C. These results were confirmed by the TGA analysis performed on the same sample after calcination at 800 °C for 2 h (see Figure 1), where a weight loss of less than 0.6% was observed. Following these results, the investigation of the morphological, structural, and luminescence properties of the TiO2 particles doped with different Er3+ concentrations was carried out with the samples calcined from 700 to 1000 °C for 2 h, a range for which no presence of H2O is expected.
The crystalline phases of the TiO2 particles calcined at different temperatures were identified by X-Ray Diffraction (XRD) and labelled according to the Inorganic Crystal Structure Database (ICSD) (see Figure 2a). The diffraction patterns showed the crystallographic peaks of anatase (ICSD file No. 00-021-1272) [34], rutile (ICSD file No. 00-021-1276) [34], and pyrochlore (ICSD file No. 01-073-1647).
The decrease of the Full Width at Half Maximum (FWHM) values along with an increase in the calcination temperature clearly shows that the crystallinity of the samples greatly enhanced while increasing the temperature, in agreement with [35]. The phase composition of the samples was semi-quantitatively assessed using the Reference Intensity Ratio (RIR) method. The percentages of the anatase, rutile, and pyrochlore phases present in the TiO2 samples are shown in Figure 2b.
The XRD pattern of the sample calcined at 700 °C shows only the anatase phase. The anatase to rutile phase transformation and the Er2Ti2O7 phase started to appear at 800 °C. In the case of the TiO2 particles calcined at 900 °C, the three phases are simultaneously present, being the rutile the major one. Lastly, at 1000 °C, the pyrochlore and rutile phases are the prominent ones. It should be pointed out that no peaks related to the Er2O3 were observed in the XRD measurements of all the calcined powders. From Figure 2a,b, it is clear that the phase composition of the particles can be tuned by varying the calcination temperature.
The Field Emission-Scanning Electron Microscope (FE-SEM) pictures of the 2 mol% Er2O3-doped TiO2 particles prior to and after the calcination at the different temperatures are shown in Figure 3.
All the particles exhibited approximately the same spherical size, ranging from 1.3 to 1.6 μm, independently of the heat treatment, and kept their spherical shape in all the cases. Interestingly, the increase in the calcination temperature led to the growth of the crystallite size. Indeed, the texture on the particles is formed by nano-grains similar in size to those observed by Patra et al. [36]. These nano-grains possess a dimension of around 40, 50, and 60 nm for samples calcined at 700, 800, and 900 °C, respectively, while a diameter of 200 nm is reached at a calcination temperature of 1000 °C (see Figure 3).
The photoluminescence properties of the 2 mol% Er2O3-doped TiO2 particles were investigated in the infrared region under an excitation wavelength of 976 nm. Figure 4a shows the fluorescence emission spectra of the aforementioned particles heat treated at different temperatures. The emission intensities were compared in this case due to the similar particles shape and the same composition of the samples.
The emission spectra corresponding to the Er3+:4I13/24I15/2 radiative transition show an emission band structured into different lines, with a main sharp peak centered at 1530 nm. An intense emission was observed from the sample calcined at 800 °C, whereas the samples heat treated at 900 and 1000 °C displayed a lower emission intensity.
Figure 4b shows the lifetime values of the 2 mol% Er2O3-doped TiO2 particles calcined at different temperatures. The lifetime values of the Er3+:4I13/2 level in the TiO2 particles calcined at 700, 800, 825, 837, 850, 900, and 1000 °C for 2 h were 0.45, 0.62, 1.42, 1.60, 1.47, 0.73, and 0.39 ms, respectively, within the accuracy of the measurement (±0.10 ms). The dependence of the lifetime on the calcination temperature could be explained by the presence of the pyrochlore phase and the reduction of the anatase phase in the particles. Surprisingly, the samples calcined at 825, 837, and 850 °C are characterized by the highest lifetime value, even though the pyrochlore phase is present in their structure (see Figure 2a,b). Nonetheless, the emission intensities of the samples heat treated at 825, 837, and 850 °C are clearly weaker than the one exhibited by the sample calcined at 800 °C (see Figure 4a). Unlike the anatase phase, the rutile phase is known to reduce the luminescence of Er3+ ions [37,38]. The simultaneous presence of the rutile and pyrochlore phases in the samples calcined at 825, 837, and 850 °C might thus cause a decrease in the emission intensity. In light of all these considerations, it may be concluded that the co-presence of anatase and rutile phases in the crystalline structure is essential for an optimal emission in the infrared region.
The normalized up-conversion fluorescence spectra of the Er3+-doped TiO2 particles calcined at different temperatures are shown in Figure 5a.
The excitation wavelength of 976 nm induced a transition from the ground state, 4I15/2, to the excited level 4I11/2. Afterwards, another transition from 4I11/2 to 4F7/2 occurred. The 4F7/2 state decayed non-radiatively to the 2H11/2, 4S3/2, and 4F9/2 levels. The green emission was observed in the wavelength ranges 520–535 and 535–575 nm due to the radiative transitions from the 2H11/2 and 4S3/2 levels to the ground state, respectively. In addition, the transition from the 4F9/2 state produced a red emission in the range 640–700 nm. As shown in Figure 5a, the up-conversion emission spectra of the TiO2 particles calcined at 700 and 800 °C show a similar shape, and both exhibit a high intensity ratio of the red/green emissions (Figure 5b). This ratio decreased at higher calcination temperatures, being the samples calcined at 825, 837, and 850 °C the ones with the lowest red emission. Interestingly, Patra et al. [36] obtained the maximum up-conversion emission intensity with Er3+-doped TiO2 particles calcined at 800 °C, when both the anatase and the rutile phases were present. In our case, the samples calcined at 700 and 800 °C possessed the highest intensity ratio of the red/green emissions, whereas at higher temperatures the ratio considerably diminished, probably due to the presence of the pyrochlore phase.
Therefore, since the sample calcined at 800 °C showed a relatively high emission in the infrared, as well as no weight loss after the calcination, the effect of the Er3+ ions concentration on the properties of the synthesized TiO2 particles was studied only for the samples calcined at that temperature.

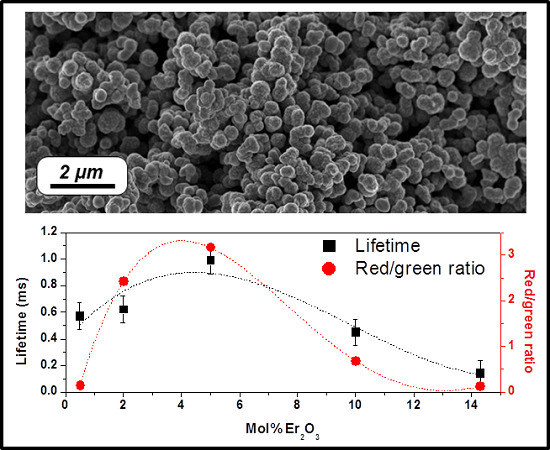
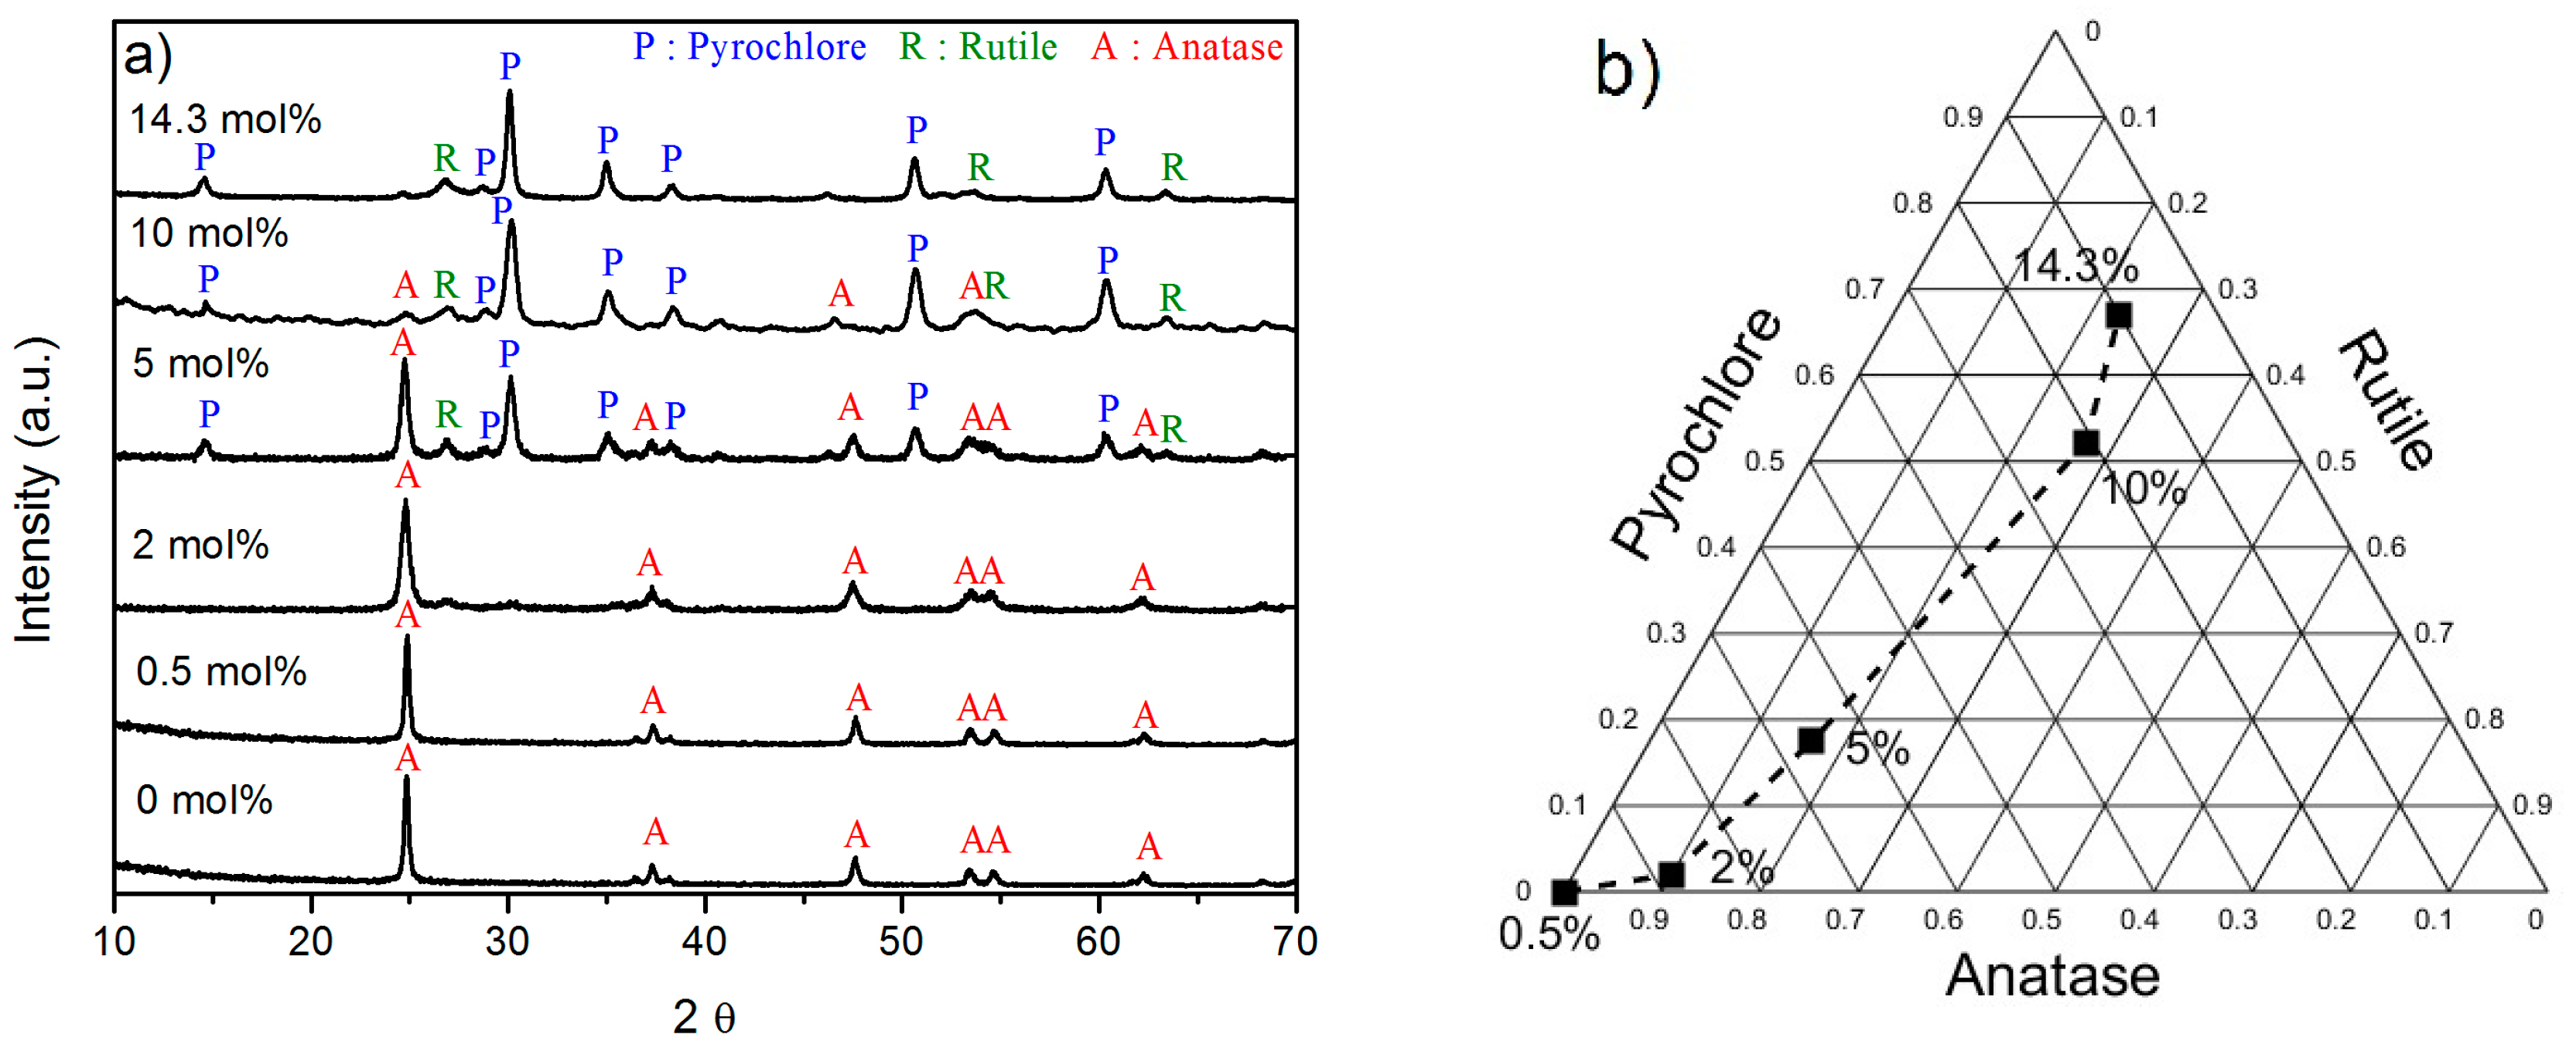
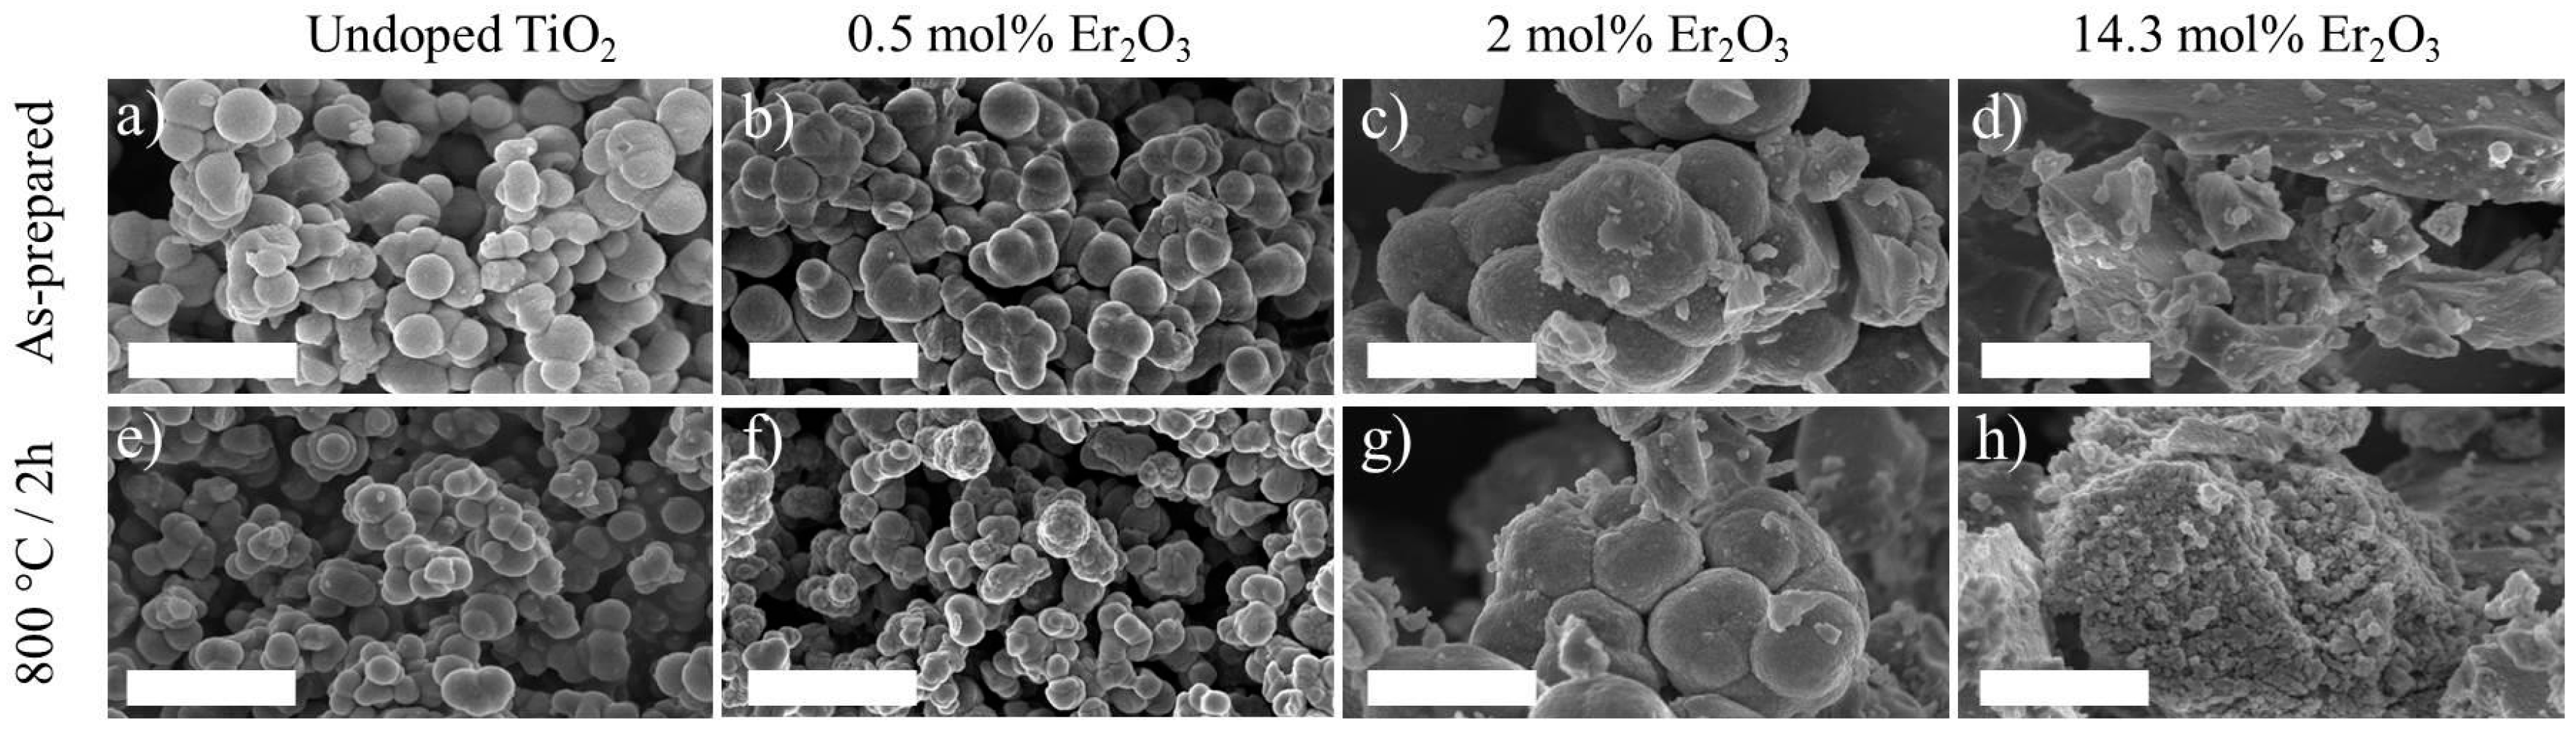
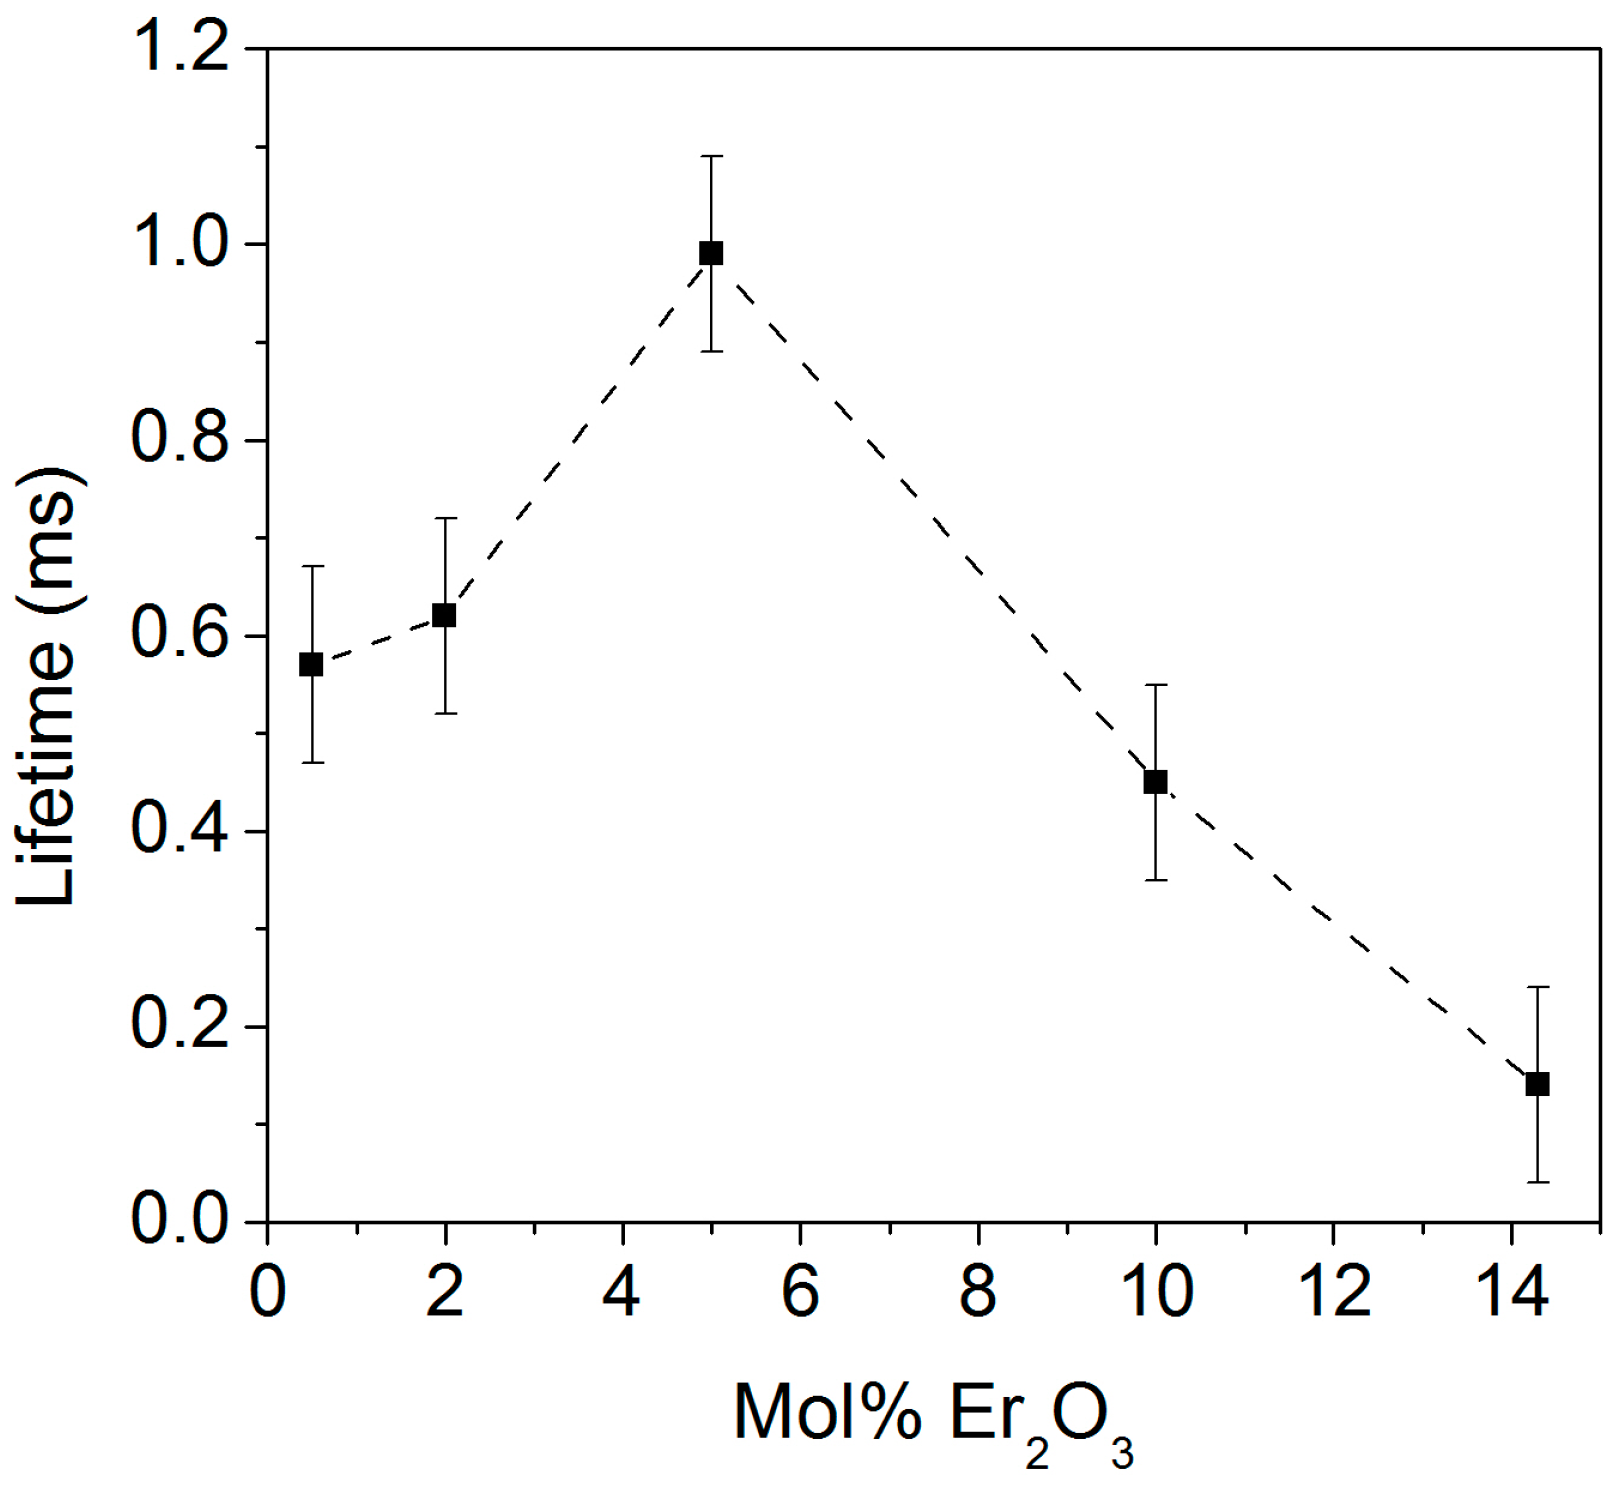
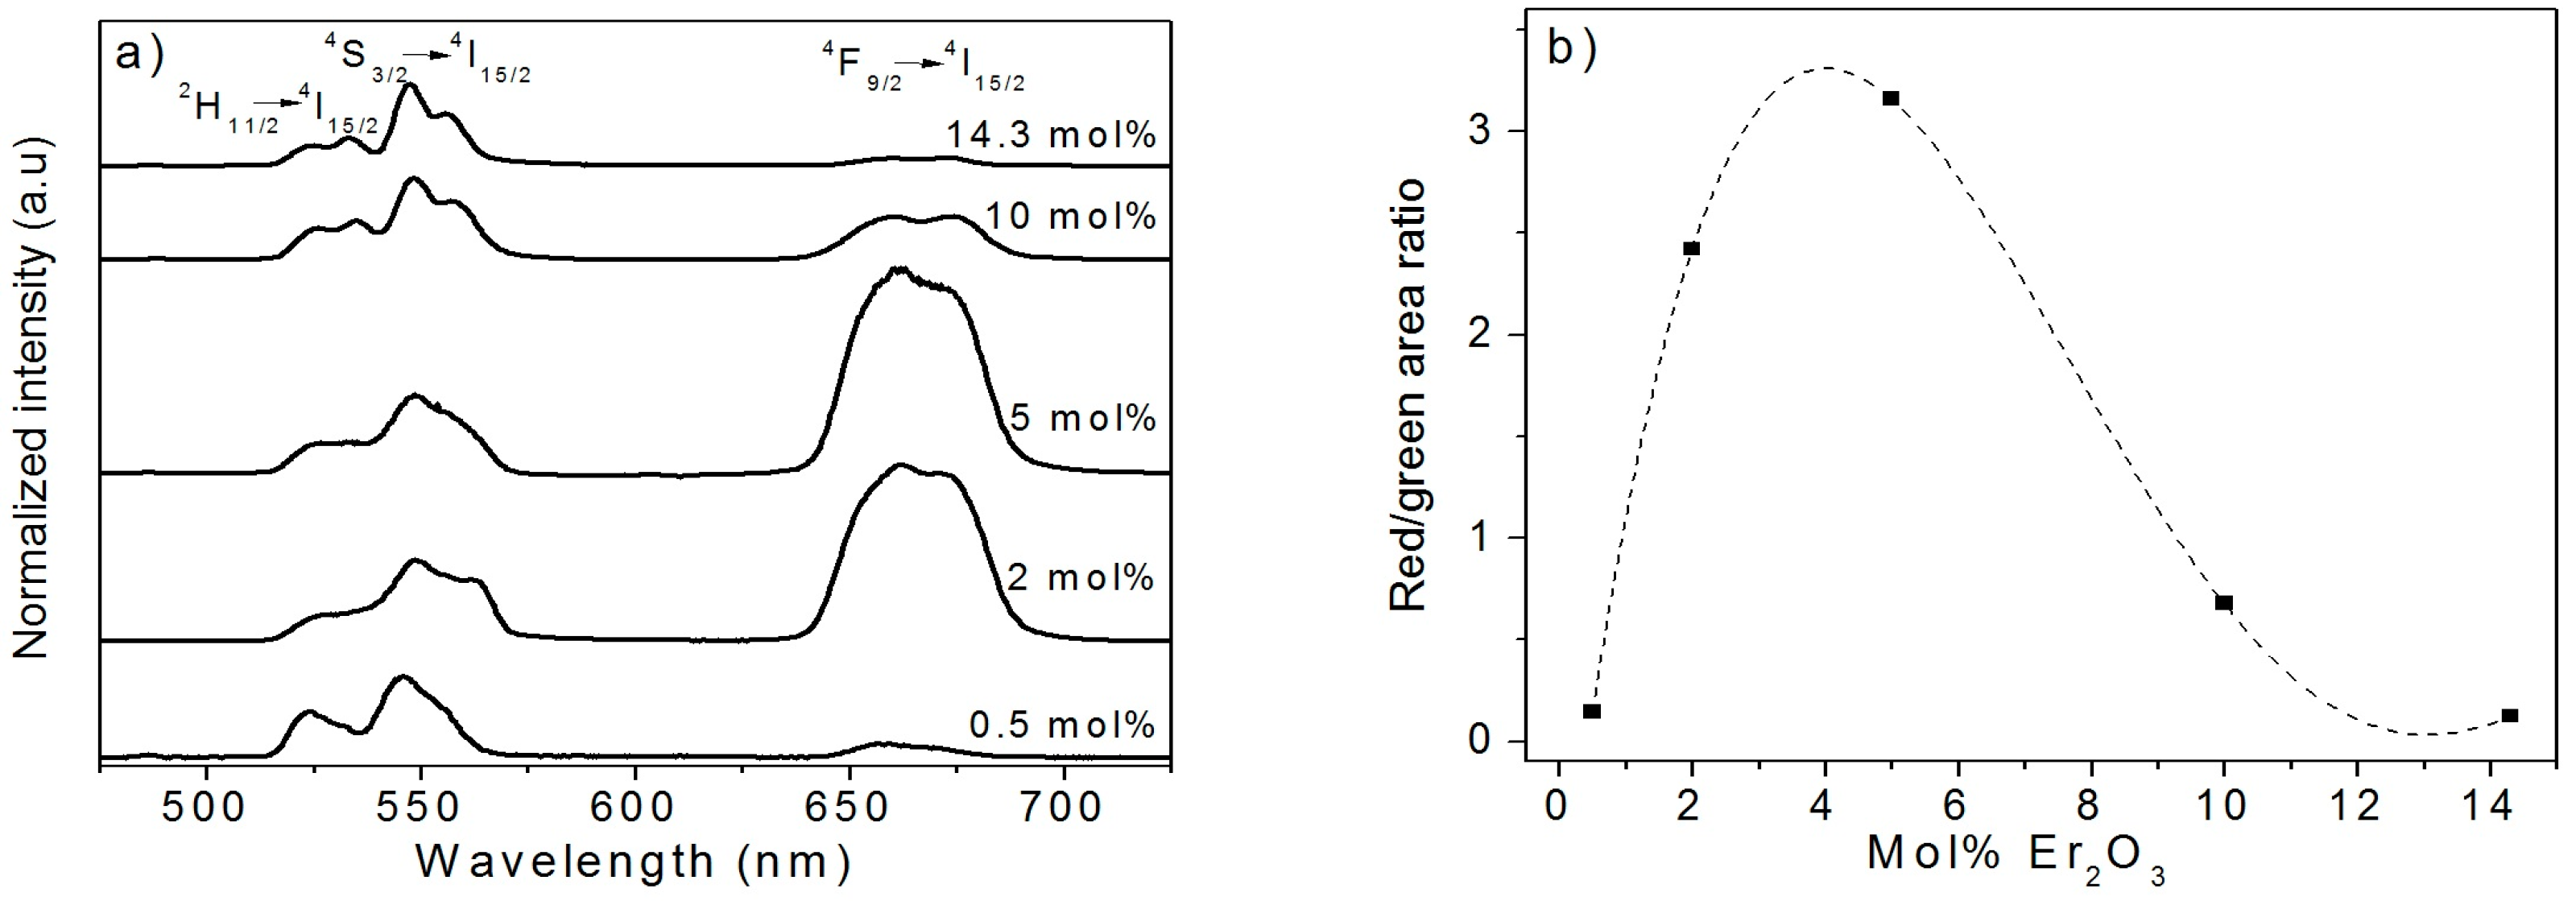
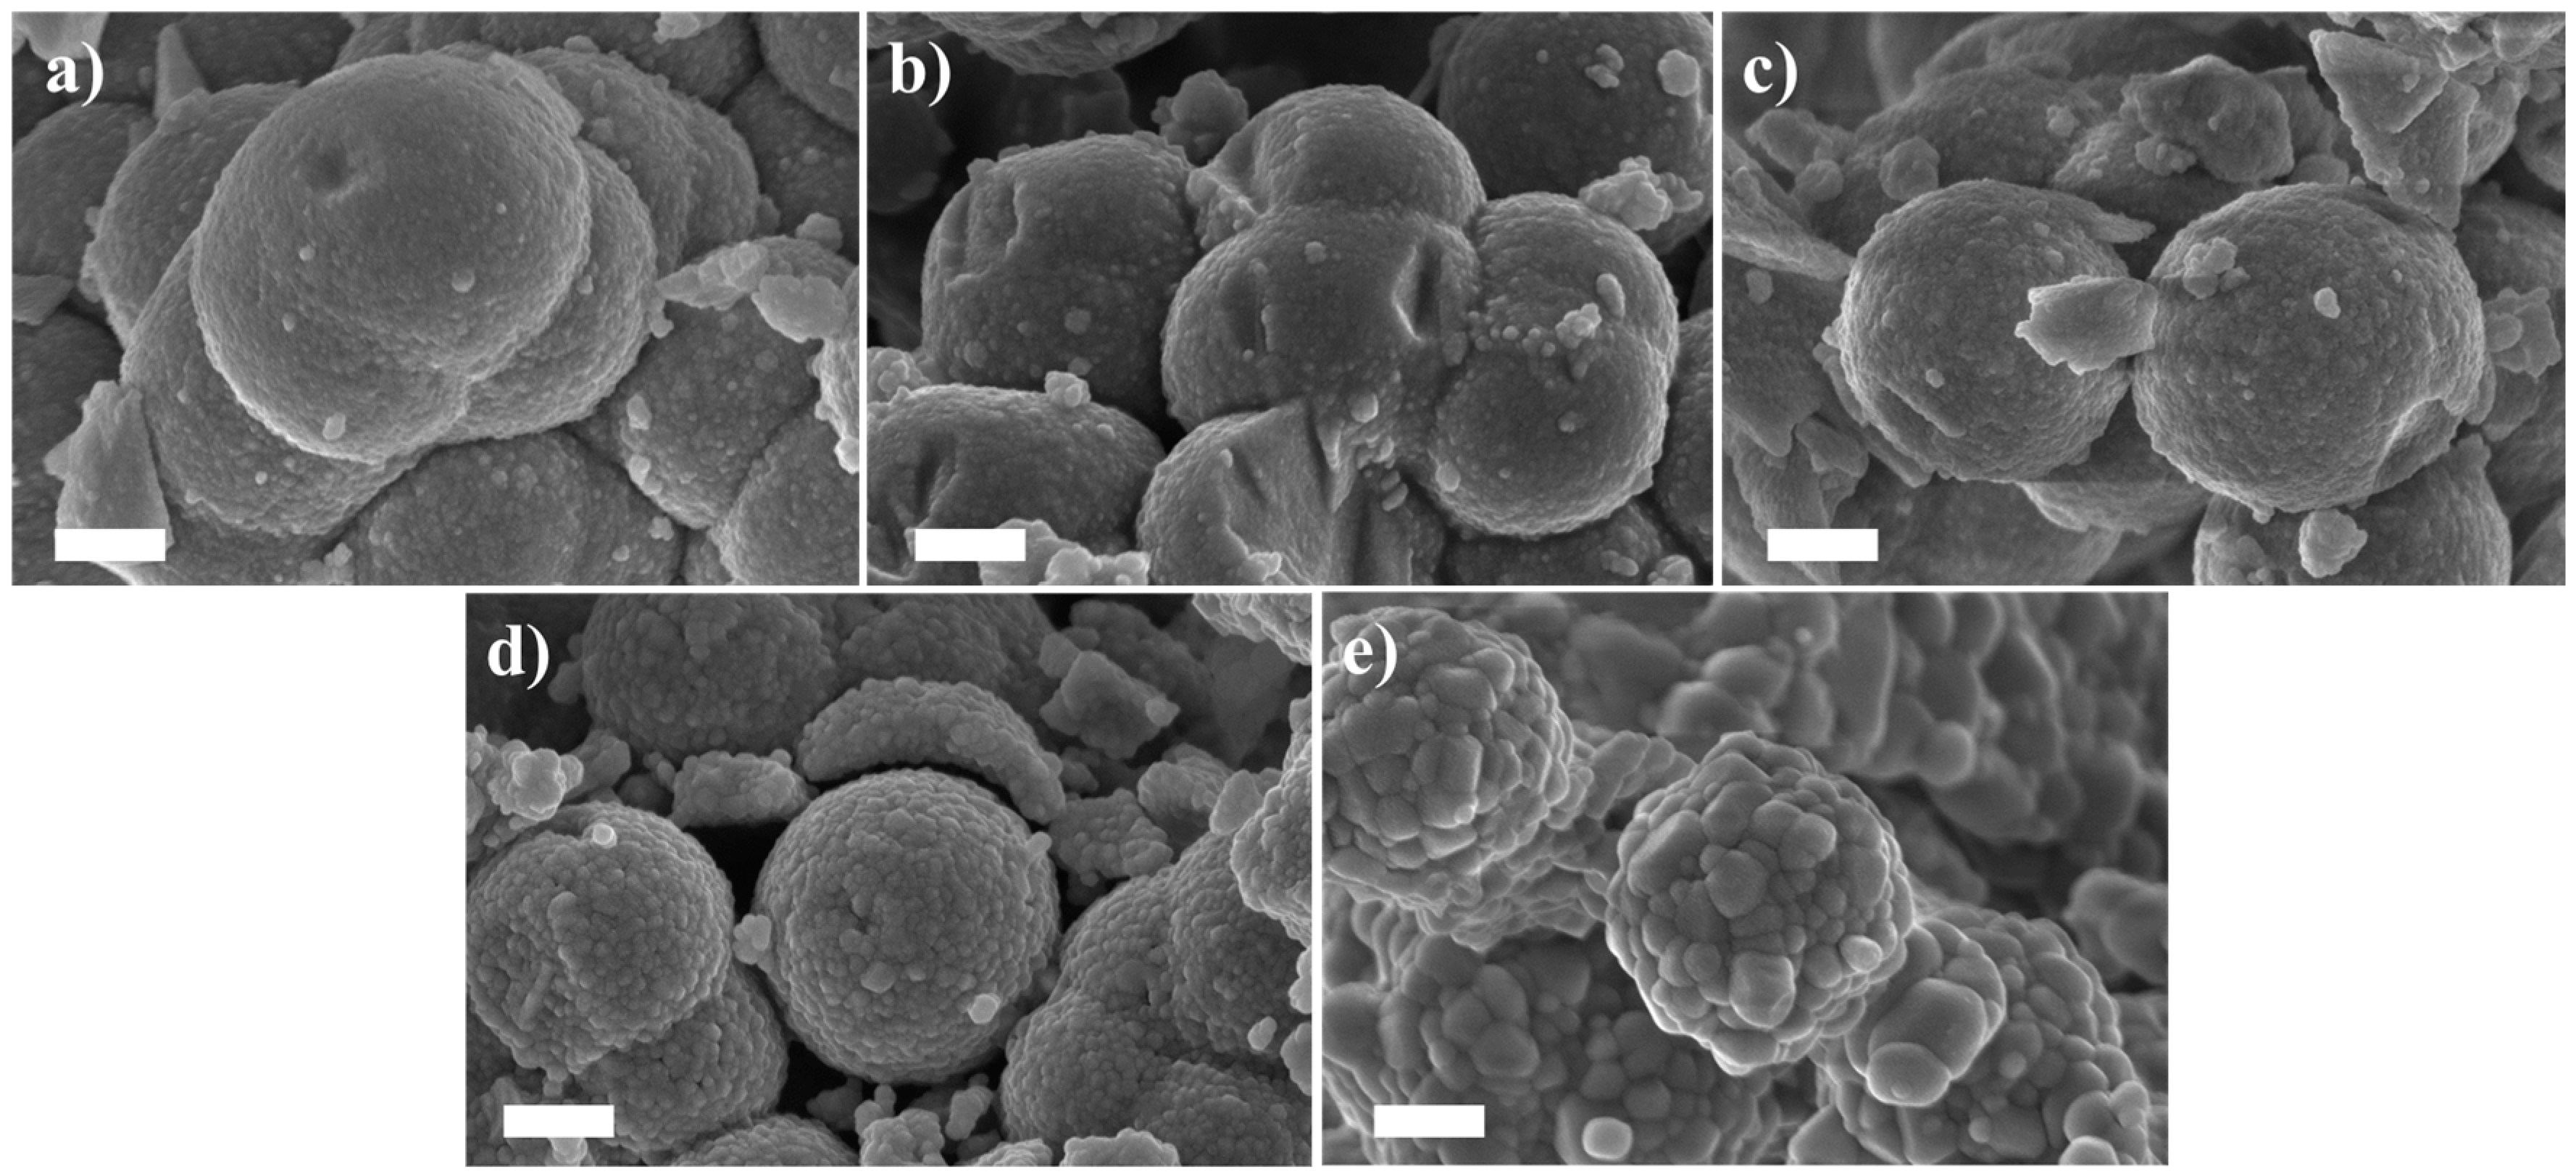
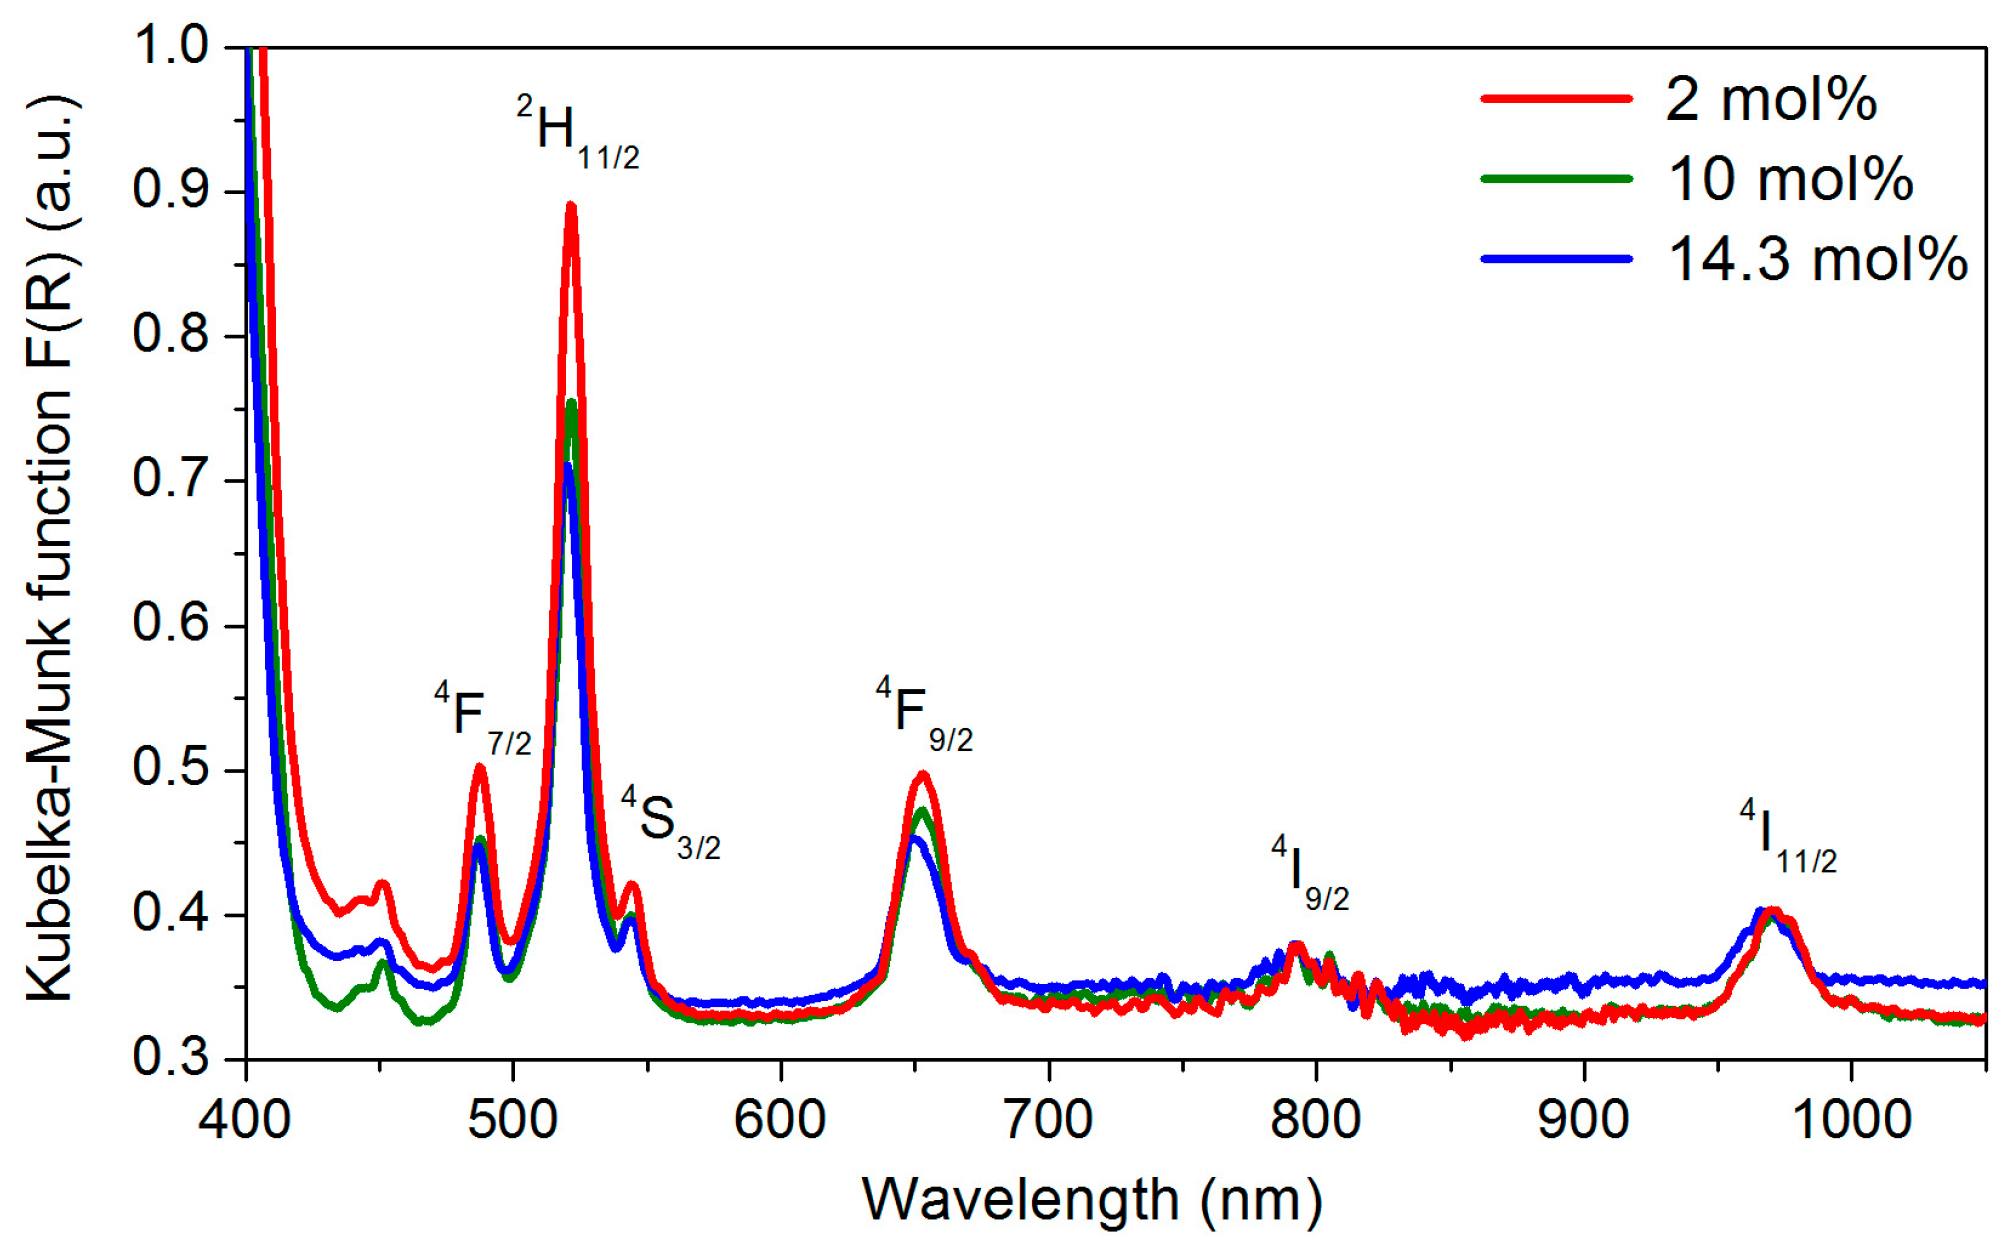
2.2. Effect of the Concentration of Er2O3 on the Morphological, Structural, and Luminescence Properties of the TiO2 Particles

In order to check the possible presence of water in the calcined samples, the Fourier Transform-Infrared Spectroscopy (FT-IR) spectra of the 5 mol% Er2O3-doped TiO2 particles as-prepared and calcined at 800 °C for 2 h were compared in Figure 6. As can be clearly observed from the image, the typical absorption bands located at 1630, 2840, and 3430 cm−1 corresponding to the O–H bending vibrations, surface adsorbed water and hydroxyl groups [39], respectively, were only present in the as-prepared sample, while no presence of water was observed for the calcined sample. Similar results were obtained for the rest of the samples doped with different concentrations of Er2O3 (data not shown). Therefore, in agreement with the TGA analysis reported in Figure 1, the presence of water in the samples calcined at temperatures higher than 800 °C can be considered negligible.
Figure 7a shows the XRD patterns of the TiO2 particles calcined at 800 °C for 2 h both undoped and doped with different content of Er2O3. The phase composition of the samples was semi-quantitatively calculated using the RIR method. The ternary diagram showing the proportion of the crystalline phases present in the TiO2 samples doped with different concentrations of Er2O3 is shown in Figure 7b.
The undoped and the 0.5 mol% Er2O3-doped samples show the typical XRD pattern of the anatase TiO2. At higher concentrations of Er2O3, anatase, rutile, and pyrochlore phases are simultaneously present: at a concentration of 2 mol% the anatase phase is predominant, whereas at 5 mol% the anatase and pyrochlore phases are the prominent ones. At 10 and 14.3 mol%, the major phase seems to be the pyrochlore. Therefore, the addition of Er3+ ions into the TiO2 matrix seems to retard the anatase to rutile phase transformation. Besides, as reported in [40], the limited solubility of the Er3+ ions into the TiO2 matrix led to the formation of the pyrochlore phase, which tends to co-exist with the rutile phase. As evidenced in previous studies [33], the Er2O3 phase was not detected in the XRD measurements even with high concentrations of Er3+ in TiO2 sol-gel particles.
Figure 8 depicts the FE-SEM micrographs of the undoped and 0.5, 2, and 14.3 mol% Er2O3-doped TiO2 particles both as-prepared and calcined at 800 °C for 2 h.
The morphology of the particles changed when increasing the concentration of Er2O3. The undoped and 0.5 and 2 mol% Er2O3-doped particles resulted to be spherical, whereas for the higher Er2O3 concentration of 14.3 mol% the particles formed irregular-shaped aggregates. At the same time, the diameter of the spherical particles increased from 500 nm to 1.4 µm as the Er2O3 concentration raised from 0 to 2 mol% Er2O3. This might be caused by the difference in the ionic radii of Er3+ and Ti4+ ions. Indeed, the ionic radii of the Er3+ ions for coordination numbers equal to 6 and 8 are 0.89 and 1 Å, respectively, whereas the one of Ti4+ is 0.61 Å [41]. Consistently, the Er3+ doping affects the crystalline lattice of the anatase phase modifying the particles morphology [42]. Moreover, in agreement with the results of the XRD analysis previously reported, an increase in the Er3+ ions content inhibits the growth of the TiO2 anatase phase while increasing the rutile phase and eventually forming the pyrochlore compound. The reduction of the growth of the anatase phase and the change in the morphology of the particles with the addition of Er3+ is consistent with other studies [26,43].
Figure 9 shows the Kubelka–Munk function of the TiO2 particles doped with three different concentrations of Er3+ and subsequently calcined at 800 °C for 2 h. The spectra exhibit several absorption bands characteristic of the Er3+ ion 4f-4f transitions from the ground state to various excited levels [10,44]. A broad absorption band peaked at 972 nm, corresponding to the 4I15/24I11/2 transition, can be observed. In addition, as reported in [45], the onset of the absorption spectra appears at around 400 nm, which corresponds to the anatase and rutile band gaps of 3.2 and 3.0 eV, respectively [46].
Figure 10 shows the normalized emission spectra centered at around 1550 nm of the TiO2 particles doped with five different concentrations of Er3+ and subsequently calcined at 800 °C for 2 h. It should be pointed out that the intensity of the emission spectra cannot be compared due to the different morphology of the samples, although their shape gives valuable information on the particles properties.
The shape of the emission spectrum is preserved for all the samples except for the ones doped with 10 and 14.3 mol% of Er2O3, where the 4I13/2 to 4I15/2 transition peak becomes broader most probably due to the presence of the pyrochlore phase. These results are in agreement with those reported in previous studies [8], where a broadening of the peak at 1530 nm was observed for Er3+ doping concentrations as high as 10 and 15 mol%. Interestingly, the 10 mol% Er2O3-doped TiO2 particles showed the broadest spectrum, possibly due to the co-existence of the anatase and pyrochlore phases.
The fluorescence lifetime values corresponding to the intra-4f transition from 4I13/2 to 4I15/2 are shown in Figure 11. The lifetimes of the TiO2 particles doped with 0.5, 2, 5, 10, and 14.3 mol% of Er2O3 and calcined at 800 °C for 2 h were 0.57, 0.62, 0.99, 0.45, and 0.14 ms (±0.10 ms), respectively.
It is well-known from the literature that at high concentrations of Er2O3 the distance between the Er3+ ions lessens, thus leading to the formation of Er3+ clusters and so to shorter lifetime values [47]. Surprisingly, the 5 mol% Er2O3-doped TiO2 particles exhibited the highest lifetime. For this concentration, both the rutile and pyrochlore phases are present, together with the anatase phase. The presence of rutile and pyrochlore phases is thought to decrease the amount of Er3+ ions in the anatase phase, thus causing an increase in the radiative emission from the anatase phase as a consequence of the reduction of the quenching inside it.
Figure 12a illustrates the normalized visible up-conversion emission spectra of the Er2O3-doped TiO2 particles excited at 976 nm. The spectra were normalized to 1 at 550 nm (4S3/2 to 4I15/2 transition).
As previously explained, the intensity ratio of the red/green emissions is strictly related to the local environment of the Er3+ ions. Figure 12b shows an increase of the red/green emissions ratio while increasing the concentration of Er2O3 up to 5 mol%. However, for a higher Er2O3 content, the green emission is favored again. At a very low dopant concentration (0.5 mol%), the green emission is stronger than the red one because the 4S3/2 level decays radiatively to 4I15/2. Instead, at 2 and 5 mol% of Er2O3, a strong red emission resulting from the 4F9/2 to the 4I15/2 transition is observed. Patra et al. [36] have reported the increase of the ratio of the red/green emission intensities with the increasing of the Er3+ concentration in TiO2 particles doped with a low content of Er2O3. Besides, the lifetime values of the 4S3/2 level of TiO2 particles can diminish for higher concentrations of Er2O3 as a result of the cross-relaxation processes [48]. However, most of the studies were performed at low concentrations of Er3+, where no presence of the pyrocholore phase was evidenced. Surprisingly, at 10 and 14.3 mol% of Er2O3, the green emission (550 nm) arising from the 4S3/2 to the 4I15/2 transition revealed to be predominant. This strong green emission at high Er3+ levels is thought to be associated with the huge amount of the pyrochlore phase, which enhances the up-conversion in the green.

3. Materials and Methods

The following chemical precursors were used without further purification: tetra (n-butyl) titanate (Alfa Aesar, Haverhill, MA, USA, >99%), erbium acetate (Sigma-Aldrich, St. Louis, MO, USA, >99.9%), and ethanol (Sigma-Aldrich, St. Louis, MO, USA, >99.8%). For the synthesis of 5 g of Er3+-doped TiO2 particles containing 14.3 mol% of Er2O3 and 85.7 mol% of TiO2, 21.3 g of tetra (n-butyl) titanate were dissolved in ethanol (100 mL) and then added dropwise into a mixture of distilled water (2 mL), ethanol (100 mL), and erbium acetate (8.7 g). The process was carried out in a four-neck round-bottom flask equipped with a thermometer, a reflux refrigerator, and a magnetic stirrer. Once the addition had been completed, the precursor solution was heated at a reflux temperature of 90 °C and left under reflux for 1 day. The obtained precipitates were collected by centrifugation, washed with ethanol several times, and dried at 100 °C for 1 day. The as-prepared sample was further annealed in air at 800 °C for 2 h. The same fabrication process was followed for the 0.5, 2, 5, and 10 mol% Er2O3-doped TiO2 particles. The particles doped with 2 mol% of Er2O3 were heat treated in air for 2 h not only at 800 °C, but also at 700, 825, 837, 850, 900, and 1000 °C.
The thermogravimetric analysis (TGA) was performed using a Perkin-Elmer TGS-2 (PerkinElmer Inc., Waltham, MA, USA). The measurement was carried out in a Pt crucible at a heating rate of 10 °C/min, featuring an error of ±3 °C.
The Fourier Transform-Infrared Spectroscopy (FT-IR) spectra of the samples as-prepared and calcined at 800 °C for 2 h were acquired in transmission mode in the wavelength range between 400 and 4000 cm−1 using a Nicolet Is50 FT-IR (Thermo Fisher Scientific Inc., Waltham, MA, USA). The samples were prepared by mixing and pressing the Er-doped titania particles with potassium bromide (KBr) (weight ratio of 1:100) into disks with a thickness of 0.1 mm and a diameter of 1 cm.
The XRD analysis was performed with a PANalytical X’Pert ProMRD diffractometer (PANalytical B.V., Almelo, The Netherlands) with CuKα radiation (λ = 0.15418 nm). Data were collected with a step size of 0.02°. All XRD patterns were analyzed using X’pert HighScore Plus software (PANalytical B.V., Almelo, The Netherlands). The semi-quantitative analysis of the crystalline phases of the samples was performed using the Reference Intensity Ratio (RIR) method [49].
The morphological analysis of the samples was performed by using a Field Emission-Scanning Electron Microscope (FE-SEM, Zeiss Merlin 4248, Oberkochen, Germany) operating at 5 keV.
The optical absorption spectra were measured on the same specimens employed for the FT-IR analysis by Diffuse Reflectance Spectroscopy (DRS) using a Shimadzu UV-2600 UV-Visible (UV-Vis) spectrophotometer (Shimadzu, Kyoto, Japan). The spectra were acquired in the range between 400 and 1050 nm with a step size of 1 nm and by using barium sulfate (BaSO4) as a reference. The Kubelka–Munk function F(R) [50] was used to calculate the absorbance of the samples.
The emission spectra were acquired at room temperature using an excitation monochromatic light at 976 nm, emitted by a single-mode fiber pigtailed laser diode (CM962UF76P-10R, Oclaro Inc., San Jose, CA, USA).
The fluorescence lifetime values of the Er3+:4I13/2 energy level were obtained with laser pulses of the 976 nm laser diode, recording the signal using a digital oscilloscope (Tektronix TDS350, Tektronic Inc., Beaverton, OR, USA) and fitting the decay traces by a single exponential. The estimated error of the measurement was ±0.10 ms. The detector used for this measurement was a Thorlabs PDA10CS-EC (Thorlabs Inc., Newton, NJ, USA). The samples used for both the emission and lifetime measurements were pressed to form flat disks and placed between two transparent pure silica glasses.

4. Conclusions

In conclusion, both undoped and Er2O3-doped TiO2 particles were successfully synthesized by the sol-gel technique and their morphological, structural, and luminescence properties were thoroughly investigated as a function of the calcination temperature and the Er2O3 concentration. The surface roughness and the grain size of the particles were found to increase with the rise in the calcination temperature, while a change in the particles shape from spherical to irregular was observed upon increasing the Er2O3 doping content. Strong fluorescence in the infrared region was exhibited by the particles calcined at temperatures ranging between 800 and 850 °C, while the ones heat treated at 1000 °C showed poor fluorescence properties, thus indicating the presence of luminescence quenching induced by the formation of the pyrochlore (Er2Ti2O7) phase. This crystalline phase plays also an important role in the luminescence of the samples containing different amounts of Er3+ ions. Specifically, the particles doped with 10 and 14.3 mol% of Er2O3 showed a broadening of the emission peak associated to the 4I13/2 to 4I15/2 transition and a strong decrease in the lifetime value corresponding to the same transition. Strong up-conversion luminescence was observed in all the synthesized samples. The intensity ratio of the red/green emissions was found to change as a function of the Er3+ ions concentration and the calcination temperature. The highest values of this ratio were achieved for the particles doped with 2 and 5 mol% of Er2O3 and calcined at 700 and 800 °C for 2 h, respectively. The 5 mol% Er2O3-doped TiO2 particles calcined at 800 °C for 2 h exhibited also quite a high lifetime value corresponding to the intra-4f transition from 4I13/2 to 4I15/2, thus making them promising materials for the fabrication of infrared and up-conversion optical amplifiers and lasers.

Acknowledgments

The research leading to these results has received funding from the European Union’s Horizon 2020 research and innovation programme under the Marie Sklodowska-Curie grant agreement No. 642557. The authors acknowledge the Academy of Finland (Competitive Funding to Strengthen University Research Profiles program (310359), academy project (308558)) and the support from Compagnia di San Paolo through the Starting Grant Program. Politecnico di Torino supported these activities through the Interdepartmental Centre PhotoNext. Finally, the authors would like to acknowledge Mauro Raimondo for his precious assistance in the FE-SEM characterization and Luca Lavagna for his kind help in the TGA analysis.

Author Contributions

Giovanni Baldi, Laeticia Petit, and Daniel Milanese conceived and designed this work. Diego Pugliese supported the experimental activity related both to the synthesis and characterization of the materials. Nadia G. Boetti carried out the spectroscopy measurements. Davide Janner gave advice on the experimental procedures and contributed to the interpretation of the results. Pablo Lopez-Iscoa manufactured the materials and prepared the samples for their characterization. All the authors discussed the results and contributed to the writing of the manuscript.

Conflicts of Interest

The authors declare no conflict of interest. The funding sponsors had no role in the design of the study; in the collection, analyses, or interpretation of data; in the writing of the manuscript and in the decision to publish the results.

References

  1. Yin, Z.F.; Wu, L.; Yang, H.G.; Su, Y.H. Recent progress in biomedical applications of titanium dioxide. Phys. Chem. Chem. Phys. 2013, 15, 4844–4858. [Google Scholar] [CrossRef] [PubMed]
  2. Linsebigler, A.L.; Lu, G.; Yates, J.T. Photocatalysis on TiO2 surfaces: principles, mechanisms, and selected results. Chem. Rev. 1995, 95, 735–758. [Google Scholar] [CrossRef]
  3. Sunada, K.; Watanabe, T.; Hashimoto, K. Studies on photokilling of bacteria on TiO2 thin film. J. Photochem. Photobiol. A 2003, 156, 227–233. [Google Scholar] [CrossRef]
  4. Vasilaki, E.; Vernardou, D.; Kenanakis, G.; Vamvakaki, M.; Katsarakis, N. TiO2/WO3 photoactive bilayers in the UV–Vis light region. Appl. Phys. A 2017, 123, 231. [Google Scholar] [CrossRef]
  5. Vernardou, D.; Vlachou, K.; Spanakis, E.; Stratakis, E.; Katsarakis, N.; Kymakis, E.; Koudoumas, E. Influence of solution chemistry on the properties of hydrothermally grown TiO2 for advanced applications. Catal. Today 2009, 144, 172–176. [Google Scholar] [CrossRef]
  6. Suchea, M.; Christoulakis, S.; Tudose, I.V.; Vernardou, D.; Lygeraki, M.I.; Anastasiadis, S.H.; Kitsopoulos, T.; Kiriakidis, G. Pure and Nb2O5-doped TiO2 amorphous thin films grown by dc magnetron sputtering at room temperature: Surface and photo-induced hydrophilic conversion studies. Mater. Sci. Eng. B 2007, 144, 54–59. [Google Scholar] [CrossRef]
  7. Johannsen, S.R.; Roesgaard, S.; Julsgaard, B.; Ferreira, R.A.S.; Chevallier, J.; Balling, P.; Ram, S.K.; Nylandsted Larsen, A. Influence of TiO2 host crystallinity on Er3+ light emission. Opt. Mater. Express 2016, 6, 1664–1678. [Google Scholar] [CrossRef]
  8. Bahtat, A.; Bouazaoui, M.; Bahtat, M.; Mugnier, J. Fluorescence of Er3+ ions in TiO2 planar waveguides prepared by a sol-gel process. Opt. Commun. 1994, 111, 55–60. [Google Scholar] [CrossRef]
  9. Mignotte, C. Structural characterization for Er3+-doped oxide materials potentially useful as optical devices. Appl. Surf. Sci. 2004, 226, 355–370. [Google Scholar] [CrossRef]
  10. Lopez-Iscoa, P.; Petit, L.; Massera, J.; Janner, D.; Boetti, N.G.; Pugliese, D.; Fiorilli, S.; Novara, C.; Giorgis, F.; Milanese, D. Effect of the addition of Al2O3, TiO2 and ZnO on the thermal, structural and luminescence properties of Er3+-doped phosphate glasses. J. Non-Cryst. Solids 2017, 460, 161–168. [Google Scholar] [CrossRef]
  11. Miniscalco, W.J. Erbium-doped glasses for fiber amplifiers at 1500 nm. J. Lightwave Technol. 1991, 9, 234–250. [Google Scholar] [CrossRef]
  12. Bahtat, A.; Bouazaoui, M.; Bahtat, M.; Garapon, C.; Jacquier, B.; Mugnier, J. Up-conversion fluorescence spectroscopy in Er3+:TiO2 planar waveguides prepared by a sol–gel process. J. Non-Cryst. Solids 1996, 202, 16–22. [Google Scholar] [CrossRef]
  13. Johannsen, S.R.; Rosenfeld Lauridsen, L.; Julsgaard, B.; Neuvonen, P.T.; Ram, S.K.; Nylandsted Larsen, A. Optimization of Er3+-doped TiO2-thin films for infrared light up-conversion. Thin Solid Films 2014, 550, 499–503. [Google Scholar] [CrossRef]
  14. de Wild, J.; Meijerink, A.; Rath, J.K.; van Sark, W.G.J.H.M.; Schropp, R.E.I. Upconverter solar cells: materials and applications. Energy Environ. Sci. 2011, 4, 4835–4848. [Google Scholar] [CrossRef]
  15. Trupke, T.; Green, M.A.; Würfel, P. Improving solar cell efficiencies by up-conversion of sub-band-gap light. J. Appl. Phys. 2002, 92, 4117–4122. [Google Scholar] [CrossRef]
  16. Fischer, S.; Goldschmidt, J.C.; Löper, P.; Bauer, G.H.; Brüggemann, R.; Krämer, K.; Biner, D.; Hermle, M.; Glunz, S.W. Enhancement of silicon solar cell efficiency by upconversion: Optical and electrical characterization. J. Appl. Phys. 2010, 108, 044912. [Google Scholar] [CrossRef]
  17. Zhang, Y.; Xing, Z.; Liu, X.; Li, Z.; Wu, X.; Jiang, J.; Li, M.; Zhu, Q.; Zhou, W. Ti3+ self-doped blue TiO2(B) single-crystalline nanorods for efficient solar-driven photocatalytic performance. ACS Appl. Mater. Interfaces 2016, 8, 26851–26859. [Google Scholar] [CrossRef] [PubMed]
  18. Dubey, P.K.; Tiwari, R.S.; Srivastava, O.N.; Sinha, A.S.K. Synthesis of TiO2 nanoribbons and its application in photoelectrochemical water splitting for hydrogen production. Int. J. Nanosci. 2011, 10, 723–726. [Google Scholar] [CrossRef]
  19. Li, Y.-F.; Liu, Z.-P. Particle size, shape and activity for photocatalysis on titania anatase nanoparticles in aqueous surroundings. J. Am. Chem. Soc. 2011, 133, 15743–15752. [Google Scholar] [CrossRef] [PubMed]
  20. Scolan, E.; Sanchez, C. Synthesis and characterization of surface-protected nanocrystalline titania particles. Chem. Mater. 1998, 10, 3217–3223. [Google Scholar] [CrossRef]
  21. Chemseddine, A.; Moritz, T. Nanostructuring titania: control over nanocrystal structure, size, shape, and organization. Eur. J. Inorg. Chem. 1999, 1999, 235–245. [Google Scholar] [CrossRef]
  22. Xiang, L.; Zhao, X. Wet-chemical preparation of TiO2-based composites with different morphologies and photocatalytic properties. Nanomaterials 2017, 7, 310. [Google Scholar] [CrossRef] [PubMed]
  23. Galliano, P.; De Damborenea, J.J.; Pascual, M.J.; Durán, A. Sol-gel coatings on 316L steel for clinical applications. J. Sol-Gel Sci. Technol. 1998, 13, 723–727. [Google Scholar] [CrossRef]
  24. Mohammed, A.J.; Kadhum, A.A.H.; Ba-Abbad, M.M.; Al-Amiery, A.A. Optimization of solar photocatalytic degradation of chloroxylenol using TiO2, Er3+/TiO2, and Ni2+/TiO2 via the Taguchi orthogonal array technique. Catalysts 2016, 6, 163. [Google Scholar] [CrossRef]
  25. Xu, X.; Zhou, S.; Long, J.; Wu, T.; Fan, Z. The synthesis of a core-shell photocatalyst material YF3:Ho3+@TiO2 and investigation of its photocatalytic properties. Materials 2017, 10, 302. [Google Scholar] [CrossRef] [PubMed]
  26. Jeon, S.; Braun, P.V. Hydrothermal synthesis of Er-doped luminescent TiO2 nanoparticles. Chem. Mater. 2003, 15, 1256–1263. [Google Scholar] [CrossRef]
  27. Keddie, J.L.; Norton, L.J.; Kramer, E.J.; Giannelis, E.P. Neutron reflectometry characterization of interface width between sol-gel titanium dioxide and silicon dioxide thin films. J. Am. Ceram. Soc. 1993, 76, 2534–2538. [Google Scholar] [CrossRef]
  28. Langlet, M.; Coutier, C.; Fick, J.; Audier, M.; Meffre, W.; Jacquier, B.; Rimet, R. Sol–gel thin film deposition and characterization of a new optically active compound: Er2Ti2O7. Opt. Mater. 2001, 16, 463–473. [Google Scholar] [CrossRef]
  29. Yang, J.; Mei, S.; Ferreira, J.M.F. Hydrothermal synthesis of TiO2 nanopowders from tetraalkylammonium hydroxide peptized sols. Mater. Sci. Eng. C 2001, 15, 183–185. [Google Scholar] [CrossRef]
  30. Ovenstone, J.; Yanagisawa, K. Effect of hydrothermal treatment of amorphous titania on the phase change from anatase to rutile during calcination. Chem. Mater. 1999, 11, 2770–2774. [Google Scholar] [CrossRef]
  31. Yanagisawa, K.; Ovenstone, J. Crystallization of anatase from amorphous titania using the hydrothermal technique: effects of starting material and temperature. J. Phys. Chem. B 1999, 103, 7781–7787. [Google Scholar] [CrossRef]
  32. Cacciotti, I.; Bianco, A.; Pezzotti, G.; Gusmano, G. Synthesis, thermal behaviour and luminescence properties of rare earth-doped titania nanofibers. Chem. Eng. J. 2011, 166, 751–764. [Google Scholar] [CrossRef]
  33. Mignotte, C. EXAFS studies on erbium-doped TiO2 and ZrO2 sol–gel thin films. J. Non-Cryst. Solids 2001, 291, 56–77. [Google Scholar] [CrossRef]
  34. Howard, C.J.; Sabine, T.M.; Dickson, F. Structural and thermal parameters for rutile and anatase. Acta Crystallogr. Sect. B: Struct. Sci. 1991, 47, 462–468. [Google Scholar] [CrossRef]
  35. Chen, X.-C.; Zhou, J.-P.; Wang, H.-Y.; Xu, P.-S.; Pan, G.-Q. In situ high temperature X-ray diffraction studies of ZnO thin film. Chin. Phys. B 2011, 20, 096102. [Google Scholar] [CrossRef]
  36. Patra, A.; Friend, C.S.; Kapoor, R.; Prasad, P.N. Fluorescence upconversion properties of Er3+-doped TiO2 and BaTiO3 nanocrystallites. Chem. Mater. 2003, 15, 3650–3655. [Google Scholar] [CrossRef]
  37. Zhao, J.-G.; Zhang, W.-Y.; Ma, Z.-W.; Xie, E.-Q.; Zhao, A.-K.; Liu, Z.-J. Structure and photoluminescence properties of Er3+-doped TiO2–SiO2 powders prepared by sol–gel method. Chin. Phys. B 2011, 20, 087701. [Google Scholar] [CrossRef]
  38. Ting, C.-C.; Chen, S.-Y.; Hsieh, W.-F.; Lee, H.-Y. Effects of yttrium codoping on photoluminescence of erbium-doped TiO2 films. J. Appl. Phys. 2001, 90, 5564–5569. [Google Scholar] [CrossRef]
  39. He, C.; Tian, B.; Zhang, J. Synthesis of thermally stable and highly ordered bicontinuous cubic mesoporous titania–silica binary oxides with crystalline framework. Microporous Mesoporous Mater. 2009, 126, 50–57. [Google Scholar] [CrossRef]
  40. Li, J.-G.; Wang, X.-H.; Kamiyama, H.; Ishigaki, T.; Sekiguchi, T. RF plasma processing of Er-doped TiO2 luminescent nanoparticles. Thin Solid Films 2006, 506–507, 292–296. [Google Scholar] [CrossRef]
  41. Lide, D.R. CRC Handbook of Chemistry and Physics, 96th ed.; CRC Press: Boca Raton, FL, USA, 2015; ISBN 9781482260977. [Google Scholar]
  42. Reszczyńska, J.; Grzyb, T.; Sobczak, J.W.; Lisowski, W.; Gazda, M.; Ohtani, B.; Zaleska, A. Visible light activity of rare earth metal doped (Er3+, Yb3+ or Er3+/Yb3+) titania photocatalysts. Appl. Catal. B 2015, 163, 40–49. [Google Scholar] [CrossRef]
  43. Bahtat, A.; Bouderbala, M.; Bahtat, M.; Bouazaoui, M.; Mugnier, J.; Druetta, M. Structural characterisation of Er3+ doped sol–gel TiO2 planar optical waveguides. Thin Solid Films 1998, 323, 59–62. [Google Scholar] [CrossRef]
  44. Lopez-Iscoa, P.; Salminen, T.; Hakkarainen, T.; Petit, L.; Janner, D.; Boetti, N.G.; Lastusaari, M.; Pugliese, D.; Paturi, P.; Milanese, D. Effect of partial crystallization on the structural and luminescence properties of Er3+-doped phosphate glasses. Materials 2017, 10, 473. [Google Scholar] [CrossRef] [PubMed]
  45. Tobaldi, D.M.; Tucci, A.; Škapin, A.S.; Esposito, L. Effects of SiO2 addition on TiO2 crystal structure and photocatalytic activity. J. Eur. Ceram. Soc. 2010, 30, 2481–2490. [Google Scholar] [CrossRef]
  46. Fujishima, A.; Zhang, X.; Tryk, D.A. TiO2 photocatalysis and related surface phenomena. Surf. Sci. Rep. 2008, 63, 515–582. [Google Scholar] [CrossRef]
  47. Quimby, R.S.; Miniscalco, W.J.; Thompson, B. Clustering in erbium-doped silica glass fibers analyzed using 980 nm excited-state absorption. J. Appl. Phys. 1994, 76, 4472–4478. [Google Scholar] [CrossRef]
  48. Golding, P.S.; Jackson, S.D.; King, T.A.; Pollnau, M. Energy transfer processes in Er3+-doped and Er3+,Pr3+-codoped ZBLAN glasses. Phys. Rev. B Condens. Matter 2000, 62, 856–864. [Google Scholar] [CrossRef]
  49. Hubbard, C.R.; Snyder, R.L. RIR-measurement and use in quantitative XRD. Powder Diffr. 1988, 3, 74–77. [Google Scholar] [CrossRef]
  50. Sandoval, C.; Kim, A.D. Deriving Kubelka–Munk theory from radiative transport. J. Opt. Soc. Am. A 2014, 31, 628–636. [Google Scholar] [CrossRef] [PubMed]
Figure 1. Weight loss as a function of the temperature of the 2 mol% Er2O3-doped TiO2 particles as-prepared and calcined at 800 °C for 2 h.
Nanomaterials 08 00020 g001
Figure 2. (a) X-Ray Diffraction (XRD) patterns of the 2 mol% Er2O3-doped TiO2 particles calcined at different temperatures. The diffraction peaks of anatase, rutile, and pyrochlore (Er2Ti2O7) are indexed in the figure as A, R, and P, respectively; (b) Phase composition of the TiO2 samples calcined at different temperatures.
Nanomaterials 08 00020 g002
Figure 3. 100,000× magnification Field Emission-Scanning Electron Microscope (FE-SEM) micrographs of the 2 mol% Er2O3-doped TiO2 particles as-prepared (a) and calcined at 700 (b); 800 (c); 900 (d); and 1000 °C (e) for 2 h. Scale bar equals to 500 nm.
Nanomaterials 08 00020 g003
Figure 4. (a) Emission spectra of the 2 mol% Er2O3-doped TiO2 particles calcined at 700, 800, 825, 837, 850, 900, and 1000 °C for 2 h; (b) Lifetime values of the aforementioned samples. A dashed fitting line is also reported.
Nanomaterials 08 00020 g004
Figure 5. (a) Normalized up-conversion emission spectra of the 2 mol% Er2O3-doped TiO2 particles calcined at 700, 800, 825, 837, 850, 900, and 1000 °C for 2 h. All the spectra were normalized to 1 at 550 nm; (b) Integral area ratio of the red/green emissions of the 2 mol% Er2O3-doped TiO2 particles calcined at 700, 800, 825, 837, 850, 900, and 1000 °C for 2 h. A dashed line is shown as a guide to the eye.
Nanomaterials 08 00020 g005
Figure 6. Fourier Transform-Infrared Spectroscopy (FT-IR) spectra of the 5 mol% Er2O3-doped TiO2 particles as-prepared and calcined at 800 °C for 2 h. *: hydroxyl groups; X: adsorbed water; Ω: O–H bending vibrations.
Nanomaterials 08 00020 g006
Figure 7. (a) XRD patterns of the undoped and 0.5, 2, 5, 10, and 14.3 mol% Er2O3-doped TiO2 particles calcined at 800 °C for 2 h. The diffraction peaks of the anatase, rutile, and pyrochlore phases are indexed in the figure; (b) Ternary diagram showing the proportion of the crystalline phases present in the 0.5, 2, 5, 10, and 14.3 mol% Er2O3-doped TiO2 particles calcined at 800 °C for 2 h.
Nanomaterials 08 00020 g007
Figure 8. 50,000× magnification FE-SEM micrographs of the undoped and 0.5, 2, and 14.3 mol% Er2O3-doped TiO2 particles as-prepared (ad) and calcined at 800 °C for 2 h (eh), respectively. Scale bar equals to 2 μm.
Nanomaterials 08 00020 g008
Figure 9. Kubelka–Munk function of the 2, 10, and 14.3 mol% Er2O3-doped TiO2 particles calcined at 800 °C for 2 h.
Nanomaterials 08 00020 g009
Figure 10. Normalized emission spectra of the 0.5, 2, 5, 10, and 14.3 mol% Er2O3-doped TiO2 particles calcined at 800 °C for 2 h.
Nanomaterials 08 00020 g010
Figure 11. Lifetime values of the TiO2 particles doped with different concentrations of Er2O3 and calcined at 800 °C for 2 h. A dashed line is shown as a guide to the eye.
Nanomaterials 08 00020 g011
Figure 12. (a) Normalized up-conversion emission spectra of the TiO2 particles doped with different concentrations of Er2O3 and calcined at 800 °C for 2 h. All the spectra were normalized to 1 at 550 nm; (b) Integral area ratio of the red/green emissions of the TiO2 particles doped with different concentrations of Er2O3 and calcined at 800 °C for 2 h. A dashed fitting line is also shown.
Nanomaterials 08 00020 g012

