Article

Stability and Synergistic Effect of Polyaniline/TiO2 Photocatalysts in Degradation of Azo Dye in Wastewater

by
Vanja Gilja
1,
Katarina Novaković
1,
Jadranka Travas-Sejdic
2,
Zlata Hrnjak-Murgić
1,
Marijana Kraljić Roković
1 and
Mark Žic
3,*
1
Faculty of Chemical Engineering and Technology, University of Zagreb, Marulićev trg 19, 10000 Zagreb, Croatia
2
School of Chemical Sciences, University of Auckland, Polymer Electronics Research Centre, 23 Symonds Street, Auckland 1010, New Zealand
3
Ruđer Bošković Institute, Bijenička cesta 54, 10000 Zagreb, Croatia
*
Author to whom correspondence should be addressed.
Nanomaterials 2017, 7(12), 412; https://doi.org/10.3390/nano7120412
Submission received: 20 October 2017 / Revised: 16 November 2017 / Accepted: 17 November 2017 / Published: 23 November 2017
(This article belongs to the Special Issue Experimental Nanosciences, Computational Chemistry, and Data Analysis)

Abstract

:
The polyaniline/TiO2 (PANI/TiO2) composite photocatalysts were prepared by the in situ chemical oxidation of aniline (An) in the presence of TiO2 particles. For this purpose, photocatalysts with different amounts of PANI polymer were prepared and analysed. Fourier-transform infrared (FT-IR) spectroscopy and thermogravimetric (TG) analysis indicated successful synthesis of the PANI polymer and its conductivity was also determined. The micrographs of field emission scanning electron microscopy (FE-SEM) and transmission electron microscopy (TEM) were used to explain the impact of the aniline amount on the aggregation process during the synthesis of the composites. The smallest size of aggregates was obtained for the photocatalysts with 15% of PANI (15PANI/TiO2) due to the formation of homogenous PANI. The photocatalytic activity of studied PANI/TiO2 photocatalysts was validated by monitoring the discoloration and mineralization of Reactive Red azo dye (RR45) in wastewater. The 15PANI/TiO2 sample presented the highest photocatalytic efficiency under ultraviolet A (UVA) irradiation, in comparison to pure TiO2. This was explained by the formation of uniformly dispersed PANI on the TiO2 particles, which was responsible for the synergistic PANI-TiO2 effect.

1. Introduction

Organic synthetic dyes (e.g., Reactive Red (RR45)), originating from textile and dye industries, are among prominent environmental pollution factors. To dismiss the possibility of pollution, organic dyes have been removed from wastewaters, both by discoloration and complete mineralization [1]. One of the most efficient approaches to degrading organic dye is to apply advanced oxidation processes (AOPs), with the aim of converting dyes to non-toxic and non-hazardous species that can be released in the environment [2].
Photocatalysis is a widely studied process, which utilizes light to activate semiconductor metal oxide catalysts. Furthermore, titanium dioxide (TiO2) is one of the most commonly used commercial photocatalysts, as it is non-toxic, low in cost and environment friendly, due to its chemical stability [3,4,5]. However, the relatively high band gap (3.2 eV) of TiO2 [6] restricts its photocatalytic activity under visible light (Vis), whereas its poor quantum efficiency, due to recombination of electrons (eCB) and holes (hVB+) [7], is another disadvantage.
However, TiO2 photocatalytic activity under Vis (>400 nm) can be increased by doping [6]; and thus, numerous groups utilize transition metal ions, such as Fe, Au, Ag, V, Cr and Ni, to hinder the recombination process [1,8,9,10]. The recombination process in TiO2 has also been suppressed by preparing polyaniline/TiO2 (PANI/TiO2) composites [11], which is a promising, though poorly investigated approach. The advantage is that PANI is a conductive, non-toxic and thermally stable polymer, with a high absorption coefficient in the Vis spectrum [12].
PANI is capable both of injecting eCB (obtained by absorption of a photon from Vis irradiation) into the TiO2 conduction band (CB), and accepting hVB+ from the TiO2 valence band (VB) [13]. Thus, the aforementioned PANI-TiO2 interactions result in the PANI-TiO2 synergistic effect that hinders the recombination process and increases TiO2 activity under ultraviolet (UV) and Vis irradiation [13]. Photocatalysis then proceed by the typical mechanism, known for TiO2: eCB and hVB+ transform H2O and O2 into OH radicals, which in turn degrade the organic pollutants [14,15].
PANI/TiO2 composites can be prepared by in situ chemical oxidation of aniline in the presence of TiO2 particles. Generally, aniline oxidation can yield different products as oligomers and oxidation products with an amino group in the ortho-position [16], which presents imperfections that might influence aggregate size. In addition, PANI properties were shown to be perturbed when monomers with amino group in the ortho-position were added to the synthesis solution [17,18,19]. Thus, the optimal PANI-TiO2 synergistic effect can be obtained only if the synthesis conditions are carefully chosen. However, in literature to date, the impact of the initial synthesis conditions on the in situ PANI/TiO2 synthesis has not been clarified yet.
In the present study, PANI/TiO2 composites were prepared by chemical in situ oxidation of aniline, in the presence of TiO2, by using ammonium persulfate (APS) as the oxidant [13]. In order to obtain the PANI-TiO2 synergistic effect, the polymer has to be in its conductive form [12] and the aggregates should be of optimal size. However, the PANI conductivity and aggregate sizes are properties that are governed by the synthesis conditions: the concentrations of An and APS, the An:APS ratio, the type of acid, pH, etc. [16].
The objective of this study was to synthesize PANI/TiO2 composite photocatalysts, (i) to study stability as well as the composition and structure of PANI that are essential for the synergistic PANI-TiO2 effect; (ii) to prepare PANI/TiO2 composite photocatalysts with higher photocatalytic efficiencies under UVA irradiation, in comparison to pure TiO2 and (iii) to explain the impact of aniline concentration on the in situ PANI/TiO2 composite synthesis. Special attention was focused on explaining the impact of aniline concentration on the aggregation process and on the PANI-TiO2 synergistic effect.

2. Materials and Methods

2.1. Materials

TiO2 (P-25, Aeroxide) from Evonik (Degussa, Essen, Germany), aniline (An, 99%), ammonium persulfate (APS) and H2SO4 (96%) from Acros Organics (Morris Plains, NJ, USA) were used to synthesize samples. The chemicals were used as received, without any additional pre-treatment.

2.2. PANI/TiO2 Photocatalyst Preparation

The aniline monomer was oxidized by APS in the presence of TiO2 particles. In situ polymerization processes were conducted at a constant mole ratio of n(An):n(APS) = 1:0.25. Aniline additions were predetermined to yield composites in which the weight ratio of PANI in the composites were 10%, 15%, 20% and 25% (Table 1). A quantity of 0.8 g TiO2 was used in all preparation procedures.
In the case of the 10PANI/TiO2 composite, the weight ratio of the oxidized aniline (PANI) vs. TiO2 was 0.10. Also, other photocatalysts were synthesized in the same manner as 10PANI/TiO2 sample, as follows: (a) 50 mL aqueous A solution was prepared using 0.8 g TiO2 and 0.055 mL H2SO4 and sonicated for 15 min to obtain a stable suspension; (b) 50 mL aqueous B solution was prepared using 0.392 mL An and 0.055 mL H2SO4; and (c) 50 mL aqueous C solution was prepared using 0.245 g APS and 0.055 mL H2SO4 (Table 1). In order to obtain a stable An–TiO2 suspension, the A and B solutions were mixed and stirred (500 rpm) in a reactor container for a period of 15 min. Next, the in situ polymerization process was commenced by adding C solution to the reactor, which was refilled with H2O, to obtain the total reaction volume of 200 mL. The reactor suspension was stirred for 24 h at room temperature. The pure PANI sample was prepared by the same procedure used to prepare 10PANI/TiO2, but without adding TiO2. The in situ polymerization process resulted in a dark green product that was washed only by using H2O and centrifugation and afterwards dried at 60 °C for 24 h.

2.3. Characterizations

FT-IR spectra were obtained using a Spectrum One FT-IR spectrometer (Perkin Elmer, Shelton, CT, USA) in the range of 4000–650 cm−1. UV/Vis spectra were made over the range, 200 to 800 nm, with a spectral resolution of ~0.3–10 nm, using a UV/Vis spectrometer (Ocean Optics USB 2000+, Ocean Optics, Largo, FL, USA). SEM images were obtained by a thermal field emission scanning microscope (FE-SEM, model JSM-7000F, JEOL Ltd., Akishima, Japan). TEM images were obtained by a transmission electron microscope (FEI Tecnai FEG20, Tecnai, Hillsboro, OR, USA). The conductivity of PANI/TiO2 composites was measured by the four-point probe method (Keysigiht 34461 61/2 Digit Multimeter, Keysight Technologies, Santa Rosa, CA, USA). Thermogravimetric (TG) analyses of samples were performed using a TA Instruments Q500 analyser (TA Instruments, New Castle, DE, USA). The TG results were obtained in the temperature range from 25 °C to 800 °C, at a heating rate of 10 °C/min, under a nitrogen atmosphere.

2.4. Photocatalytic Activity Test

To investigate the PANI-TiO2 synergistic effect under UVA/solar irradiation, wastewater was prepared from the dispersion of 30 mg/L azo dye (Reactive Red 45) and 1 g/L photocatalyst. The solution was poured into a glass water-jacketed batch reactor equipped with both a Pen-Ray UVP lamp, emitting irradiation in the UVA region (315 to 400 nm) and a solar irradiation simulator Oriel Newport (Osram XBO 450 W lamp, Oriel Instruments, Irvine, CA, USA). The total volume of stirred (250 rpm) solution during the experiments was 75 mL. Prior to performing photocatalysis, the adsorption equilibrium was reached by leaving the samples in the dark for 30 min; and consequently, the photocatalysis process was carried out for another 90 min. Decolorization of RR45 in solution was monitored by a Perkin Elmer Lambda EZ 201 UV/Vis spectrophotometer (Perkin Elmer, Shelton, CT, USA), where the absorption was measured at a wavelength of 542 nm for RR45. Before the decolorization measurement, samples were taken from the reactor (every 15 min) and filtered using Chromafil XTRA RC (25 mm, 0.45 micron, Macherey-Nagel, Düren, Germany) filters. The results were presented as removed dye from wastewater after treatment, and they were determined by calculation, according to the equation:
A t A 0
where A0 and At are adsorption values at t = 0 and t = t.
The extent of mineralization of RR45 dye was determined as the concentration of total organic carbon (TOC) after photocatalysis, using the Total Organic Analyser: Shimadzu TOC-VCPN (Shimadzu, Kyoto, Japan).

3. Results and Discussion

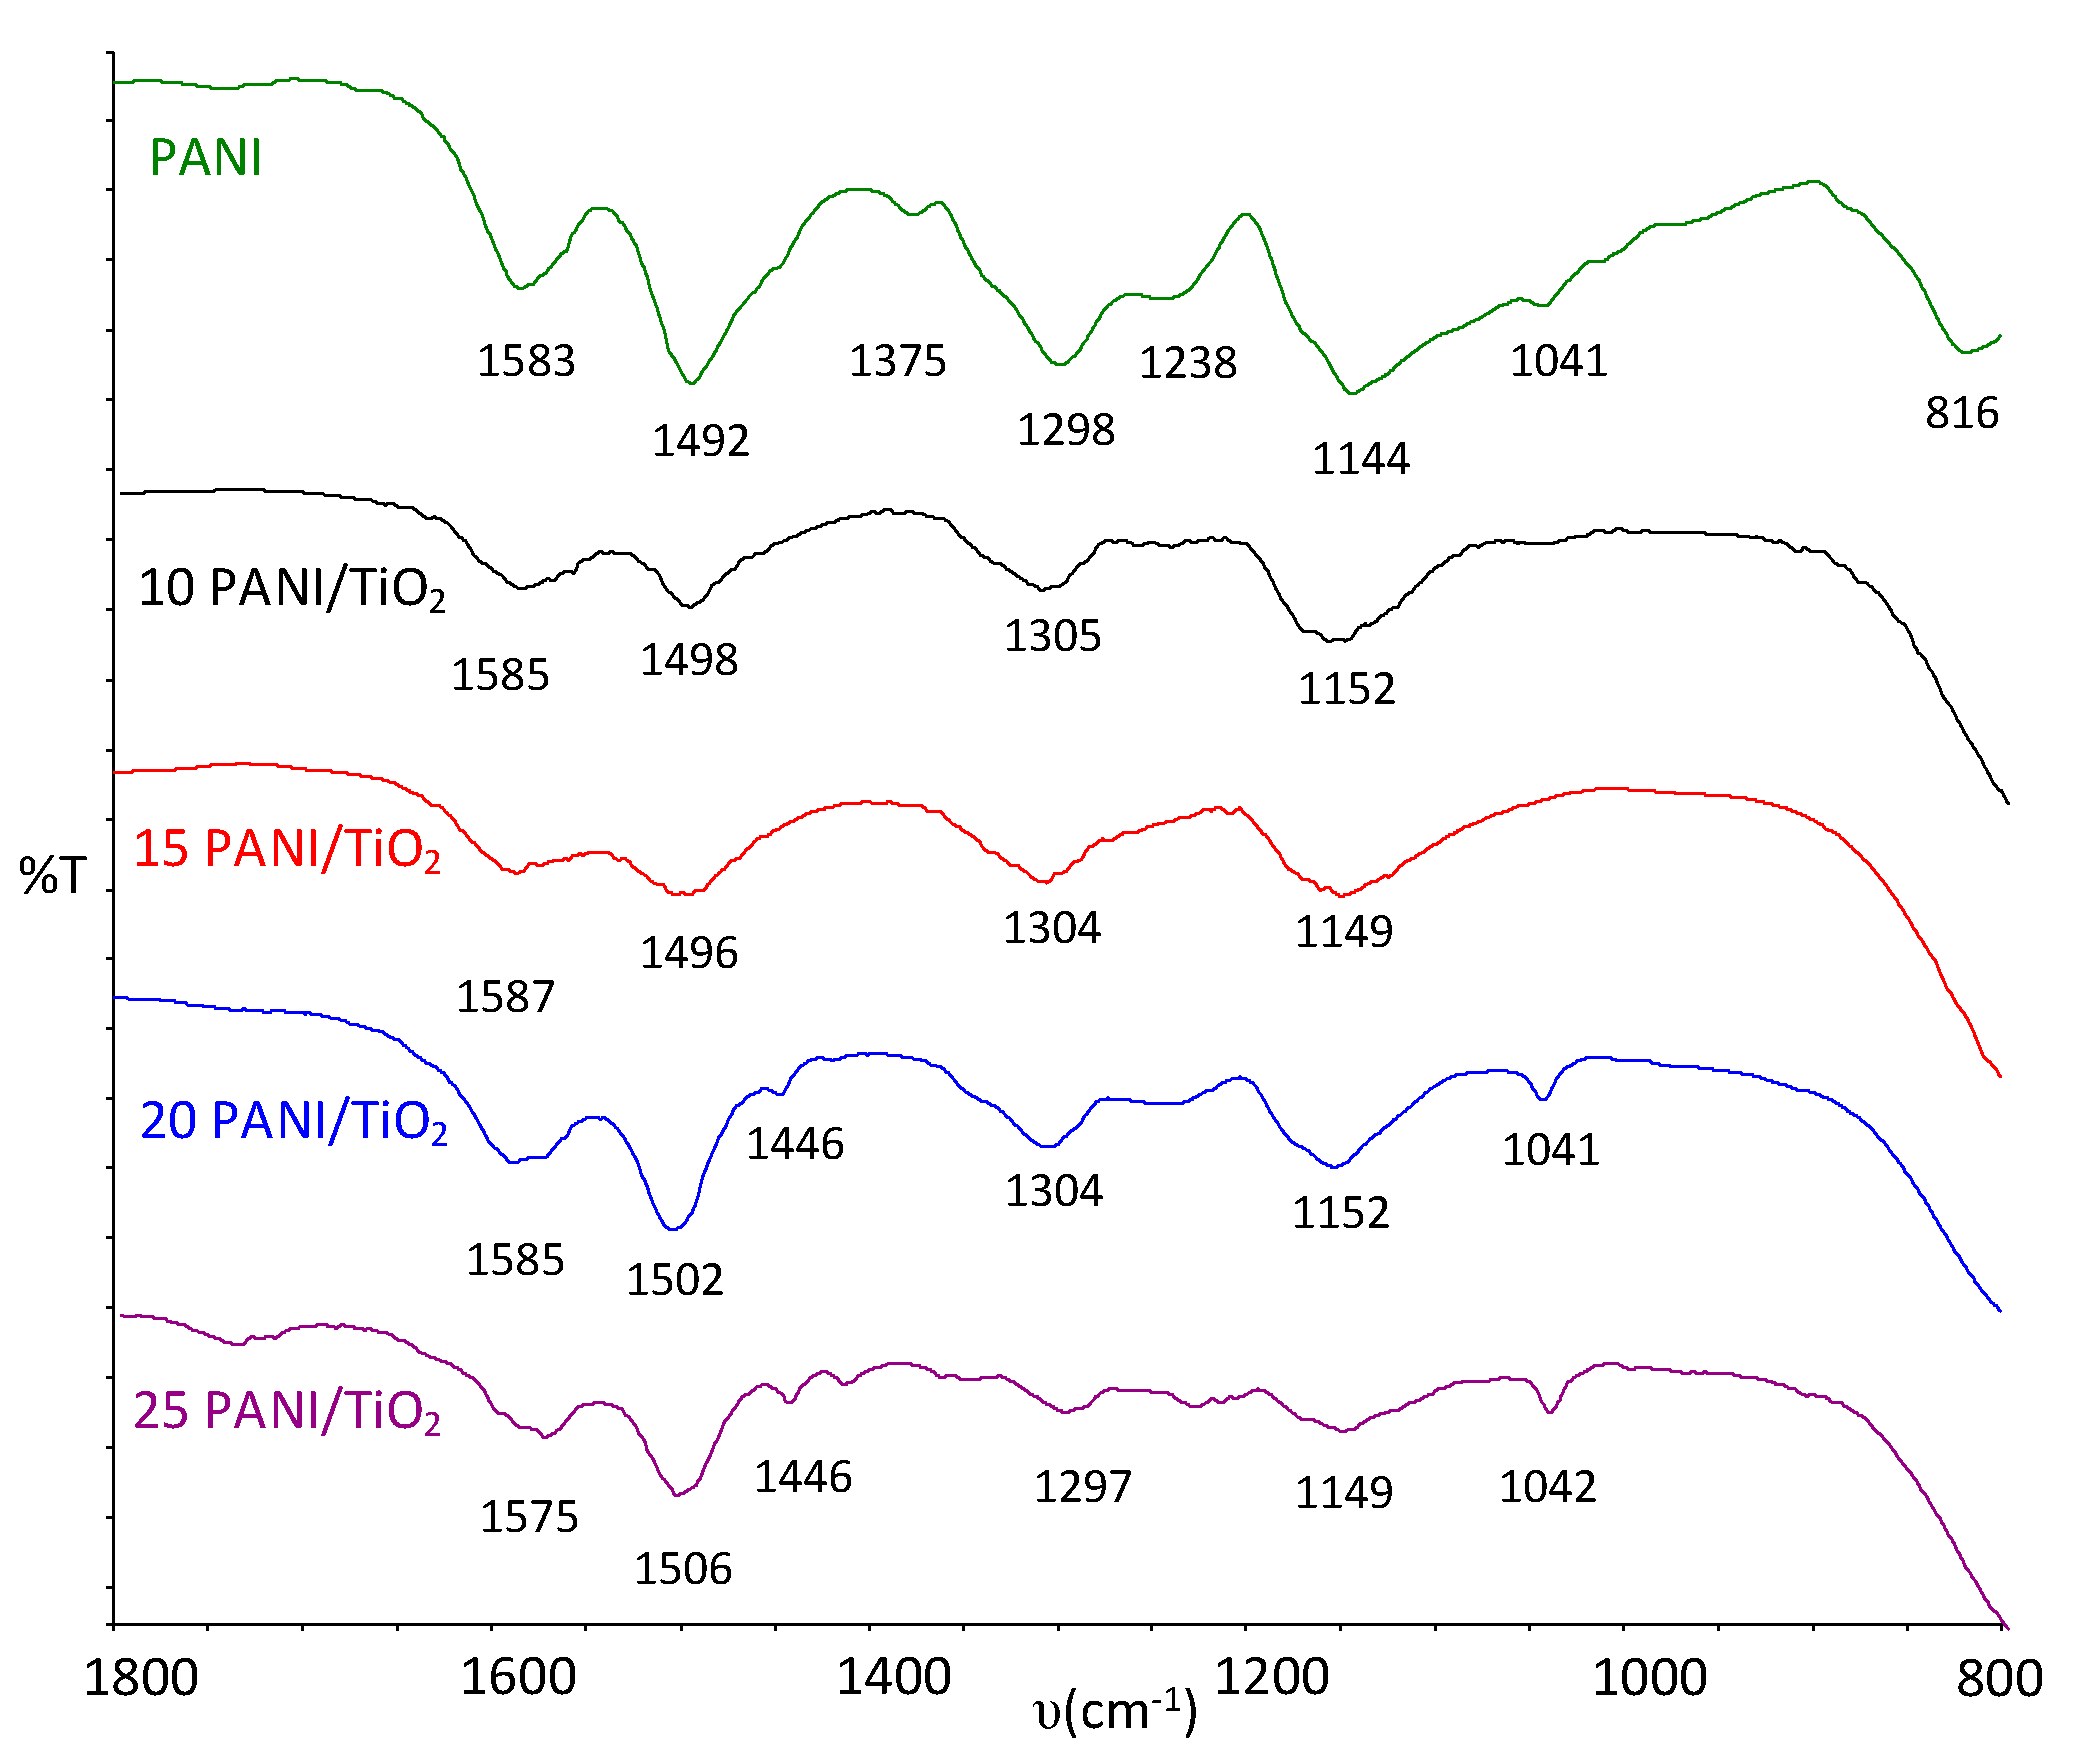
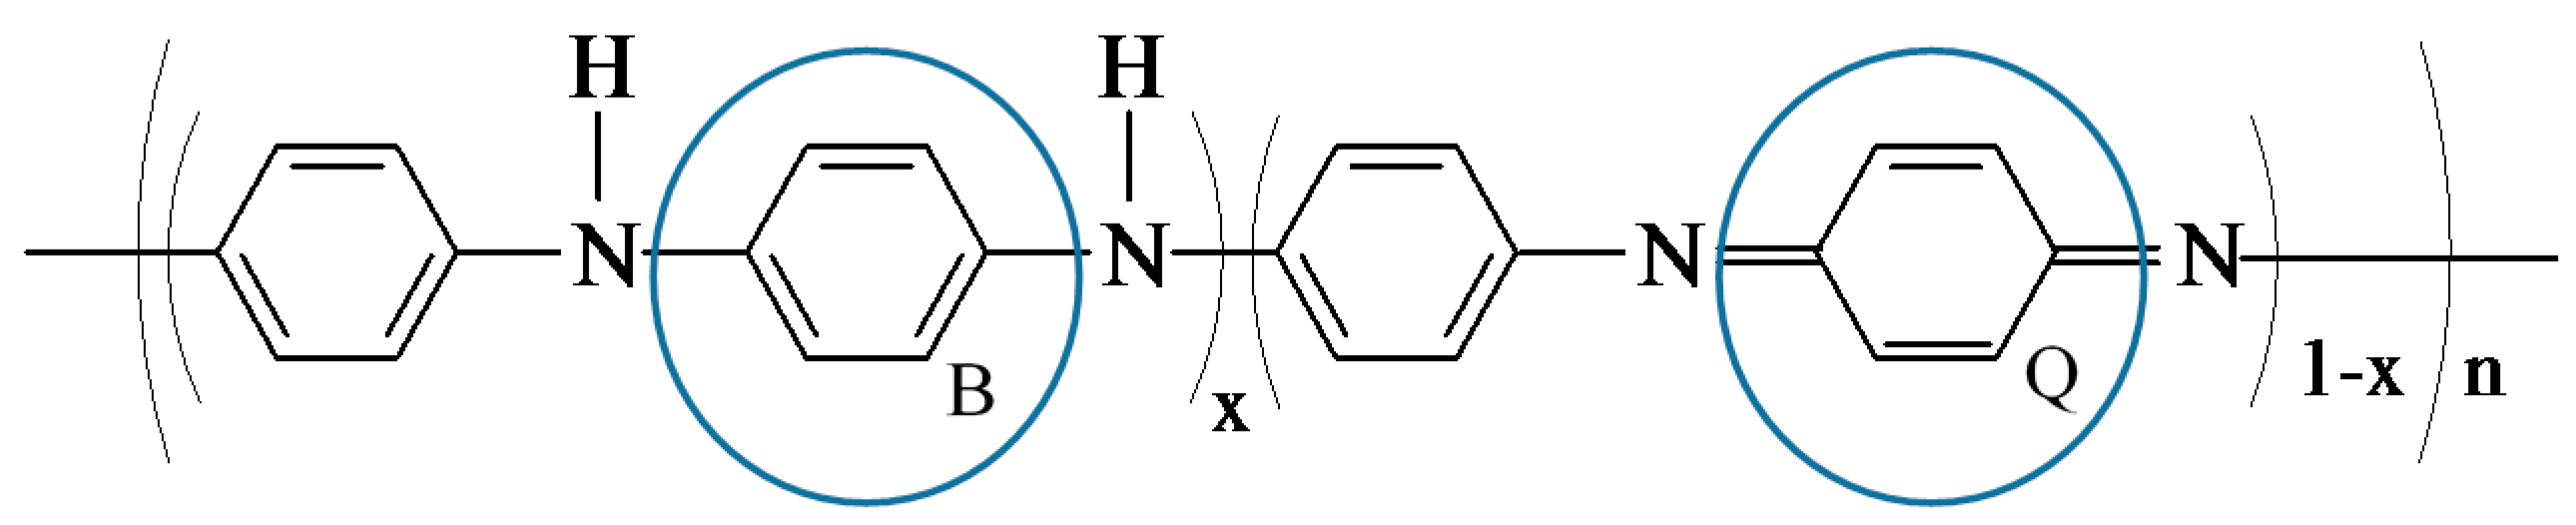
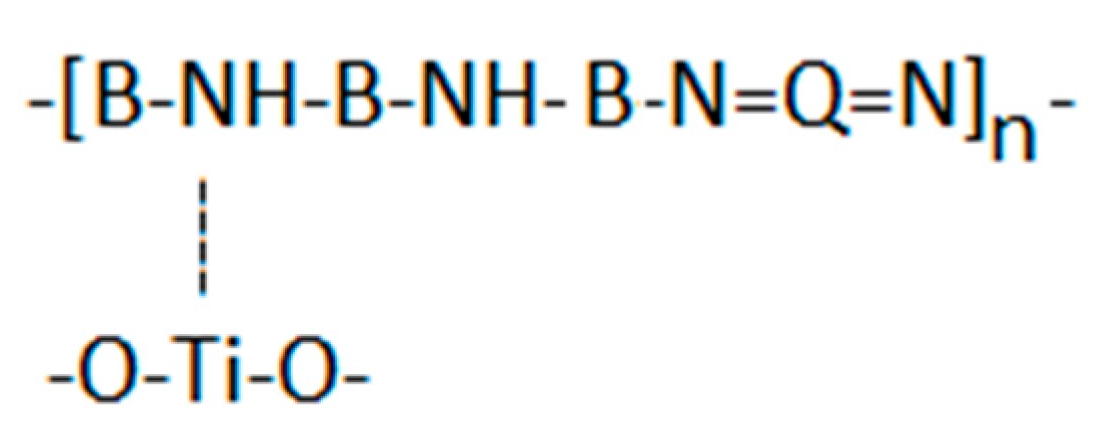
3.1. FT-IR Analyses of Photocatalysts

The PANI-TiO2 synergistic effect is obtained when PANI is in the conductive form [13]. Thus, to collect data relevant for PANI conductivity and PANI-TiO2 interactions, the samples were examined using FT-IR spectroscopy. Figure 1 shows that pure PANI is characterized by vibrations at 1298 cm−1 and 1238 cm−1 that are attributed to C-N stretching modes, whereas C-H out of plane vibrations are positioned at 1144 cm−1 and 816 cm−1 [20].
All studied samples showed distinct bands in the ranges, 1575–1587 cm−1 and 1492–1502 cm−1, due to C=N and C=C stretching modes, typical for quinoid (Q) and benzoid (B) units (Scheme 1). The intensity ratio of bands typical for C=N and C=C stretching modes implied that PANI was in its conductive form [21,22].
Figure 1 shows the presence of the TiO2 particles that decreased transmission values at wavenumbers lower than 900 cm−1. However, vibration modes at 3630–3680 cm−1 and 3500–3420 cm−1, typical for stretching and bending vibrations of –OH groups at the TiO2 surface [23], were not observed in this work (not presented). Furthermore, Figure 1 indicates that the characteristic PANI peaks of C=N, C=C and C–N (1583 cm−1, 1492 cm−1, 1298 cm−1) in the 15PANI/TiO2 composite were shifted to higher wavenumbers (1587 cm−1, 1496 cm−1 and 1304 cm−1). Titanium, as a transition metal, has a tendency to form a coordination compound with nitrogen atoms (Ti–N) which could weaken the strength of the C=N, C=C and C–N bands, that shift typical PANI bands to higher wavenumbers [24]. Thus, the shift of the characteristic PANI peaks in 15PANI/TiO2 indicates the presence of PANI-TiO2 interactions that are obtained through Ti–N interactions (Scheme 2).

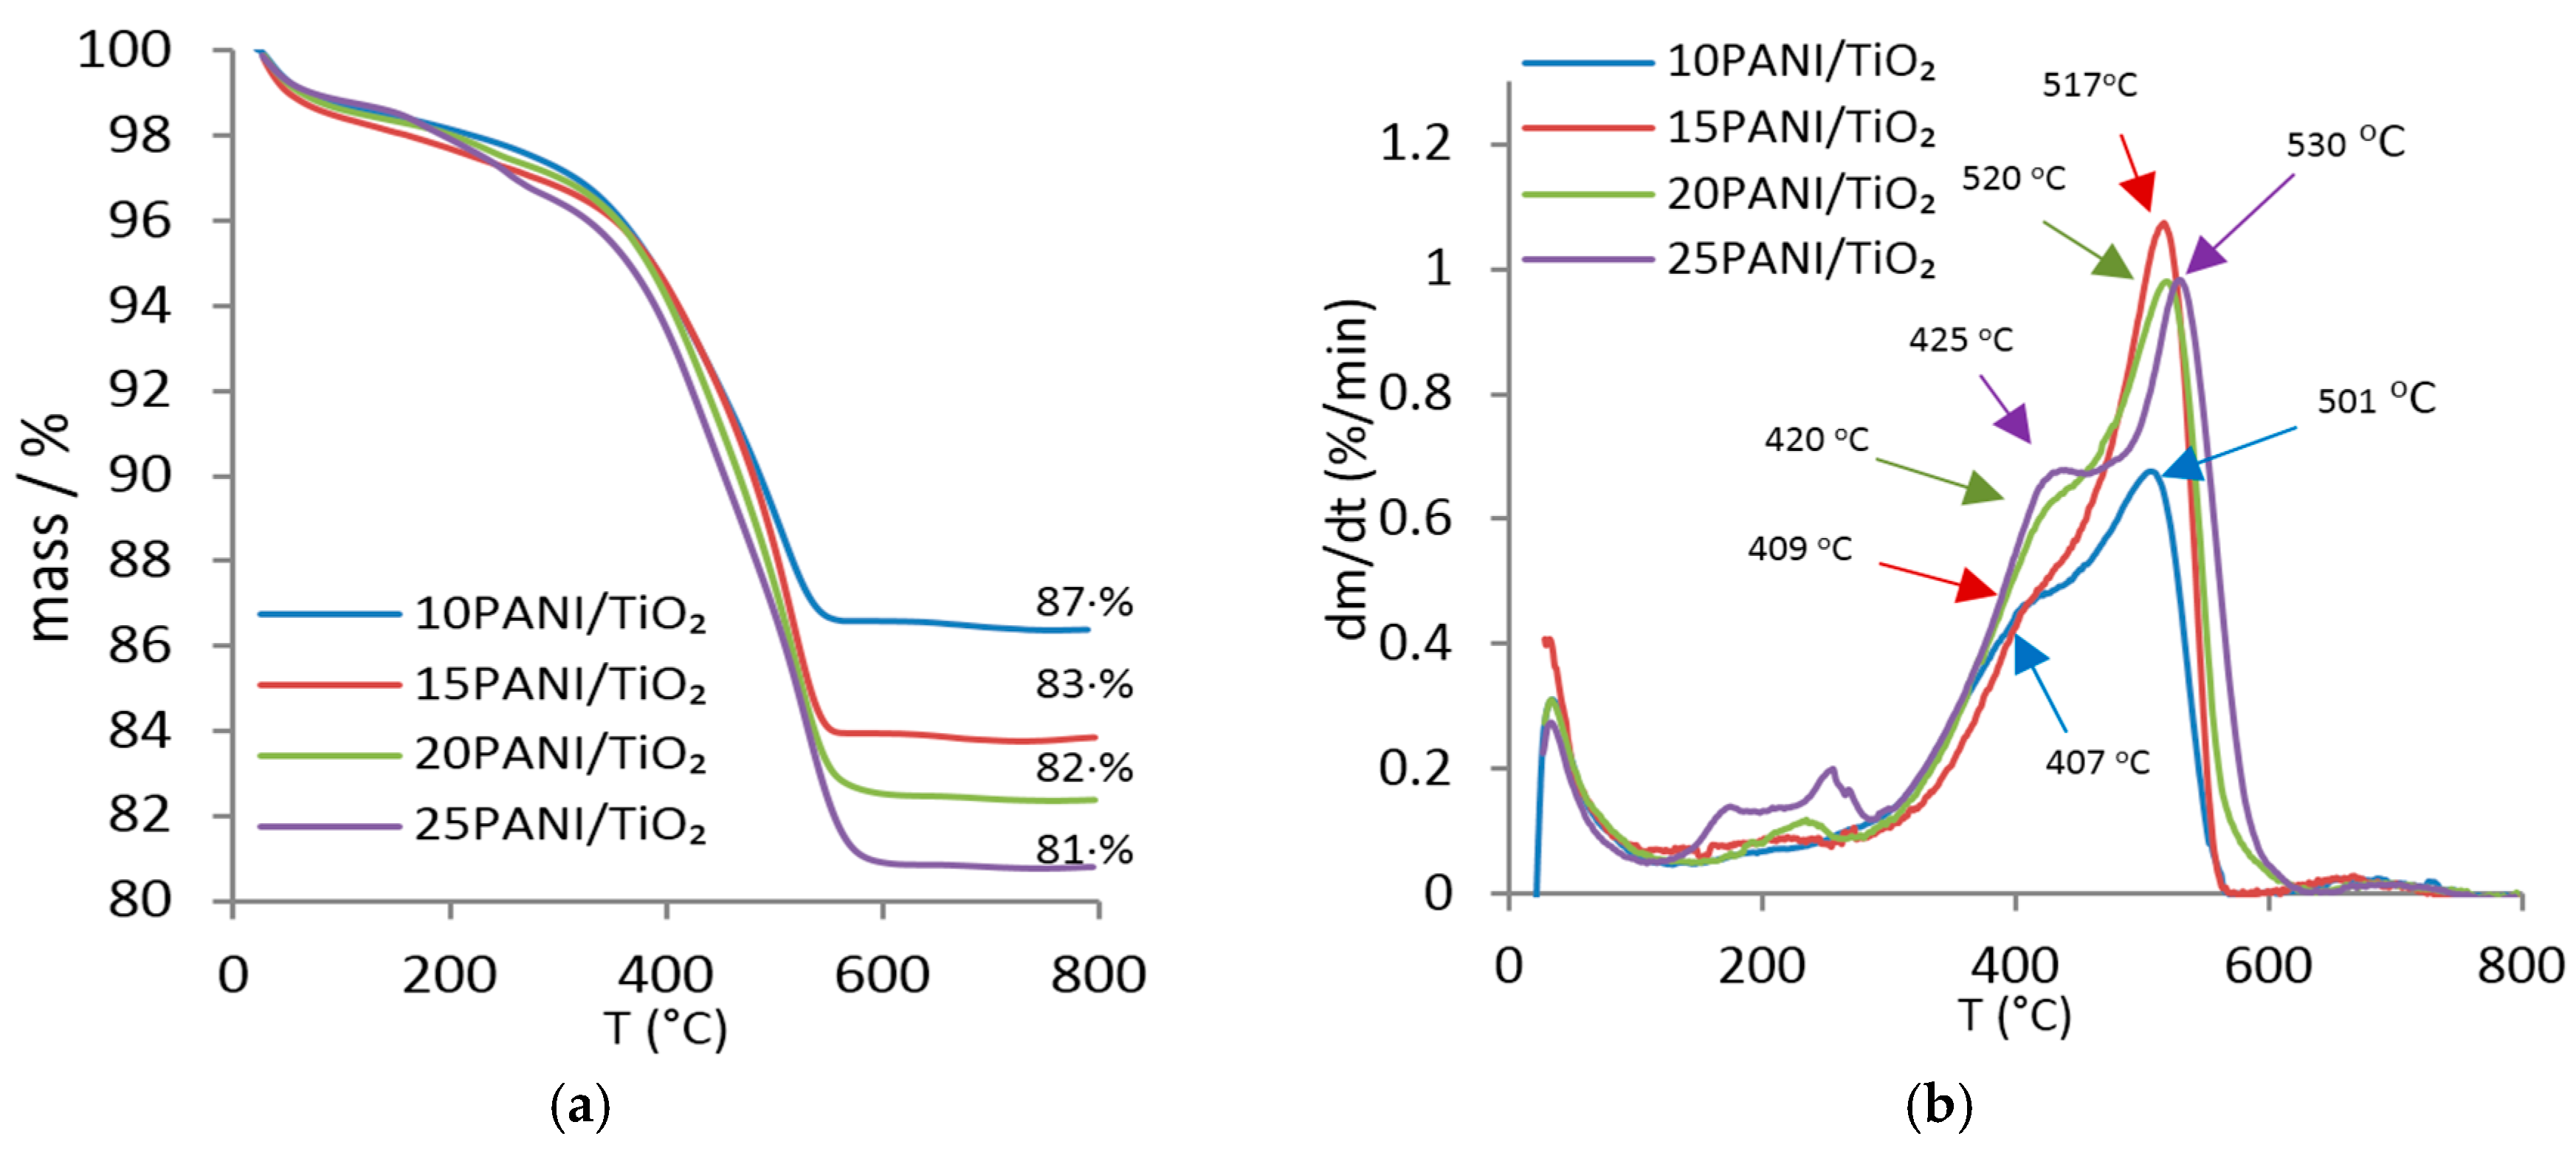
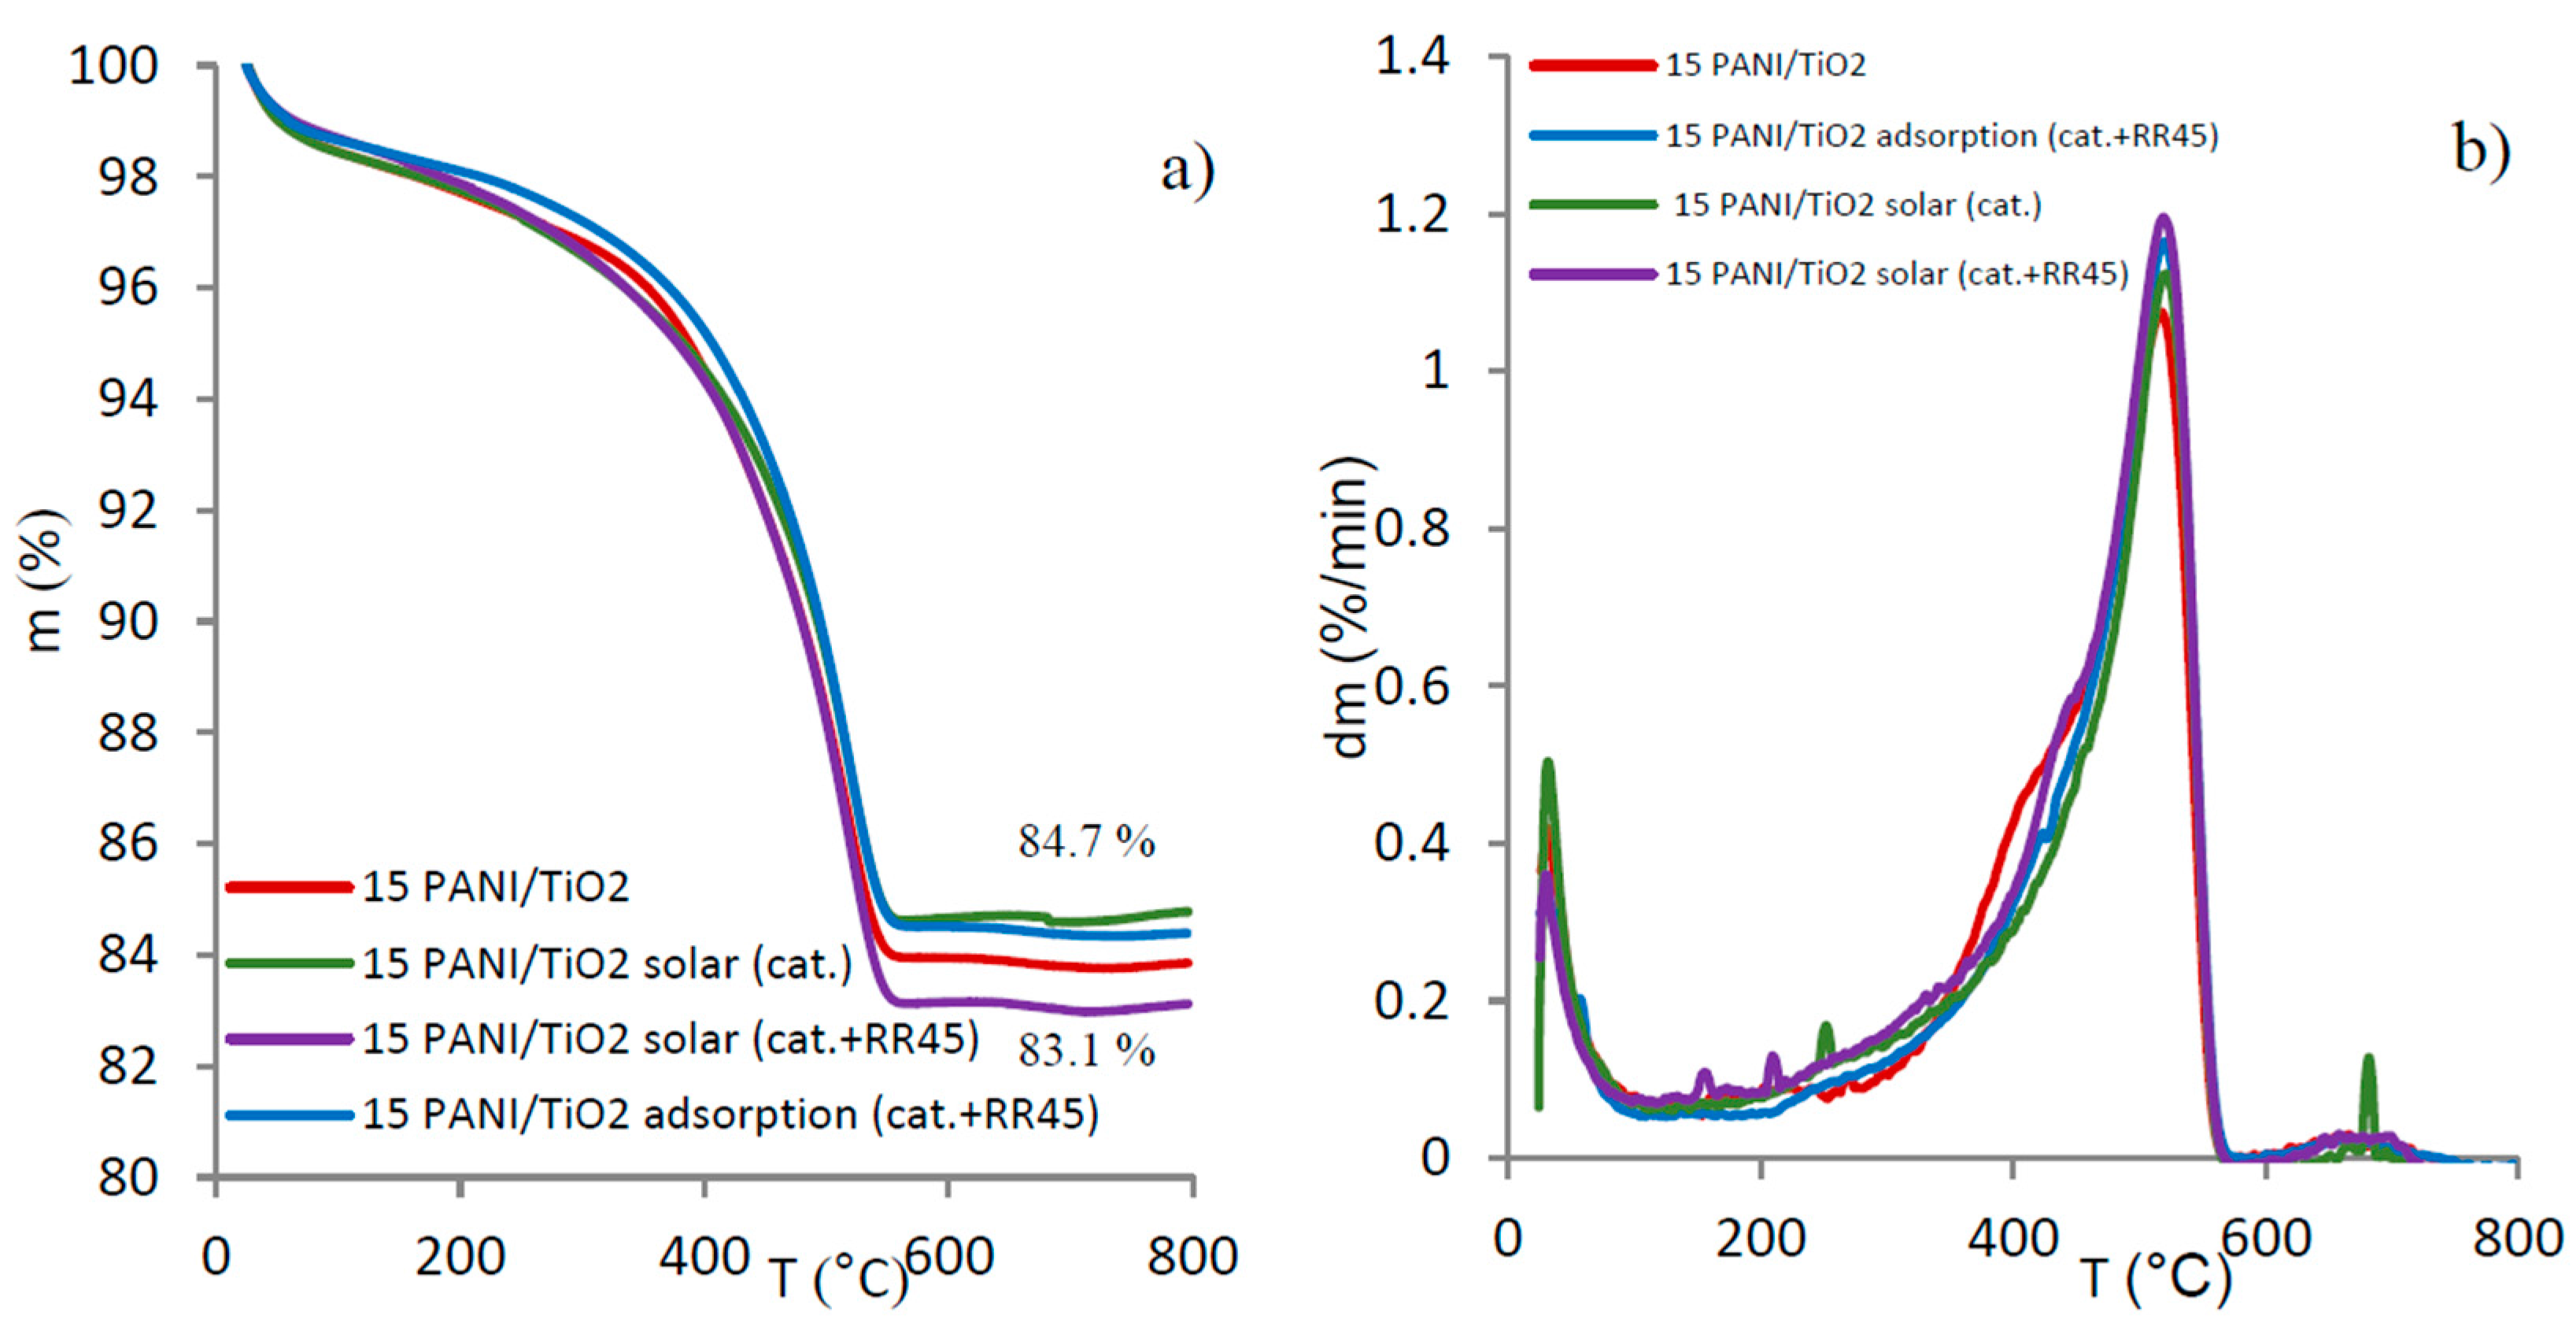
3.2. TG Analyses of Photocatalysts

In order to inspect the amount and stability of PANI in composites, the thermal decomposition of PANI/TiO2 photocatalysts was investigated by TG in a nitrogen atmosphere (Figure 2). The TG curves in Figure 2a suggest that the PANI mass loss occurred in one step, from 30 °C to 600 °C. Furthermore, it can also be seen that the char residue, containing mainly TiO2 particles, declined with increasing PANI amount. However, a more detailed inspection of the dTG curves in Figure 2b suggest that decomposition processes occurred in three different temperature stages.
The first stage, which was similar for all samples, can be attributed to water loss up to 160 °C. The second stage, from 160 °C to 400 °C shows the removal of dopant and imperfections (i.e., oligomers and products with amino groups in the ortho-position) [25]. Finally, the third stage (from 400 °C) is characterized by thermal decomposition (i.e., stability) of the main PANI chains [26]. It is well-known that conductive PANI begins to decompose at 370 °C under air conditions [27]. However, in nitrogen (vs. air) atmosphere, the PANI chain structure decomposes at higher temperatures (>400 °C) which indicates greater thermal stability (Figure 2b) [13,25,28]. The dTG curves show that the 25PANI/TiO2 sample, with the highest shoulder, experienced the most significant mass loss in the second stage, due to the highest concentration of dopants and imperfections (Figure 2b).
Samples 10PANI/TiO2 and 20PANI/TiO2 presented shoulders in the second step and maxima positioned at 407 °C and 420 °C, respectively. On the other hand, the 15PANI/TiO2 composite was characterized by a single strong peak at 517 °C and by a small shoulder at 409 °C. It can be concluded that PANI chains of lower molar mass (and lower stability) decomposed in the second stage, whereas the third stage was characterised by disintegration of polymer chains of higher molar mass with greater temperature stability.
Furthermore, it is assumed that the concentration and chemical structure of PANI on TiO2 particles are the main factors impacting the PANI degradation rate. Figure 2b shows that 10PANI/TiO2 presented the lowest degradation rate (0.652%/min), while the highest degradation rate (1.075%/min) was observed for the 15PANI/TiO2 composite. However, when the PANI ratio was further increased, the 20–25PANI/TiO2 decomposition rate was reduced (≈0.98%/min). The decrease from 1.075 to ≈0.98%/min can be explained by the increase in PANI imperfection amount, which occurred due to the application of a higher aniline concentration. On the other hand, the low aniline concentration used to prepare 15PANI/TiO2, reduced PANI imperfections, which resulted in the highest composite decomposition rate.

3.3. Conductivity of Photocatalysts

The PANI/TiO2 composite conductivity varied with PANI concentration, according to the results shown in Table 2. The results indicate a slight variation in the 10–20PANI/TiO2 composite conductivity, whereas 25PANI/TiO2 had the lowest conductivity (1.70 × 10⁻⁶ S cm−1). According to the TG results, the lowest conductivity of the 25PANI/TiO2 composite was expected, due to the highest concentration of imperfections (Figure 2b). The lower conductivity may indicate that the main polymer chain of 25PANI/TiO2 is of a low degree of order. This arises from the fact that as the PANI chain is more linear, the diffusion of electrons along the chain is promoted, which consequently increases the DC conductivity [29,30,31].
In addition, the 10PANI/TiO2 sample had the lowest PANI amount, which consequently resulted in the lowest conductivity. It is evident for 10–20PANI/TiO2 samples, that the concentration of aniline monomers during in situ synthesis significantly affected the PANI amount in composites (Figure 2). Thus, an increase in composite conductivity (Table 2) occurred due to a higher amount of PANI in the composites.

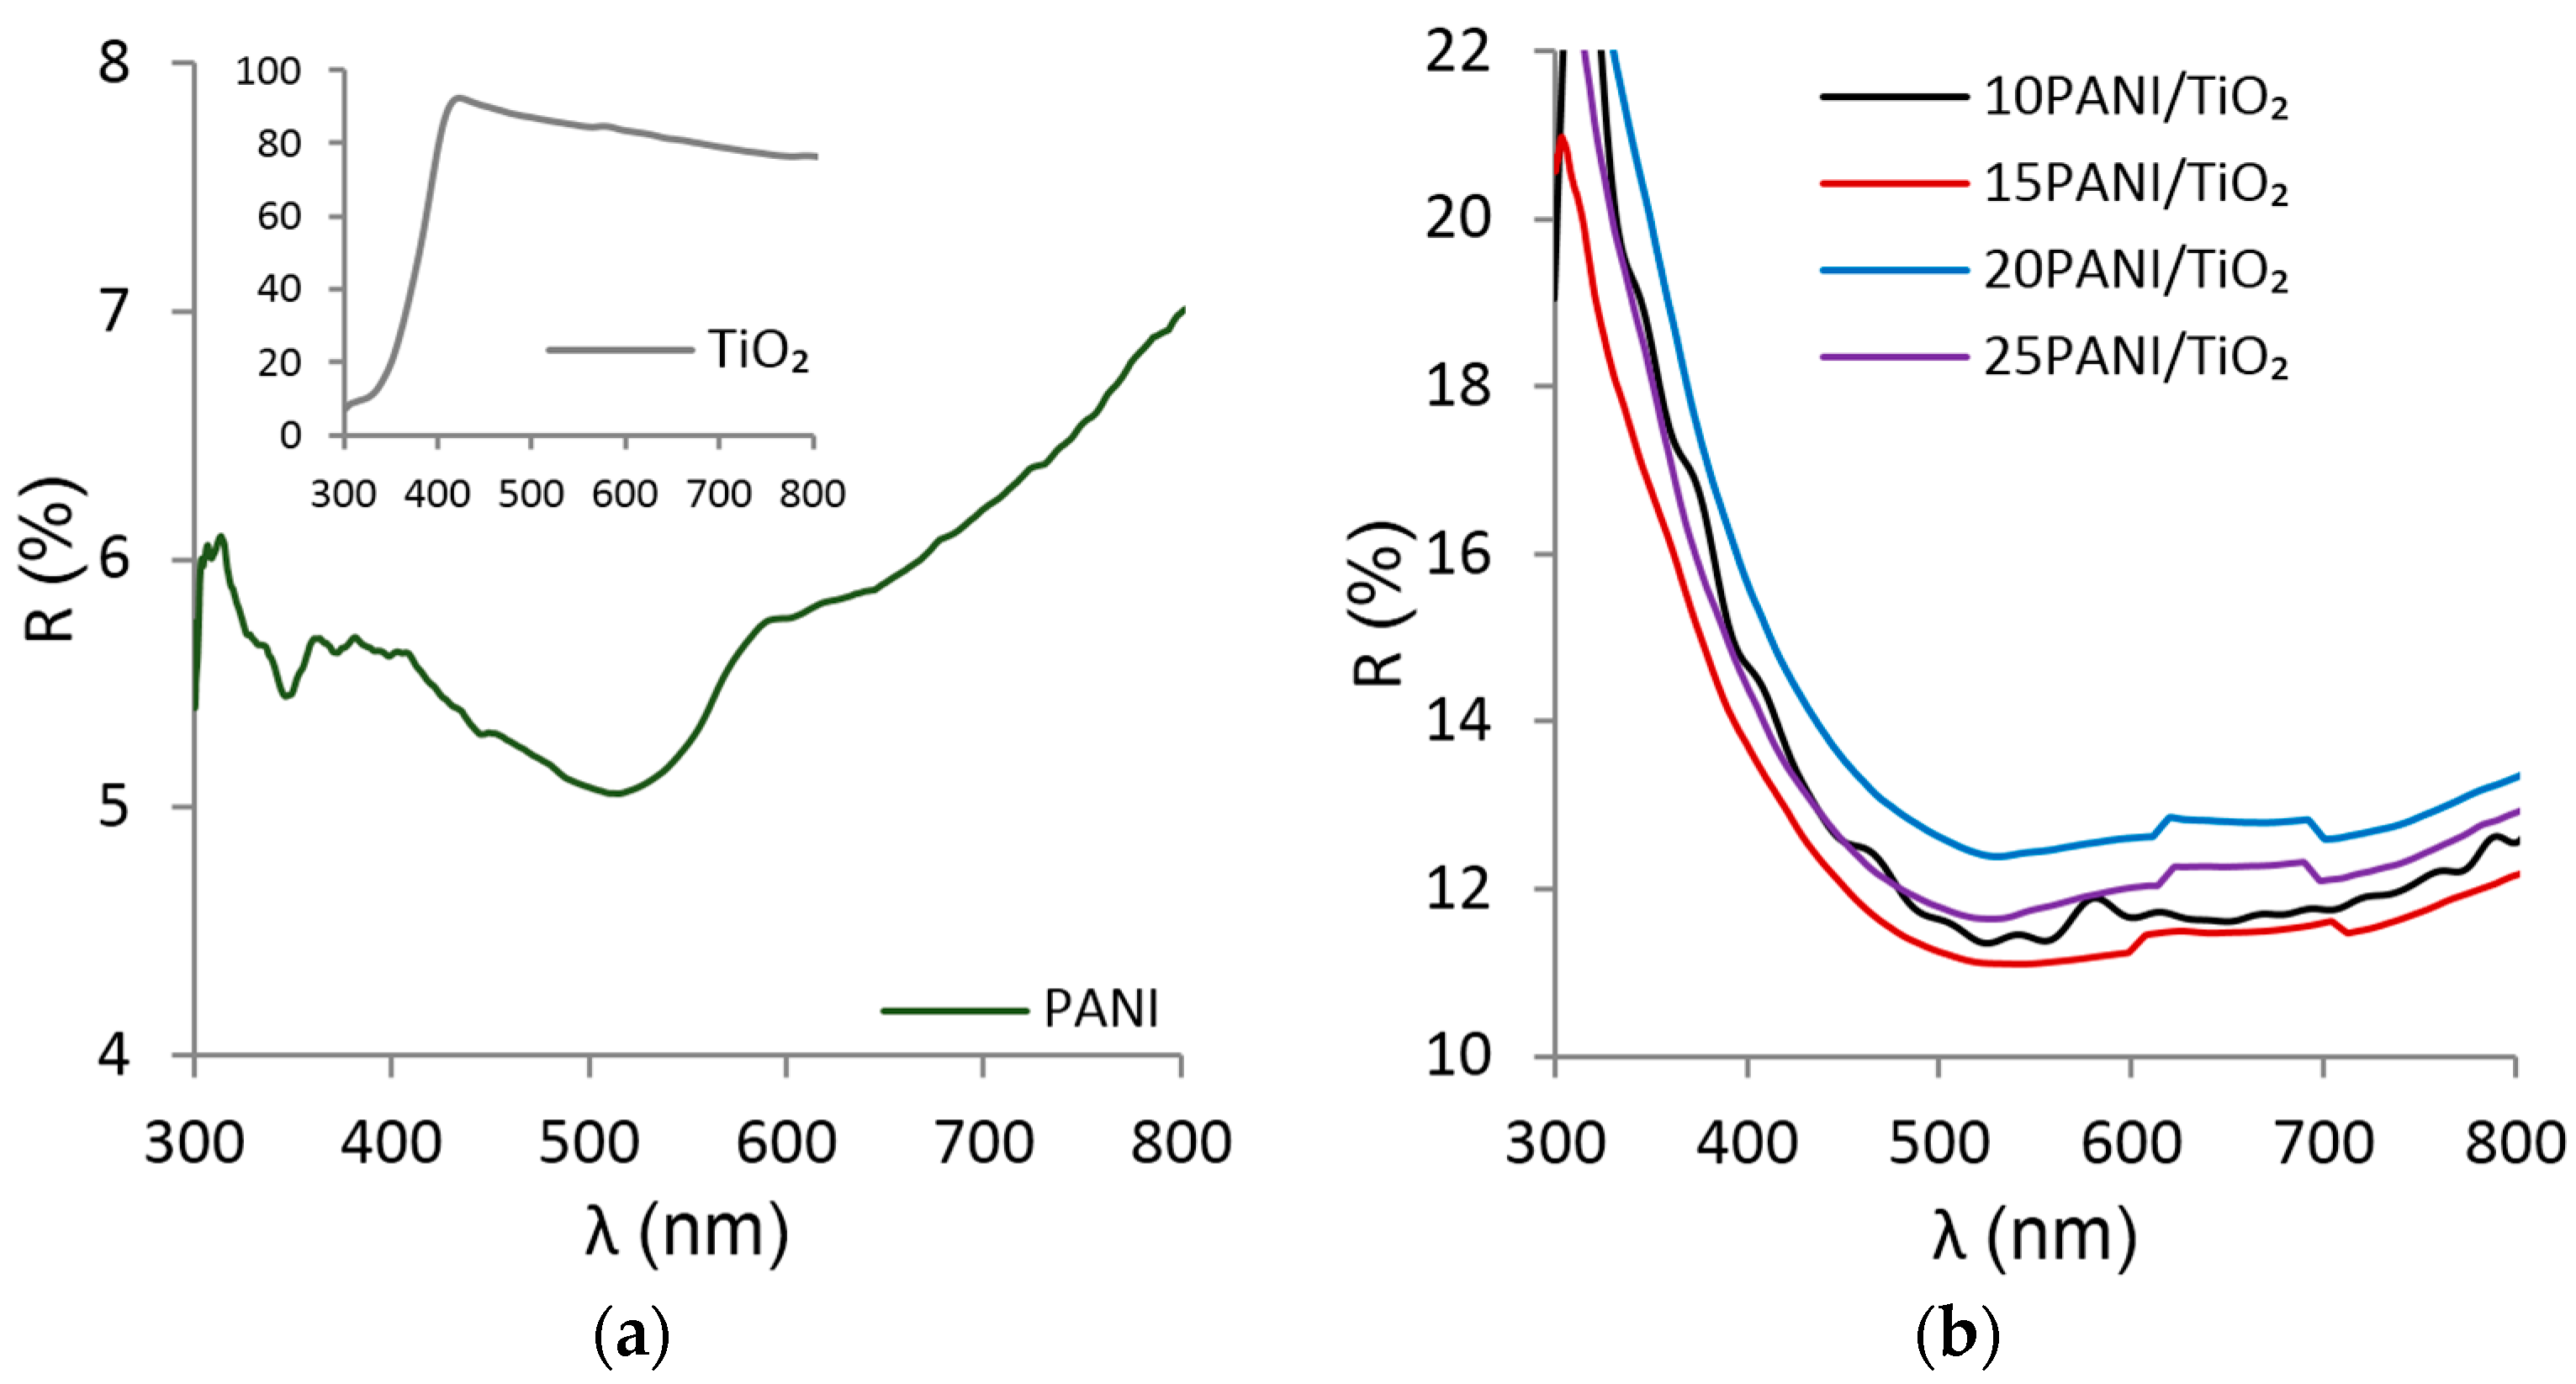
3.4. UV-Vis Spectra of the Photocatalysts

UV-Vis spectroscopy was used to characterize the synthesized PANI/TiO2 composite photocatalysts (Figure 3). The inset in Figure 3a indicates that pure TiO2 reflected >80% of the light in the Vis region (400–800 nm) in contrast to the pure PANI that reflected ≈6% (Figure 3a). However, the reflectance values of the PANI/TiO2 composites varied between those two extremes (i.e., pure PANI and pure TiO2). As PANI/TiO2 composites reflected a lower percentage of light than pure TiO2, it can be concluded that PANI was immobilized at the TiO2 surface.
Furthermore, the lowest intensity of reflected irradiation (≈11%) was observed for 15PANI/TiO2, which indicates that PANI homogenously covered the TiO2 surface. On the other hand, increased reflectance values for 20–25PANI/TiO2 (vs. 15PANI/TiO2) indicate a non-homogenous morphology, which was obtained due to a higher portion of imperfections, as verified by the TG analyses (Figure 2). Thus, the experimental conditions for 15PANI/TiO2 synthesis were optimal for yielding the homogeneous composite morphology.

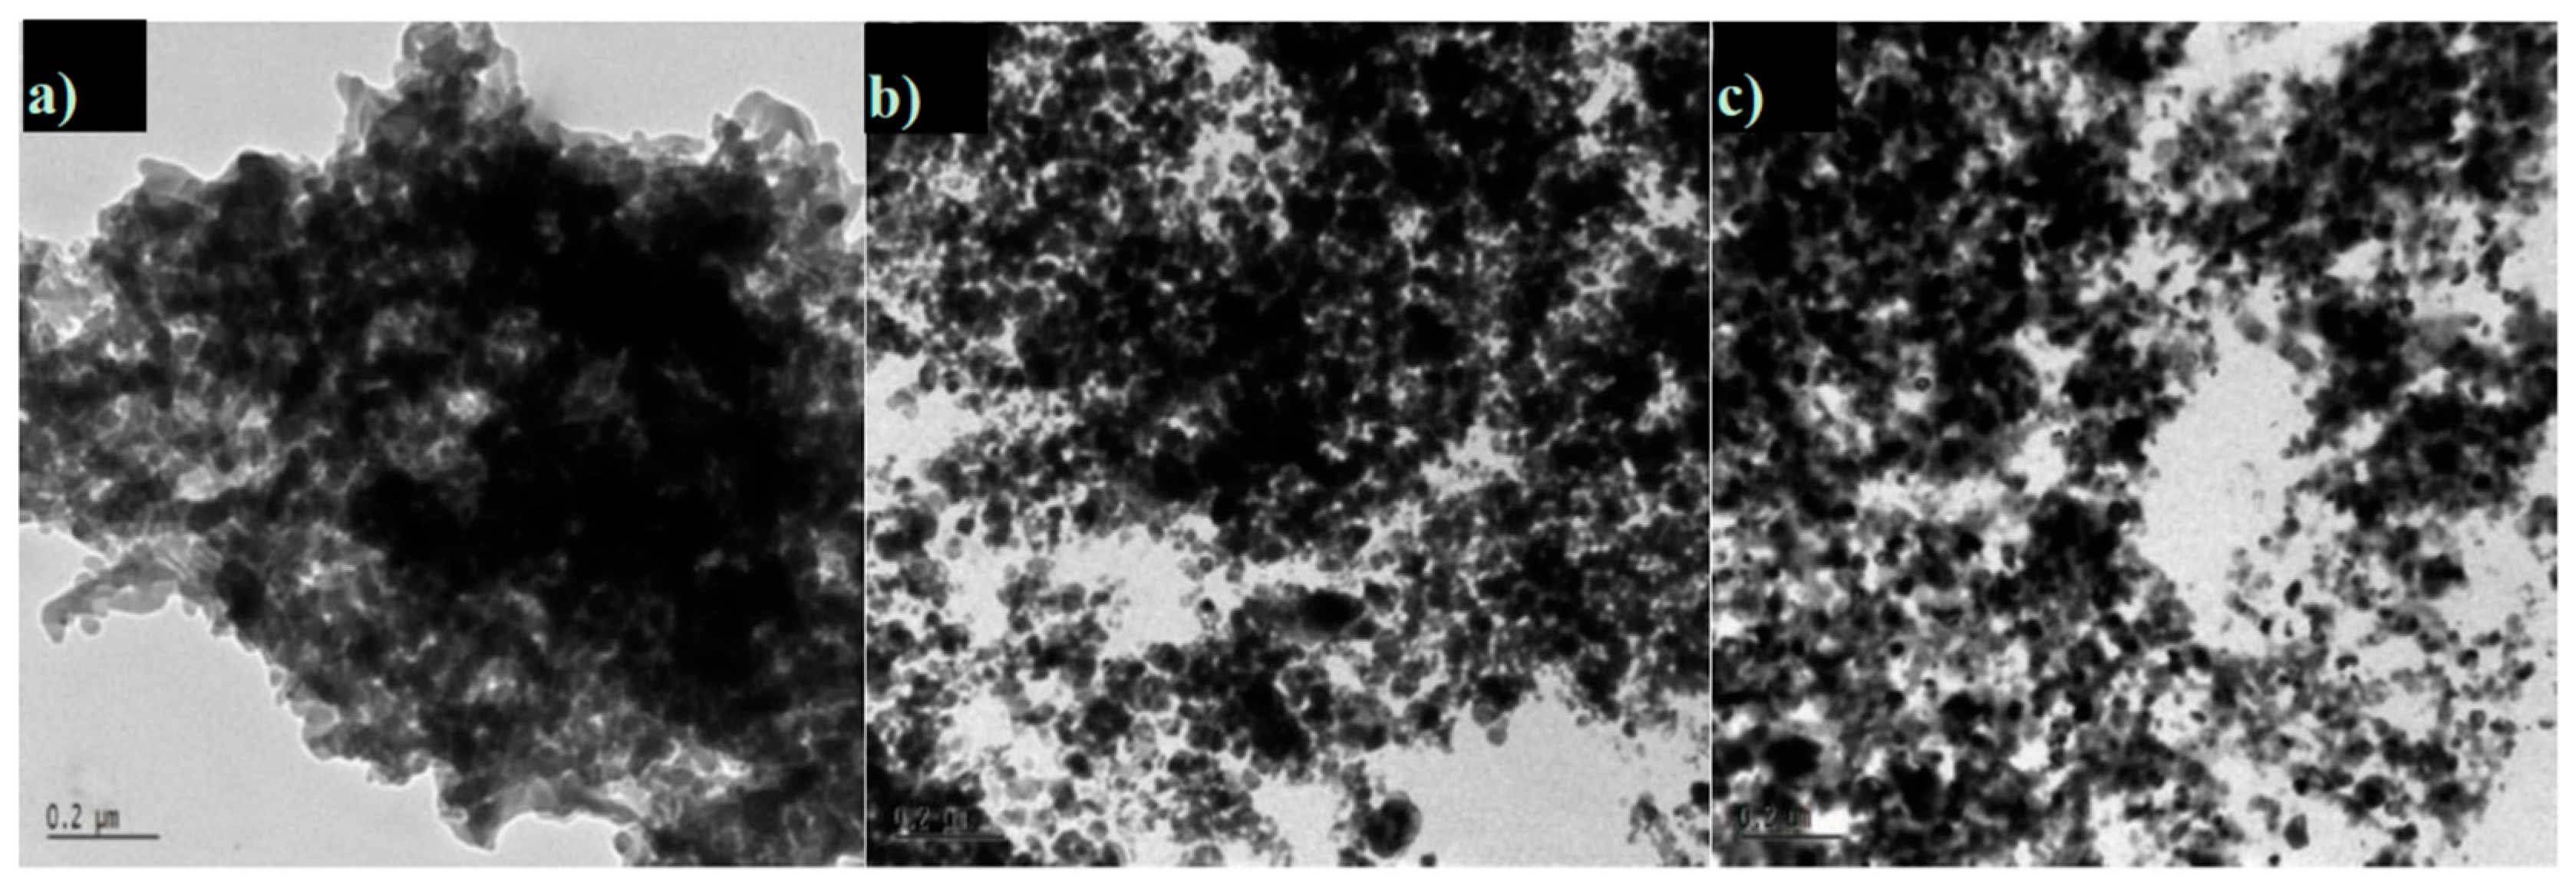
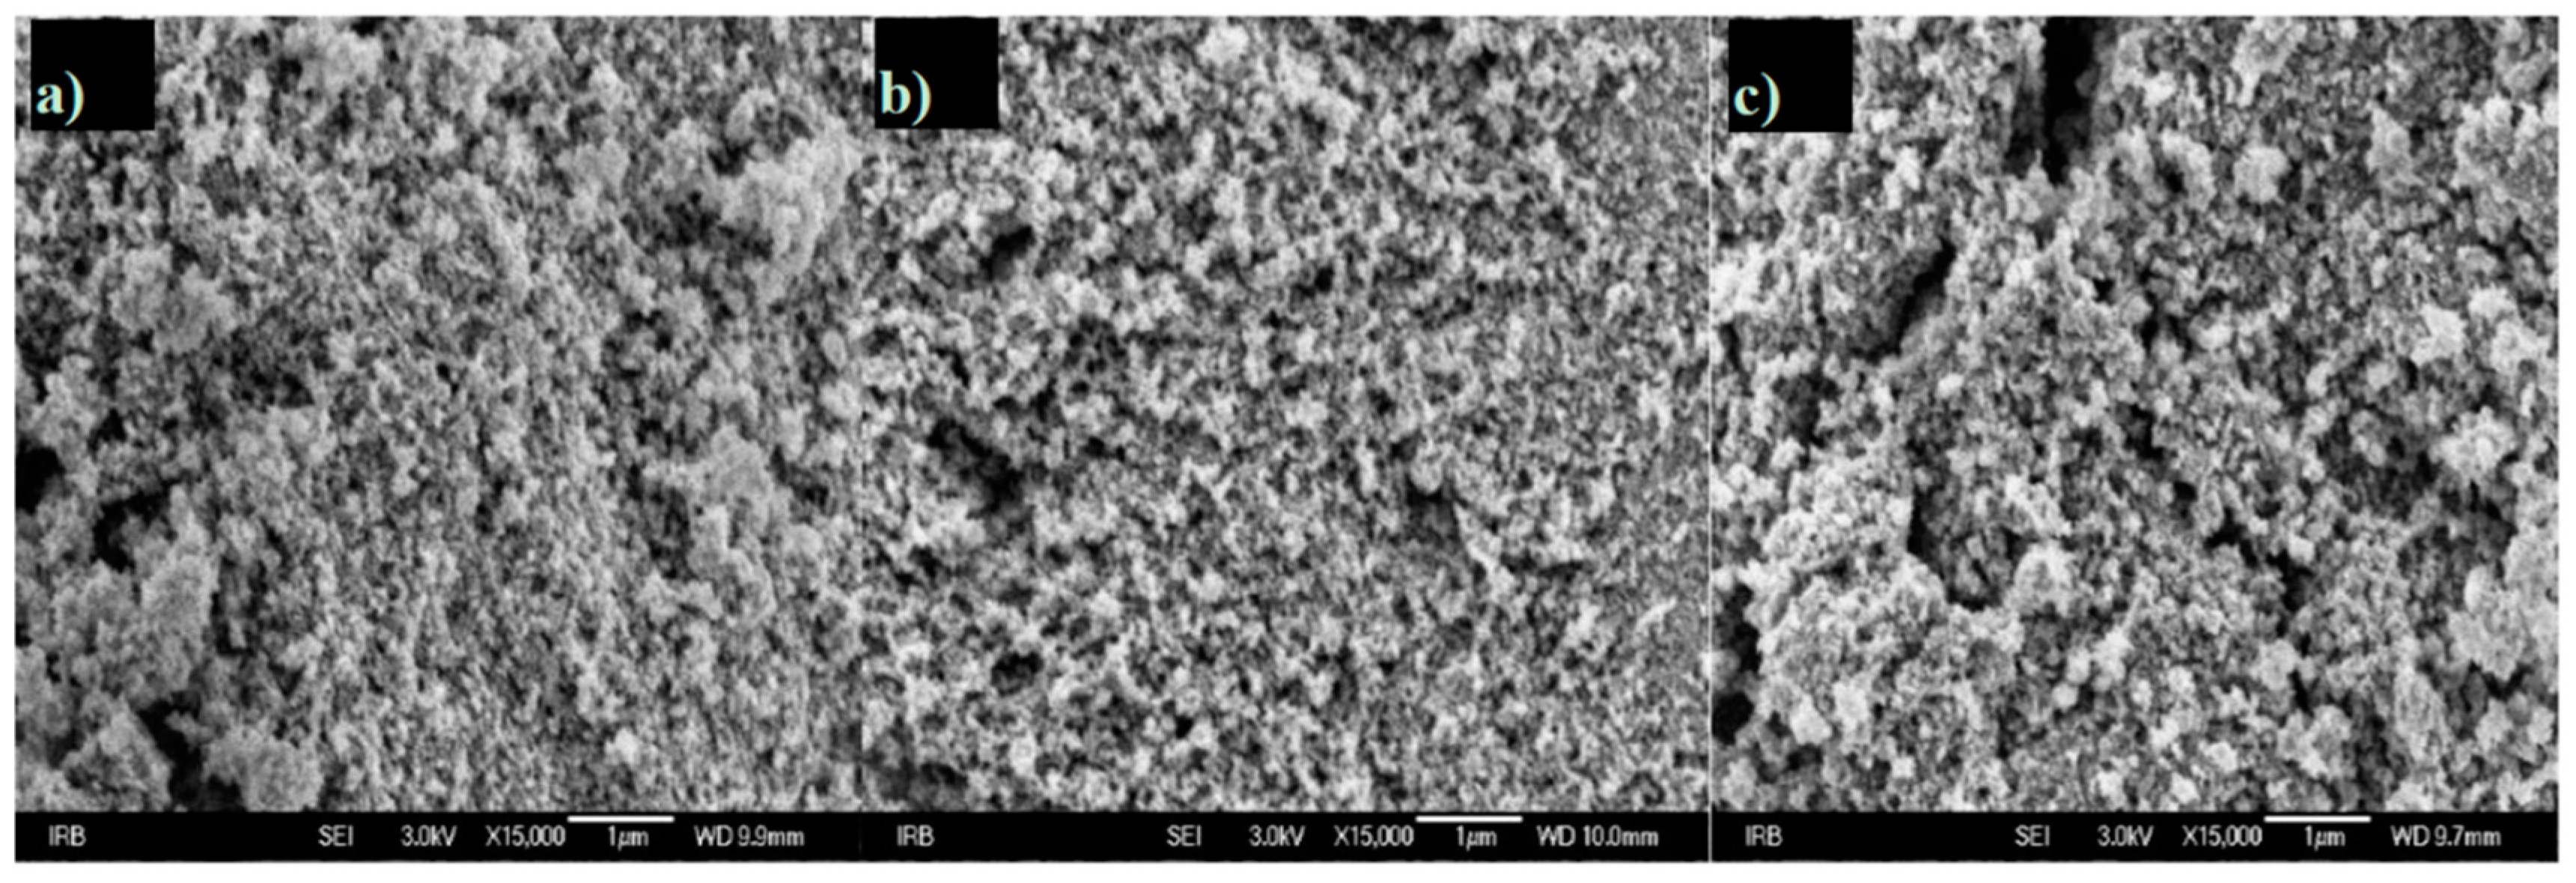
3.5. FE-SEM and TEM Analyses

The morphology of the 10–20PANI/TiO2 composites was analysed by FE-SEM and TEM and the micrographs are shown in Figure 4 and Figure 5. The SEM micrographs demonstrate composite aggregates of an average size of 200–1000 nm (Figure 4a–c), while the smallest ones (≈200 nm) are visible in the 15PANI/TiO2 composite (Figure 4b). Interestingly, the pure PANI agglomerates were not detected in Figure 4b, which agrees with conclusions that PANI in 15PANI/TiO2 mainly covers the TiO2 surface (see Section 3.4). Furthermore, the TEM images show that the aggregates are comprised of TiO2 particles with an average size of 10–20 nm (Figure 5a–c). The aggregate composition presented in Figure 5a–c corroborates previous literature reports [32], in which authors showed that the small (10–20 nm) TiO2 particles form large PANI/TiO2 aggregates.
The PANI/TiO2 photocatalytic activity can be severely decreased if large aggregates are formed, due to TiO2 particle collision. In this study, frequent TiO2 particle collisions were expected, as a rather high TiO2 concentration (4 g/L) was used. Figure 5a shows a large aggregate (≈1000 nm), which confirms that the collision of TiO2 particles occurred and contributed to the formation of large composite particles. However, the literature to date does not offer any explanation of how aniline concentration influences the PANI/TiO2 composite aggregation process. Therefore, the following discussion and Scheme 3 provide an insight into the impact of aniline concentration on the aggregation process.
It is well-known that organic (e.g., aniline) molecules create a barrier (i.e., barrier effect) to the aggregation process of TiO2 nanoparticles [33]. Thus, a low aniline concentration facilitates the formation of large aggregates (Figure 5a). As expected, when the aniline concentration was augmented, the aggregate size was reduced to ≈200 nm (Figure 4b). Therefore, it is evident that an increased aniline amount hindered the TiO2 aggregation process. Furthermore, to facilitate the analyses in this work, the barrier effect was presented in the form of the “inverse” barrier effect (Scheme 3).
Scheme 3 shows that an increase in aniline concentration yields smaller aggregate sizes, due to a lower inverse barrier effect. Unexpectedly, Figure 4c indicates that a further increase in monomer concentrations resulted in a larger aggregates size (≈350 nm). Furthermore, Figure 4 and Figure 5 suggest that the aggregate size is not governed only by the barrier effect. Thus, it can be concluded that the different synthesis products (i.e., imperfections) have an impact on the aggregate size, as presented in Scheme 3.
In acidic media (pH < 2.5), the aniline oxidation (without the presence of TiO2 particles) can produce (i) granules; (ii) layers; (iii) oligomers; (iv) dispersion of pure polymer in solution or (v) products with amino groups in the ortho-position [16]. In this study, due to a higher aniline concentration, a high portion of imperfections (i.e., oligomers and products with amino groups in the ortho-position [16]), was obtained in the 20–25PANI/TiO2 composites. For example, the presence of monomers with amino groups in the ortho-position in a synthesis solution can facilitate PANI chain branching [19,31]. Thus, branching through ortho-positions might facilitate connections between small composite particles in 20PANI/TiO2 (Figure 4c). Consequently, both the low aniline concentration in 10PANI/TiO2 (Figure 4a) and the high imperfection amount in 20PANI/TiO2 (Figure 4c) supports the aggregation process (Scheme 3). Therefore, it can be concluded that 15PANI/TiO2 was synthesized under optimal conditions that enabled the formation of a uniform, imperfection-free PANI on the TiO2 particle surface, which produced both small composite sizes and a homogenous composite morphology (Figure 4b).

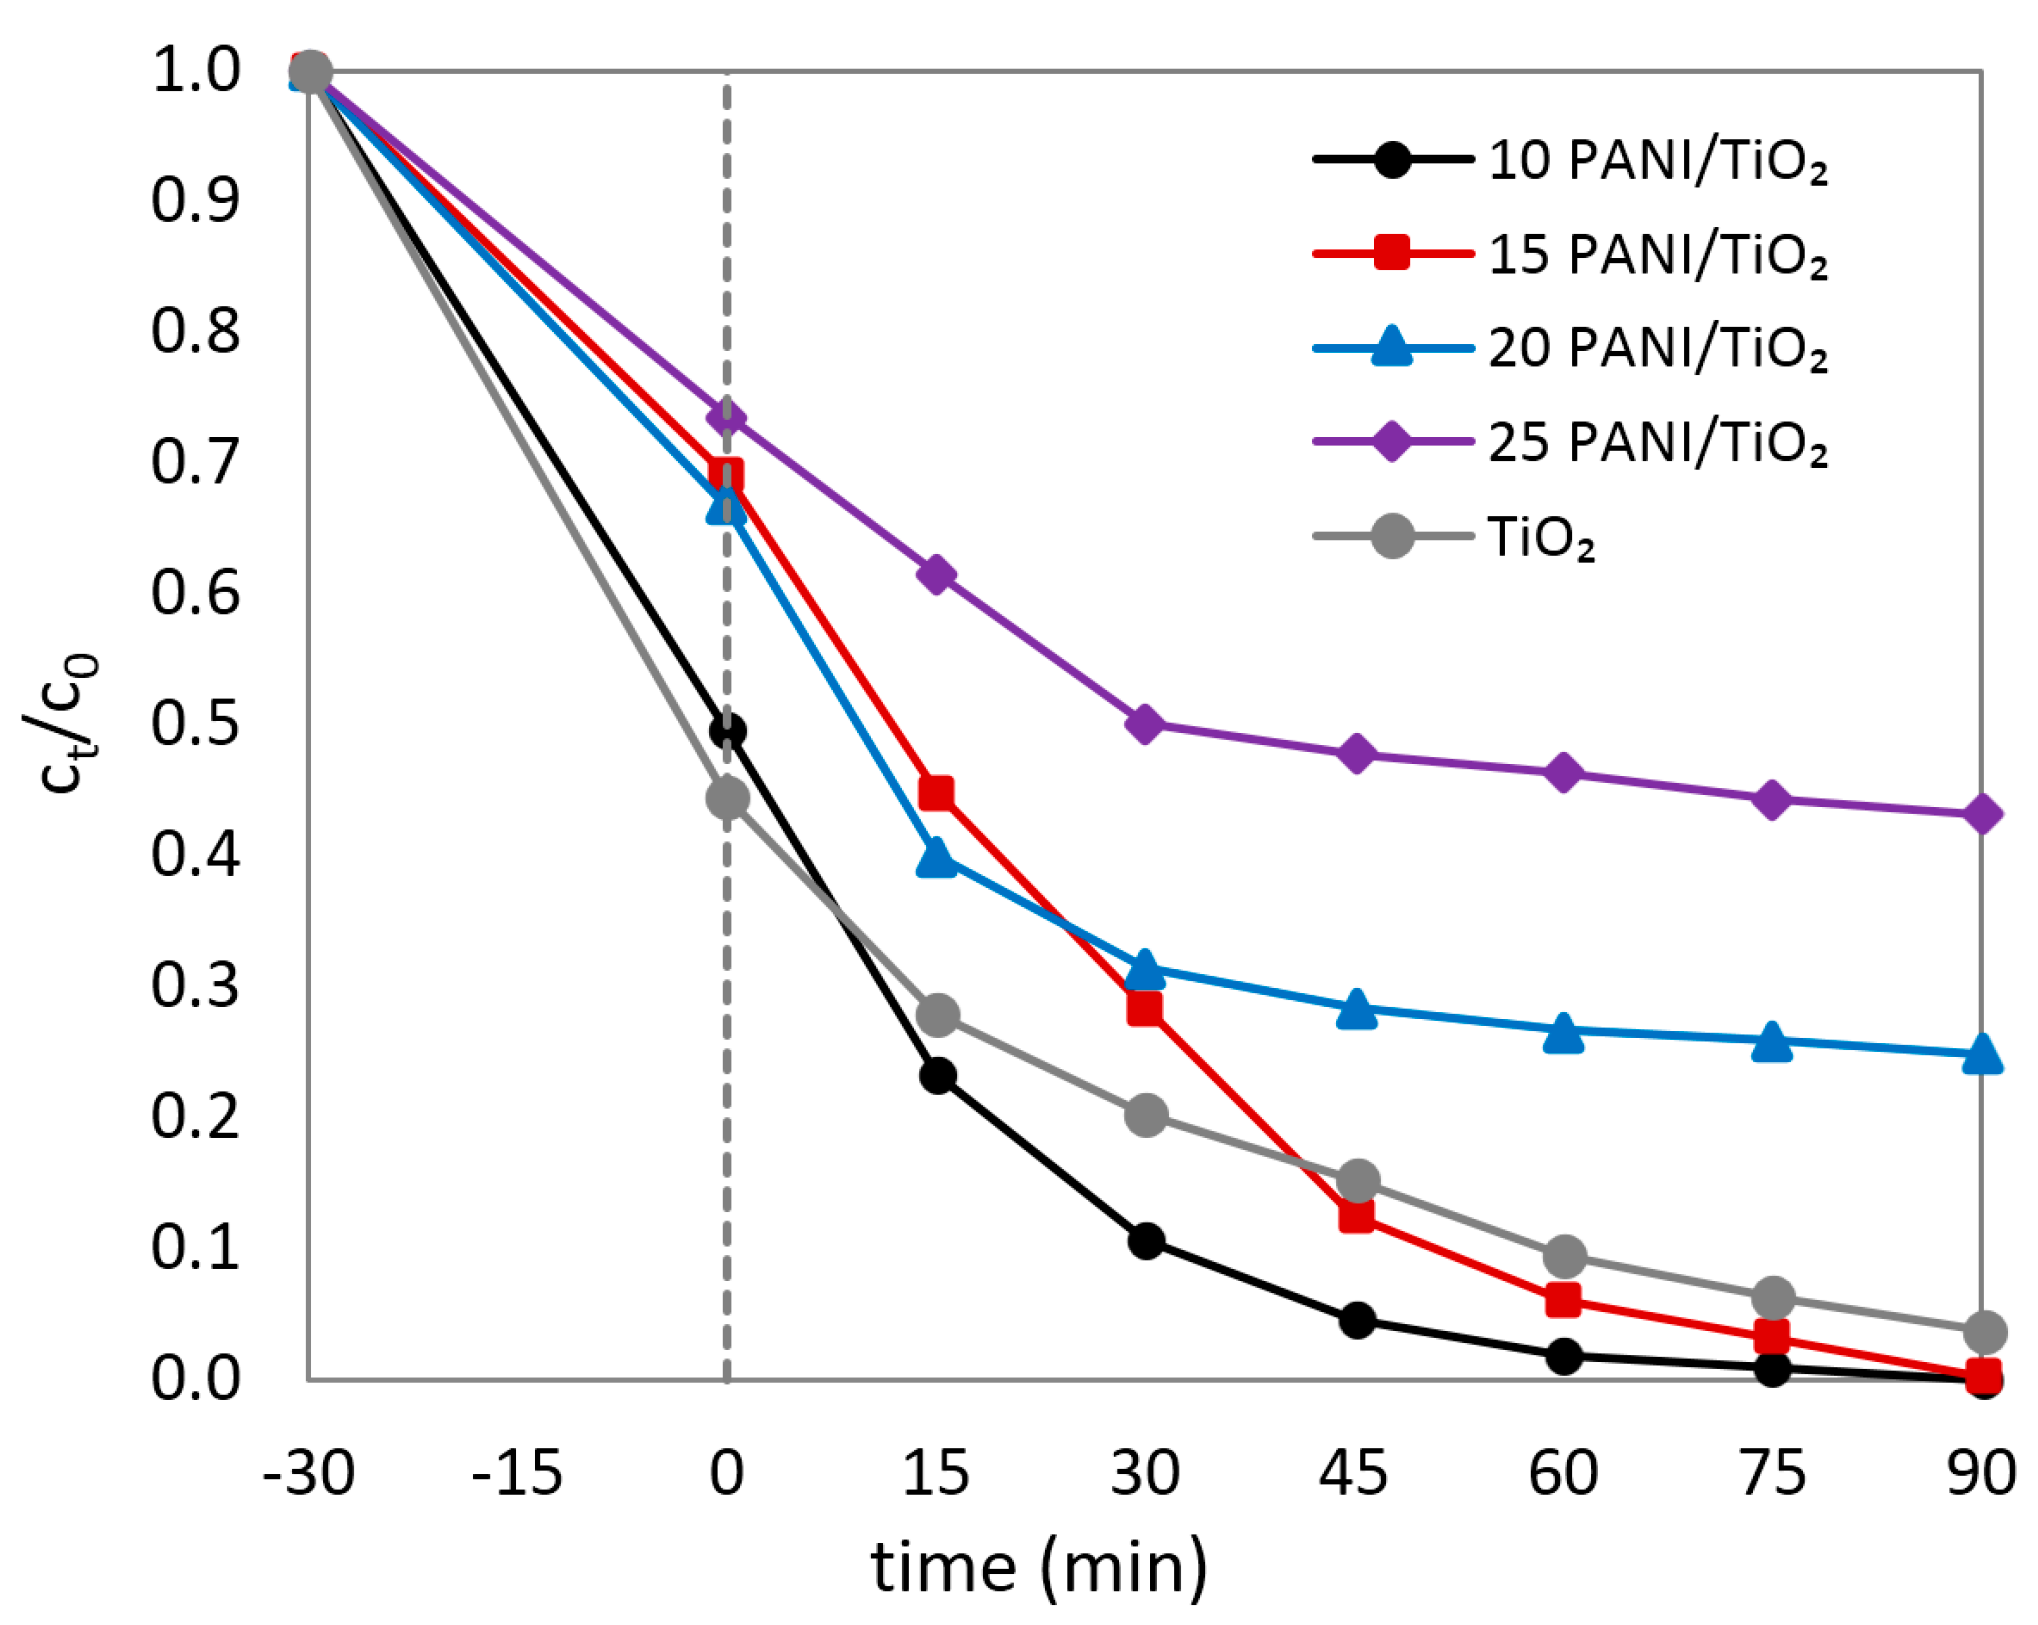
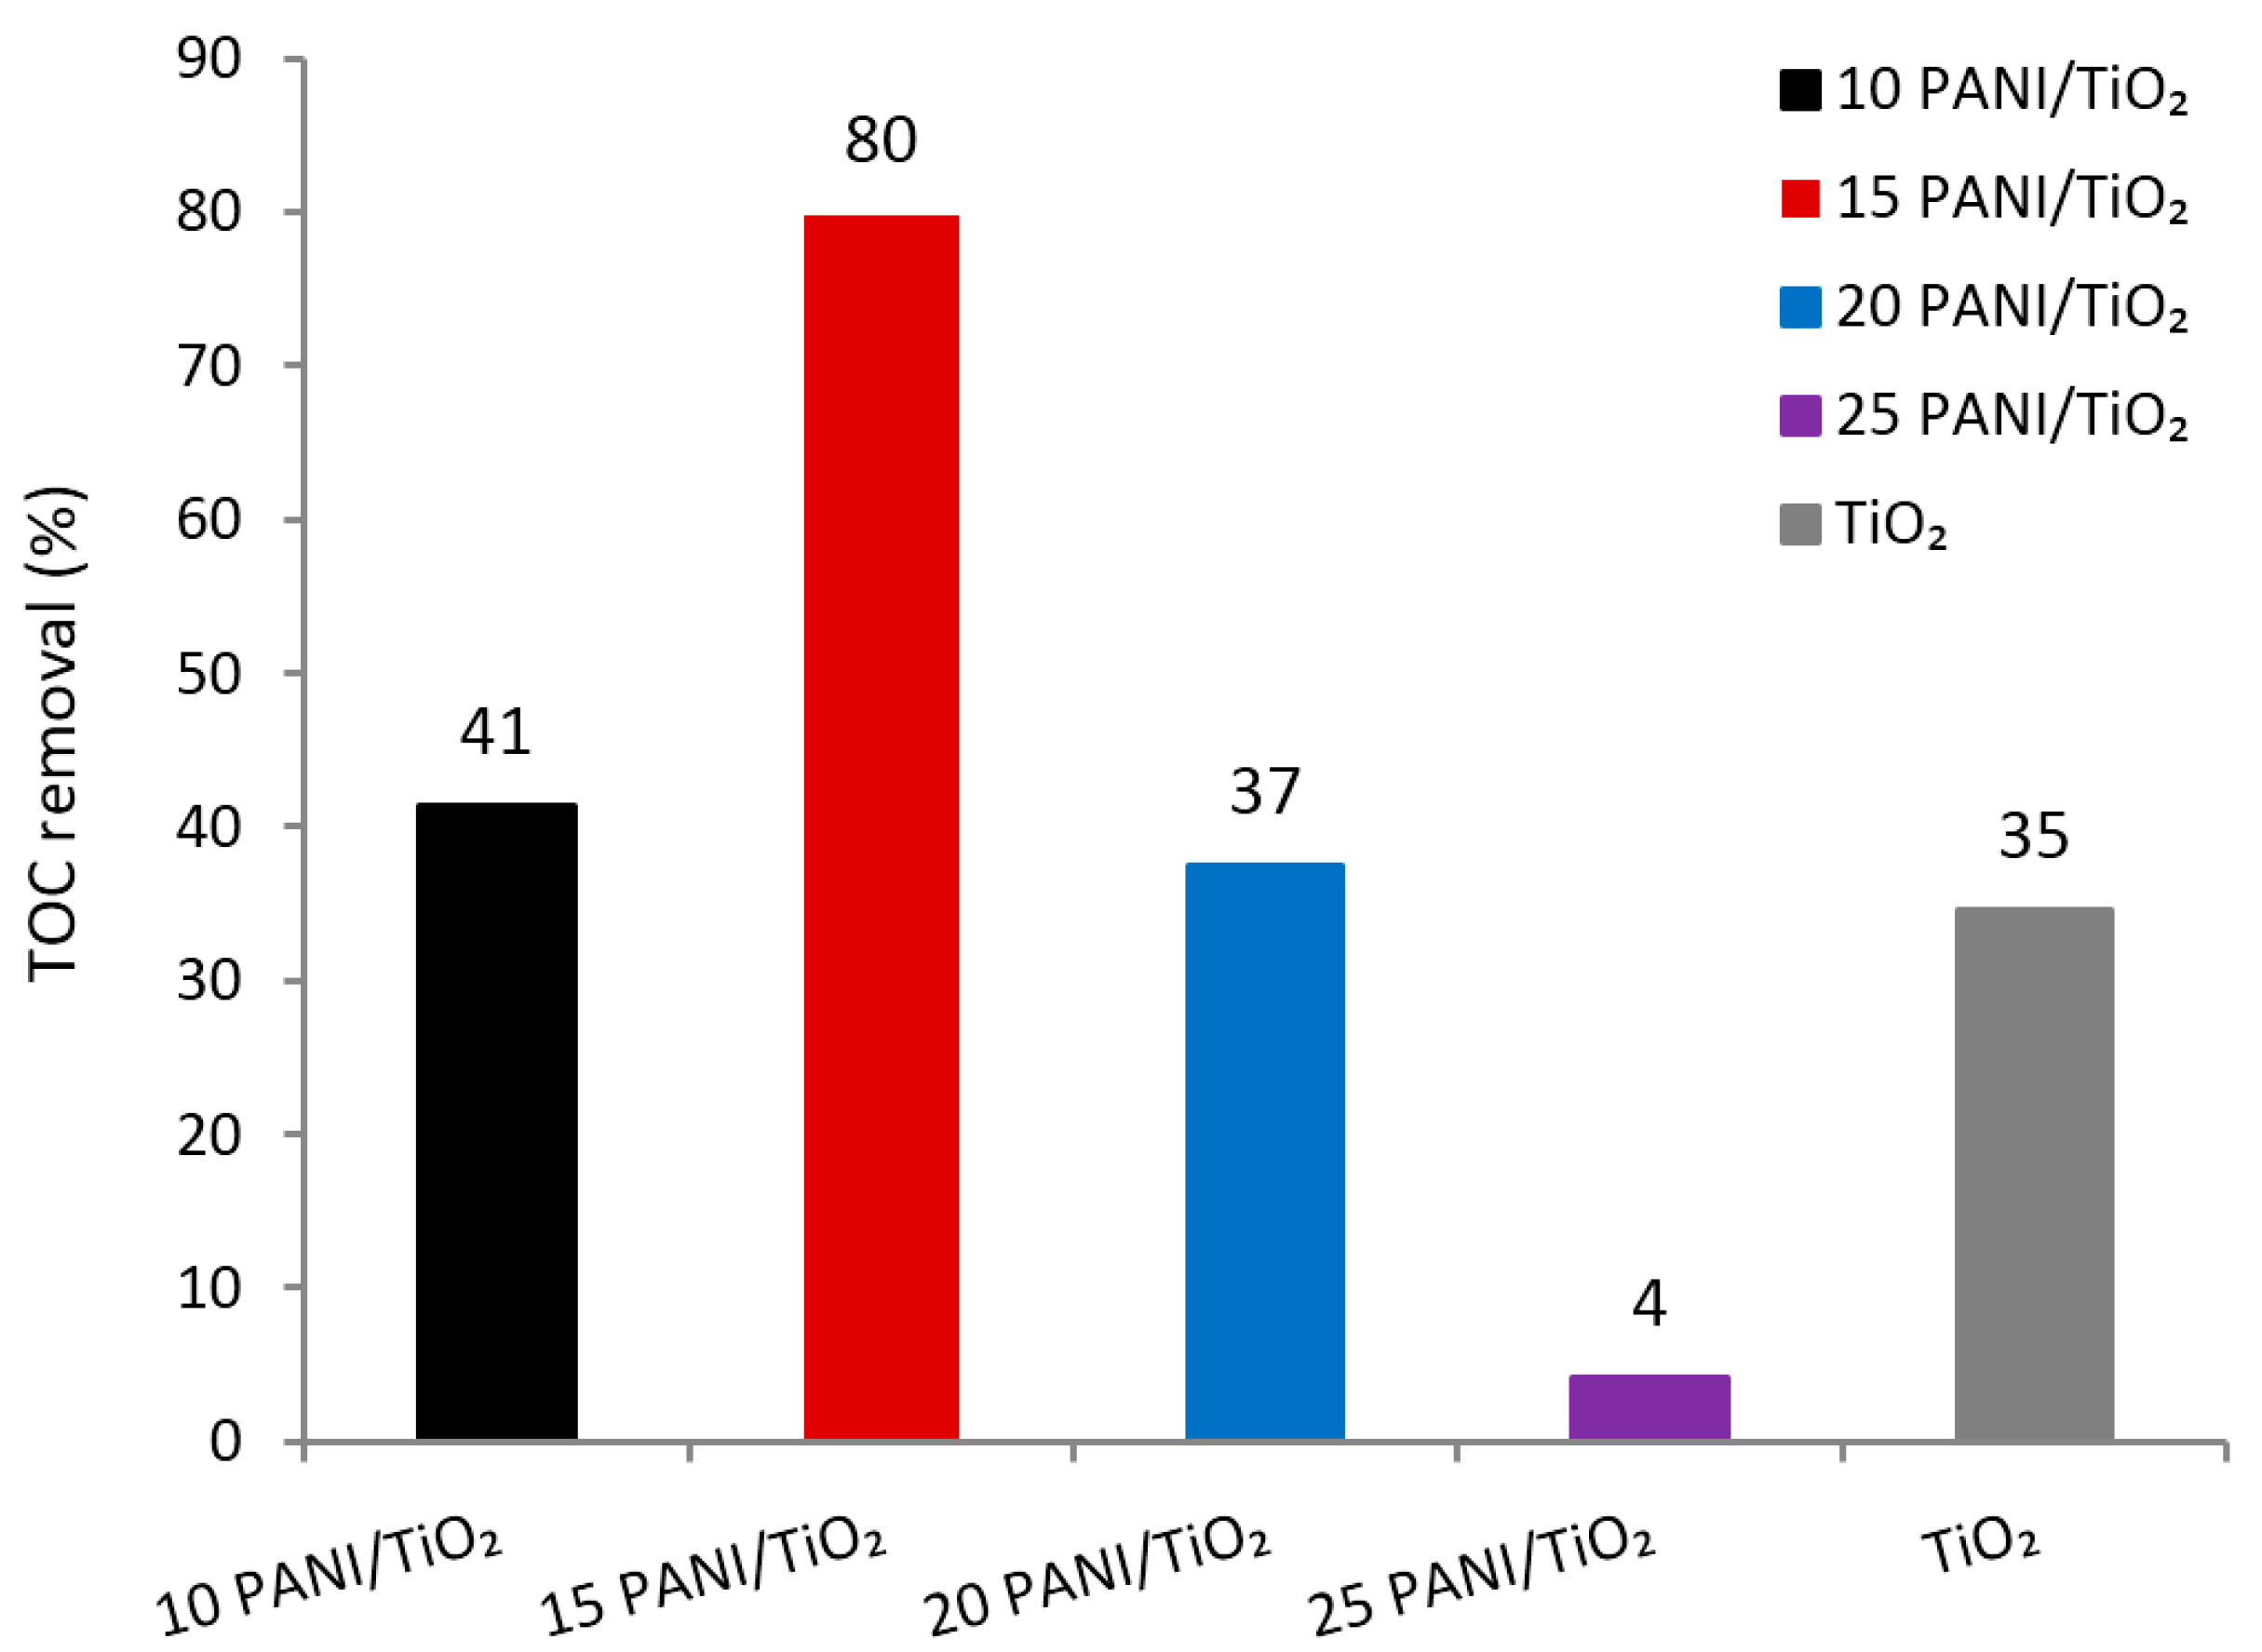
3.6. Photocatalysis under UVA

To validate the PANI/TiO2 photocatalytic properties, photocatalysis processes were performed under UVA irradiation. Wastewater was loaded with 30 mg/L of Reactive Red 45 azo dye (RR45), at pH 4 and the concentration of the catalyst was 1 g/L. It is necessary that the catalyst and pollutant establish an interaction, as the degradation process takes place on the catalyst surface. Thus, the adsorption process was performed for 30 min in the dark to obtain the adsorption/desorption equilibrium. The above approach is a common one, prior to exposing photocatalysts and dyes to UVA irradiation [11,13].
Figure 6 shows that pure TiO2 presented the highest ability to adsorb the dye, due to having the highest specific surface. On the other hand, the highest adsorption capacity was observed for 10PANI/TiO2, whilst the lowest adsorption capacity was detected for 25PANI/TiO2. However, the composites’ adsorption abilities are also governed by the chemical interaction of the negative anionic dyes (pH = 4) with the positively charged PANI chain [34]. Thus, differences in the composites adsorption abilities can be attributed to both the different structure of the PANI chain and to the different PANI ratio.
However, excessive concentrations of adsorbed pollutants on the catalyst surface can be a limiting factor during photocatalysis. This particular behaviour—i.e., postponed photocatalysis—was observed for the 15PANI/TiO2 composite photocatalyst, as only a small portion of RR45 was removed in a period of 15 min. Following this, the photocatalysis rate was faster, as 15PANI/TiO2 achieved 94% of discoloration in 60 min (Figure 6). The highest discoloration rate was achieved by the 10PANI/TiO2 composite, with 98% in 60 min, which is an improvement in comparison to pure TiO2 (92%). The same trend was observed after 90 min, i.e., the 10–15PANI/TiO2 samples presented almost identical photocatalyst properties that were enhanced, in comparison to pure TiO2 photocatalyst properties.
Furthermore, the 20–25PANI/TiO2 photocatalytic activity significantly differed, when compared to pure TiO2 and 10–15PANI/TiO2, which can be attributed to different PANI chain structures (see Figure 2). The presence of imperfections can omit the PANI chain stretching process [35,36], which decreases PANI conductivity. In addition, due to high aniline concentrations, oxidation products with amino groups in the ortho-position (i.e., imperfections) [16] might be formed, which can alert the PANI chain structure and consequently polymer-dye interactions [34]. Thus, it can be assumed that the presence of the imperfections severely reduced 20–25PANI/TiO2 photocatalytic properties (Figure 6). On the other hand, the higher photocatalytic activity of 10–15PANI/TiO2 (vs. pure TiO2) photocatalysts, obtained when the aniline concentration was lower, is explained by the PANI-TiO2 synergetic effect, which is promoted when PANI is conductive and free of imperfections.
The degradation of the chromophore group (–N=N–) of azo RR45 dye (Scheme 4) was determined by monitoring discoloration during photocatalysis (Figure 6), which does not necessarily indicate a degradation of complete dye molecules. Thus, to investigate the degree of mineralization of RR45 azo dye from harmless species, such as CO2 and H2O, it was necessary to determine the total organic carbon (TOC). The results are given as the percentage of removed RR45 dye, whilst the maximum dye load was taken as 100% of TOC. Furthermore, Figure 7 indicates that 80% of TOC was removed after photocatalytic degradation of RR45 using the 15PANI/TiO2 photocatalyst, which clearly indicates a better performance, in comparison to both TiO2 (35%) and 10PANI/TiO2 (41%).
The degree of degradation of the pollutant molecule (RR45 dye) depends on the conditions of photocatalysis (pH, RR45 load, catalyst concentration) and on the efficiency of the catalyst itself. Figure 6 shows that the most successful discoloration was obtained with the 10PANI/TiO2 catalyst, though monitoring a complete degradation of RR45 indicated that 15PANI/TiO2 catalyst was far more effective (Figure 7). Therefore, it is obvious that the 15PANI/TiO2 catalyst was more efficient in removing RR45 azo dye than TiO2 or other composite catalysts. This means that the photocatalytic wastewater treatment by 15PANI/TiO2 was successful, as the catalyst was not blocked by the decomposition products (intermediates), which can be very toxic [34].
According to a well-known TiO2 photocatalyst mechanism, which absorbs photons with energy higher than 3.2 eV (Equation (1)), the excited states of electron (eCB) and hole (hVB+) pairs are generated as follows [15]:
TiO2 + hν (<387 nm) → eCB + hVB+
where hVB+ is a powerful oxidizing agent that can mineralize dye to CO2 and H2O, according to the following equation:
hVB+ + dye → intermediates → CO2 + H2O.
Equation (2) represents one of the processes that might occur after exposing TiO2 to UV irradiation [15]. However, photocatalytic reaction can take place only if hVB+ and eCB are transported to the TiO2 surface [6]. Since PANI is a hole acceptor, the oxidative route (Equation (2)) would be additionally promoted, especially if the well-formed and homogenous PANI is formed on the TiO2 surface. It was previously explained (Section 3.4) that 15PANI/TiO2 is covered by homogenous PANI film, and thus, its photocatalytic activity was enhanced in comparison to other composites.
Furthermore, as the degradation process is not always complete, the formed intermediates can partially block the immobile TiO2 active sites [13]. On the other hand, PANI active sites are mobile [37] and so they are partially immune to the intermediate blockage. Since 15PANI/TiO2 (vs. TiO2) photocatalytic performances were improved, on this basis it can be assumed that PANI in composite also protected the TiO2 surface from the blockage of intermediates. Therefore, PANI facilitates the photocatalyst process by enabling the PANI-TiO2 synergetic effect, which decreases the hVB+ and eCB recombination process in TiO2 [13].

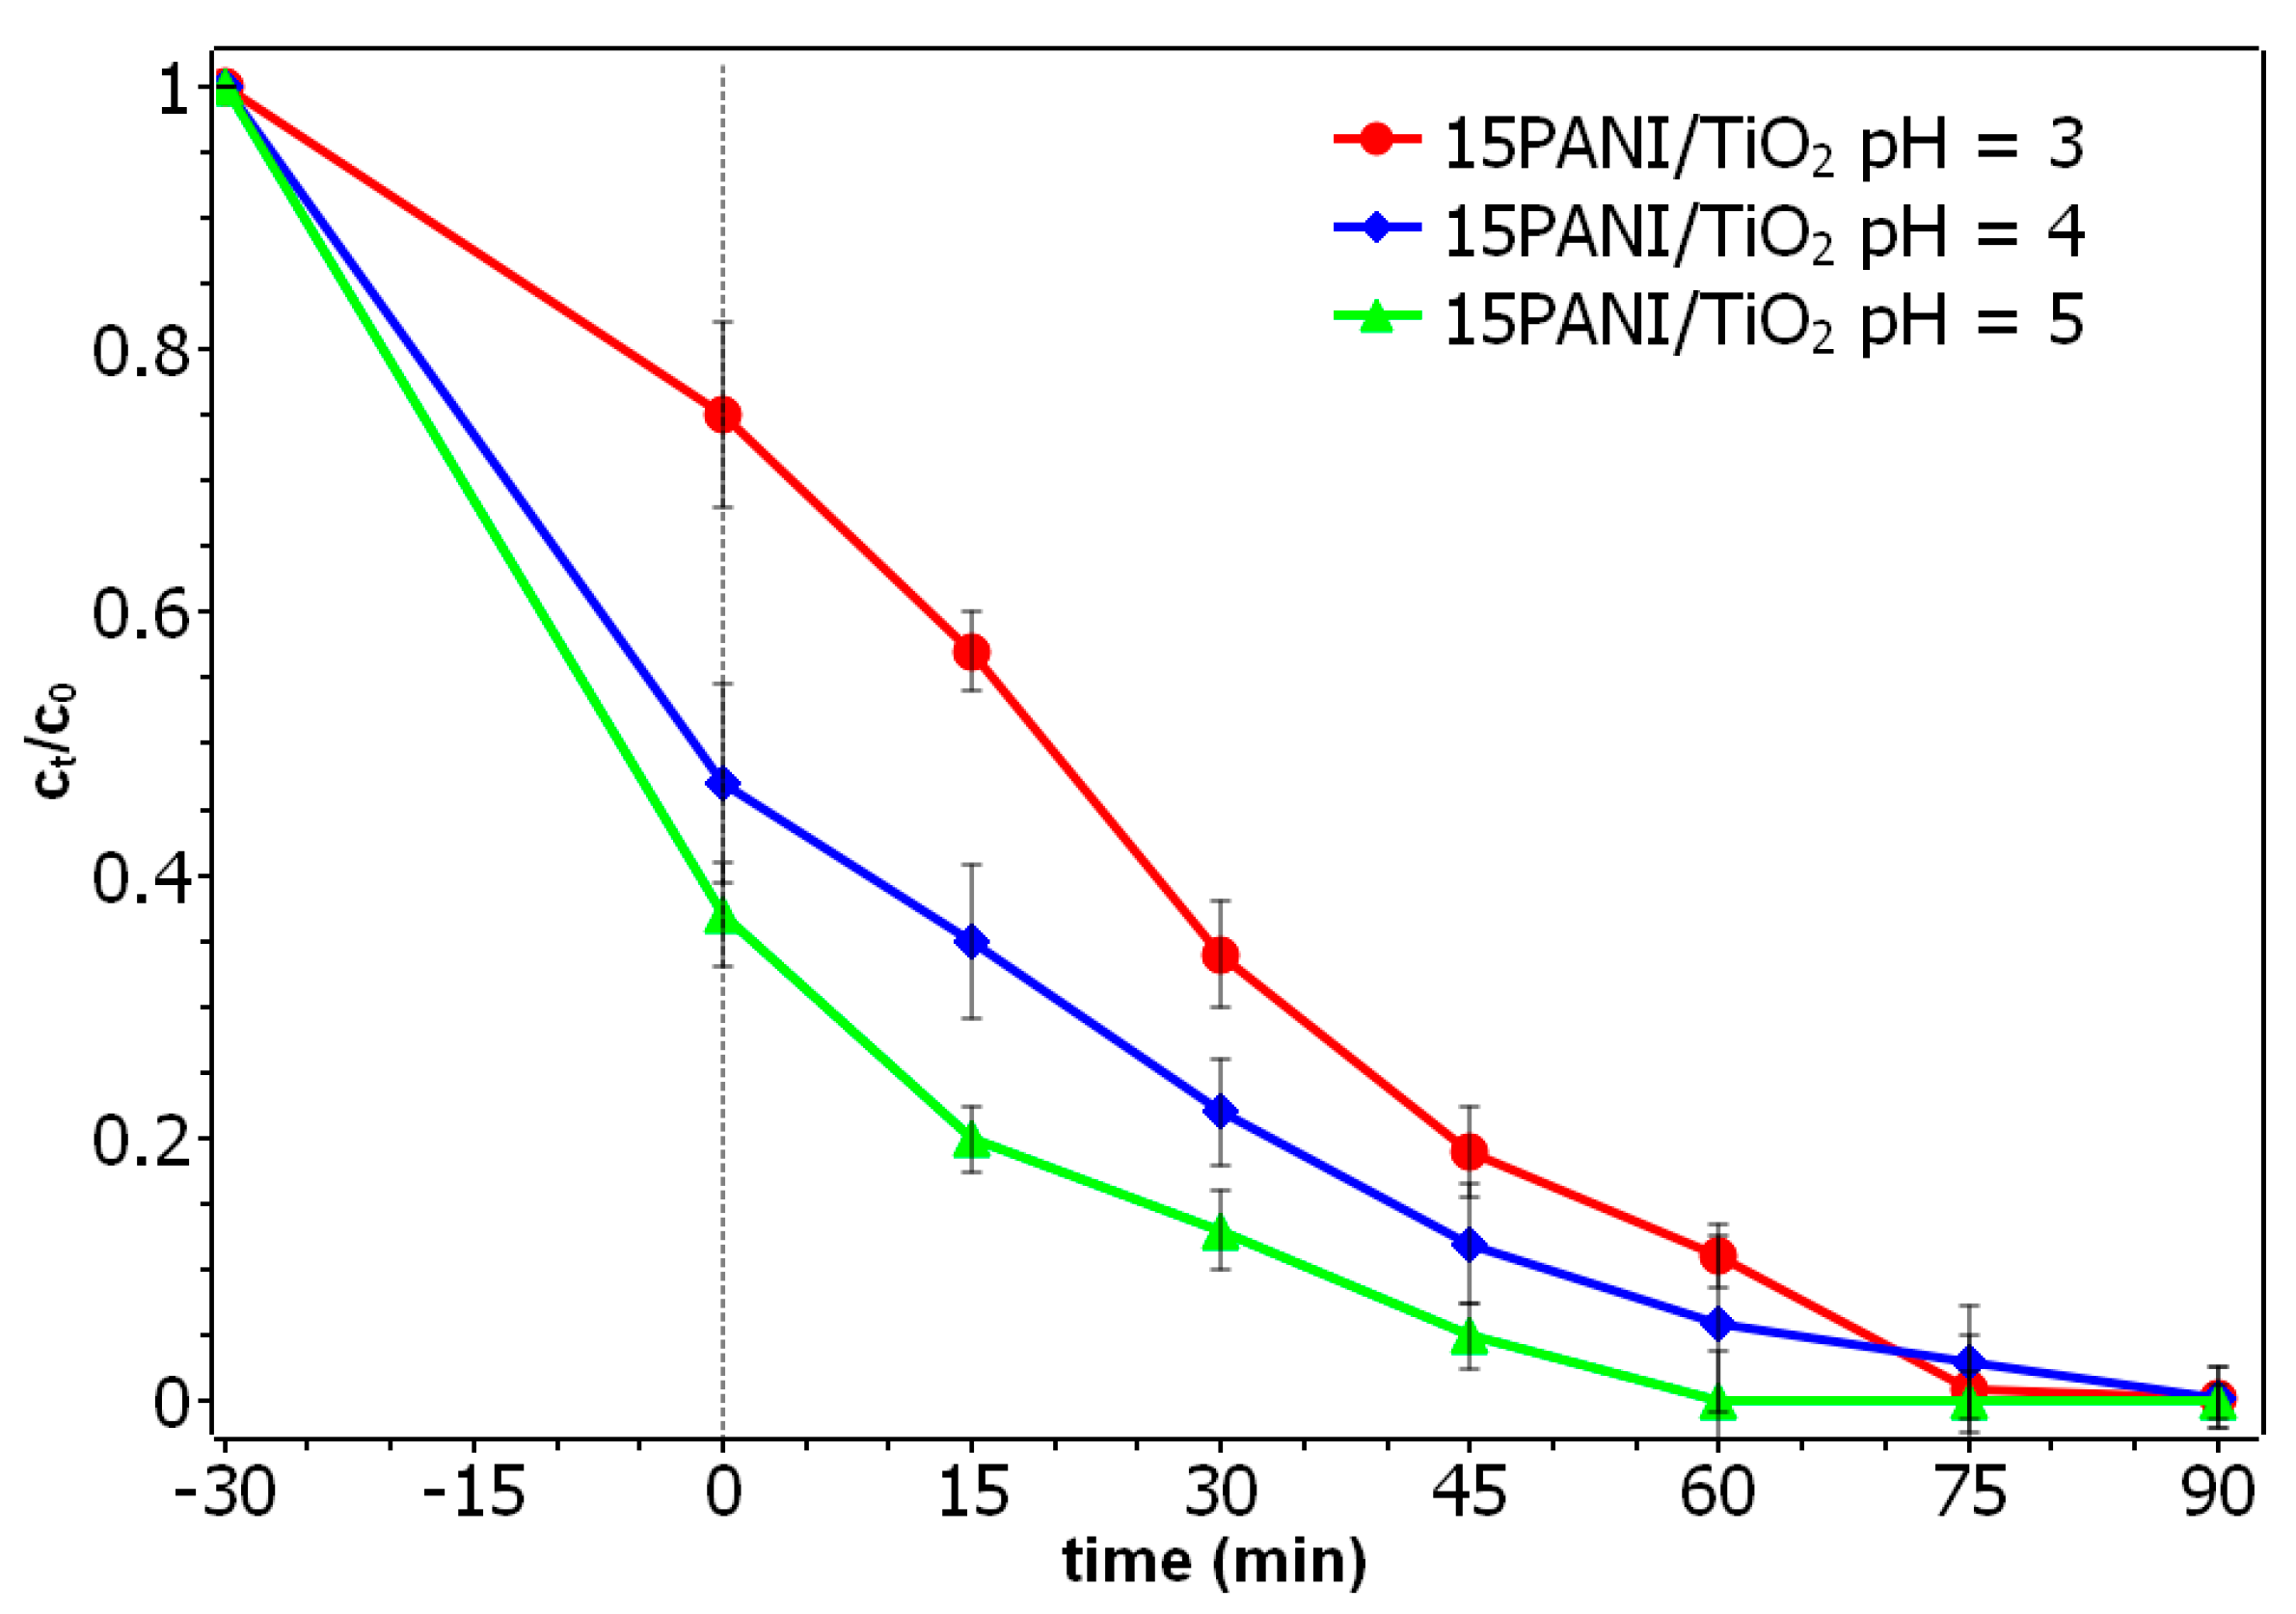
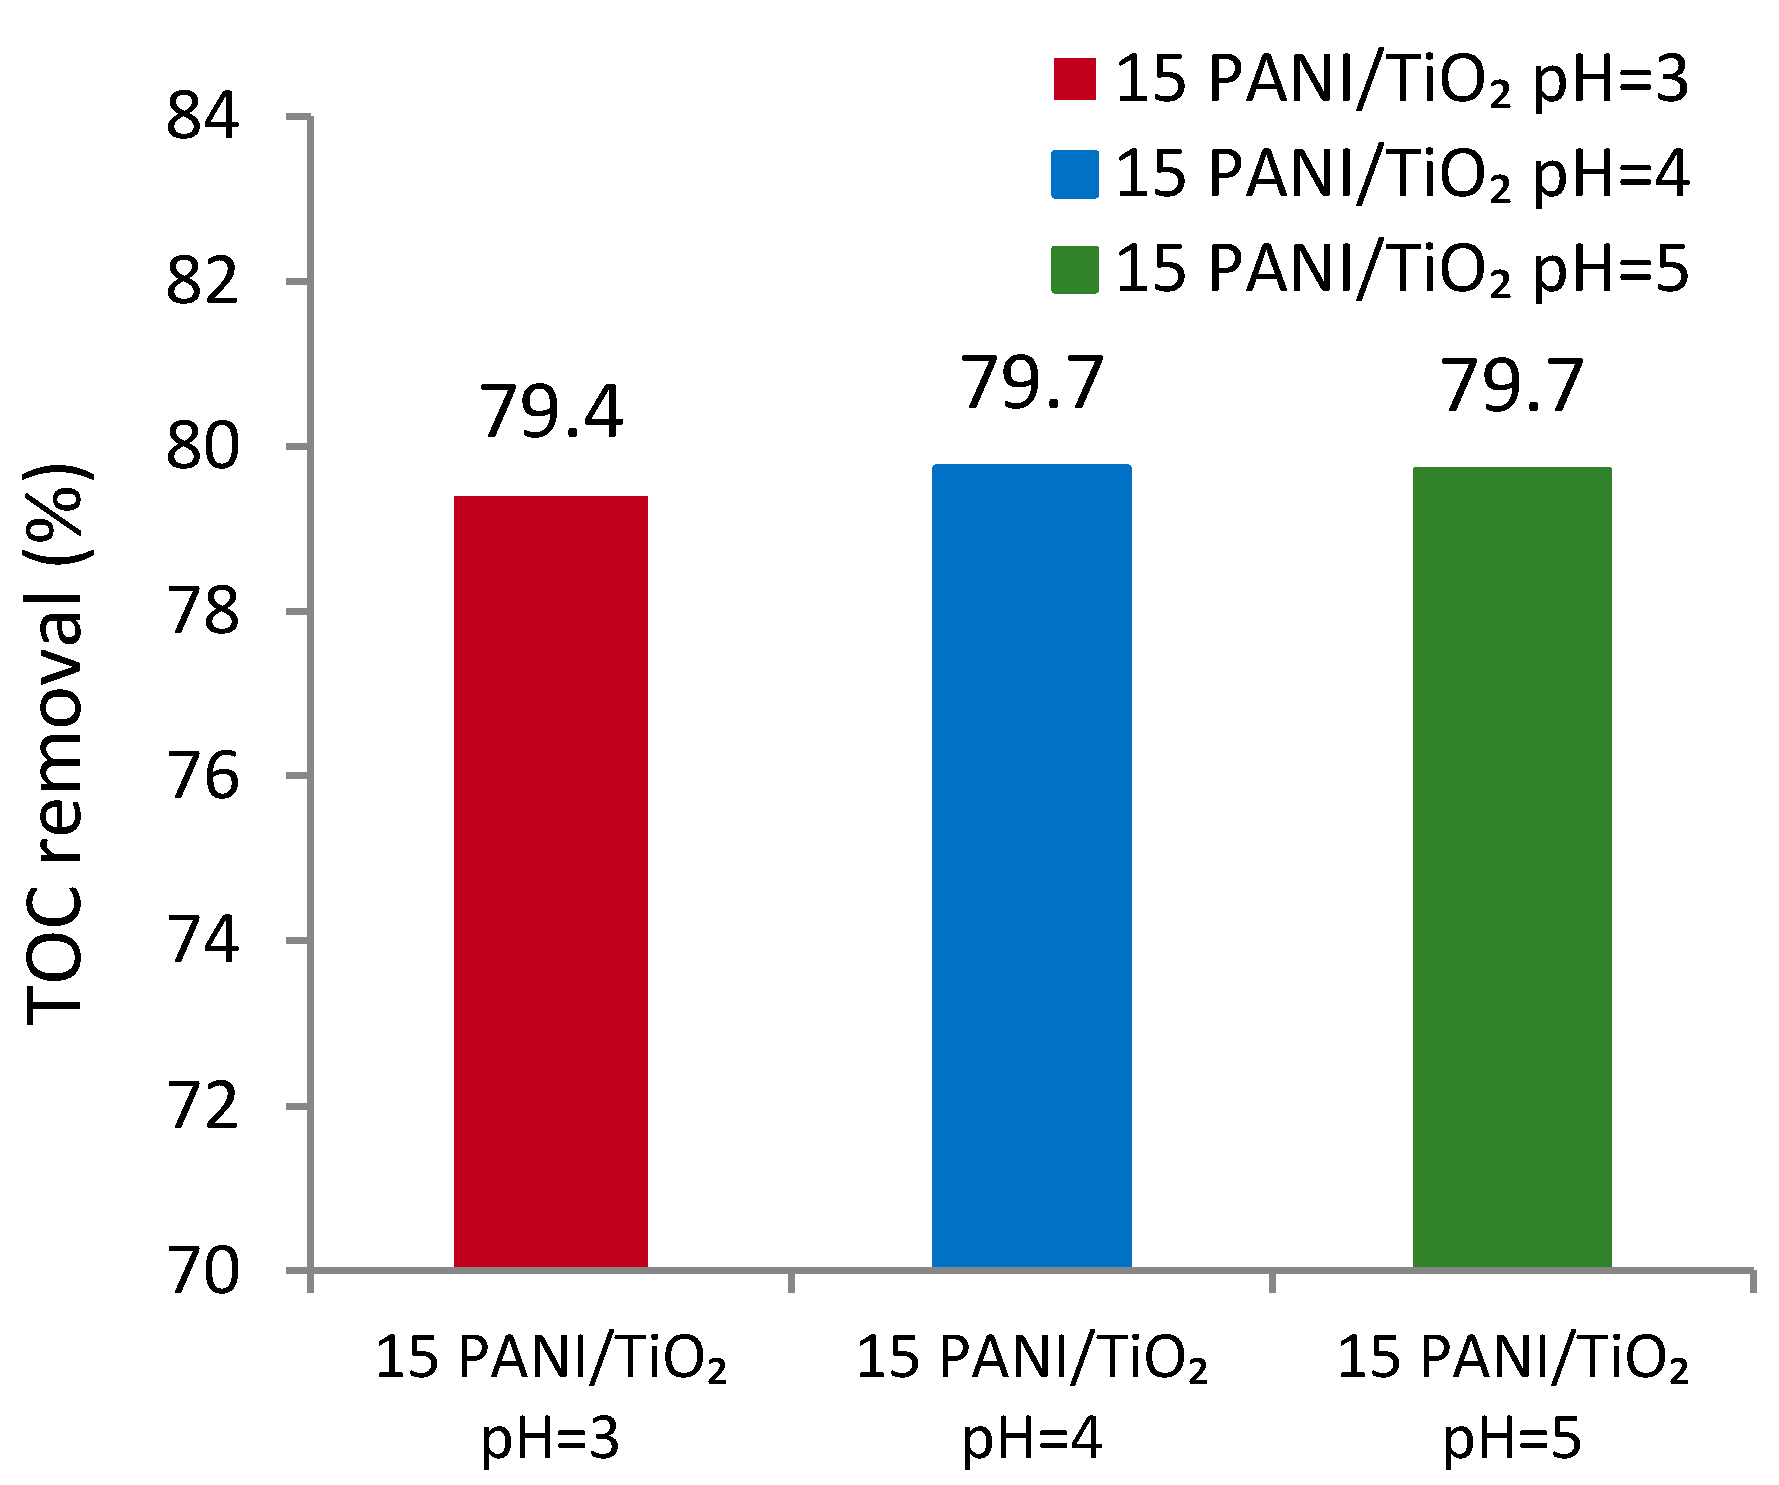
3.7. Photocatalysis and Effect of pH Solution

pH variation can alter the surface properties of the catalyst, PANI doping, and the formation rate of both hydroxyl radicals and other reactive oxygen species, responsible for pollutant degradation. The PANI-TiO2 synergistic effect and TiO2 activity are more efficient at lower pH solutions [38]. Thus, it was of great interest to inspect the photocatalytic properties of the most efficient 15PANI/TiO2 catalyst at the various pH values.
Figure 8 presents the influence of pH on the photocatalytic degradation of RR45, using the 15PANI/TiO2 catalyst. The lowest dye adsorption (33%) was obtained at pH 3, as PANI is doped at pH = 3 [16], and thus, the HSO4 ions prevented dye adsorption. After 90 min of UVA treatment, regardless of pH, the 15PANI/TiO2 photocatalyst yielded complete discoloration, as confirmed by TOC removal (Figure 9). The TOC results were almost identical, despite the pH values (≈80%), though a different RR45 degradation rate was obtained. A complete discoloration of RR45 was achieved in 60 min at pH 5, after 75 min at pH 3 and in 90 min at pH 4. Considering the obtained results and the fact that pH = 5 is more environmentally “friendly”, this value was further used in the study.

3.8. Photocatalysis under Solar Irradiation

It is known that TiO2 is an excellent catalyst under UVA irradiation and a very poor one under solar (UVA/Vis) irradiation [39]. Therefore, to show that an improved 15PANI/TiO2 photocatalytic activity is a result of the PANI-TiO2 synergic effect, the RR45 degradation was conducted under UVA/Vis and Vis irradiation (Figure 10). The glass filter was used to reduce the amount of UVA irradiation. However, it is assumed that a small portion of UVA reached the composite surface.
During 90 min of UVA/Vis irradiation, the 15PANI/TiO2 photocatalyst completely discoloured the dye, whereas under Vis irradiation, it discoloured 77% of the dye. It is obvious that the 15PANI/TiO2 photocatalytic activity under UVA/Vis (Figure 10) is similar to UVA activity presented in Figure 6. However, under UVA/Vis irradiation 15PANI/TiO2 photocatalytic performances were superior in comparison to pure TiO2 that discoloured only 84% of dye after 90 min (Figure 10). The same conclusion can be obtained from TOC results under UVA/Vis irradiation, i.e., 15PANI/TiO2 removed 73% of TOC, whilst pure TiO2 removed only 27%. Therefore, it can be concluded that the PANI-TiO2 synergistic effect was responsible for the superb 15PANI/TiO2 performances.

3.9. Stability of Photocatalysts

PANI is an organic compound, so it is important to determine whether the exposure of 15PANI/TiO2 to solar irradiation, with or without the presence of RR45, degrades PANI within the composite. Thus, 15PANI/TiO2 was used in series of tests as follows: adsorption of RR45 without solar irradiation and exposure to solar irradiation with and without RR45 (pH = 5; catalyst concentration = 1 g/L, RR45 concentration = 30 mg/L). Afterwards, the catalysts used in the aforementioned tests were studied by TG (Figure 11). Additionally, the TG curve of an as-prepared 15PANI/TiO2 is also presented in Figure 11.
It should be noted that radicals, produced by solar irradiation [13], might induce severe PANI degradation. However, TG curves in Figure 11 reveal that the remaining char residue values varied between 83.1% and 84.7%, which indicates that the catalysts did not experience any significant degradation. Diversity in sample weight loss can be attributed to different dopant and moisture contents and to a different amount of adsorbed degradation products. The composites investigated at pH 5 (Figure 11) did not show shoulders around 400 °C (which were observed in Figure 2), since dopants were removed during photocatalytic tests. Therefore, it can be concluded that the synthesis condition for 15PANI/TiO2 synthesis was optimal, as the series of tests confirmed the stability of PANI in the composite.

4. Conclusions

PANI/TiO2 composite photocatalysts were successfully synthesized by the in situ chemical oxidation of aniline in the presence of TiO2 particles. The findings herein indicated that the aniline concentration had an observable impact on aggregation processes, morphology and photocatalytic properties. The effect of aggregation processes were enlightened while studding the sample morphology by FE-SEM and TEM images. It was concluded that the optimal aniline amount omitted the production of imperfections, and at the same time, it provided an effective barrier to TiO2 nanoparticle aggregation. The results indicated that the optimal aniline concentration was the one used for 15PANI/TiO2 synthesis (15% of aniline monomer). Since the TiO2 aggregation process was hindered, 15PANI/TiO2 resulted in the highest photocatalytic efficiency as RR45 dye degradation was taking place on the composite surface. Also, the impact of a higher aniline concentration on the polymer chain imperfections was observed, as it contributed both to the PANI chain branching and consequently, to the growth of aggregates. FT-IR spectra and conductivity measurements confirmed the presence of the conductive PANI in all prepared composites, whilst the highest conductivity was observed for the 20PANI/TiO2 composite. The conductivity of composites did not linearly increase with an increase in aniline concentration, as presented for the 25PANI/TiO2 sample. It was concluded that the conductivity of the PANI polymer reflected its chain structure, which was disrupted by imperfections, as confirmed by TG. UV-Vis results revealed the lowest reflected irradiation for 15PANI/TiO2, which was a result of the uniformly covered TiO2 surface by the equally dispersed conductive PANI.
Valorization of PANI/TiO2 photoactivity was conducted in wastewater treatment, where it was observed that 10PANI/TiO2 and 15PANI/TiO2 presented higher rates of discoloration than pure TiO2 under UVA light. TOC results point to the same conclusion, i.e., 15PANI/TiO2 composite demineralized 80% whereas pure TiO2 demineralized only 35% of RR45 dye. The higher photoactivity efficiency of the composite catalysts was explained by the achieved PANI-TiO2 synergistic effect. The PANI-TiO2 synergistic effect was additionally confirmed by UV/Vis photocatalysis, as 15PANI/TiO2 (vs. pure TiO2) yielded a more efficient catalytic process.
In order to gain a deeper insight into the photocatalytic process of wastewater purification by 15PANI/TiO2 composite, it is necessary to further investigate the efficiency of water load, degradation kinetics as well as modelling of the system to achieve optimal experimental conditions.

Acknowledgment

This work has been fully supported by Croatian Science Foundation under the project IP-2013-11-5092.

Author Contributions

Katarina Novaković and Vanja Gilja prepared photocatalysts and preformed characterization and photocatalysis measurements. Marijana Kraljić Roković performed conductivity measurements of photocatalysts, Jadranka Travas-Sejdic provided the TEM micrographs and Zlata Hrnjak-Murgić proposed, planned the research and supervised the experiment. Mark Žic designed the photocatalysts synthesis and made FE-SEM images. All the authors collaborated and participated in writing of the manuscript.

Conflicts of Interest

The authors declare no conflicts of interest.

References

  1. Daneshvar, N.; Salari, D.; Khataee, A.R. Photocatalytic degradation of azo dye acid red 14 in water on ZnO as an alternative catalyst to TiO2. J. Photochem. Photobiol. Chem. 2004, 162, 317–322. [Google Scholar] [CrossRef]
  2. Azbar, N.; Yonar, T.; Kestioglu, K. Comparison of various advanced oxidation processes and chemical treatment methods for COD and color removal from a polyester and acetate fiber dyeing effluent. Chemosphere 2004, 55, 35–43. [Google Scholar] [CrossRef] [PubMed]
  3. Pelaez, M.; Nolan, N.T.; Pillai, S.C.; Seery, M.K.; Falaras, P.; Kontos, A.G.; Dunlop, P.S.M.; Hamilton, J.W.J.; Byrne, J.A.; O’Shea, K.; et al. A review on the visible light active titanium dioxide photocatalysts for environmental applications. Appl. Catal. B Environ. 2012, 125, 331–349. [Google Scholar] [CrossRef]
  4. Linsebigler, A.L.; Lu, G.Q.; Yates, J.T. Photocatalysis on TiO2 surfaces—Principles, mechanisms, and selected results. Chem. Rev. 1995, 95, 735–758. [Google Scholar] [CrossRef]
  5. Hoffmann, M.R.; Martin, S.T.; Choi, W.Y.; Bahnemann, D.W. Environmental applications of semiconductor photocatalysis. Chem. Rev. 1995, 95, 69–96. [Google Scholar] [CrossRef]
  6. Gupta, S.; Tripathi, M. A review of TiO2 nanoparticles. Chin. Sci. Bull. 2011, 56, 1639–1657. [Google Scholar] [CrossRef]
  7. Kumar, S.; Isaacs, M.A.; Trofimovaite, R.; Durndell, L.; Parlett, C.M.A.; Douthwaite, R.E.; Coulson, B.; Cockett, M.C.R.; Wilson, K.; Lee, A.F. P25@CoAl layered double hydroxide heterojunction nanocomposites for CO2 photocatalytic reduction. Appl. Catal. B Environ. 2017, 209, 394–404. [Google Scholar] [CrossRef]
  8. Chen, Q.F.; Shi, W.M.; Xu, Y.; Wu, D.; Sun, Y.H. Visible-light-responsive Ag-Si codoped anatase TiO2 photocatalyst with enhanced thermal stability. Mater. Chem. Phys. 2011, 125, 825–832. [Google Scholar] [CrossRef]
  9. Yang, X.; Ma, F.Y.; Li, K.X.; Guo, Y.G.; Hu, J.L.; Li, W.; Huo, M.X.; Guo, Y.H. Mixed phase titania nanocomposite codoped with metallic silver and vanadium oxide: New efficient photocatalyst for dye degradation. J. Hazard. Mater. 2010, 175, 429–438. [Google Scholar] [CrossRef] [PubMed]
  10. Bao, N.; He, S.; Zhang, Q.Z.; Yin, Z.; Zhang, Y.X.; Xu, X.H. Synthesis of dual-phase titanate/anatase with controllable morphology doped with nitrogen from a bola-amphiphile amine surfactant as template. Ceram. Int. 2015, 41, 5916–5925. [Google Scholar] [CrossRef]
  11. Salem, M.A.; Al-Ghonemiy, A.F.; Zaki, A.B. Photocatalytic degradation of Allura red and Quinoline yellow with Polyaniline/TiO2 nanocomposite. Appl. Catal. B Environ. 2009, 91, 59–66. [Google Scholar] [CrossRef]
  12. Kang, E.T.; Neoh, K.G.; Tan, K.L. Polyaniline: A polymer with many interesting intrinsic redox states. Prog. Polym. Sci. 1998, 23, 277–324. [Google Scholar] [CrossRef]
  13. Lin, Y.M.; Li, D.Z.; Hu, J.H.; Xiao, G.C.; Wang, J.X.; Li, W.J.; Fu, X.Z. Highly Efficient Photocatalytic Degradation of Organic Pollutants by PANI-Modified TiO2 Composite. J. Phys. Chem. C 2012, 116, 5764–5772. [Google Scholar] [CrossRef]
  14. Lee, H.U.; Lee, S.C.; Choi, S.; Son, B.; Lee, S.M.; Kim, H.J.; Lee, J. Efficient visible-light induced photocatalysis on nanoporous nitrogen-doped titanium dioxide catalysts. Chem. Eng. J. 2013, 228, 756–764. [Google Scholar] [CrossRef]
  15. Umar, M.; Aziz, H.A. Photocatalytic Degradation of Organic Pollutants in Water. In Organic Pollutants—Monitoring, Risk and Treatment; InTech: Rijeka, Croatia, 2013; Chapter 8. [Google Scholar]
  16. Sapurina, I.Y.; Shishov, M.A. Oxidative Polymerization of Aniline: Molecular Synthesis of Polyaniline and the Formation of Supramolecular Structures. In New Polymers for Special Applications; De Souza Gomes, A., Ed.; InTech: Brussels, Belgium, 2012. [Google Scholar]
  17. Zic, M. Influence of the OPDA additions on impedance response and on anion exchange property of the modified PANI. J. Electroanal. Chem. 2010, 647, 43–52. [Google Scholar] [CrossRef]
  18. Rokovic, M.K.; Jurisic, A.; Zic, M.; Duic, L.; Schauperl, Z. Manipulation of Polymer Layer Characteristics by Electrochemical Polymerization from Mixtures of Aniline and ortho-Phenylenediamine Monomers. J. Appl. Polym. Sci. 2009, 113, 427–436. [Google Scholar] [CrossRef]
  19. Kraljic, M.; Zic, M.; Duic, L. O-phenlylenediamine-containing polyaniline coatings for corrosion protection of stainless steel. Bull. Electrochem. 2004, 20, 567–570. [Google Scholar]
  20. Trchova, M.; Stejskal, J. Polyaniline: The infrared spectroscopy of conducting polymer nanotubes (IUPAC Technical Report). Pure Appl. Chem. 2011, 83, 1803–1817. [Google Scholar] [CrossRef]
  21. Quillard, S.; Berrada, K.; Louarn, G.; Lefrant, S.; Lapkowski, M.; Pron, A. In-situ raman-spectroscopic studies of the electrochemical-behavior of polyaniline. New J. Chem. 1995, 19, 365–374. [Google Scholar]
  22. Asturias, G.E.; Macdiarmid, A.G.; McCall, R.P.; Epstein, A.J. The oxidation-state of emeraldine base. Synth. Met. 1989, 29, E157–E162. [Google Scholar] [CrossRef]
  23. Erdem, B.; Hunsicker, R.A.; Simmons, G.W.; Sudol, E.D.; Dimonie, V.L.; El-Aasser, M.S. XPS and FTIR surface characterization of TiO2 particles used in polymer encapsulation. Langmuir 2001, 17, 2664–2669. [Google Scholar] [CrossRef]
  24. Nabid, M.R.; Golbabaee, M.; Moghaddam, A.B.; Dinarvand, R.; Sedghi, R. Polyaniline/TiO2 Nanocomposite: Enzymatic Synthesis and Electrochemical Properties. Int. J. Electrochem. Sci. 2008, 3, 1117–1126. [Google Scholar]
  25. Li, X.W.; Chen, W.; Bian, C.Q.; He, J.B.; Xu, N.; Xue, G. Surface modification of TiO2 nanoparticles by polyaniline. Appl. Surf. Sci. 2003, 217, 16–22. [Google Scholar] [CrossRef]
  26. Luo, K.; Shi, N.L.; Sun, C. Thermal transition of electrochemically synthesized polyaniline. Polym. Degrad. Stab. 2006, 91, 2660–2664. [Google Scholar] [CrossRef]
  27. Ding, L.L.; Wang, X.W.; Gregory, R.V. Thermal properties of chemically synthesized polyaniline (EB) powder. Synth. Met. 1999, 104, 73–78. [Google Scholar] [CrossRef]
  28. Li, J.; Liu, G.; Zhang, W.; Cheng, W.; Xu, H.; Ding, S. Competitive detection of pregnancy-associated plasma protein-A in serum using functional single walled carbon nanotubes/chitosan-based electrochemical immunosensor. J. Electroanal. Chem. 2013, 708, 95–100. [Google Scholar] [CrossRef]
  29. Mizoguchi, K.; Kume, K. Metallic temperature-dependence in the conducting polymer, polyaniline—Spin dynamics study by esr. Solid State Commun. 1994, 89, 971–975. [Google Scholar] [CrossRef]
  30. Mizoguchi, K.; Nechtschein, M.; Travers, J.P.; Menardo, C. Spin dynamics study in polyaniline. Synth. Met. 1989, 29, E417–E424. [Google Scholar] [CrossRef]
  31. Zic, M. The influence of the PANI structure on the conductive mechanism and on the electrical equivalent circuit analysis. J. Electroanal. Chem. 2009, 635, 29–38. [Google Scholar] [CrossRef]
  32. Ganesan, R.; Gedanken, A. Organic-inorganic hybrid materials based on polyaniline/TiO2 nanocomposites for ascorbic acid fuel cell systems. Nanotechnology 2008, 19. [Google Scholar] [CrossRef] [PubMed]
  33. Keller, A.A.; Wang, H.T.; Zhou, D.X.; Lenihan, H.S.; Cherr, G.; Cardinale, B.J.; Miller, R.; Ji, Z.X. Stability and Aggregation of Metal Oxide Nanoparticles in Natural Aqueous Matrices. Environ. Sci. Technol. 2010, 44, 1962–1967. [Google Scholar] [CrossRef] [PubMed]
  34. Mahanta, D.; Madras, G.; Radhakrishnan, S.; Patil, S. Adsorption of sulfonated dyes by polyaniline emeraldine salt and its kinetics. J. Phys. Chem. B 2008, 112, 10153–10157. [Google Scholar] [CrossRef] [PubMed]
  35. Macdiarmid, A.G.; Epstein, A.J. The concept of secondary doping as applied to polyaniline. Synth. Met. 1994, 65, 103–116. [Google Scholar] [CrossRef]
  36. Macdiarmid, A.G.; Epstein, A.J. Secondary doping in polyaniline. Synth. Met. 1995, 69, 85–92. [Google Scholar] [CrossRef]
  37. Song, E.; Choi, J.W. Conducting Polyaniline Nanowire and Its Applications in Chemiresistive Sensing. Nanomaterials 2013, 3, 498–523. [Google Scholar] [CrossRef] [PubMed]
  38. Chong, M.N.; Jin, B.; Chow, C.W.K.; Saint, C. Recent developments in photocatalytic water treatment technology: A review. Water Res. 2010, 44, 2997–3027. [Google Scholar] [CrossRef] [PubMed]
  39. Truppi, A.; Petronella, F.; Placido, T.; Striccoli, M.; Agostiano, A.; Curri, M.L.; Comparelli, R. Visible-Light-Active TiO2-Based Hybrid Nanocatalysts for Environmental Applications. Catalysts 2017, 7. [Google Scholar] [CrossRef]
Figure 1. FT-IR spectra of synthesized PANI and different PANI/TiO2 composite photocatalysts.
Nanomaterials 07 00412 g001
Scheme 1. Structural formula of PANI and quinoid (Q) and benzoid (B) units.
Nanomaterials 07 00412 sch001
Scheme 2. Established interactions in PANI/TiO2 composite between the nitrogen (N) in PANI and titanium (Ti) in TiO2.
Nanomaterials 07 00412 sch002
Figure 2. (a) Thermogravimetric (TG) and (b) dTG curves of the synthesized 10-25PANI/TiO2 composite photocatalysts.
Nanomaterials 07 00412 g002
Figure 3. UV/Vis reflectance spectra of (a) the synthesized PANI and (b) PANI/TiO2 composite photocatalysts. The inset in the diagram (a) represents the UV/Vis reflectance spectrum of pure TiO2.
Nanomaterials 07 00412 g003
Figure 4. SEM micrographs of (a) 10PANI/TiO2; (b) 15PANI/TiO2 and (c) 20PANI/TiO2 composites (magnification ×15,000).
Nanomaterials 07 00412 g004
Figure 5. TEM image of (a) 10PANI/TiO2; (b) 15PANI/TiO2 and (c) 20PANI/TiO2 composite (magnification ×15.000).
Nanomaterials 07 00412 g005
Scheme 3. Schematic representation of the aniline amount impact on the PANI/TiO2 aggregate size, obtained by in situ aniline oxidation in the presence of TiO2 particles. The aggregate size minimum, which resulted in the most homogeneous morphology, was obtained for the 15PANI/TiO2 composite.
Nanomaterials 07 00412 sch003
Figure 6. Concentration change of RR45 dye, during photocatalysis with TiO2 and PANI/TiO2 composite photocatalysts (pH = 4; γcat = 1 g/L, γRR45 = 30 mg/L).
Nanomaterials 07 00412 g006
Figure 7. Comparison of total organic carbon (TOC) removal of Reactive Red 45 (RR45) dye after 90 min of photocatalysis (UVA) with TiO2 and PANI/TiO2 composite photocatalysts (pH = 4; γcat = 1 g/L, γRR45 = 30 mg/L).
Nanomaterials 07 00412 g007
Scheme 4. Molecular structure of Reactive Red 45 (RR45) azo dye.
Nanomaterials 07 00412 sch004
Figure 8. Concentration change of RR45 dye during photocatalysis (UVA) with the 15PANI/TiO2 composite photocatalyst at various pH values (pH = 3, 4, 5; γcat = 1 g/L, γRR45 = 30 mg/L).
Nanomaterials 07 00412 g008
Figure 9. Comparison of TOC removal of RR45 dye after 90 min of photocatalysis with the 15PANI/TiO2 composite photocatalyst at different pH values (pH = 3, 4, 5; γcat = 1 g/L, γRR45 = 30 mg/L).
Nanomaterials 07 00412 g009
Figure 10. Change of RR45 dye concentration during photocatalysis with the 15PANI/TiO2 composite photocatalysts under UVA/Vis and Vis irradiation (pH = 5; γcat = 1 g/L, γRR45 = 30 mg/L).
Nanomaterials 07 00412 g010
Figure 11. (a) TG and (b) dTG curves of 15PANI/TiO2 catalyst: as-prepared, after adsorption of RR45, after photocatalysis with RR45 using solar irradiation and after solar treatment without RR45.
Nanomaterials 07 00412 g011
Table 1. The components used to prepare the PANI/TiO2 photocatalysts.
Sample10PANI/TiO215PANI/TiO220PANI/TiO225PANI/TiO2PANI
m (PANI)/%10152025-
m (TiO2)/g0.80.80.80.80
V (An)/mL0.3920.5880.7840.9790.392
m (APS)/g0.2450.3670.4900.6120.245
V (H2SO4)/mL0.0550.0550.0550.0550.055
Final pH2.02.02.02.02.0
PANI: polyaniline.
Table 2. PANI/TiO2 composite conductivity.
Sample10PANI/TiO215PANI/TiO220PANI/TiO225PANI/TiO2
Conductivity/S cm −12.76 × 10−53.74 × 10−56.33 × 10−51.70 × 10−6

