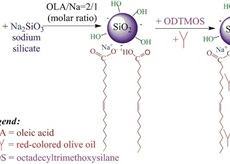
2.1. Formation of Silica Particles from Sodium Silicate and Oleic Acid (OLA)
To overcome the Kraft temperature that was previously mentioned for OLANa (the Kraft temperature for 1 wt % of OLANa in water is about 23 °C and for 35 wt % is 33 °C), the titration of sodium silicate with OLA (2.2.1) was performed at 40 °C [
30].
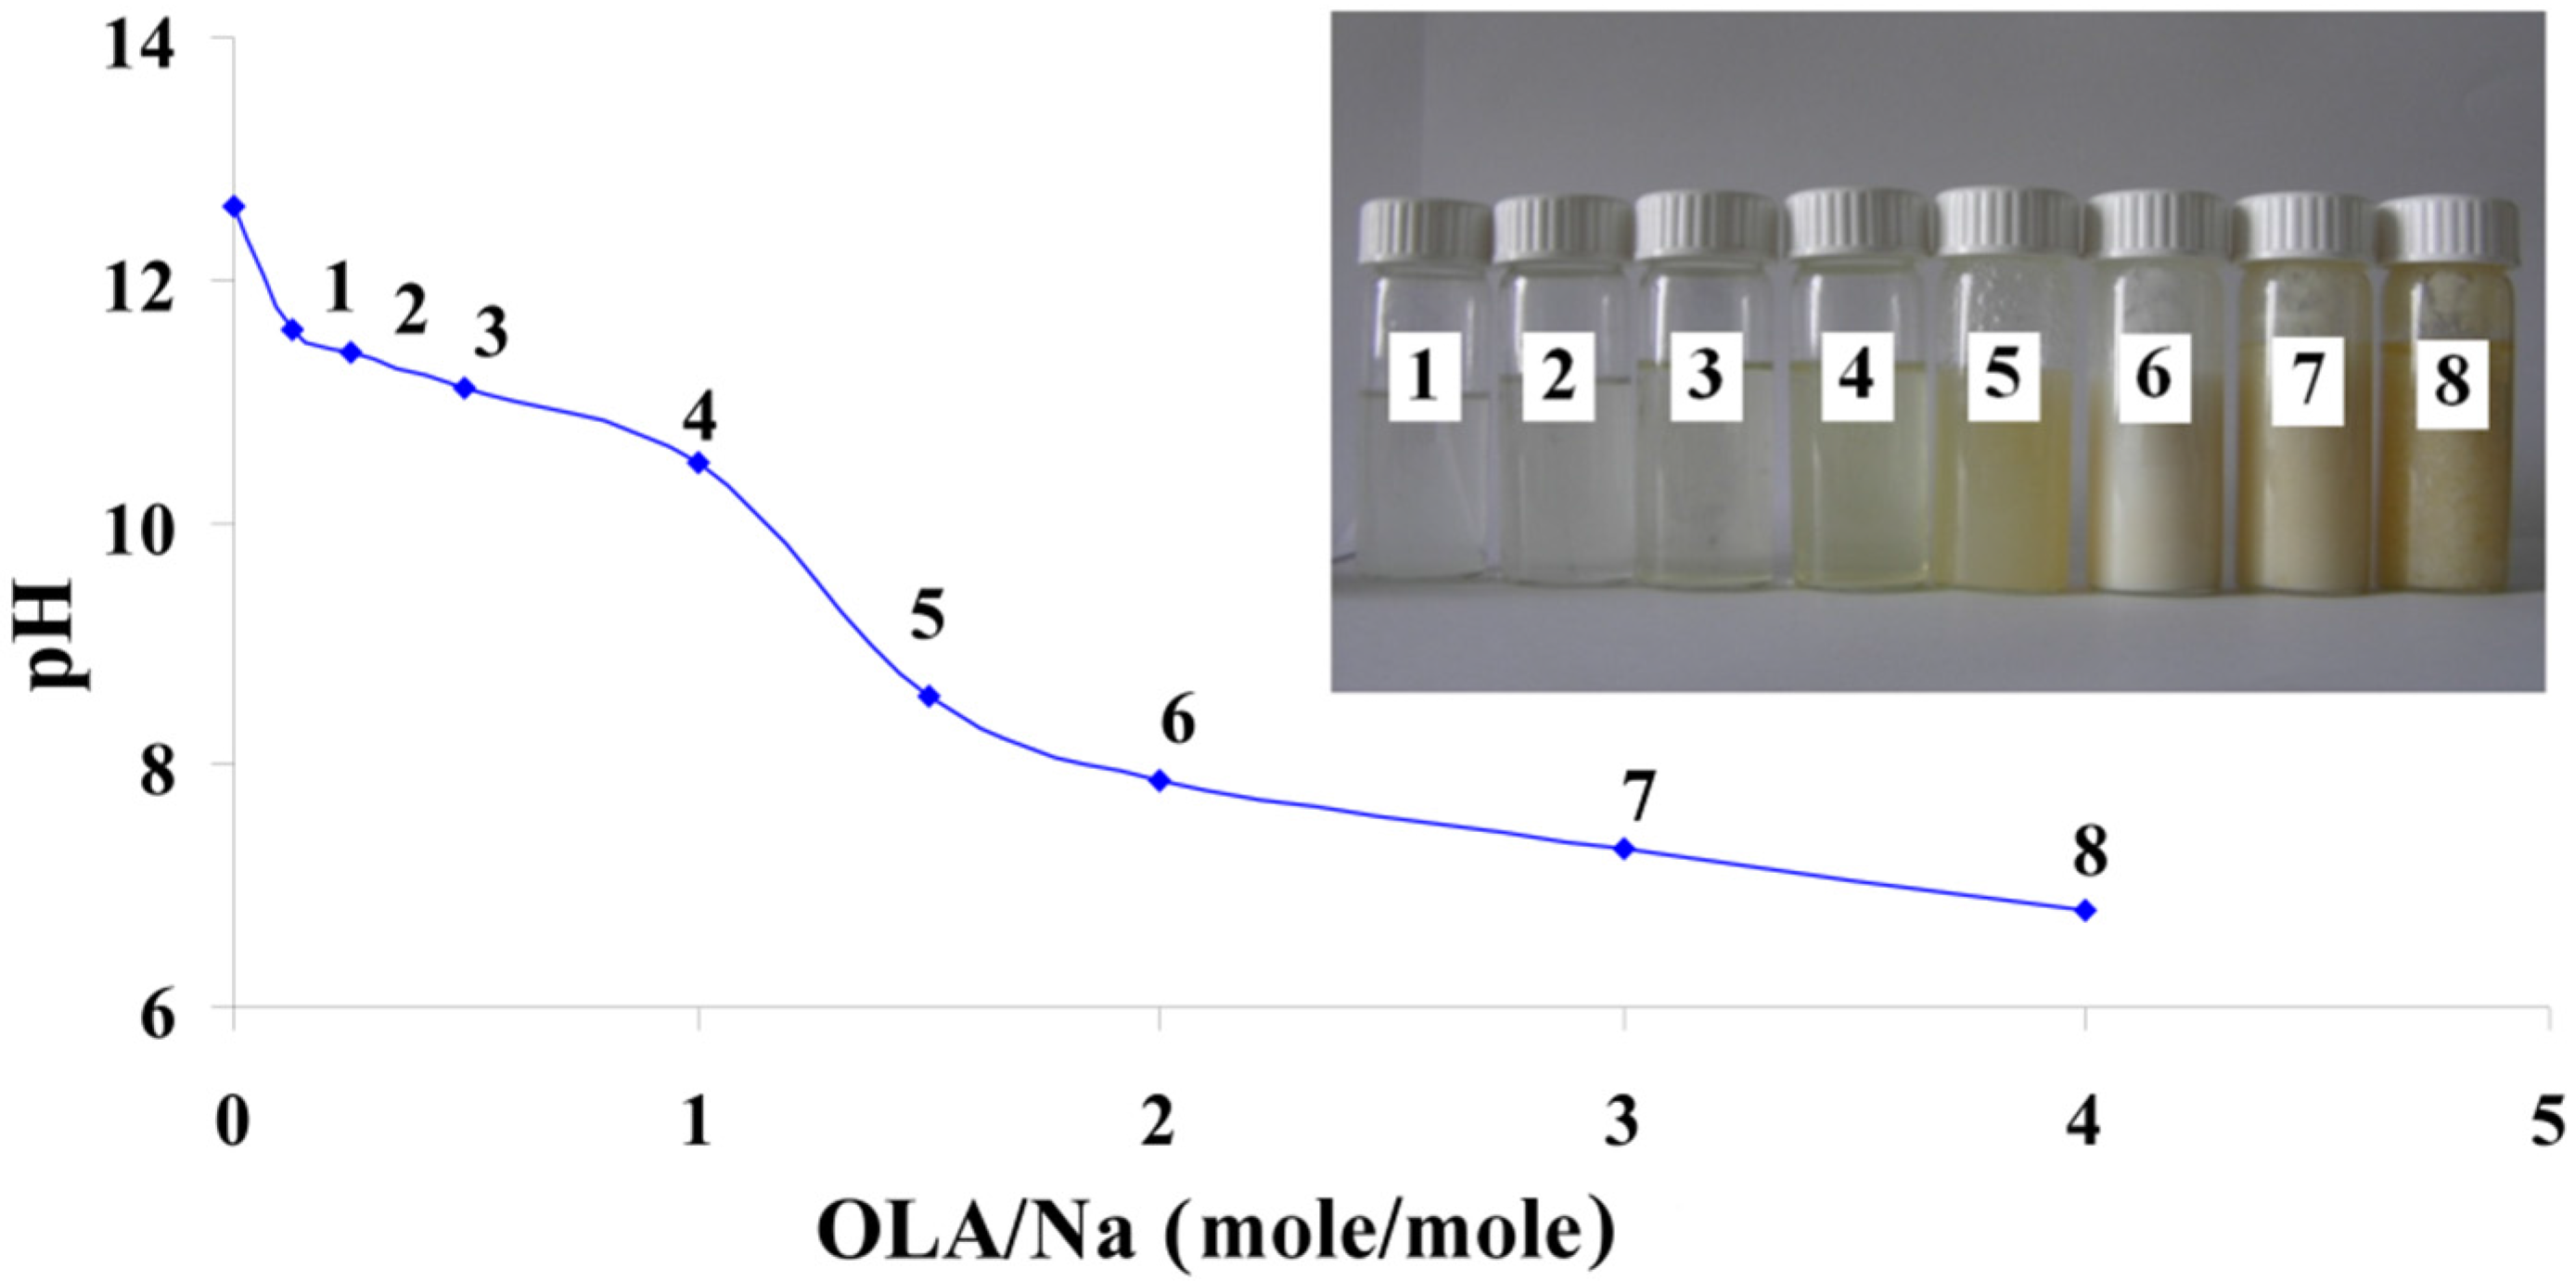
Figure 1 presents the pH modification of these mixtures depending on the OLA/Na ratio.
Figure 1.
pH modification of the dispersions prepared at a fixed amount of sodium silicate and different quantities of oleic acid (OLA); Inset Picture: The dispersions prepared at different quantities of OLA and a fixed amount of sodium silicate (1. 0.125/1; 2. 0.25/1; 3. 0.5/1; 4. 1/1; 5. 1.5/1; 6. 2/1; 7. 3/1 and 8. 4/1 OLA/Na).
The decrease of the pH value with the increase of the OLA concentration is similar to previously published results, where the alkaline salts of OLA are titrated with acid [
17,
18,
19,
20,
21,
22,
23,
31,
32,
33]. The systems are transparent up to a ratio of OLA/Na = 1/1 and exhibits a slow decrease of the pH value (inset
Figure 1). In these systems, OLA is found in the OLANa form and forms micelles. As the molar ratio of OLA/Na increased from 0.125/1 to 4/1, the systems became opaque and stable in time. In this pH range, OLA and OLANa form compounds with complex structures (bilayered vesicles). In good agreement with previously published results, the occurrence of system opacity at OLA/Na = 1.5/1 proves that the driving force of phase segregation is not only represented by the occurrence of COO-HOOC dimer, but also by the hydrophobic interaction between the oleyl chains [
32,
33].
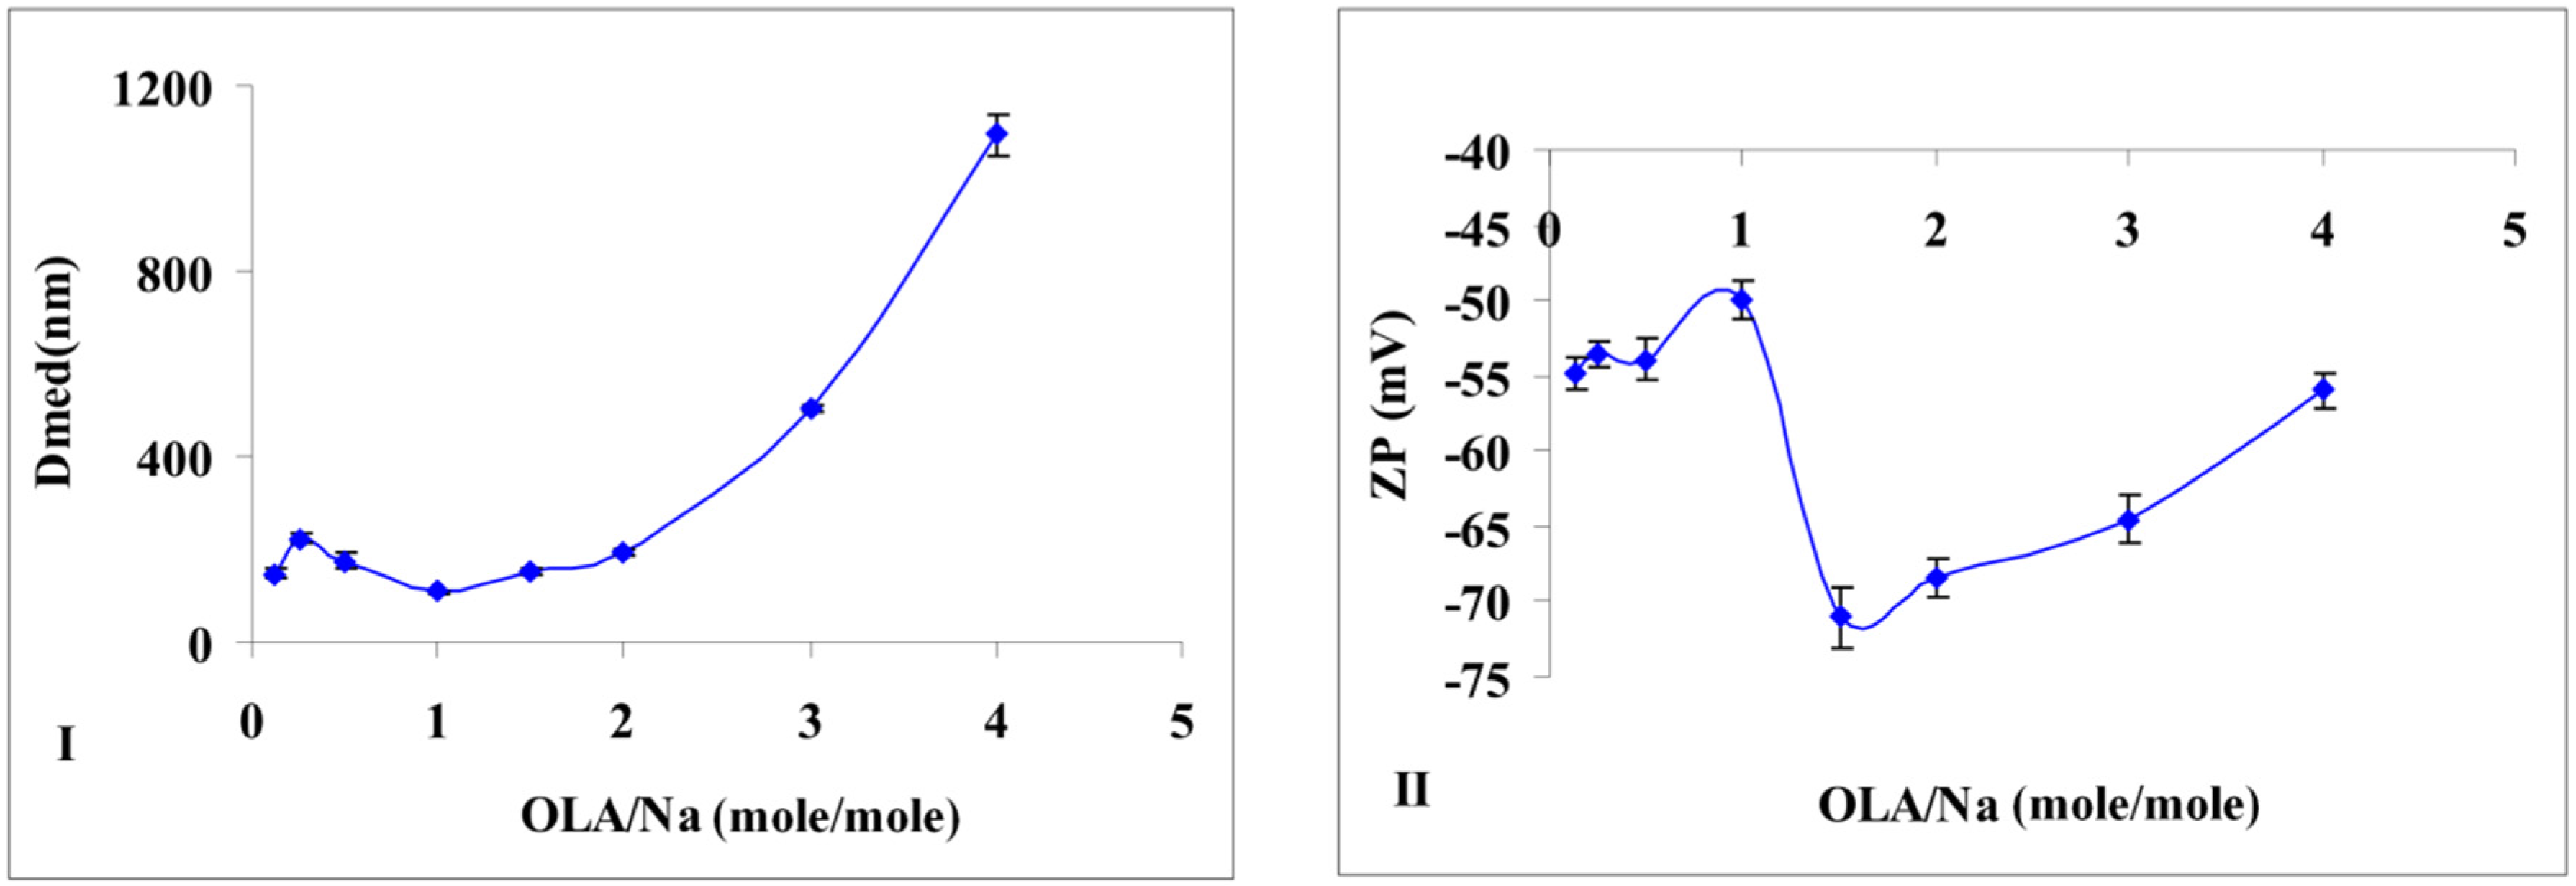
Additional information is provided by the particle size measurements of the obtained silica (
Figure 2I). If no major modification of particle size is noticed in the interval of OLA/Na = 0.125/1 ÷ 1.5/1, after a ratio of 2/1, the dimensions for the newly formed aggregates increases tremendously (
Figure 2I). In the transparent mixtures, in which OLANa exists in a micellar state, the interactions between the surfactant and silica are not very strong. The analysis of the OLANa bonded to the preformed silica particles proved only a partial adsorption at the interface [
16].
The effect of this adsorption was observed even in the particle size distribution. Until a ratio of OLA/Na = 2/1, the size distribution diagrams presented a bimodal distribution (
Figure S1). The particle diameters (Dmed) represented in
Figure 2I are average values, but the samples obtained until a value of OLA/Na = 1/1 showed also a population of small particles (25–30 nm). Considering the synthesis conditions (pH < 11.6), sodium silicate was able to generate silica particles. Above a ratio of OLA/Na = 2/1 the particle size distribution was monomodal due to the increased aggregation capacity of OLA/OLANa mixtures.
SEM images were in good agreement with the obtained DLS data (
Figure 3). Silica nanoparticles stabilized by OLA are shown as aggregates, their medium size subsequently modified with OLA concentration.
If the OLA/Na ratio was increased, the absolute value of zeta potential decreased (
Figure 2II). A break of continuity at a ratio OLA/OLANa = 1.5/1, when the whole mixture became opaque, was observed. The aggregation of OLA with OLANa increases due the hydrophobic associations in an acid/soap complex [
32,
33], and the negatively charged silica particles concentrate at the surface.
The dispersions obtained in the conditions mentioned above were stable for one year. The opacity was preserved at a ratio of OLA/OLANa = 1.5/1, even if the samples were diluted. To the best of our knowledge, the experiments analyzed in this paper prove the capacity of the OLA/OLANa complex to stabilize silica particles generated from the neutralization of sodium silicate with fatty acid for the first time.
Figure 2.
(I) Size modification of the dispersions prepared at a fixed amount of sodium silicate and different quantities of OLA; (II) Zeta potential modification of the dispersions prepared at a fixed amount of sodium silicate and different quantities of OLA (Dmed represents the medium/average diameter recorded for the prepared silica dispersions).
Figure 3.
Scanning electron microscopy (SEM) pictures of the samples obtained at (I) 1.5/1 (sample No.5) and (II) 3/1 OLA/Na (sample No.7).
Figure 3.
Scanning electron microscopy (SEM) pictures of the samples obtained at (I) 1.5/1 (sample No.5) and (II) 3/1 OLA/Na (sample No.7).
2.2. Dispersions of Octadecyltrimethoxysilane (ODTMOS)Hydrophobic Silica
The synthesis method for these new materials as aqueous dispersions is mentioned in
Section 3.2.2. The goal was to study the hydrophobic effect of the silica formed through the condensation of sodium silicate with ODTMOS.
It is well known that the presence of monoeoleines increases the stability of some complex structures that are formed by the interaction with OLA or OLANa [
30,
34]. Because these complex systems are modifying their morphology depending on the pH, respectively by the presence of the protonated or nonprotonated carboxyl group, the importance of the OLA/OLANa ratio through the modification of the initial concentration of OLA was evaluated (
Table 1).
Table 1.
Synthesis conditions and the properties of dispersions obtained with octadecyltrimethoxysilane (ODTMOS).
Table 1.
Synthesis conditions and the properties of dispersions obtained with octadecyltrimethoxysilane (ODTMOS).
| No. | ODTMOS/SiO2 (mole/mole) | OLA/Na (mole/mole) | fOLA (mole/mole)OLA/(OLA + ODTMOS) | Properties of the Dispersion | Solid Hybrids | Final App.** |
|---|
| pH | D (nm) | ZP (mV) | ΔH* (J/mole) (OLA + ODTMOS) | Tmax (°C) | Inorg. Residue (%) |
|---|
| A | 1/1 | 2/1 | 0.73 | 7.2 | 188 | −60.7 | 378 | 469 | 14 | H |
| B | 1/1 | 4/1 | 0.84 | 6.3 | 644 | −60.7 | 580 | | | H |
| C | 1/1 | 1/1 | 0.54 | 9.2 | 256 | −71 | 74 | | | PS |
| D | 1/1 | 0.5/1 | 0.39 | 10 | 256 | −59.7 | 76 | | | PS |
| E | 1/10 | 2/1 | 0.96 | 7.3 | 516 | −72 | 261 | 436 | 16 | H |
| F | 1/1 | 2/1 | 0.73 | 7.03 | 225 | −79.7 | 236 | 474 | 21 | H OLA in EtOH |
| G | 1/5 | 2/1 | 0.93 | 7.3 | 740 | −70.2 | 302 | 439 | 15 | H |
| H | 0/1 | 2/1 | 1.0 | 7.4 | 171 | −61 | 483 | 423 | 19 | H |
| I | 1/1 | 1/1 HCl/Na = 0.25/1 | 0.54 | 7.1 | 285 | −68.7 | 54 | 466 | 27 | H |
| J | 1/1 | 0.5/1 HCl/Na = 0.25/1 | 0.39 | 10.2 | 213 | −35.5 | 55 | 395 | 37 | PS |
The preliminary attempts were carried out with a sodium silicate solution containing 8% Na
2O (Merck). Homogeneous aqueous dispersions were obtained at a ratio of OLA/Na > 2/1. These results indicated an increased stability induced by the acid/soap complex (OLA/OLANa) [
17,
18,
19,
20,
31,
32]. Since it was previously reported that sodium silicate solutions with a higher concentration of sodium induced the formation of mesoporous silica [
35], our study continued with a technical product with a concentration of Na
2O of 14.12% (
Table 1). Thus, the preliminary attempts were verified by using a sodium silicate with a higher concentration of sodium.
Sample A (OLA/Na = 2/1,
Table 1), is stable and homogeneous, and the colored olive oil is well dispersed. A stable dispersion was obtained also at a ratio of OLA/Na = 4/1 (
sample B).
When the quantity of OLA was reduced to 1/1 or 0.5/1 OLA/Na molar ratio, unstable dispersions were obtained (
samples C and
sample D,
Table 1). In these conditions, the final pH increased (pH = 9.2 for
sample C and pH = 10 for
sample D) proving that the sodium salt (OLANa) was not able to stabilize the dispersion, which is in agreement with previously published data [
16].
In order to verify the stabilizing effect of the OLA/OLANa complex, two additional syntheses were tested:
samples I and
J (
Table 1). Considering that for
sample I, half of Na ions were neutralized with HCl, the remaining ions ensured the neutralization for 50% of OLA. As a consequence, by using the OLA/OLANa = 1/1 complex, the stability of the final dispersion was ensured. If the HCl is consumed for the neutralization of Na ions, its quantity is reduced (
sample J) and the dispersion becomes unstable. In addition, the sample’s pH turns alkaline (pH = 10.2), as in the case of
sample D, which was also unstable.
Furthermore, it was verified if the system OLA/Na = 2/1 can stabilize the silica particles functionalized with small quantities of ODTMOS (
samples E and G) or silica particles prepared without trialkoxysilane derivate (
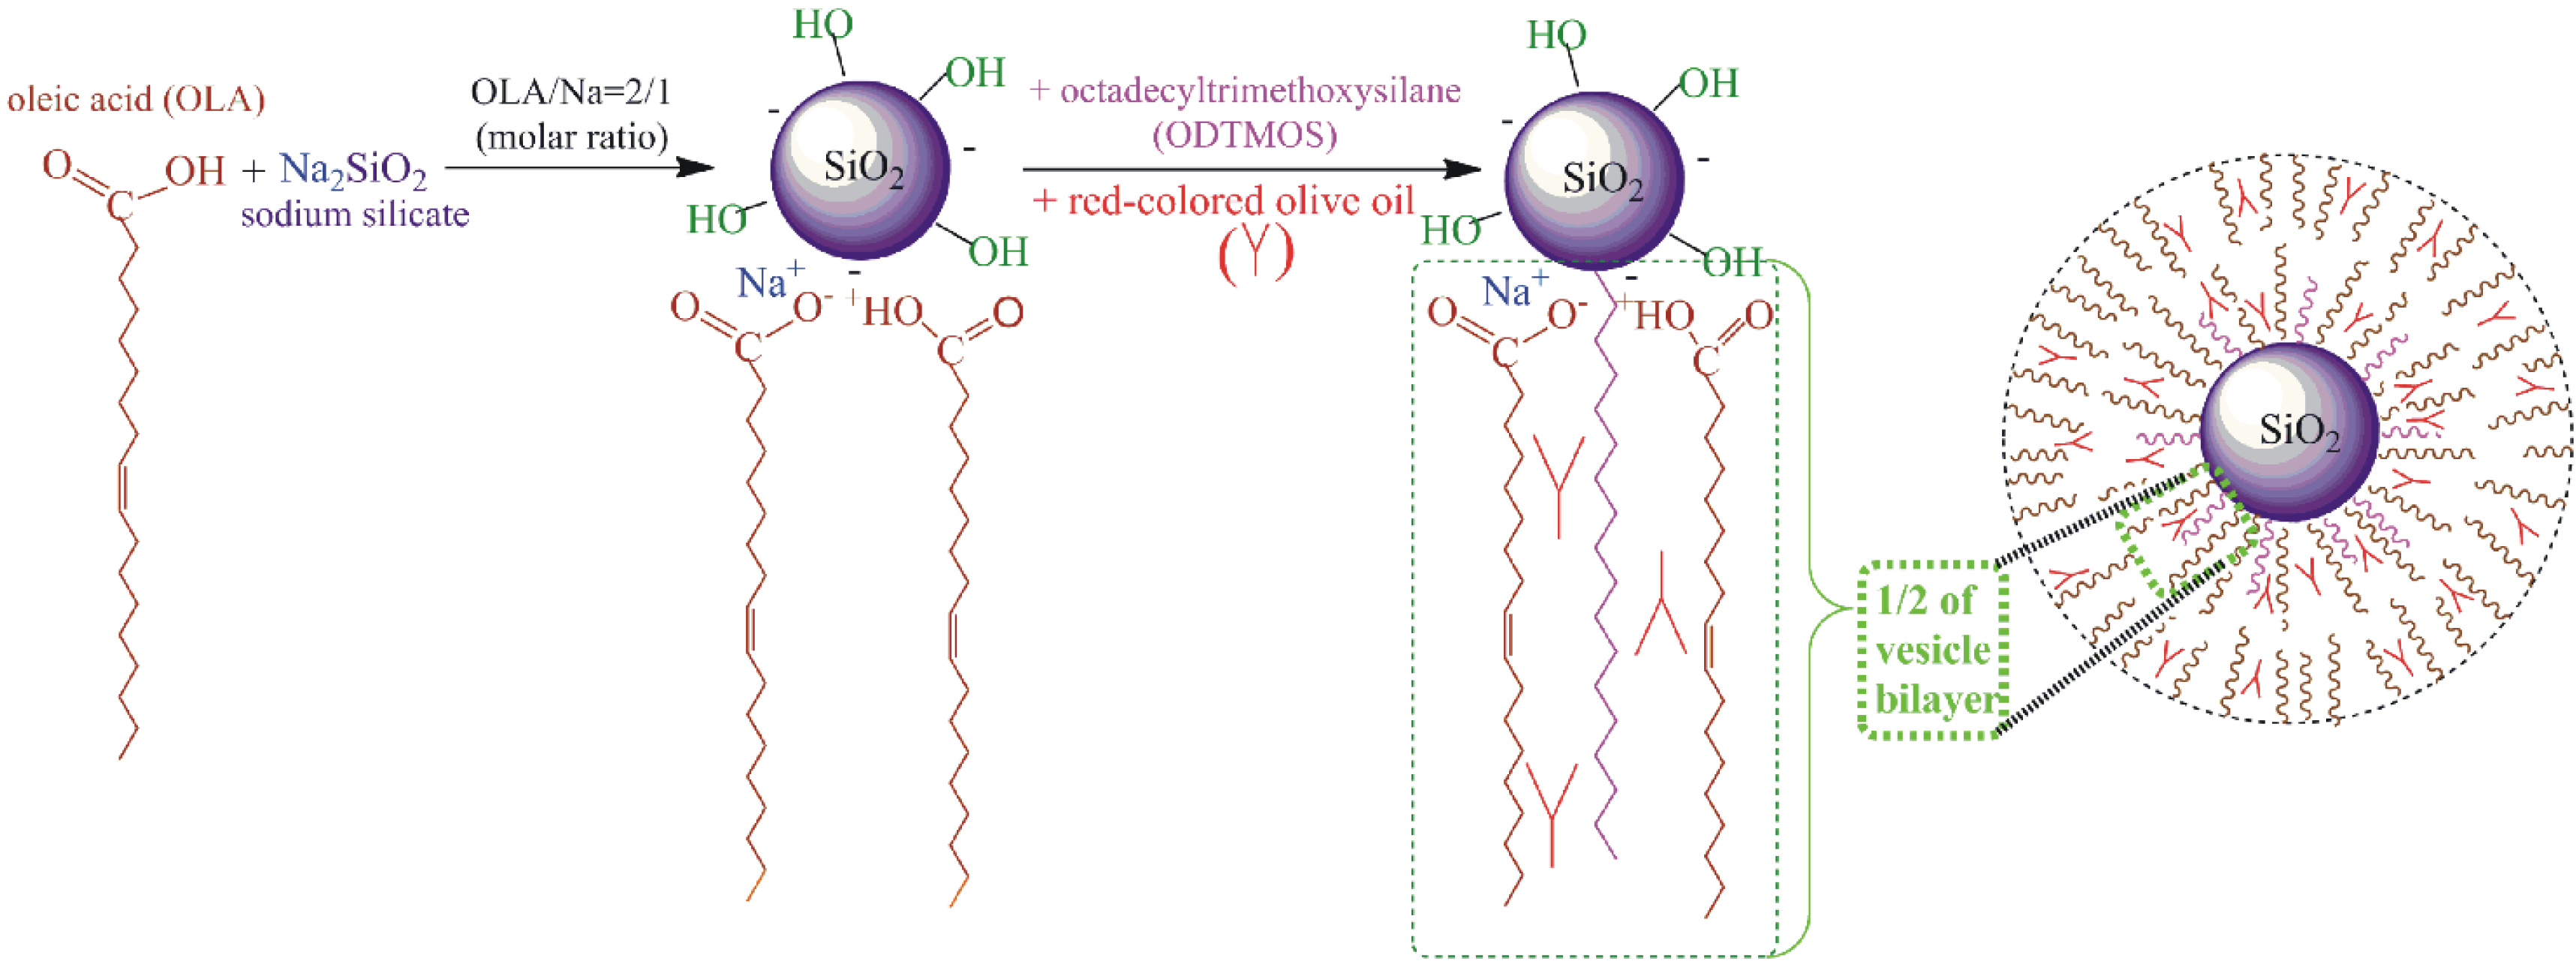
sample H). All the three systems that we studied generated stable and homogeneous dispersions and all of the red-colored olive oil was entrapped in the SDA hydrophobic areas (
Figure 4). It was observed that the dispersions of these samples remained stable even after 12 months after the synthesis.
An important observation was that the dispersion obtained without ODTMOS (
sample H) was more fluid. This proves that the octadecyl groups from ODTMOS had a stabilizing effect for the OLA/OLANa complex, as in the case of monooleines [
30,
34]. A possible explanation is that the octadecyl chains from the silica surface can form lamellar areas [
29] included in the oleyl hydrophobic areas from the OLA/OLANa mixture [
32,
33]. To see if these lamellar areas were affected by the method of adding the ODTMOS into the reaction mixture [
29], this trialkoxysilane derivate was either dissolved in ethanol together with OLA (
sample F) or in the aqueous phase (
sample A). Both samples were homogeneous and showed an increased viscosity. The alternative chosen for
sample F corresponds to the one reported in the literature, where ODTMOS was added together with tetraethoxysilane (TEOS), as silica precursor [
29]. A first conclusion is that homogeneous dispersions were formed when the final pH is 7 ÷ 7.4 provided by an equimolecular OLA/OLANa mixture (
Figure 4).
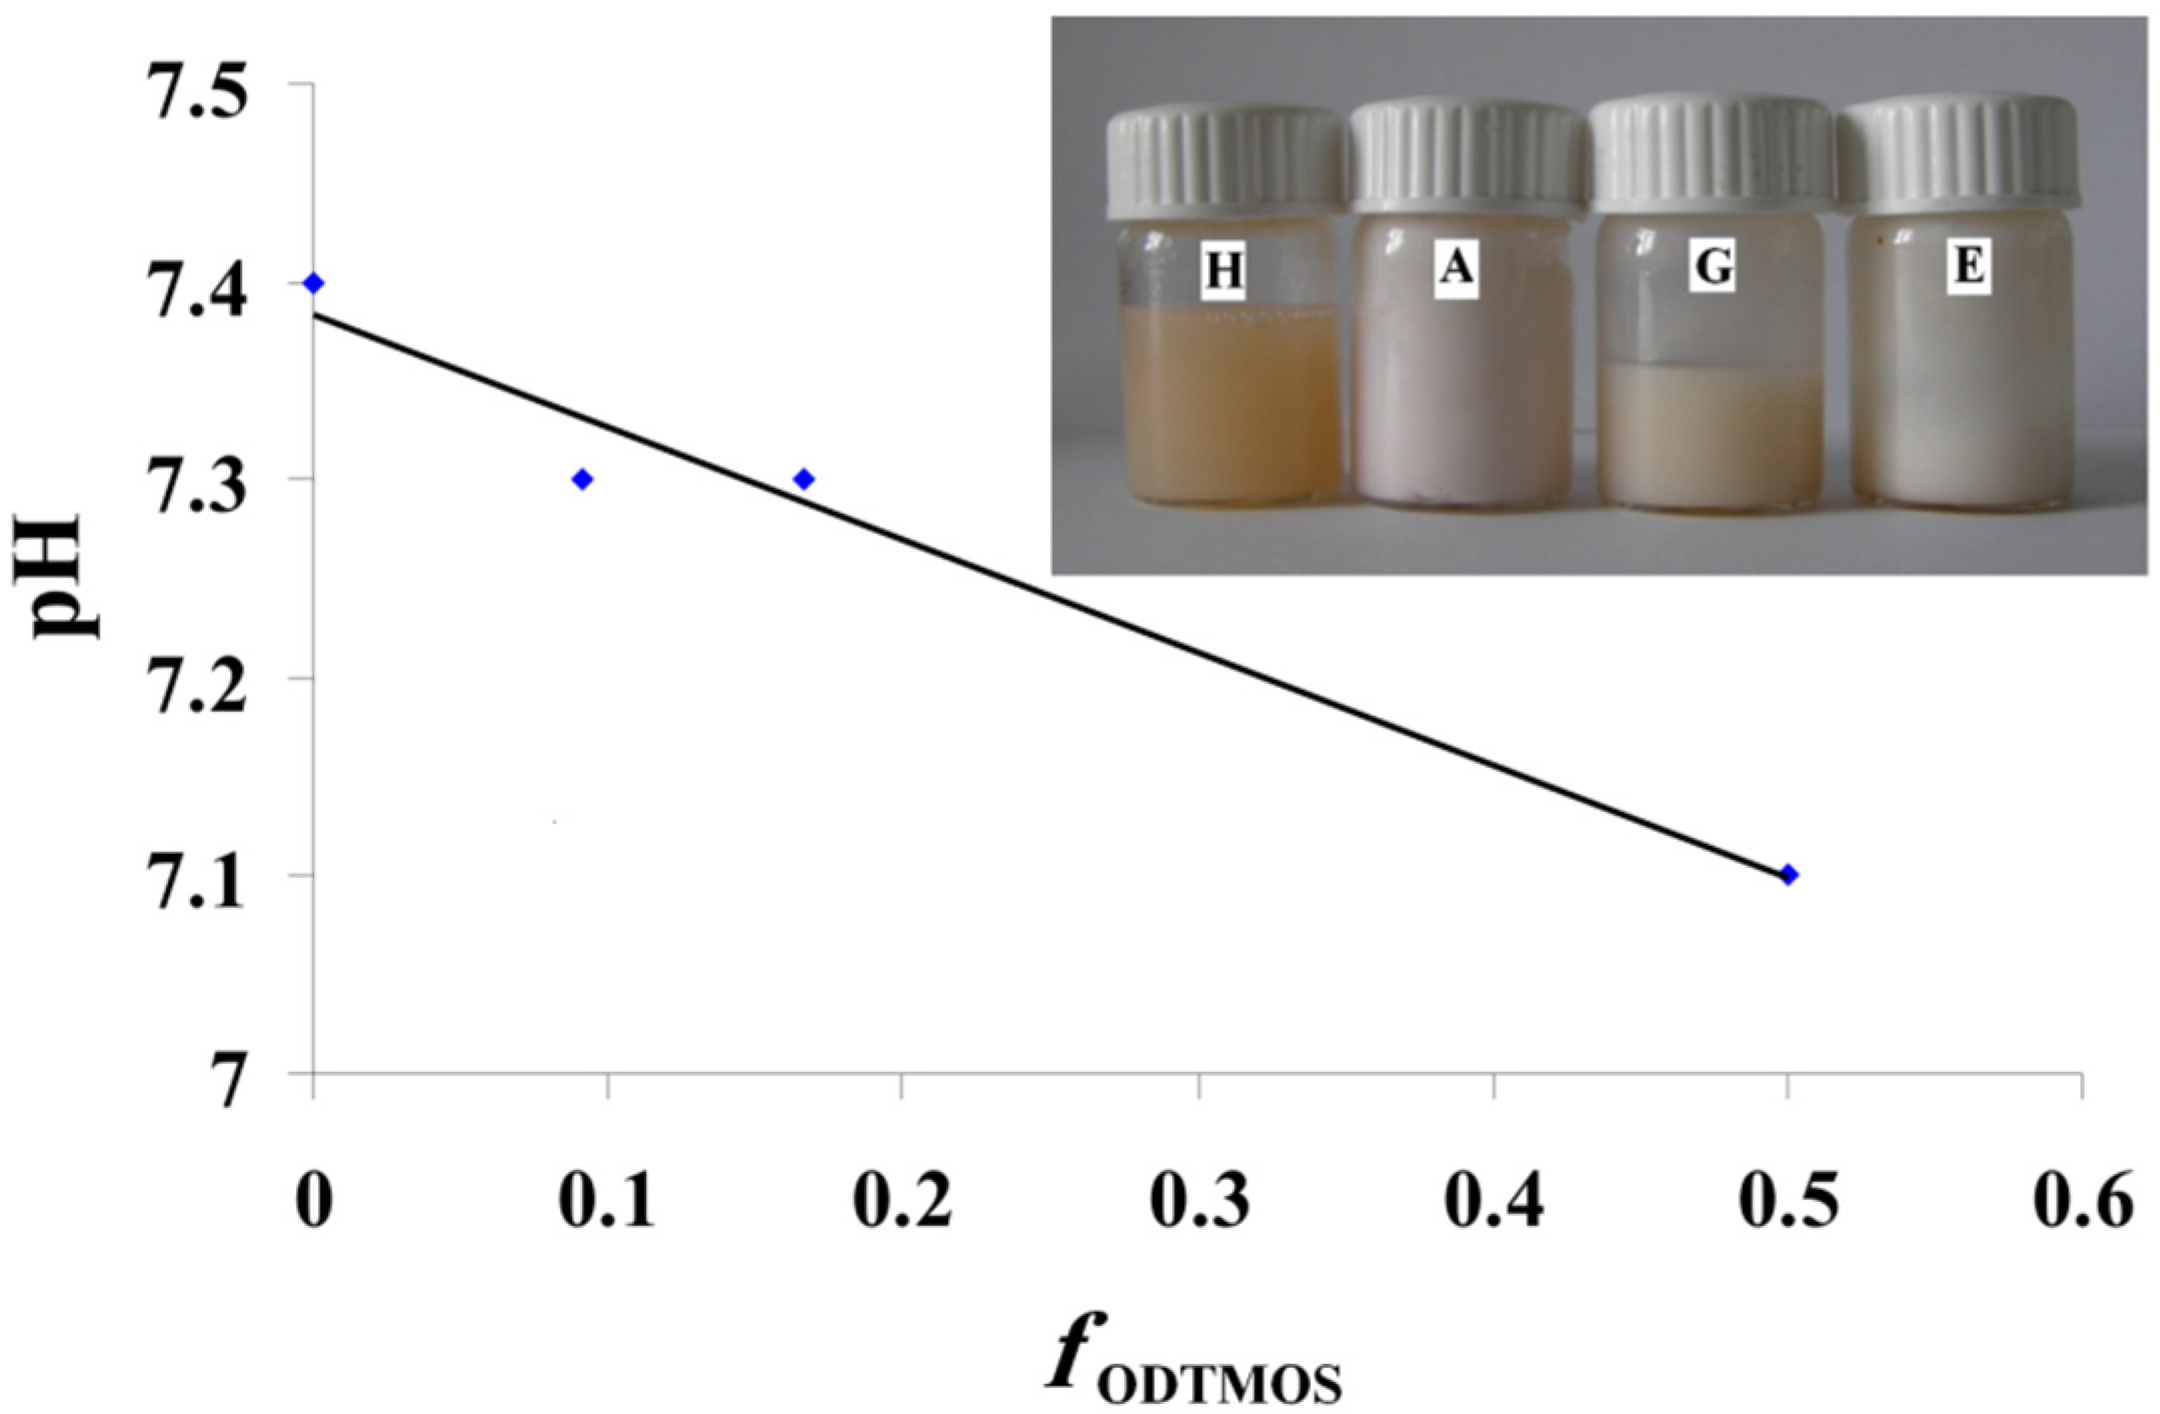
In
Figure 4, we have the modification of pH depending on the ODTMOS fraction. The increase of the ODTMOS fraction causes the increase of the content of saturated long chains and of silica from silane. The decrease of the pH can be due the increase of H
+ ion concentration from the newly obtained hybrids. The modification of the pH value is not very significant and does not exceed the usual range of 7.1–7.4 recorded for an OLA/OLANa complex as in [
32].
The inset picture is an additional proof of the preparation of stable dispersions, containing red-dyed olive oil. As mentioned earlier, for all the prepared systems, the dispersions were stable and homogeneously colored. The apparently homogeneous dispersions indicate the ability of oil phase encapsulation inside the OLA/OLANa system.
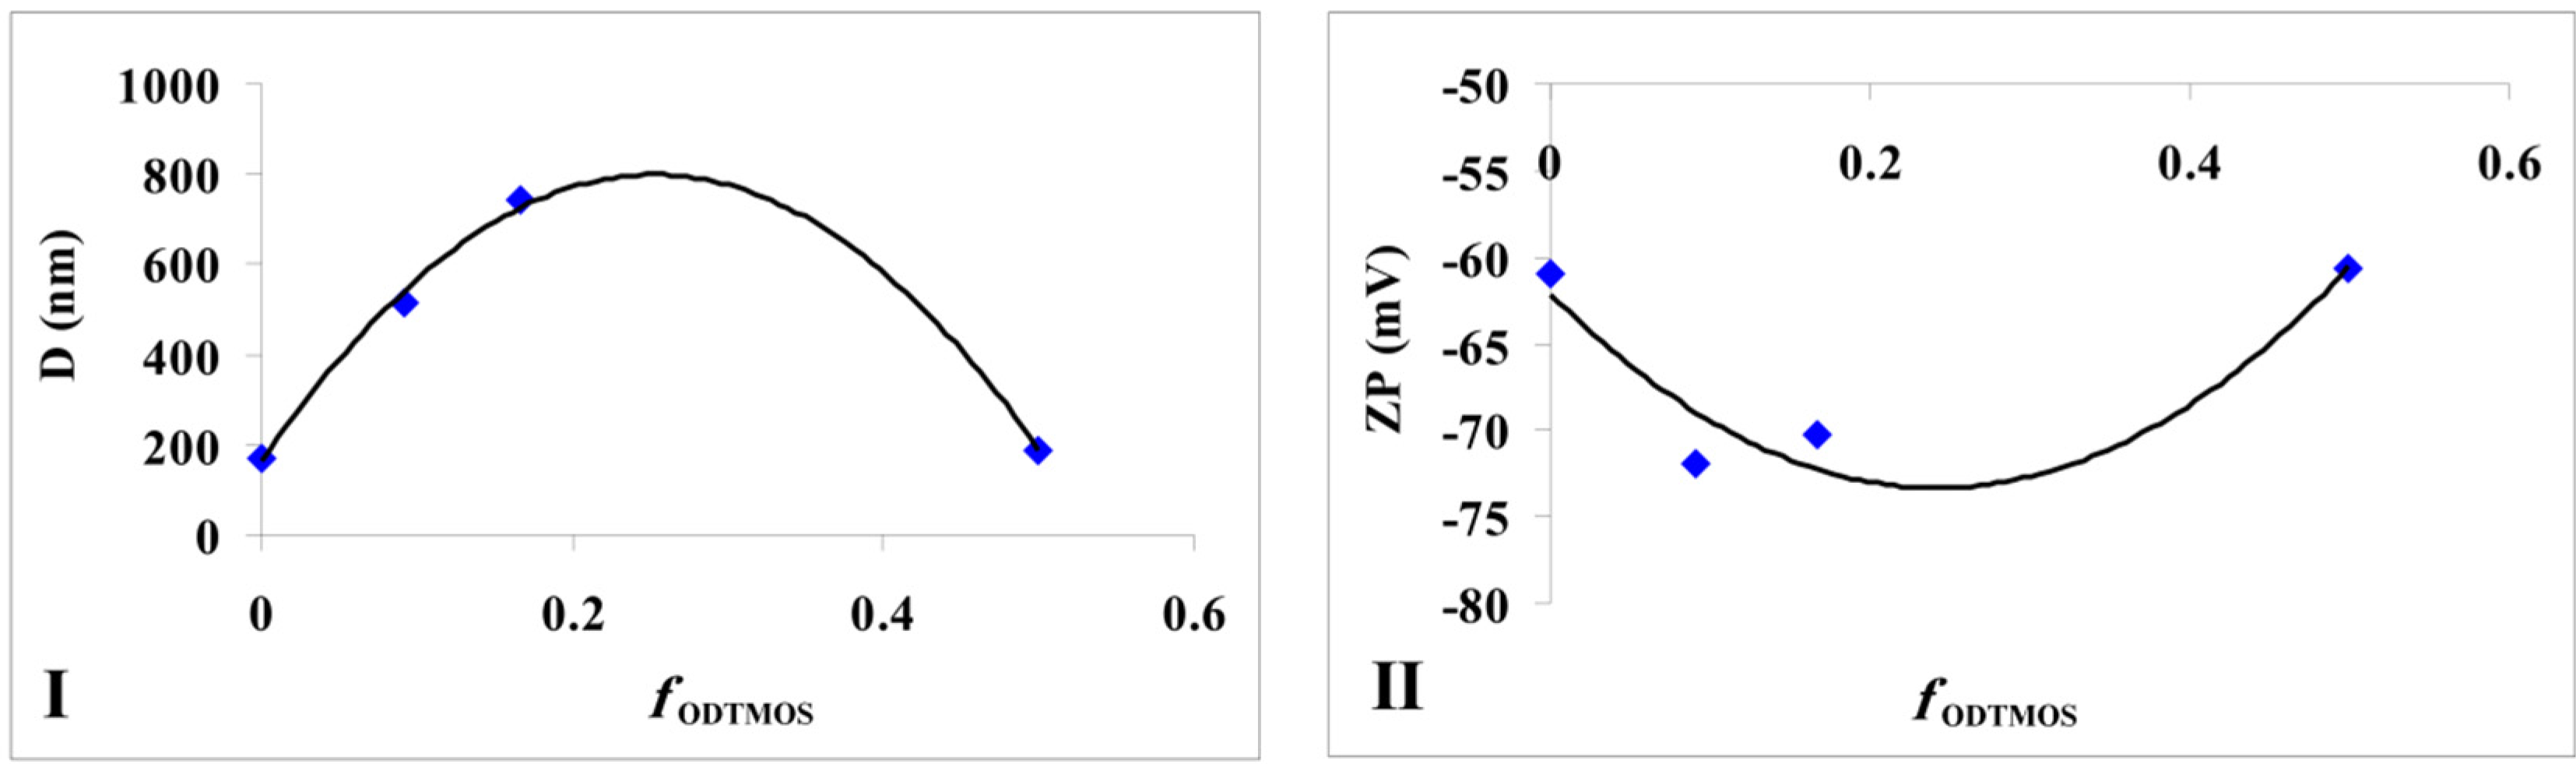
The average diameters of the aggregates formed by silica particles in the acid/soap mixture and the values of the zeta potential are presented in
Table 1. The modifications that occur by varying the ODTMOS concentration were carried out at an optimal ratio of OLA/OLANa = 1/1 (
samples A,
E,
G and
H). As in the previous report that studied the influence of grafting octadecyl groups onto a silica particle’s surface [
36], we could not also distinguish a monotonous modification of the particle dimensions (
Figure 5I).
Figure 4.
The modification of pH depending on the ODTMOS fraction; Inset picture: The dispersions prepared at OLA/Na 2/1 (mole/mole) and 0/1(sample H); 1/1 (sample A); 1/5 (sample G) and 1/10 (sample E) (ODTMOS/SiO2 (mole/mole)).
Figure 4.
The modification of pH depending on the ODTMOS fraction; Inset picture: The dispersions prepared at OLA/Na 2/1 (mole/mole) and 0/1(sample H); 1/1 (sample A); 1/5 (sample G) and 1/10 (sample E) (ODTMOS/SiO2 (mole/mole)).
Figure 5.
The modification of silica particles (I) average diameters and (II) zeta potential depending on the fraction of ODTMOS.
Figure 5.
The modification of silica particles (I) average diameters and (II) zeta potential depending on the fraction of ODTMOS.
If in a previous study [
36], the maximum value of particle diameters was obtained at a ratio of ODTMOS/TEOS = 1/10, in our case occurring at a ratio of ODTMOS/SiO
2 = 1/5 (
sample G). The complex behavior reflected by the morphology of hydrophobic silica particles [
36], as well as the interaction of C
18 chains (originating from ODTMOS’s condensation) with silica induced the formation of aggregates with a maximum diameter of 740 nm (
sample G,
Table 1). One can notice that, from this type of association, the zeta potential has a maximum absolute value when compared with the extremes (
samples A and respectively
sample H;
Figure 5II).
Combining several analysis methods (DLS, TEM, SEM, SANXN), Brambilla [
36] presented a pattern to explain the modification of silica particles by the aggregation of octadecyl groups inserted after grafting the hydrolized ODTMOS. Thus, the silica particles changed their morphology, from a spherical to lamellar shape. The final dimensions of the composite particles are modified at a certain substitution degree due to the association in lamellar structures. In the present work, it was established that, in the case of OLA/Na = 2/1, hence at OLA/OLANa = 1/1 (
Table 1), the formation of SDA vesicular structures allows the association of hybrid particles at maximum dimensions at a ratio of ODTMOS/SiO
2 = 1/5 (
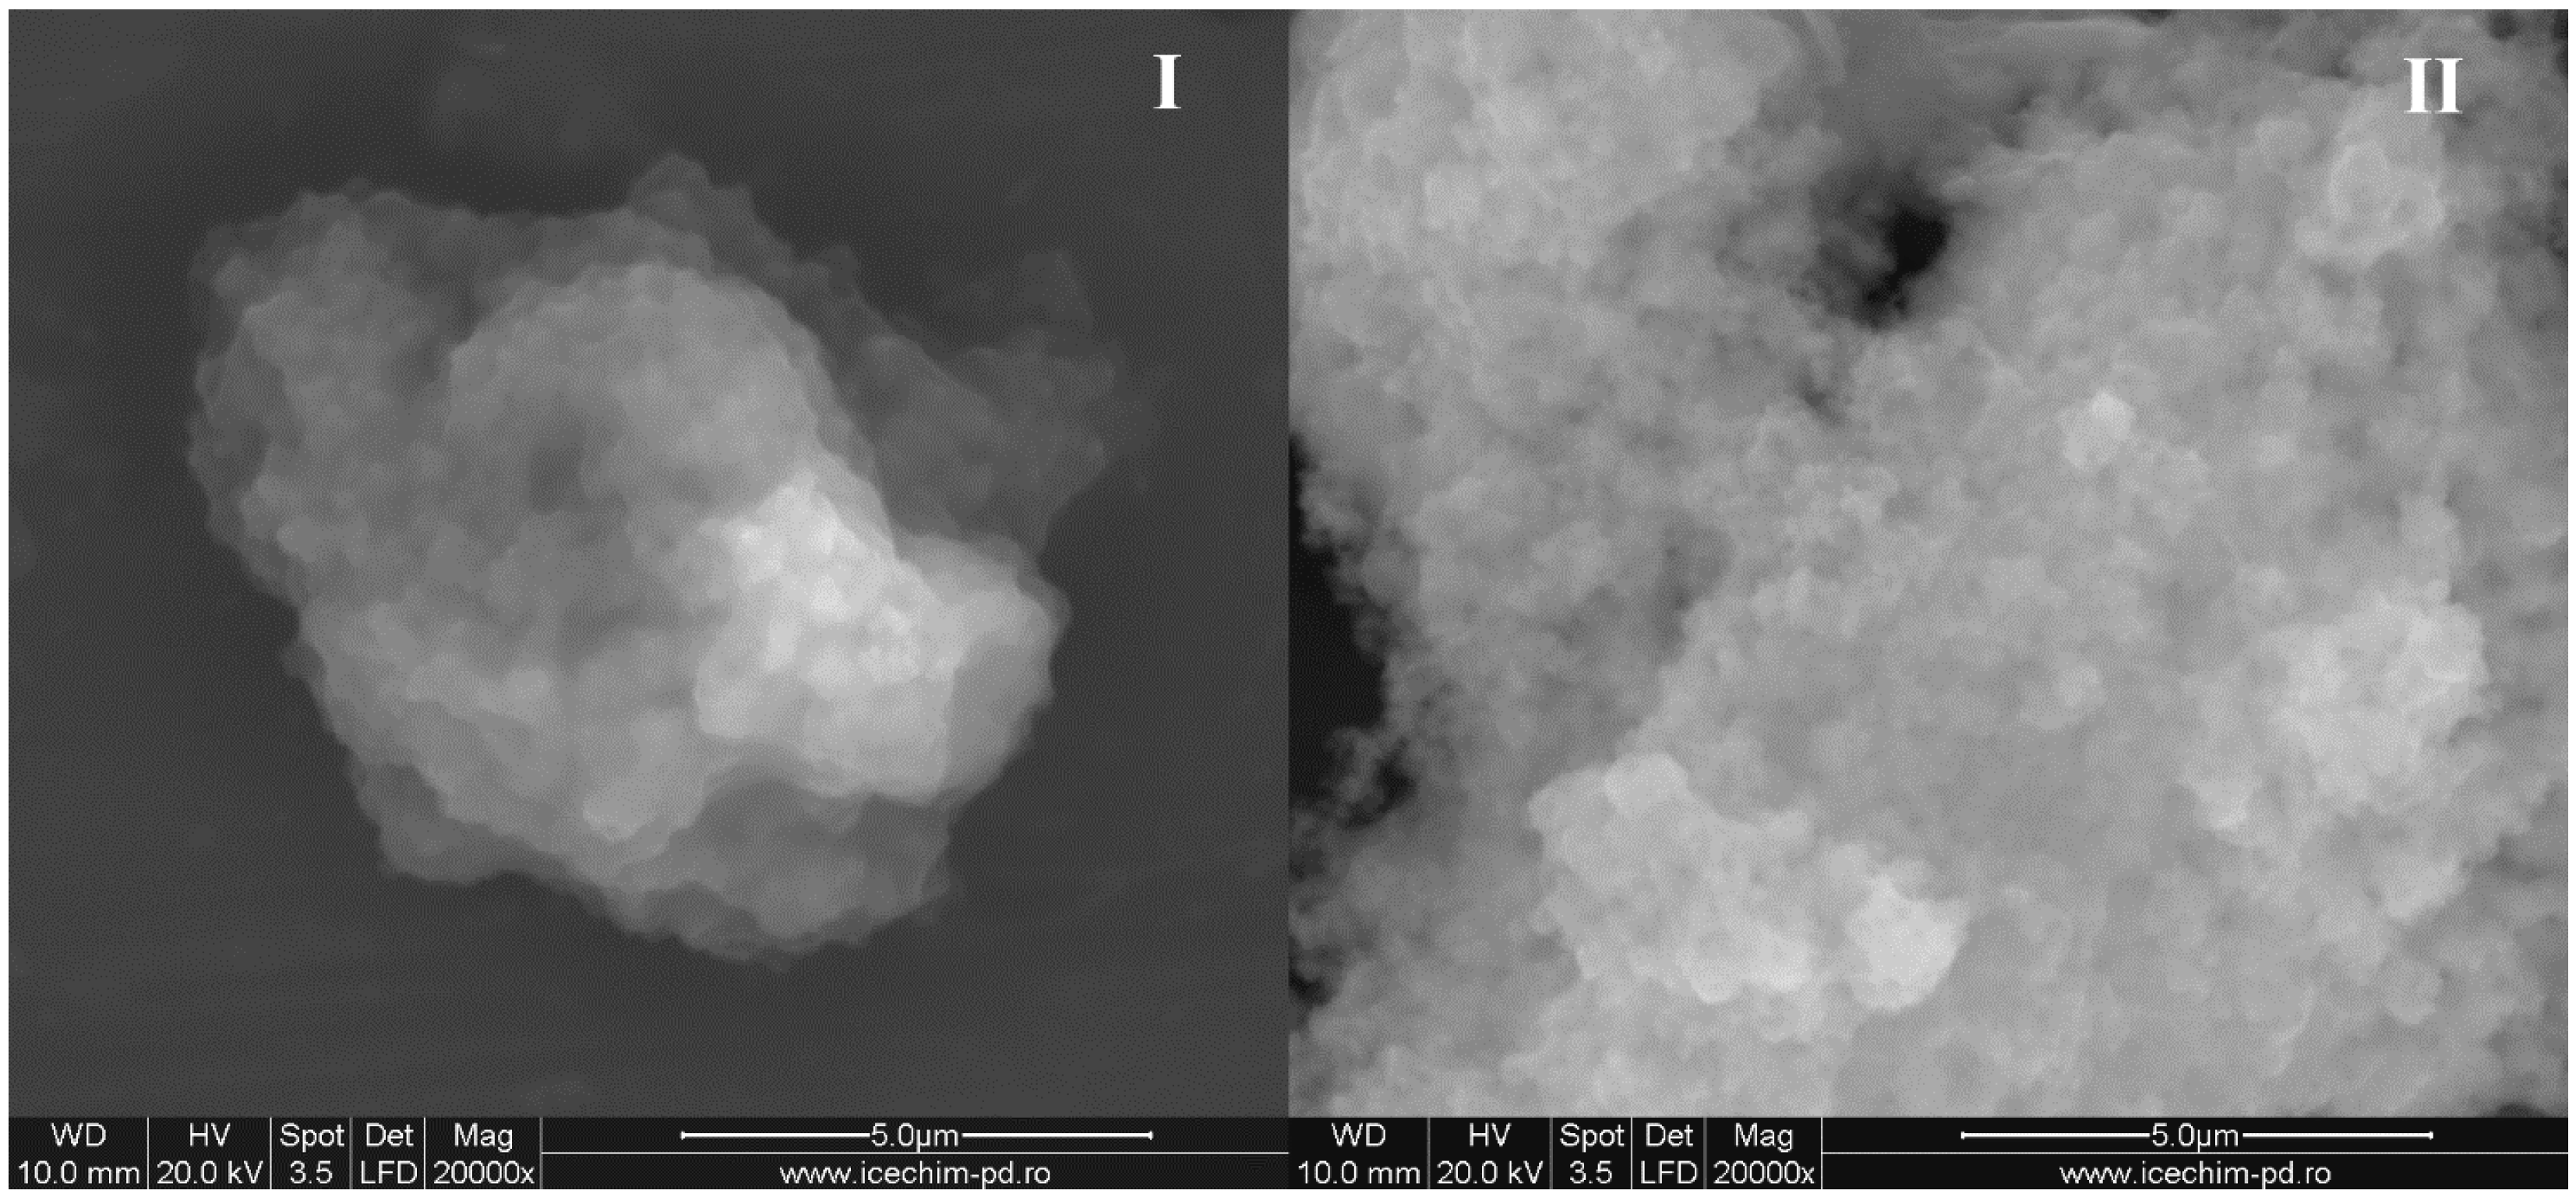
sample G). These results are also confirmed by the SEM measurements. In
Figure 6 it can be seen that, without hydrophobic substitution, the silica particles obtained in the presence of OLA/OLANa vesicles are associated in a spherical shape (
sample H). In the presence of the octadecyl chains resulting from the reaction with ODTMOS, the aggregates adopt an associated lamellar structure, with larger sizes than the unsubstituted ones (
samples A and
H). The results presented in
Figure 5 and
Figure 6 were also verified by replacing ODTMOS with octadecyltriethoxysilane.
Figure 6.
SEM pictures of (I) sample A (1/1 ODTMOS/SiO2) and (II) sample H (0/1 ODTMOS/SiO2) at 2/1 OLA/Na.
Figure 6.
SEM pictures of (I) sample A (1/1 ODTMOS/SiO2) and (II) sample H (0/1 ODTMOS/SiO2) at 2/1 OLA/Na.
For ODTMOS/SiO
2 = 1/1 molar ratio, the modification of OLA’s amount influenced the aggregates’ dimensions and the values of zeta potential. Also, the changing of the OLA/Na ratio (0.5/1 (
sample D), 1/1 (
sample C), 2/1 (
sample A) and 4/1 (
sample B)) causes modifications in the aggregates’ dimensions. Thus, for the maximum value of this ratio (
sample B), the average particle diameter significantly increases. The excess of OLA towards the OLA/OLANa complex induces an increase of average dimensions, which is in a good agreement with the results obtained for samples without ODTMOS (
Figure 2I). Although for an OLA/OLANa ratio < 1 the size of the aggregates does not exhibit great variation, the presence of ODTMOS leads to an increased association degree of the C
18 chains from the silica hydrophobized with OLA and oleyl chains. The mixtures are all opaque, except the ones from the
Figure 1-inset. The increase of the hydrophobic interactions causes modified morphologies, reflected in increased of zeta potential values with a maximum at a ratio of OLA/Na = 1/1 (
sample C). All dispersions with a strong alkaline pH (
samples C,
D and
J) are unstable. The results obtained for
sample I, where 50% of the Na ions were neutralized with HCl, and allowed the formation of stable dispersions are very important. After the partial neutralization with HCl, OLA/Na ratio becomes 1/0.5, which is equivalent to 2/1 OLA/OLANa ratio. In the case of a more reduced neutralization (
sample J), the final pH is 10 due to Na ion excess, and the dispersion is unstable.
Useful information’s regarding the interaction of hydrophobic groups from the synthesized dispersions, were also obtained by using DSC analysis. In good agreement with previously published results [
33], when undercooled dispersions were subjected to a controlled heating, two domains of the melting temperatures were distinguished. Because the ethanol was present in the system, the water melts under 0°C (
Table 1). The melting has its maximum between −2/−7 °C. The second melting interval assigned to the OLA/OLANa complex was determined around 10°C, in good agreement with another previous study [
33].
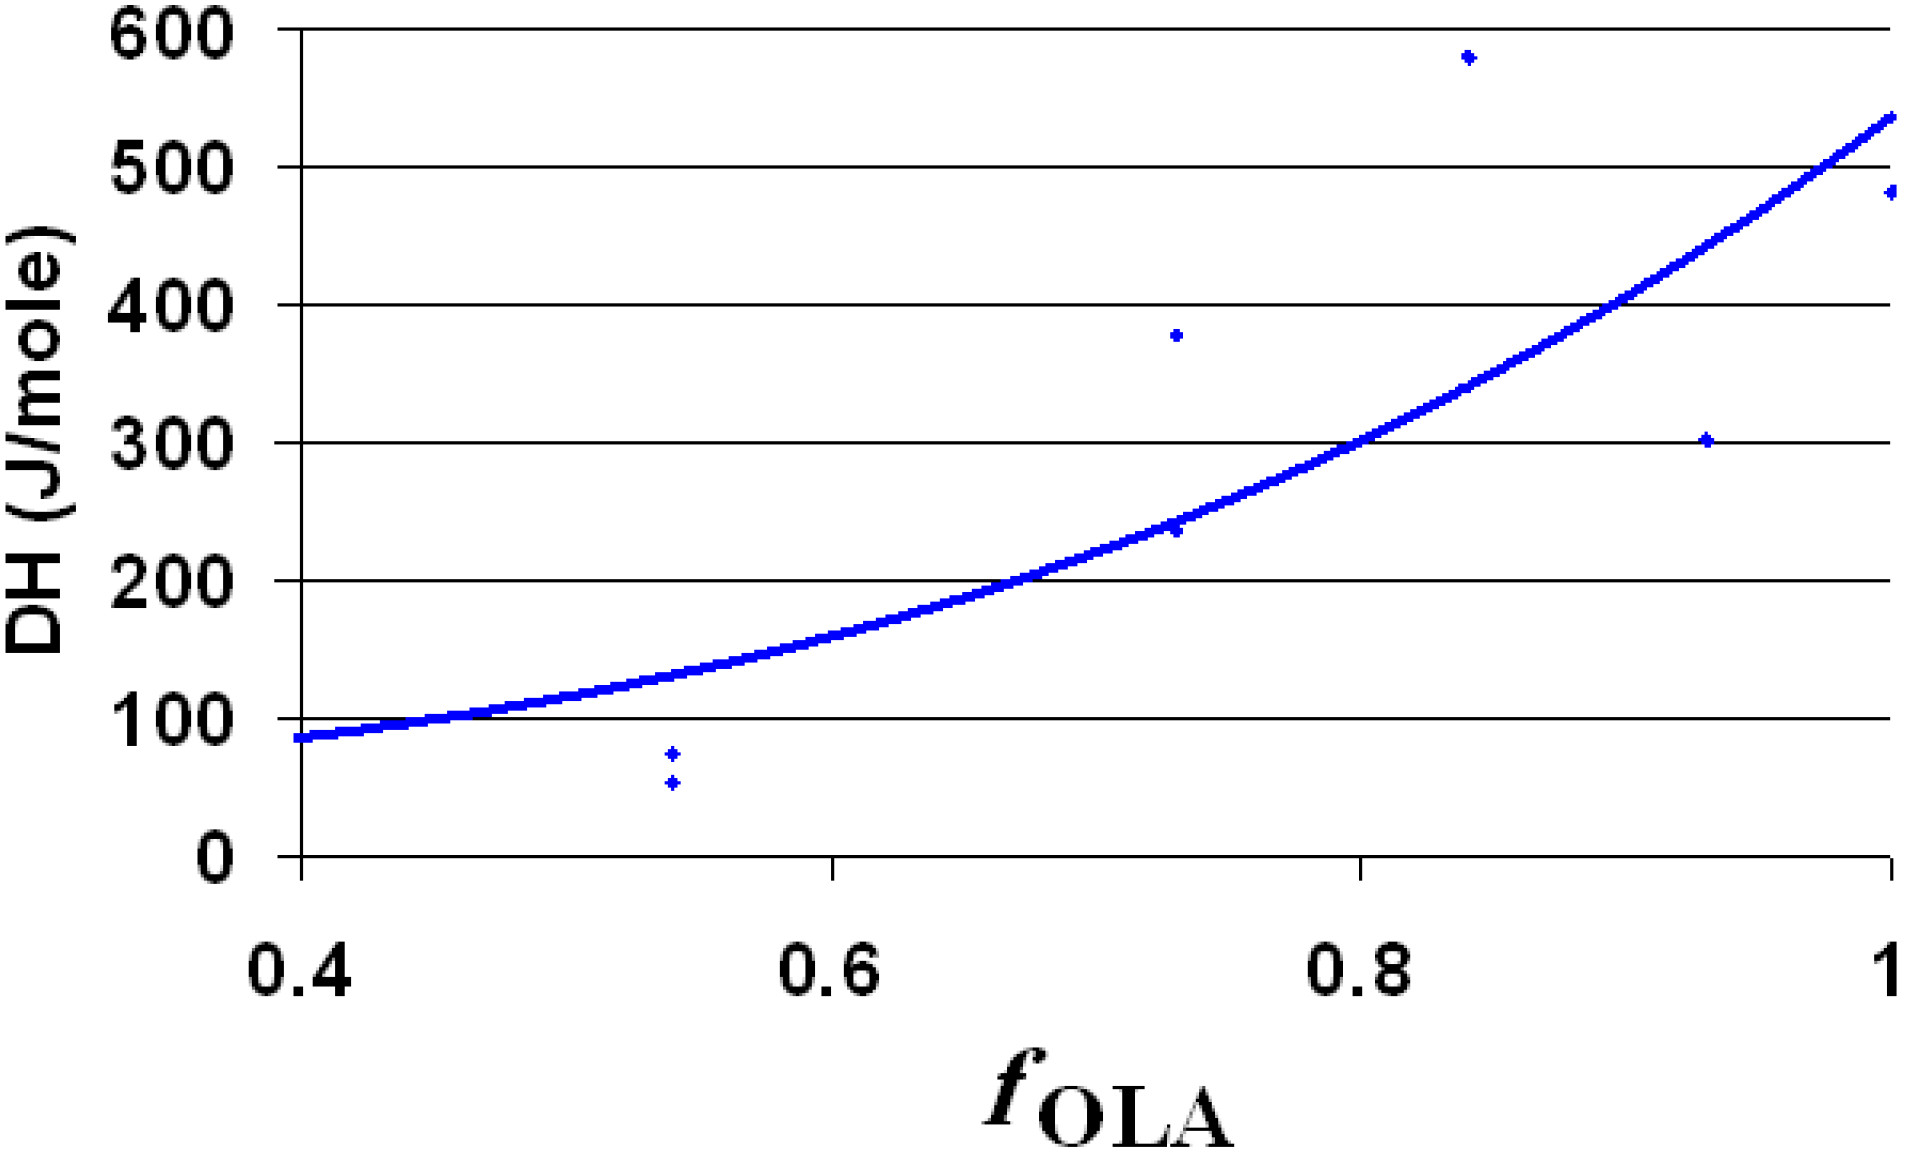
Next to the OLA/OLANa couple, the dispersions contain silica and octadecyl chains (from ODTMOS). The melting enthalpy of the hydrophobic areas (around 10 °C) is strongly affected by the ratio between OLA and ODTMOS. Consequently, the enthalpy was calculated taking into account the concentration of the full hydrophobic component (OLA + ODTMOS). The melting enthalpy assigned for 1 mole of hydrophobic component (OLA + ODTMOS) is strongly affected by the molar fraction of OLA, as observed from
Figure 7. The decrease of the overall melting enthalpy of hydrophobic areas presents a deviation along with the decrease of the mole fraction of OLA (
Figure 7). This deviation is probably caused by the formation of some complex aggregates in which OLA is involved, due to the increase of C
18 chains’ density.
Figure 7.
The melting enthalpy of 1 mole of hydrophobic component (OLA + ODTMOS) as function of molar ratio of OLA (fOLA = mole OLA/mole (OLA + ODTMOS)).
Figure 7.
The melting enthalpy of 1 mole of hydrophobic component (OLA + ODTMOS) as function of molar ratio of OLA (fOLA = mole OLA/mole (OLA + ODTMOS)).
The value of the melting enthalpy per mole for OLA (
Figure 7 and
Table 1) is smaller than in the case where the aqueous phase contains only the OLA/OLANa complex [
26]. This modification of enthalpy is probably due to a plasticizing phenomenon caused by the presence of ethanol. An argument for this statement is the observation that the dispersion of un-modified silica (
sample H,
Table 1) is fluid, in comparison with those obtained without co-surfactant (EtOH) (
Figure 2).
In solid state, the interactions between the two hydrocarbon chains (oleyl of OLA and octadecyl of ODTMOS) are also preserved. After the dispersions were dried, the maximum temperature at which the solid mixtures are thermally decomposed in air decreases with the increasing of OLA content (
Table 1). This phenomenon is caused by a more reduced thermal stability of the oleyl chains, which contains double bonds. In a future study, the properties of the hybrid solids will be carefully analyzed by TGA and other methods. The data analyzed above helped to prove that, in “
green chemistry” conditions, hydrophobic modified silica could be obtained.
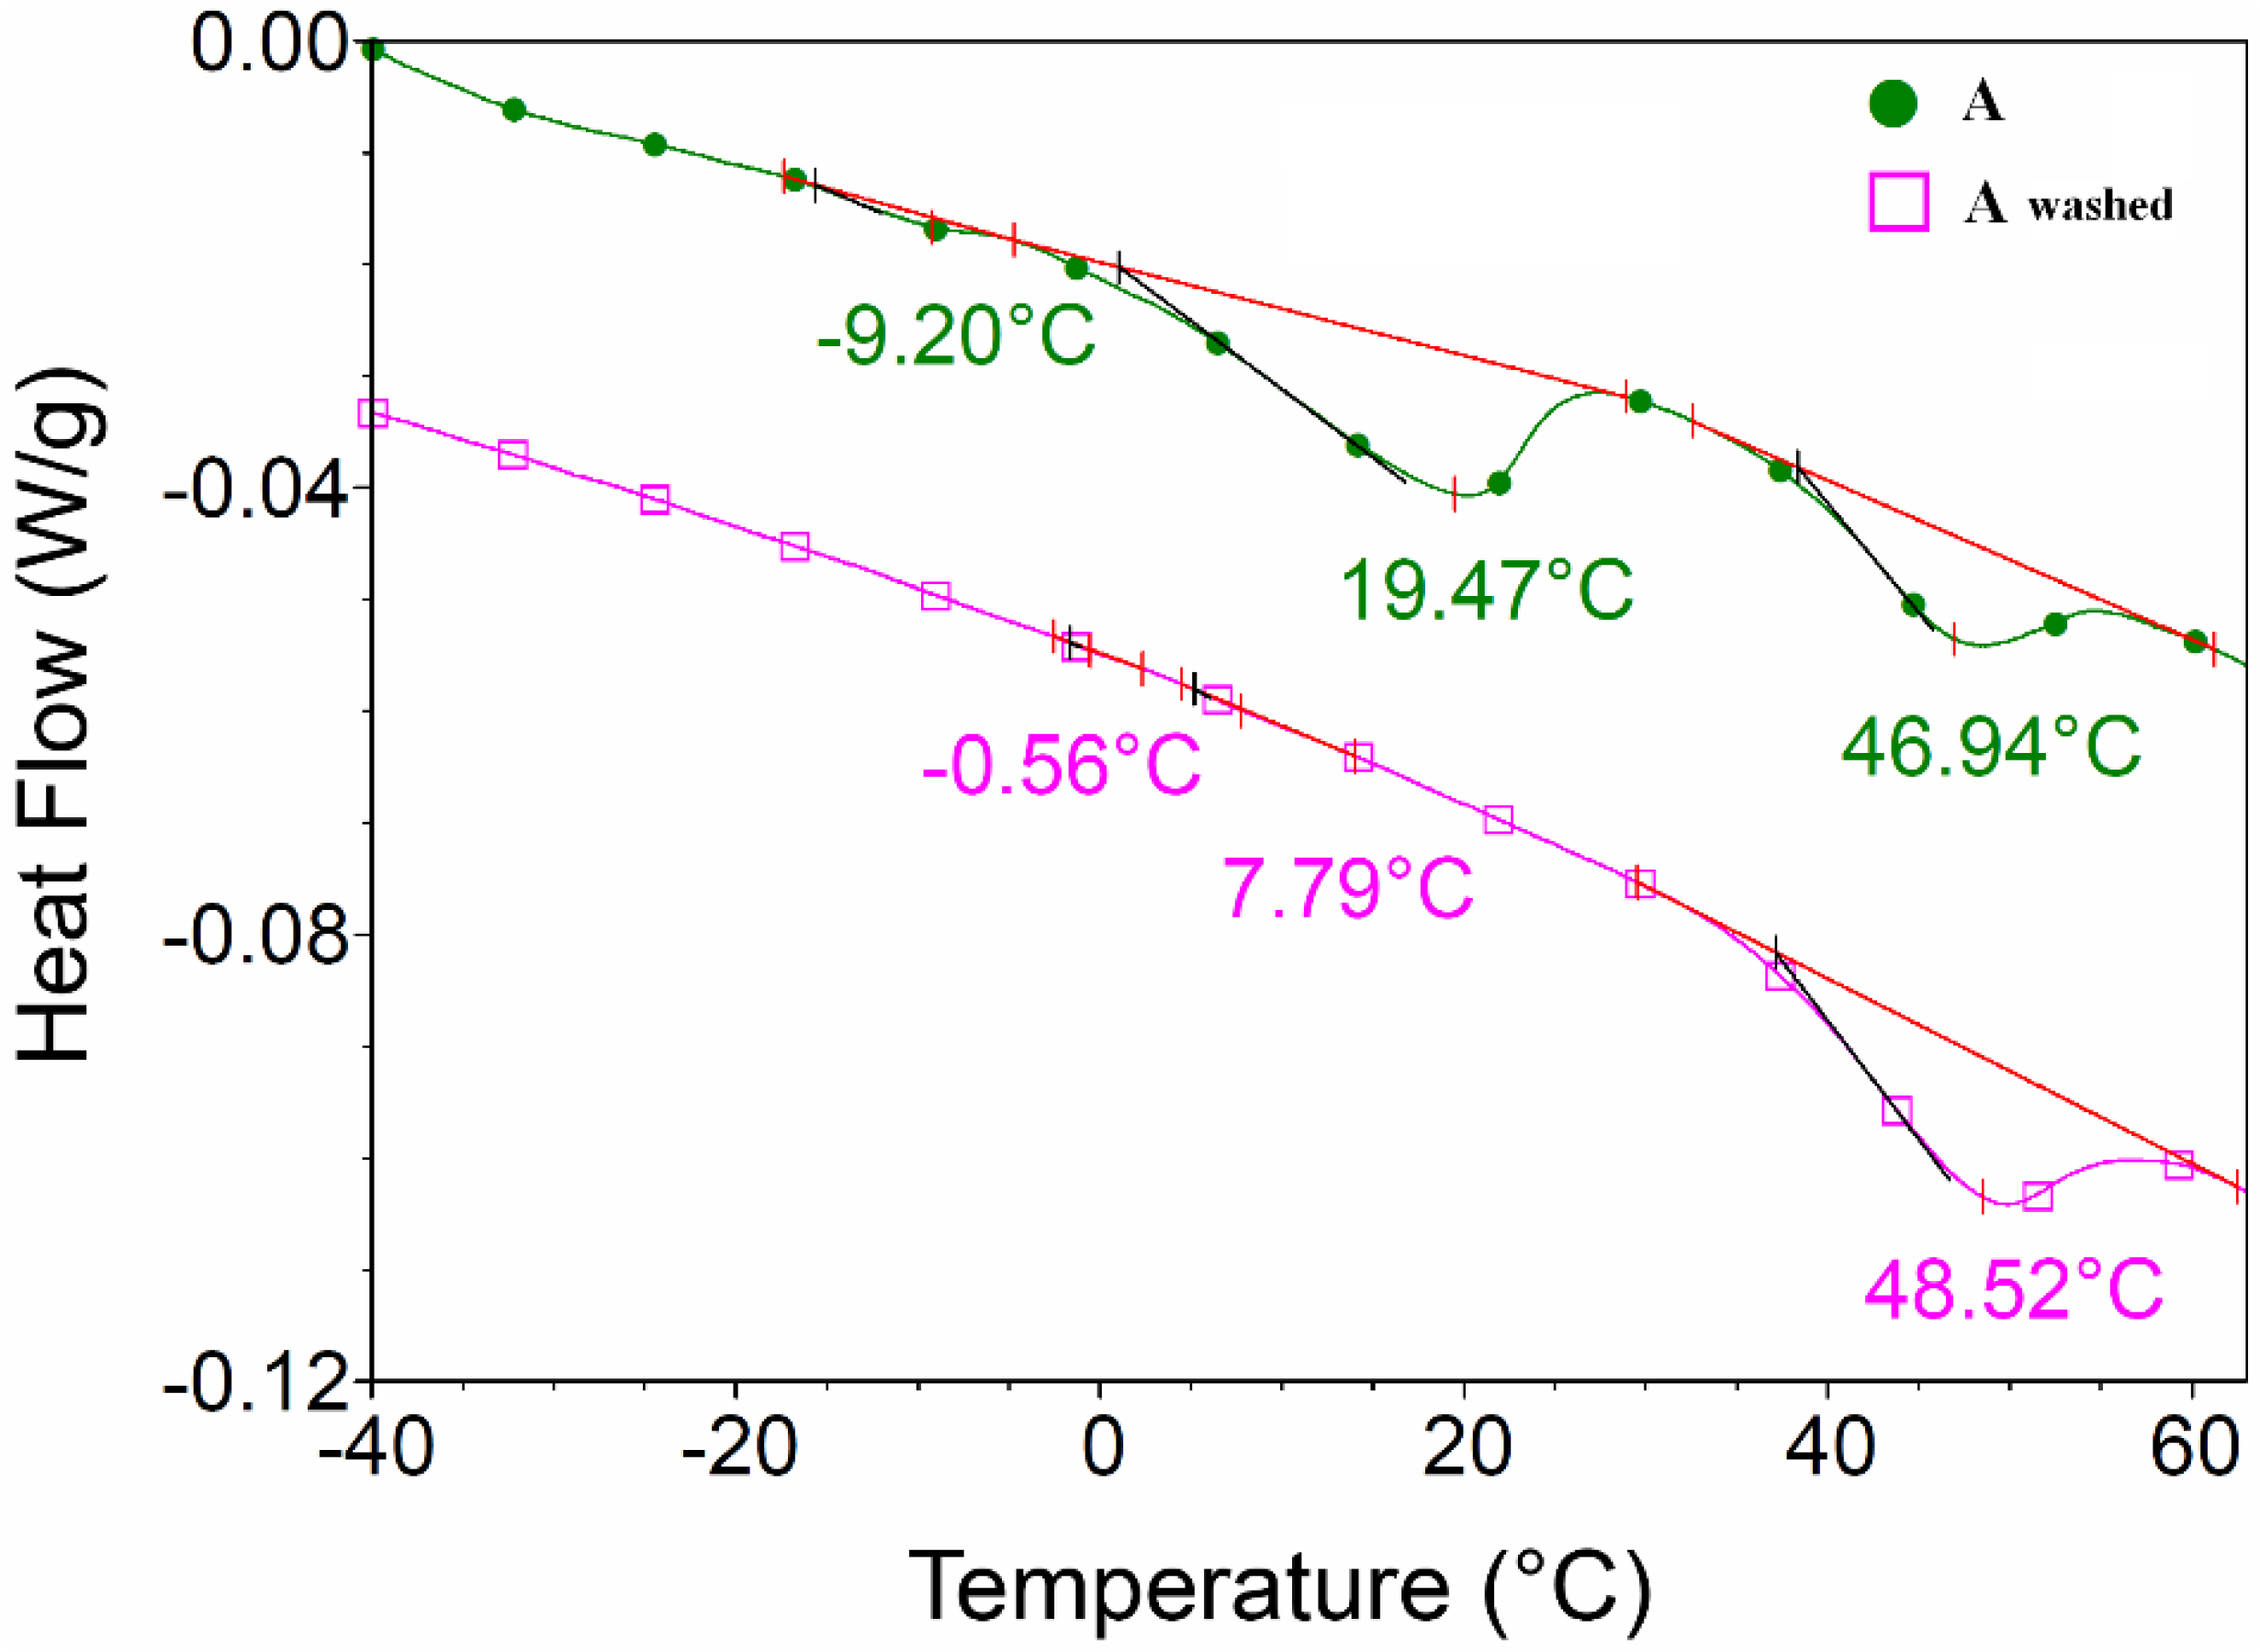
In order to facilitate the thermal decomposition of the hydrocarbon chains, OLA was removed by washing it off with ammonium hydroxide and centrifugation. The lack of OLA in the washed samples was demonstrated by DSC analysis.
DSC analysis of
sample A (as synthesized and washed,
Figure 8) showed that OLA transition with maximum at 19.47 °C disappeared after OLA elimination with ammonium hydroxide.
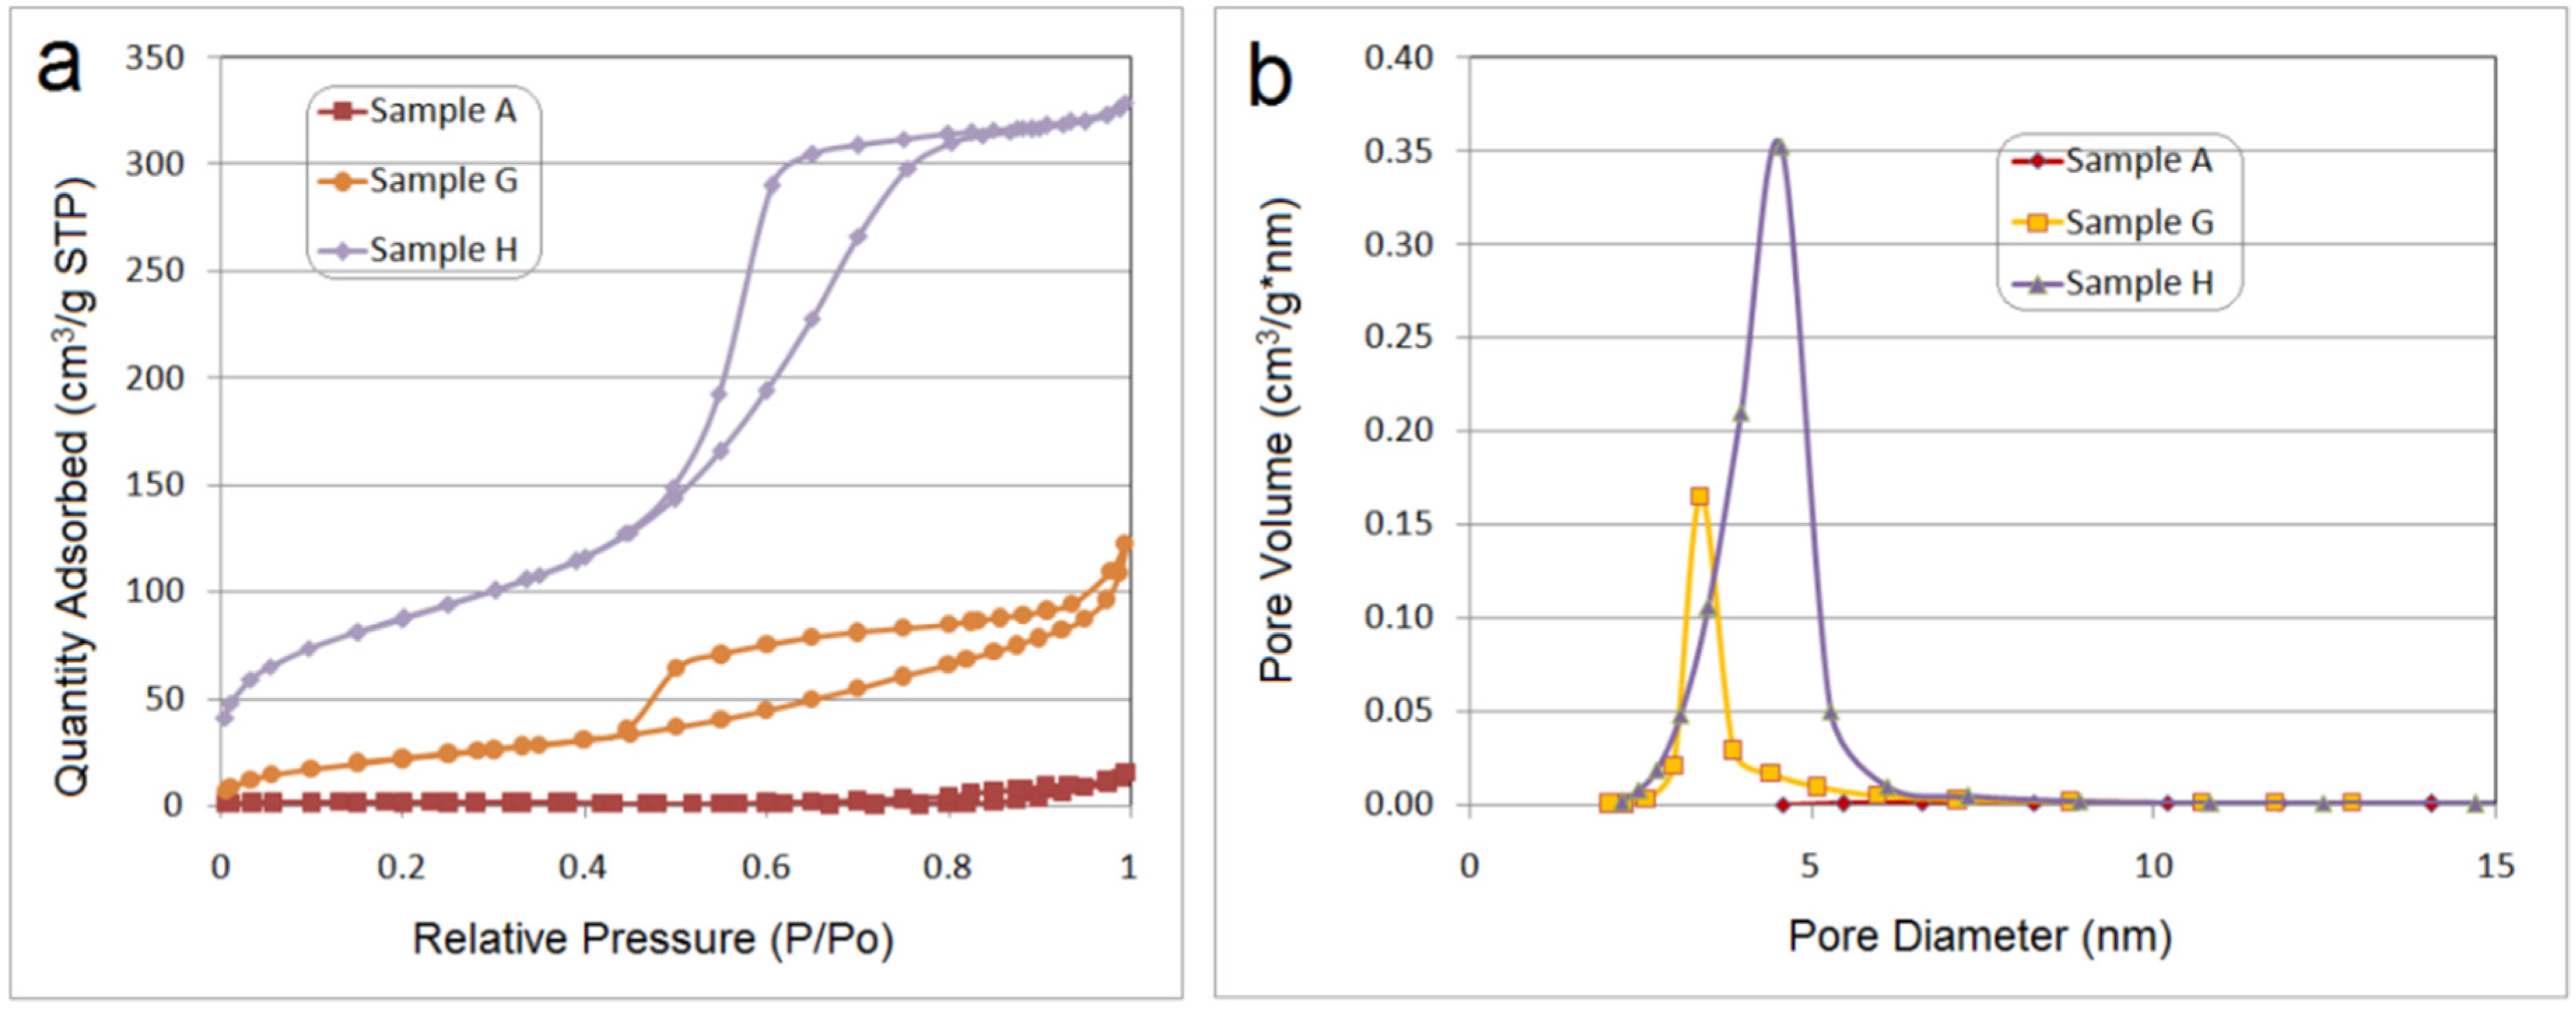
Our ultimate challenge was to obtain mesoporous silica particles. In order to demonstrate the existence of nanopores in the calcinated silica, the nitrogen adsorption isotherm at −196 °C for
samples A,
G,
H obtained at a substitution ratio ODTMOS/SiO
2 = 1/1, 1/5 and 0/1 is presented in
Figure 9.
Figure 8.
Differential scanning calorimetry (DSC) analysis of sample A (as synthesized and washed with ammonium hydroxide).
Figure 8.
Differential scanning calorimetry (DSC) analysis of sample A (as synthesized and washed with ammonium hydroxide).
Figure 9.
(a) Nitrogen isotherms for calcined samples (A, G and H); (b) Barrett-Joyner-Halenda (BJH) desorption dV/dD pore volume for A, G and H samples (OLA/ Na = 2/1; ODTMOS /SiO2 = 1/1, 1/5, 0/1).
Figure 9.
(a) Nitrogen isotherms for calcined samples (A, G and H); (b) Barrett-Joyner-Halenda (BJH) desorption dV/dD pore volume for A, G and H samples (OLA/ Na = 2/1; ODTMOS /SiO2 = 1/1, 1/5, 0/1).
The results from
Figure 9, showed a similar behavior as for silica obtained with oleylamines [
15]. A mutual element is the presence, beside the “ink bottle”-like mesopores, of inter-particle textural mesopores, above the relative pressure of 0.8. These textural pores are due to the aggregation of silica particles associated in lamellar aggregates, produced by the interaction of octadecyl substituents with oleyl groups from OLA/OLANa vesicular structures.
From the data presented in
Table 2, it may be concluded that Brunauer-Emmett-Teller (BET) surface and pore size are significantly affected by the octadecyl chain concentration present in the pristine hybrids.
Table 2.
Nitrogen physisorption data.
Table 2.
Nitrogen physisorption data.
| Sample No. | BET Surface Area (m2/g) | Pore Volume (cm3/g) | Pore Size (Desorption Branch) (nm) |
|---|
| A | 4.2147 | 0.0232 | 15.02 |
| G | 84.0391 | 0.1890 | 5.25 |
| H | 314.73 | 0.5089 | 4.45 |
The increase of the ODTMOS concentration, reduced the BET surface area due to the pore blocking phenomenon. As an additional observation, after the heat treatment of sample A, the final silica was apparently grey, confirming the lack of thermal destruction of the trapped ocatadecyl chain.


 ,
, 


