2.1. SEM and TEM Investigations
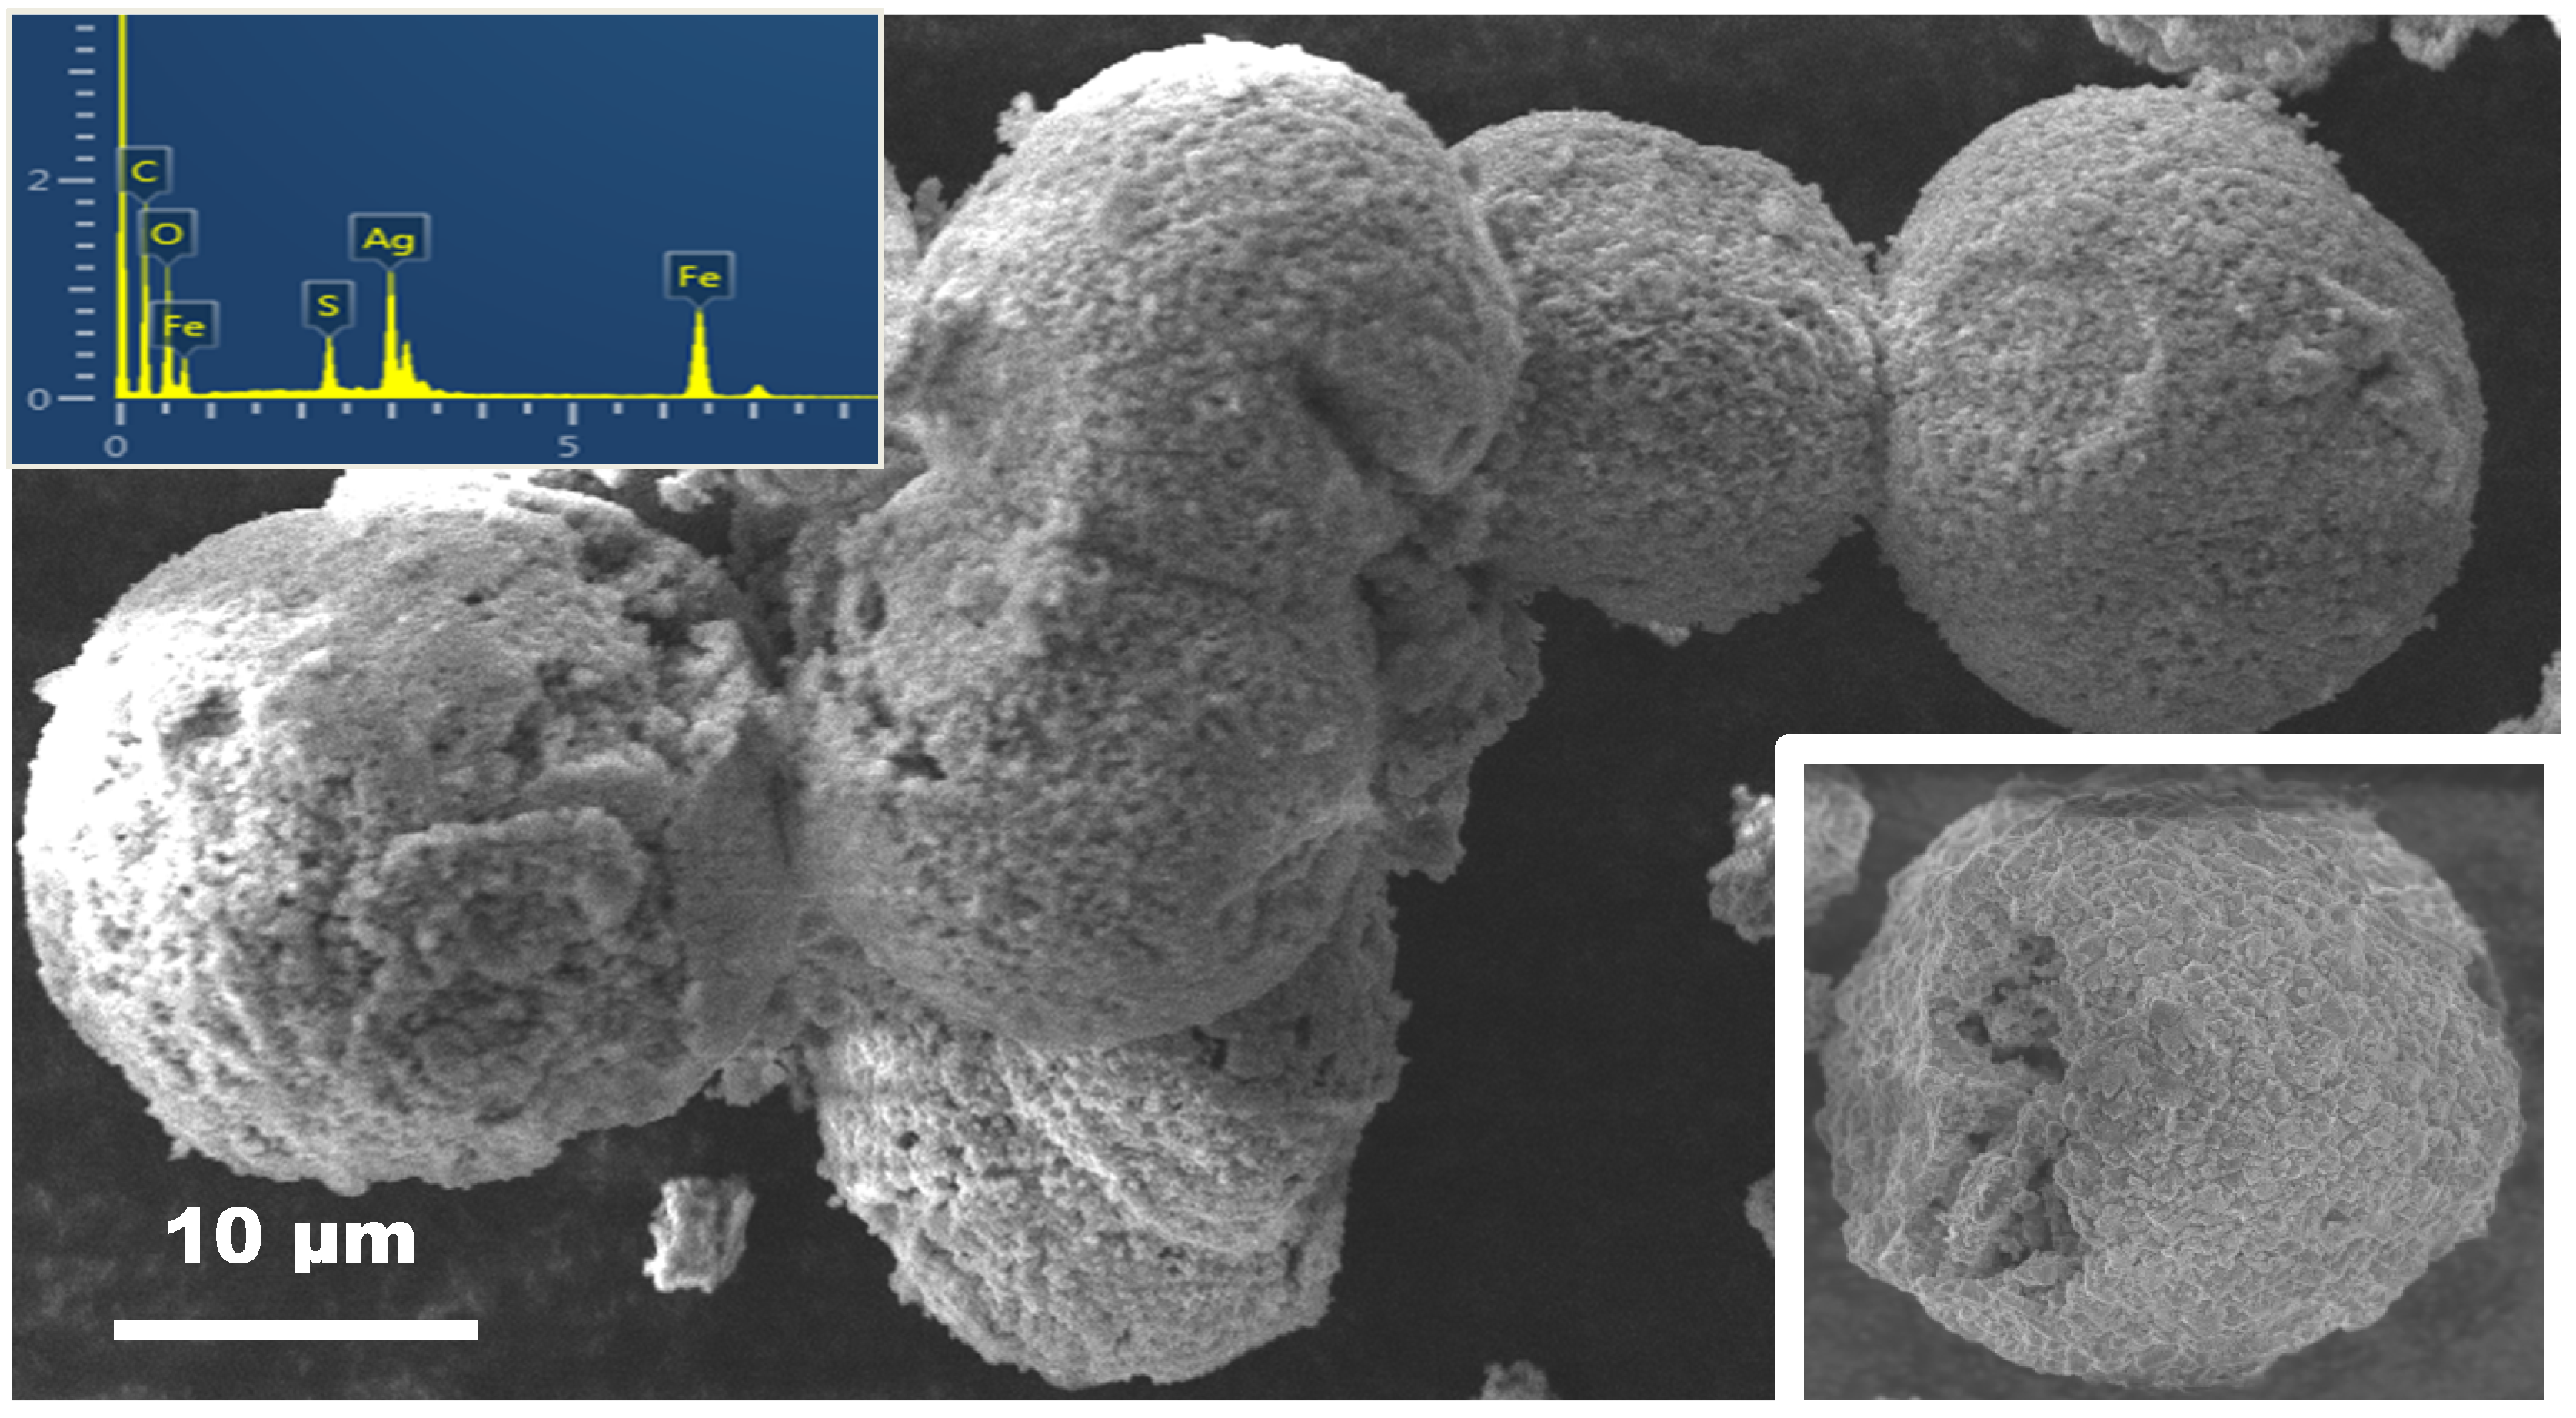
Figure 1 shows a panoramic view of the morphology of Ag@α-Fe
2O
3 composite sample annealed at 600 °C. Large spherical particle agglomerates, having an average size of about 50 μm, have been observed. The inset in
Figure 1 reports one such agglomerate, on which is well visible the void inside the structure. Energy-dispersive X-ray spectrum (EDX) confirms that the nanocomposite contains Ag, Fe and O as the main elements. Sulfur, coming from the raw material used as precursors, is also evidenced. The presence of Cu and C in the spectrum is due to the grid used for the scanning electron microscopy (SEM) observation.
Figure 1.
Scanning electron microscopy (SEM) micrograph showing the morphology of Ag@α-Fe2O3 composite. In the inset are shown one single agglomerate and the energy-dispersive X-ray spectrum (EDX) spectrum.
Figure 1.
Scanning electron microscopy (SEM) micrograph showing the morphology of Ag@α-Fe2O3 composite. In the inset are shown one single agglomerate and the energy-dispersive X-ray spectrum (EDX) spectrum.
To have indications about the distribution of these elements on the sample surface, EDX elemental mapping analysis of the composite has been undertaken.
Figure 2 shows the EDX elemental mapping of one particles aggregate, where the X-ray signal coming from Ag, Fe, and O, are represented by blue, green and yellow color, respectively. Data obtained shows the good uniformity regarding the spatial distribution of all these elements in the nanocomposite.
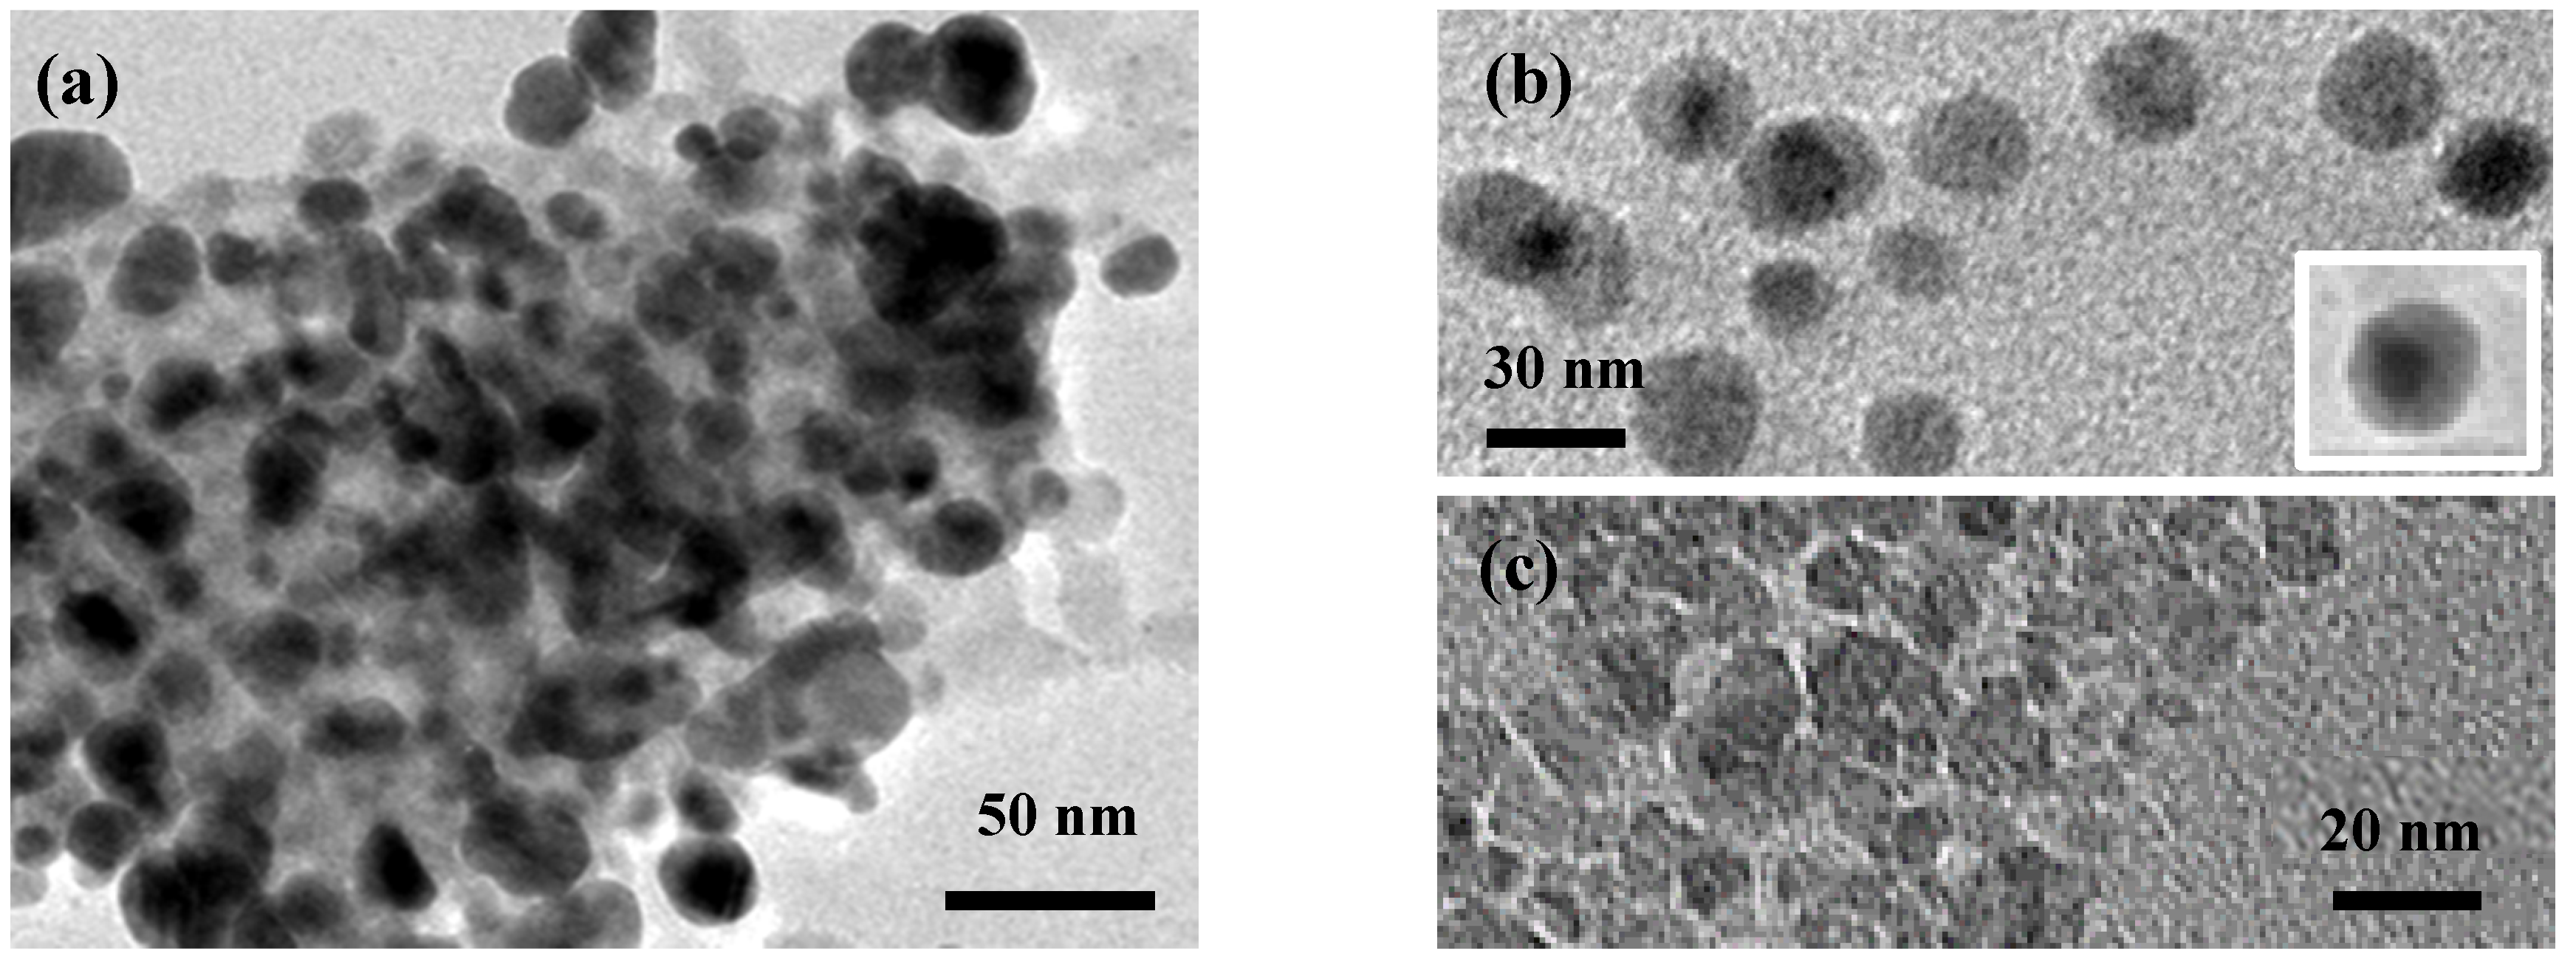
Transmission electron microscopy (TEM) analysis has been also performed to investigate the microstructure of the composite sample.
Figure 3a reports a TEM image of the composite sample showing one large aggregate of nanoparticles.
In
Figure 3b are visible isolated composite nanoparticles showing the core formed by Ag nanoparticles (AgNPs) 10–20 nm in diameter, surrounded by a shell of iron oxide having an average thickness of about 10–20 nm. It is interesting to note that, compared to α-Fe
2O
3 sample (see
Figure 3c), Ag@α-Fe
2O
3 nanoparticles appears to be almost round, suggesting that the presence of Ag NPs hinders the crystallization process of the iron oxide. This is in agreement with XRD pattern of the Ag@α-Fe
2O
3 composite (not shown), which highlight the presence of metallic Ag while peaks of α-Fe
2O
3 are of very low intensity.
Figure 2.
EDX elemental mapping showing the spatial distribution of Ag, Fe and O elements on the surface of the Ag@α-Fe2O3 nanocomposite agglomerate showed in the SEM image.
Figure 2.
EDX elemental mapping showing the spatial distribution of Ag, Fe and O elements on the surface of the Ag@α-Fe2O3 nanocomposite agglomerate showed in the SEM image.
Figure 3.
Transmission electron microscopy (TEM) images of: (a) and (b) Ag@α-Fe2O3 composite; (c) α-Fe2O3.
Figure 3.
Transmission electron microscopy (TEM) images of: (a) and (b) Ag@α-Fe2O3 composite; (c) α-Fe2O3.
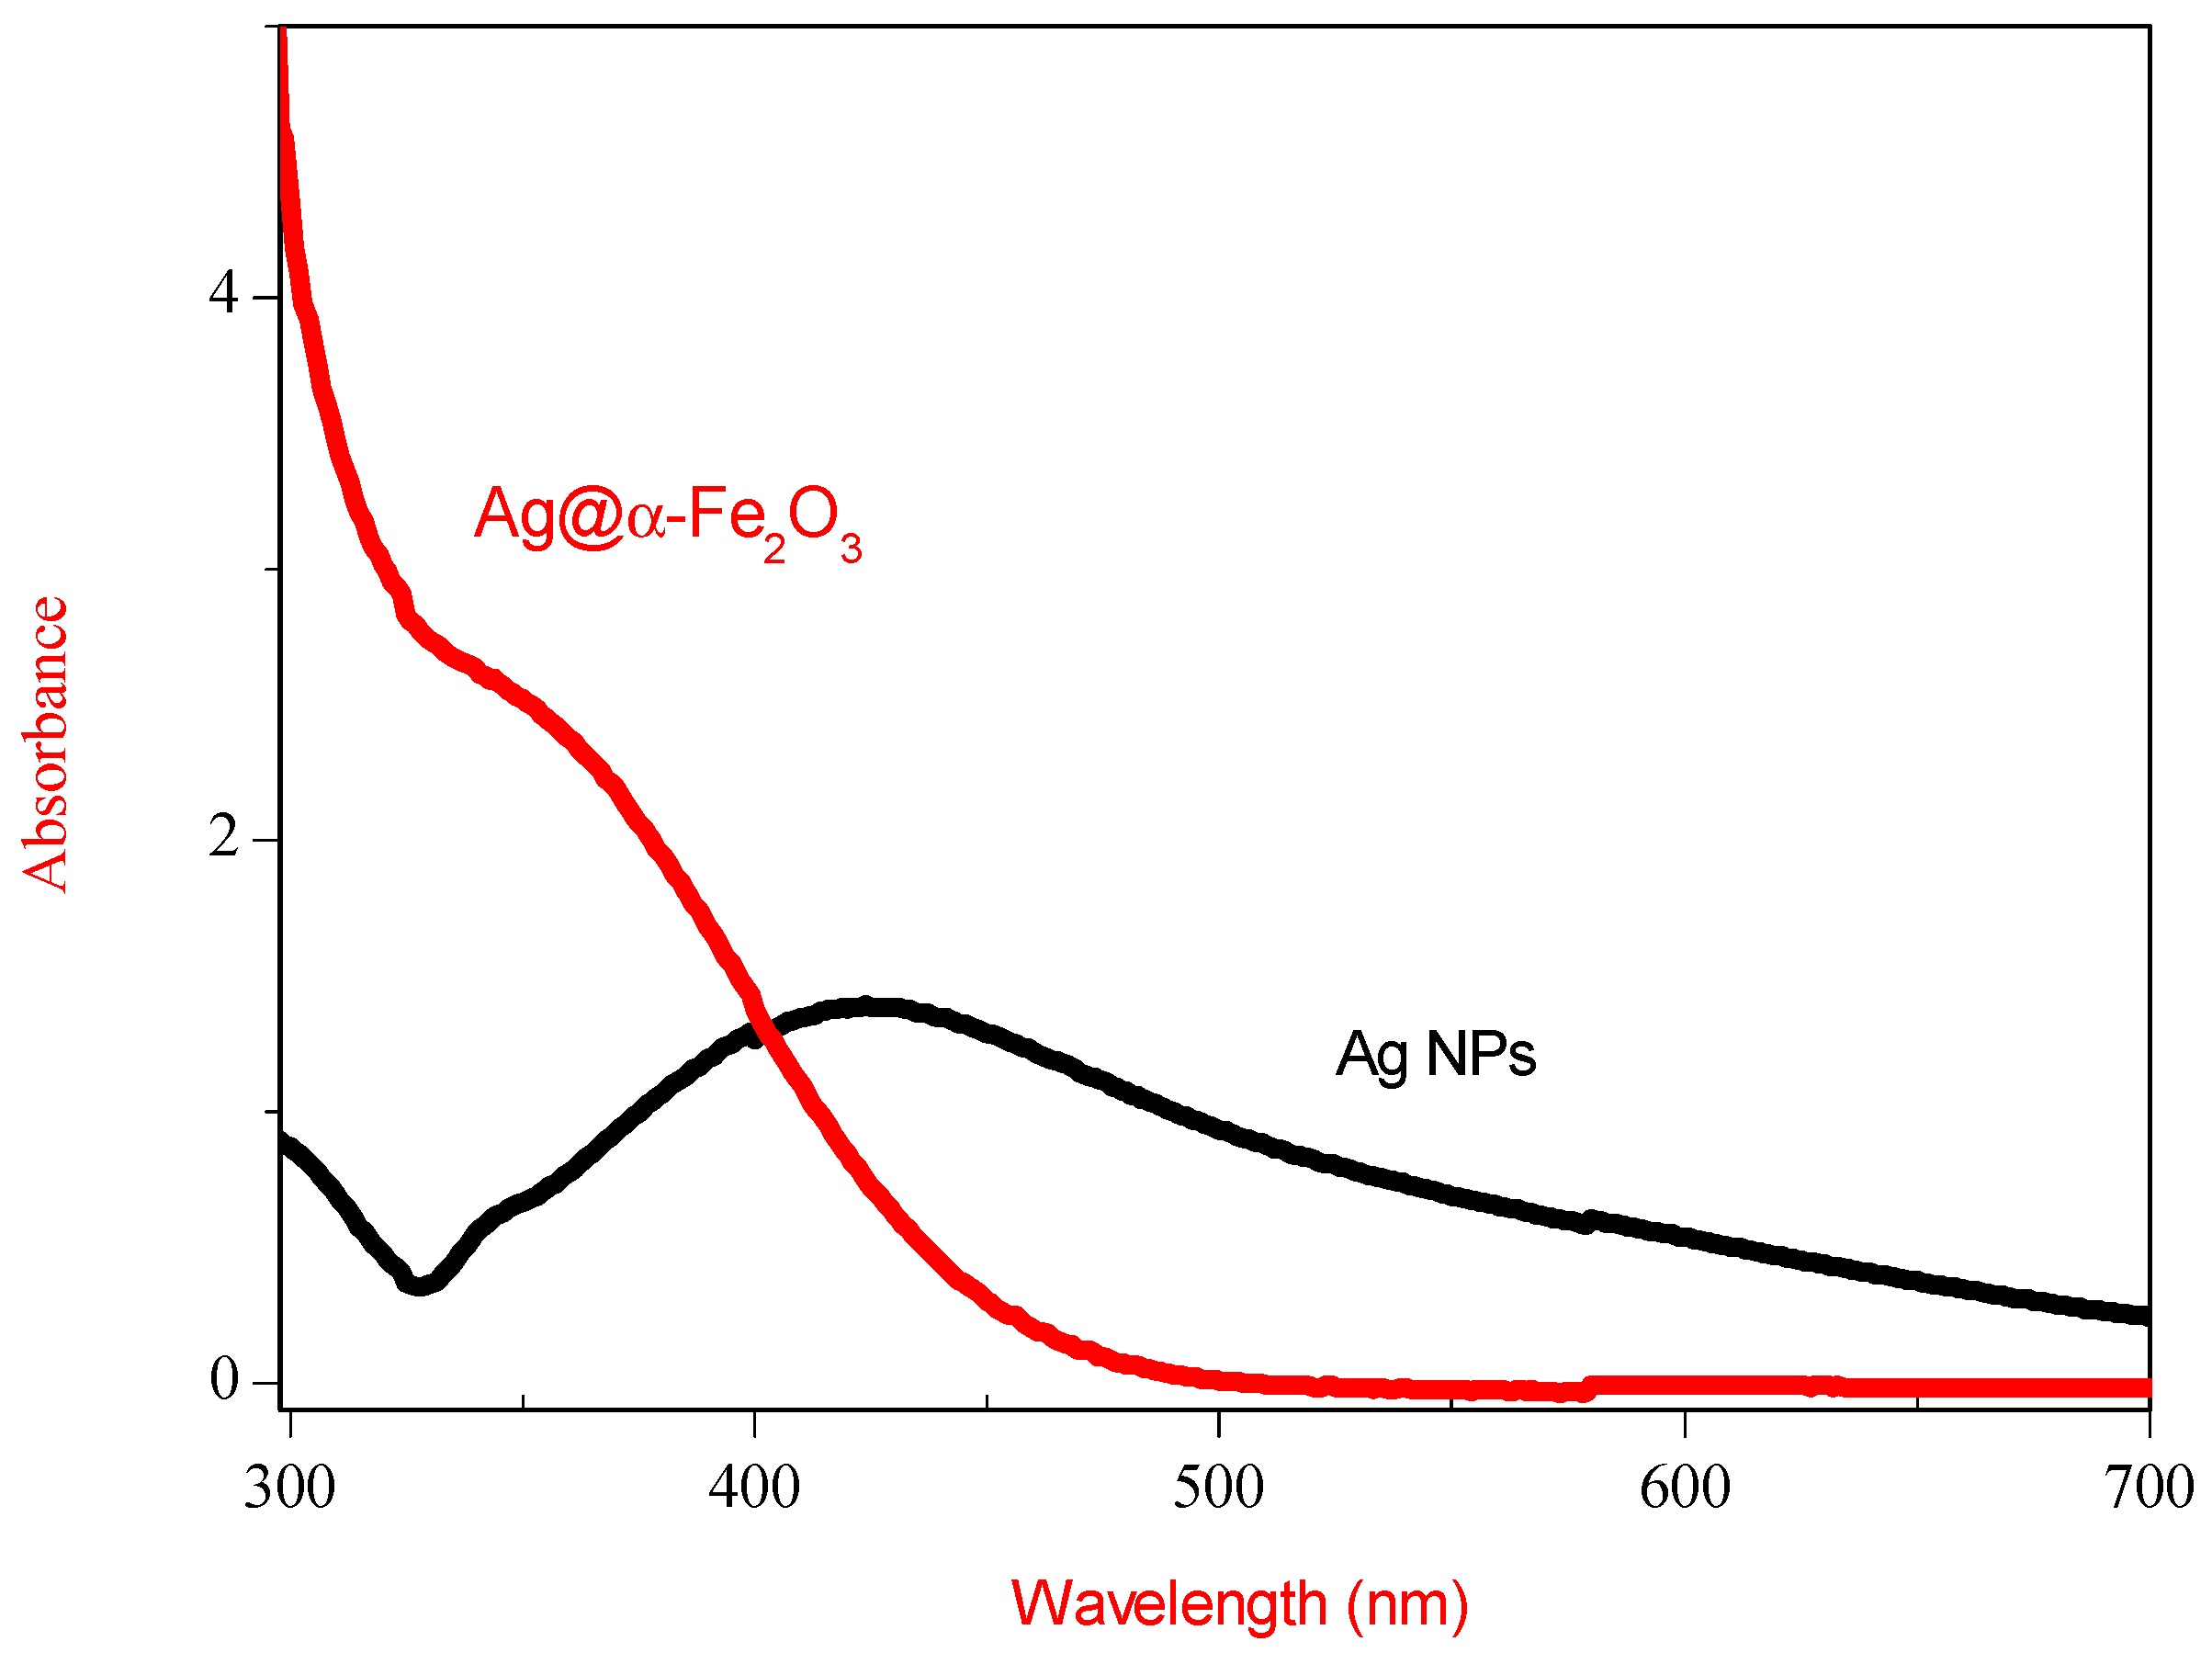
2.2. UV-Vis
Optical absorptions spectra of Ag and Ag@α-Fe
2O
3 nanoparticles measured as a function of the wavelength are shown in
Figure 4. As-synthesized Ag colloid exhibit a absorption peak at 422 nm, a characteristic peak assigned to Ag colloid with diameter <50 nm [
16]. After formation of Ag@α-Fe
2O
3 core–shell, Ag plasmon peak exhibits a blue shift with simultaneous decrease in peak intensity. According to [
17], this shift is due to the scattering effect of Fe
2O
3 shell around silver core.
Figure 4.
UV-Vis spectra of Ag nanoparticles and Ag@α-Fe2O3 core–shell nanocomposites.
Figure 4.
UV-Vis spectra of Ag nanoparticles and Ag@α-Fe2O3 core–shell nanocomposites.
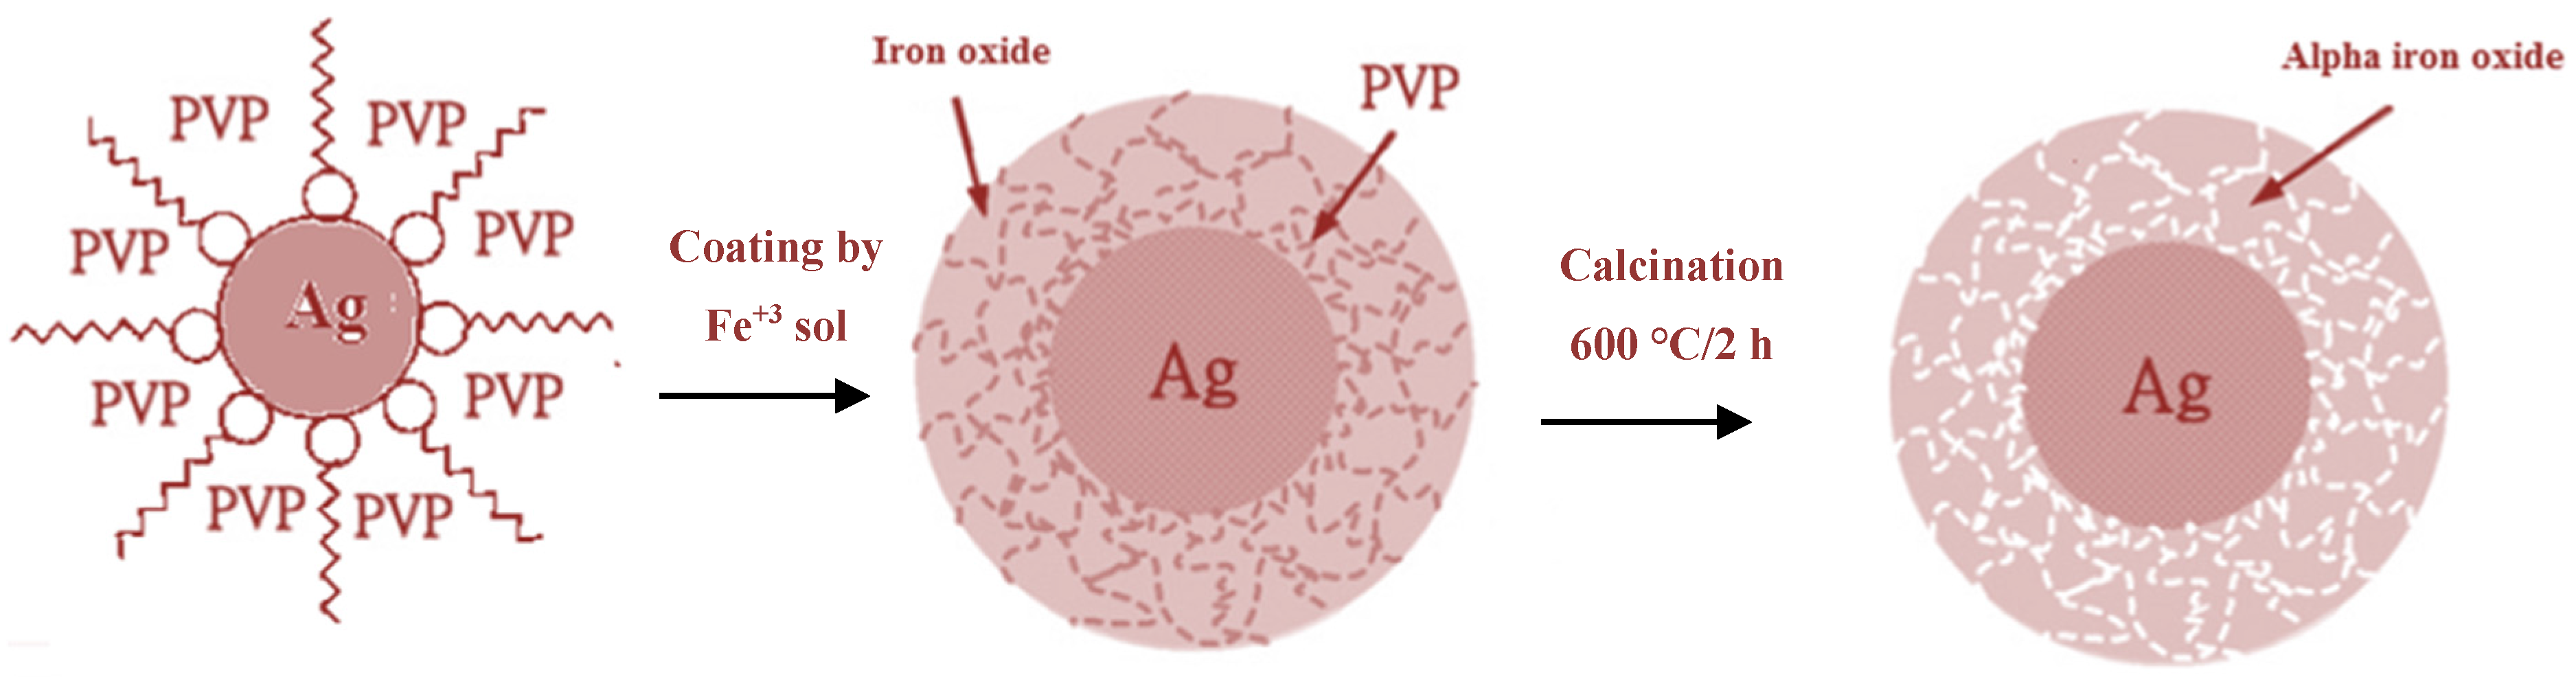
According to characterization results, formation mechanism for Ag@α-Fe
2O
3 core–shell nanoparticles is shown in
Figure 5. Upon adding PVP to the AgNO
3 solution, Ag
+ nuclei become covered by surfactant, and after adding NaBH
4, they are reduced to form Ag
0 nanoparticles. The steric repulsion of PVP inhibits agglomeration of Ag
0 nanoparticles. When iron precursor is added, it is adsorbed on the surface of Ag NPs and subsequently slowly hydrolyzed, forming a shell around the Ag core. After calcination surfactant molecules are removed, and the shell is thermally decomposed to generate the hematite α-Fe
2O
3 shell, producing a uniform core–shell of α-Fe
2O
3 nanoparticles.
Figure 5.
Schematic mechanism for the formation of core@shell structured Ag@α-Fe2O3.
Figure 5.
Schematic mechanism for the formation of core@shell structured Ag@α-Fe2O3.
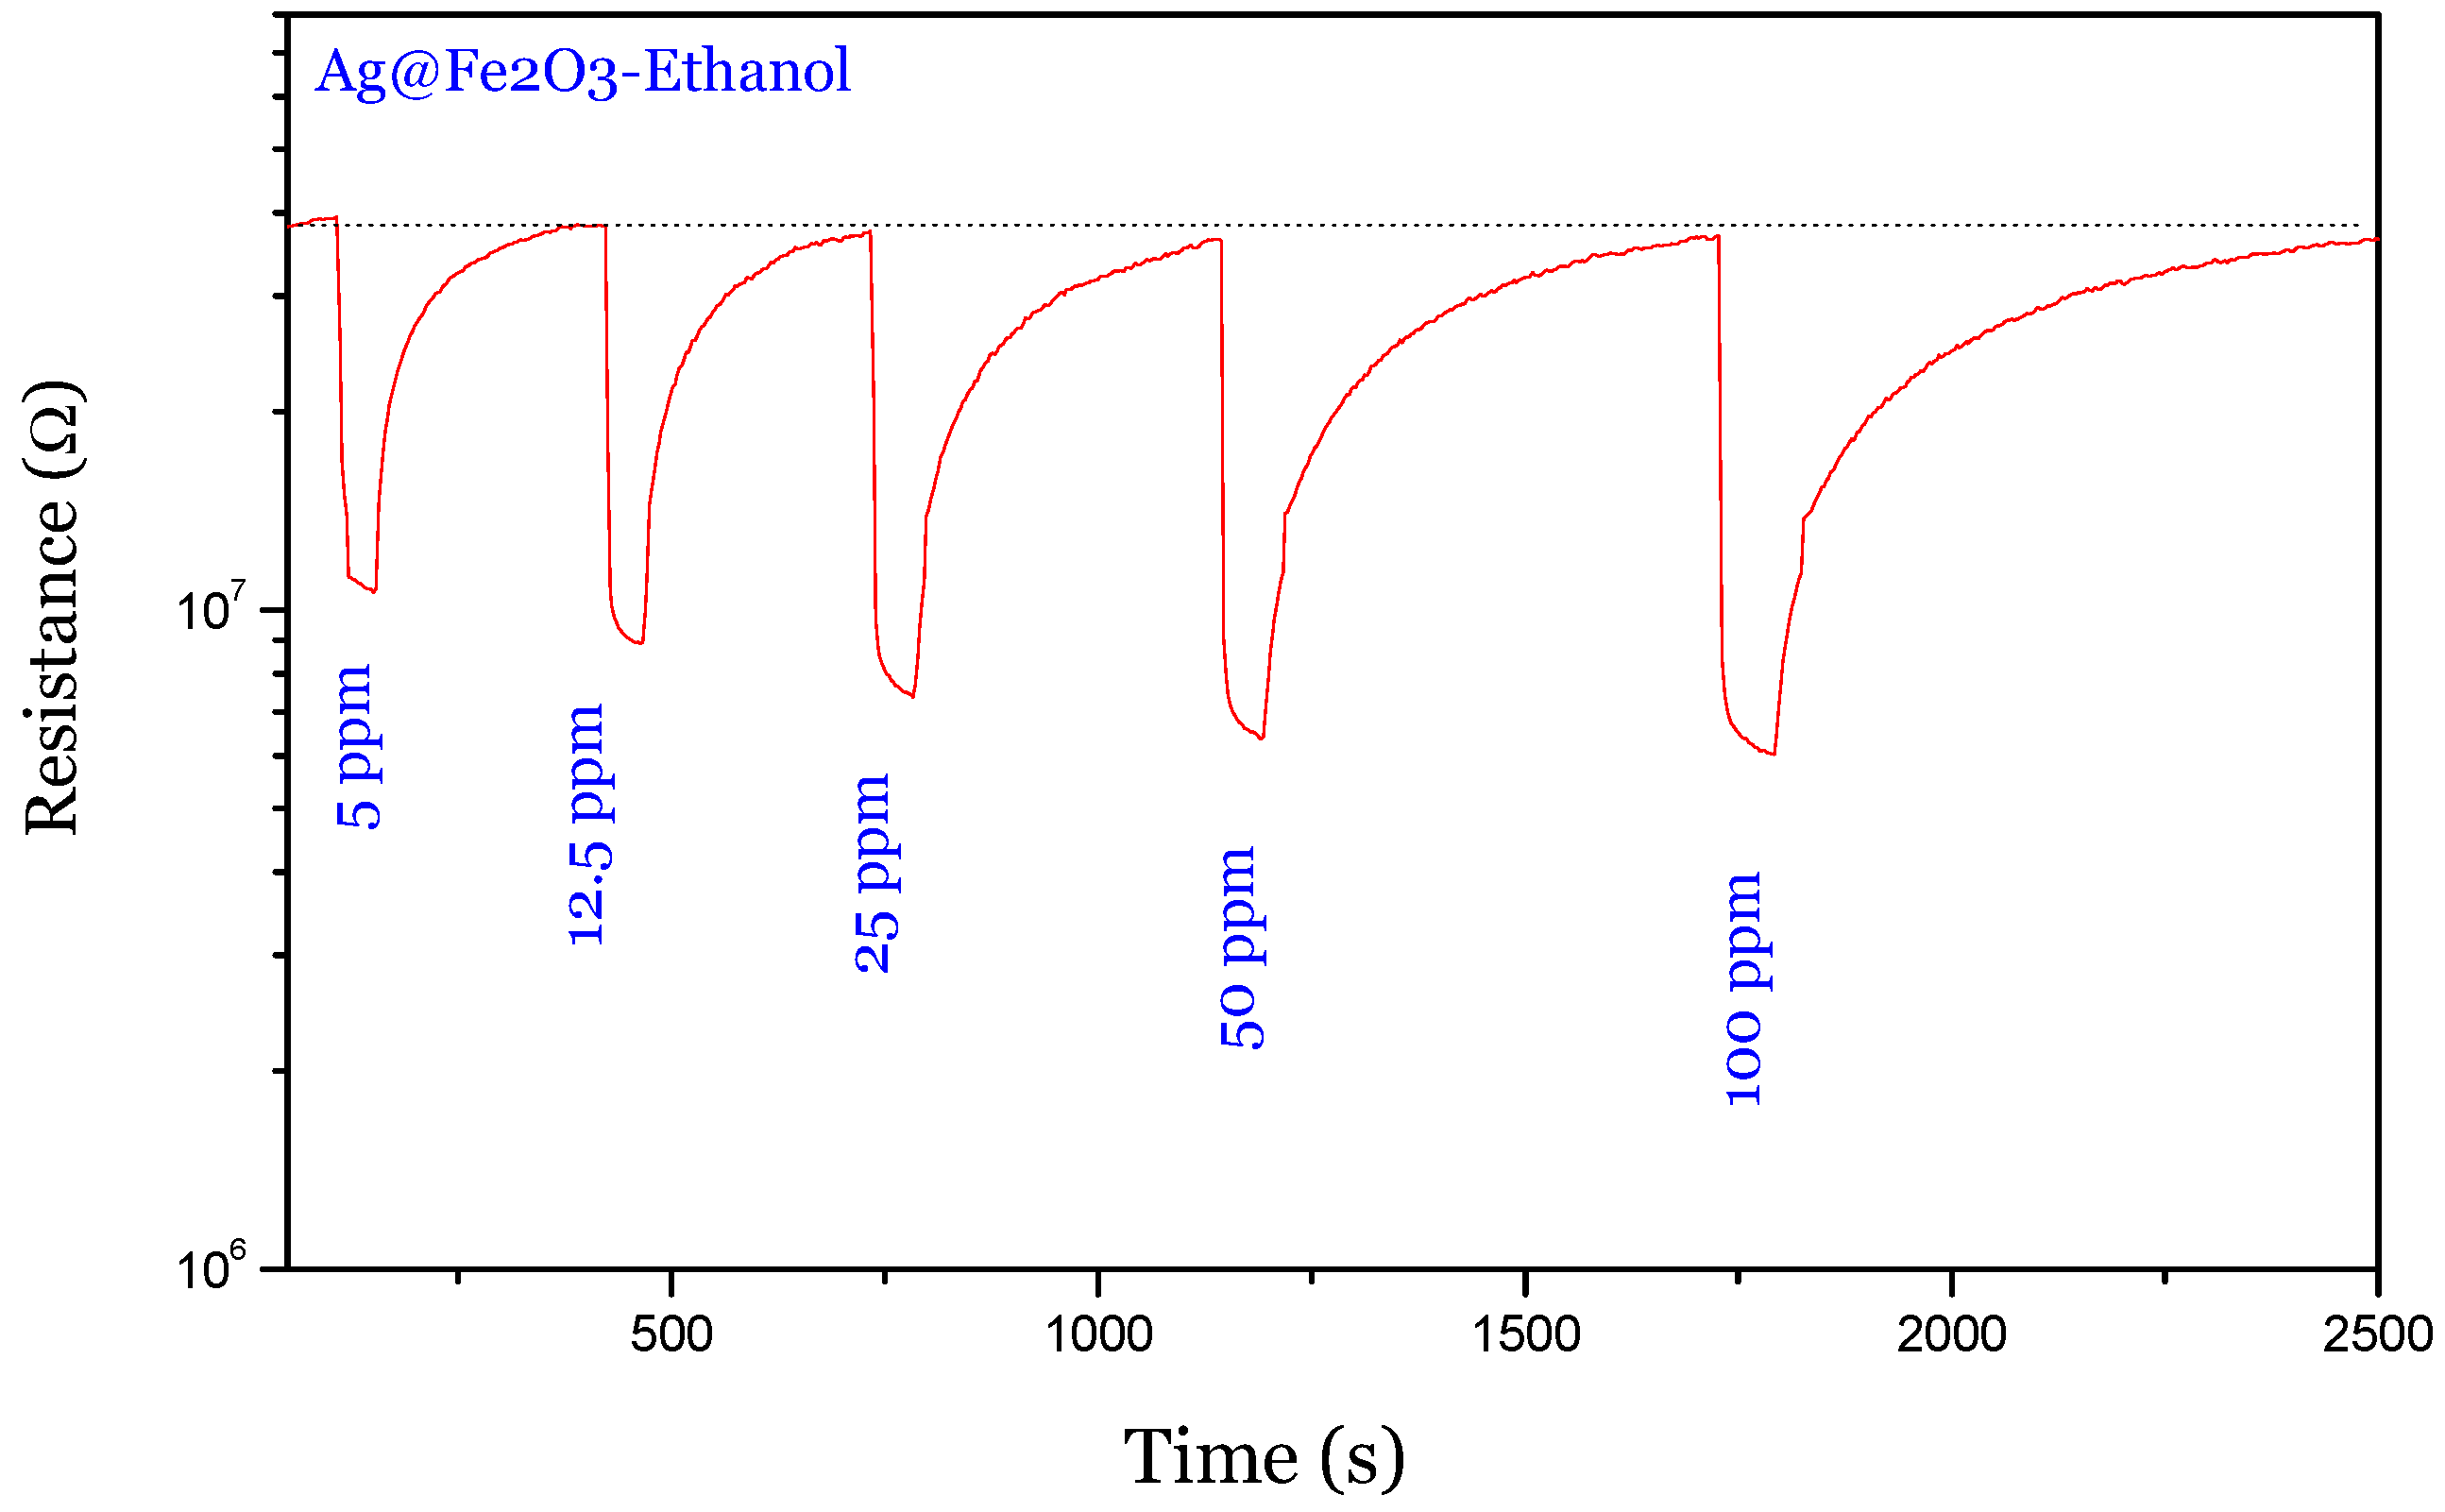
2.3. Sensing Tests
The synthesized composite with a core–shell structure has been used to fabricate gas sensor devices for detection of low concentrations of ethanol in air. First, a lot of preliminary work has been done to find the optimal operation temperature. The temperature of 250 °C has been chosen on the basis of the better performance obtained for ethanol detection in terms of sensitivity, selectivity and fast response/recovery time.
Figure 6 shows the dynamic gas sensing characteristics of Ag@α-Fe
2O
3 towards different low concentrations of ethanol in air. The sensor showed the typical
n-type gas sensing behavior, which can be explained as following. At the beginning of the sensing experiment, the sensor exposed to a dry air atmosphere exhibited a high resistance due to the oxidation reaction between surface electrons and oxygen molecules. After introduction of ethanol vapor into the testing chamber, the baseline resistance was immediately reduced. When the ethanol vapor was cut off from the chamber, the resistance was completely recovered to the original value in base gas. This result indicates that the Ag@α-Fe
2O
3 sensor is fully reversible to ethanol.
Figure 6.
Sensing response of Ag@α-Fe2O3 towards different concentrations of ethanol vapor at 250 °C.
Figure 6.
Sensing response of Ag@α-Fe2O3 towards different concentrations of ethanol vapor at 250 °C.
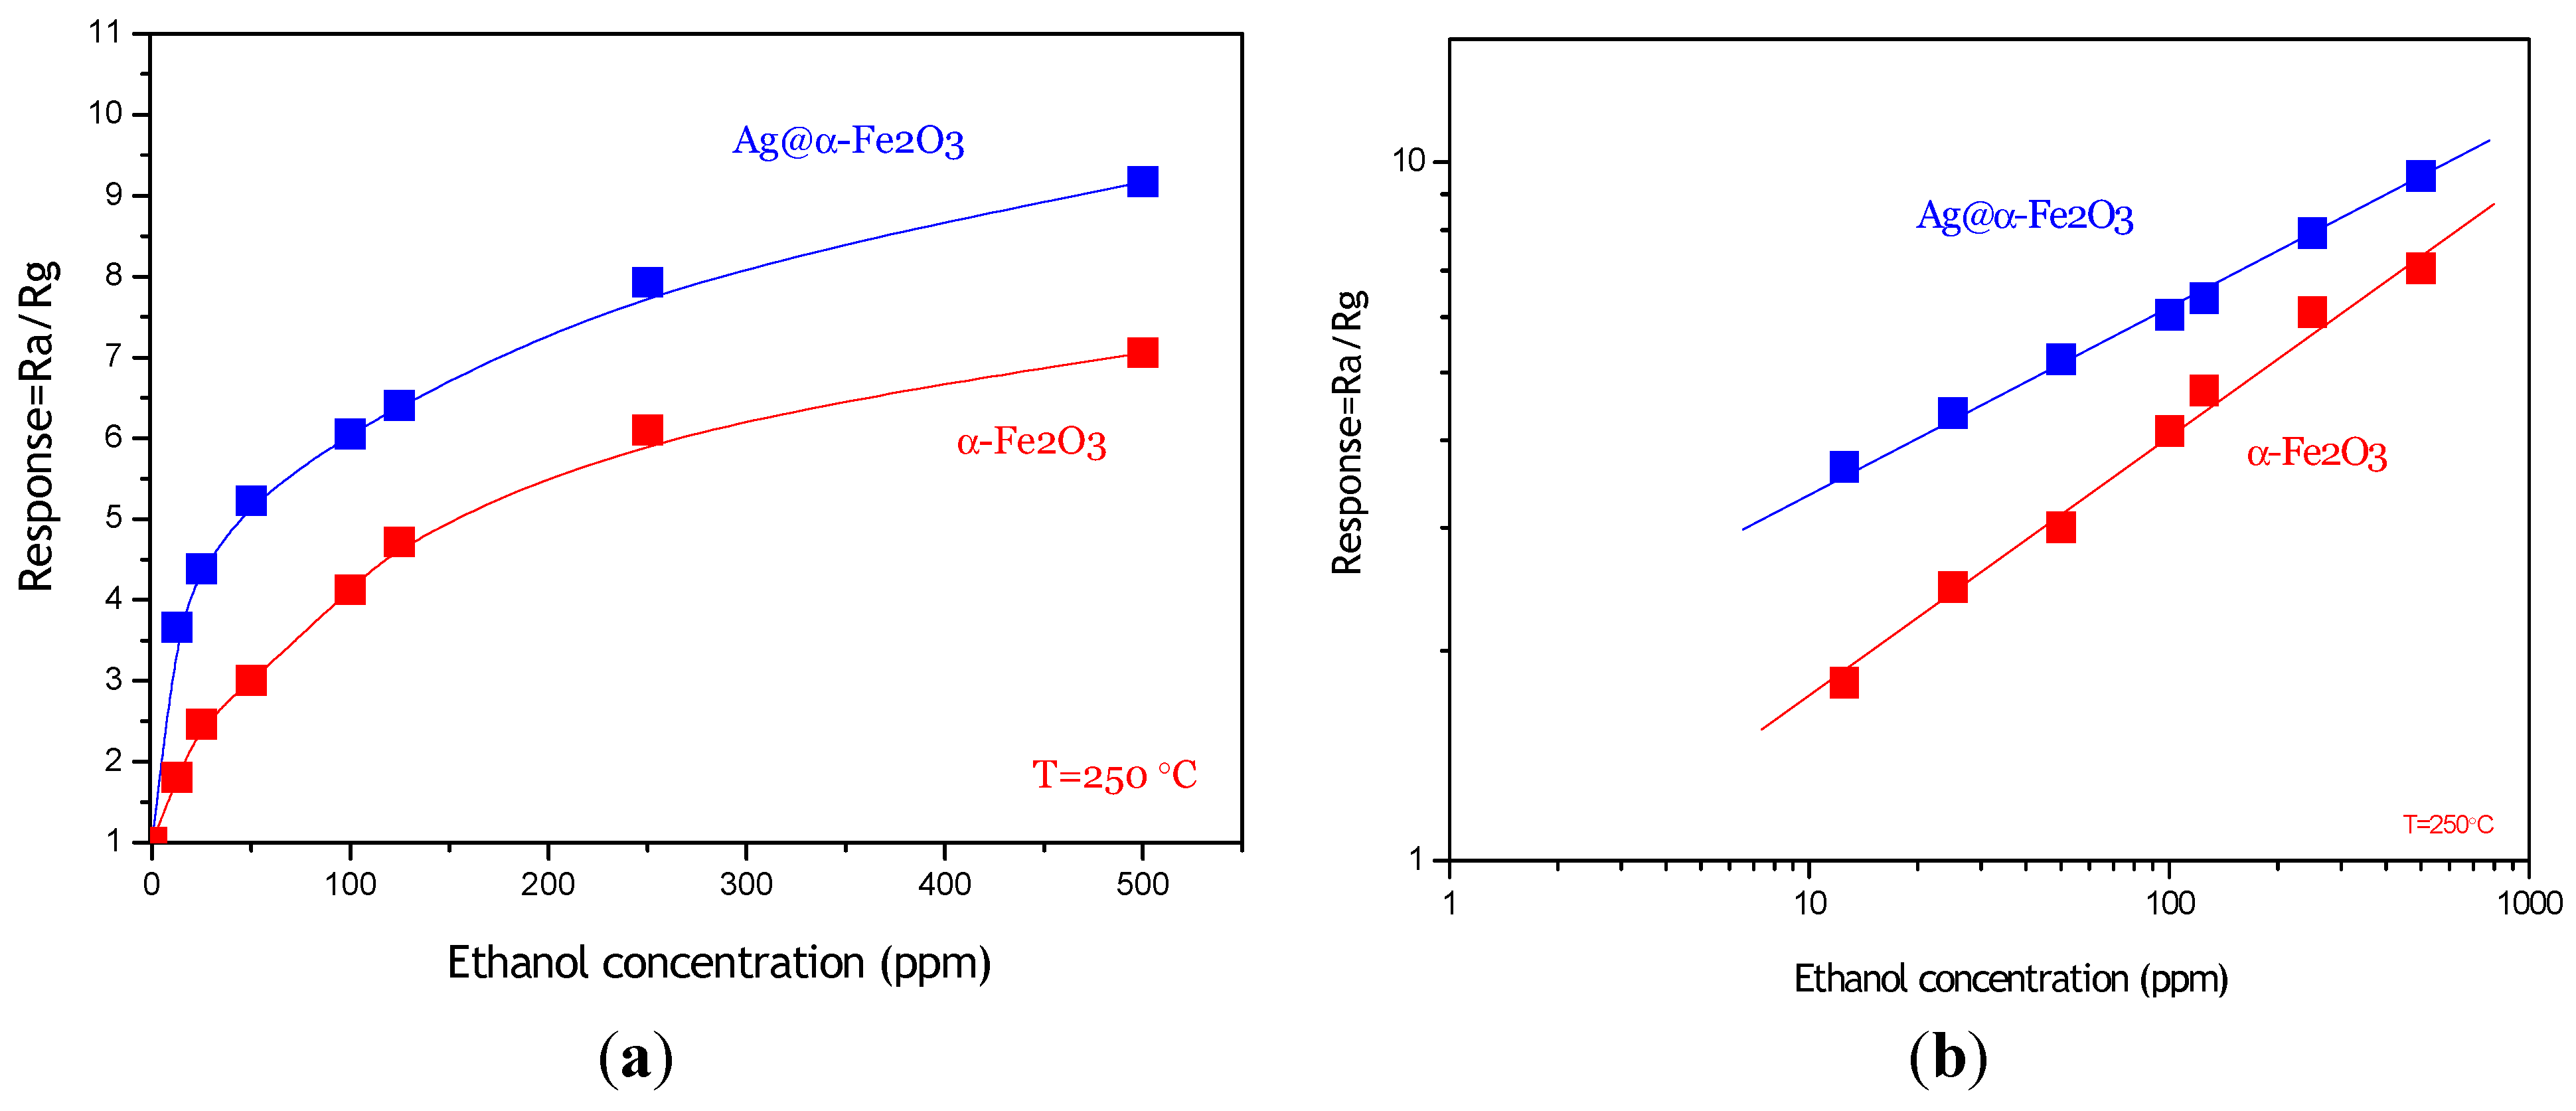
The calibration curve of the Ag@α-Fe
2O
3 sensor to different concentrations of ethanol vapor is shown in
Figure 7a. For comparison, in the same graph, the calibration curve related to pristine α-Fe
2O
3 sensor is also plotted. It can be clearly evidenced that the composite-based sensor is more sensitive compared to pristine α-Fe
2O
3 sensor in the range of concentrations investigated, which is in agreement with results of Zhu
et al. [
4]. As shown in
Figure 7b, the response of both sensors has a good linear relationship with the ethanol concentration (12.5–500 ppm range) in logarithmic forms, which is in good agreement with the theory of power laws proposed for semiconductor sensors [
18]. The approximate linearity of sensitivity in the broad concentration range is quite suitable for the measurement of ethanol, which could offer wide applications for ethanol detection. Furthermore, it appears that the composite sensor is able to detect sub-ppm concentrations of ethanol with high signal/noise ratio.
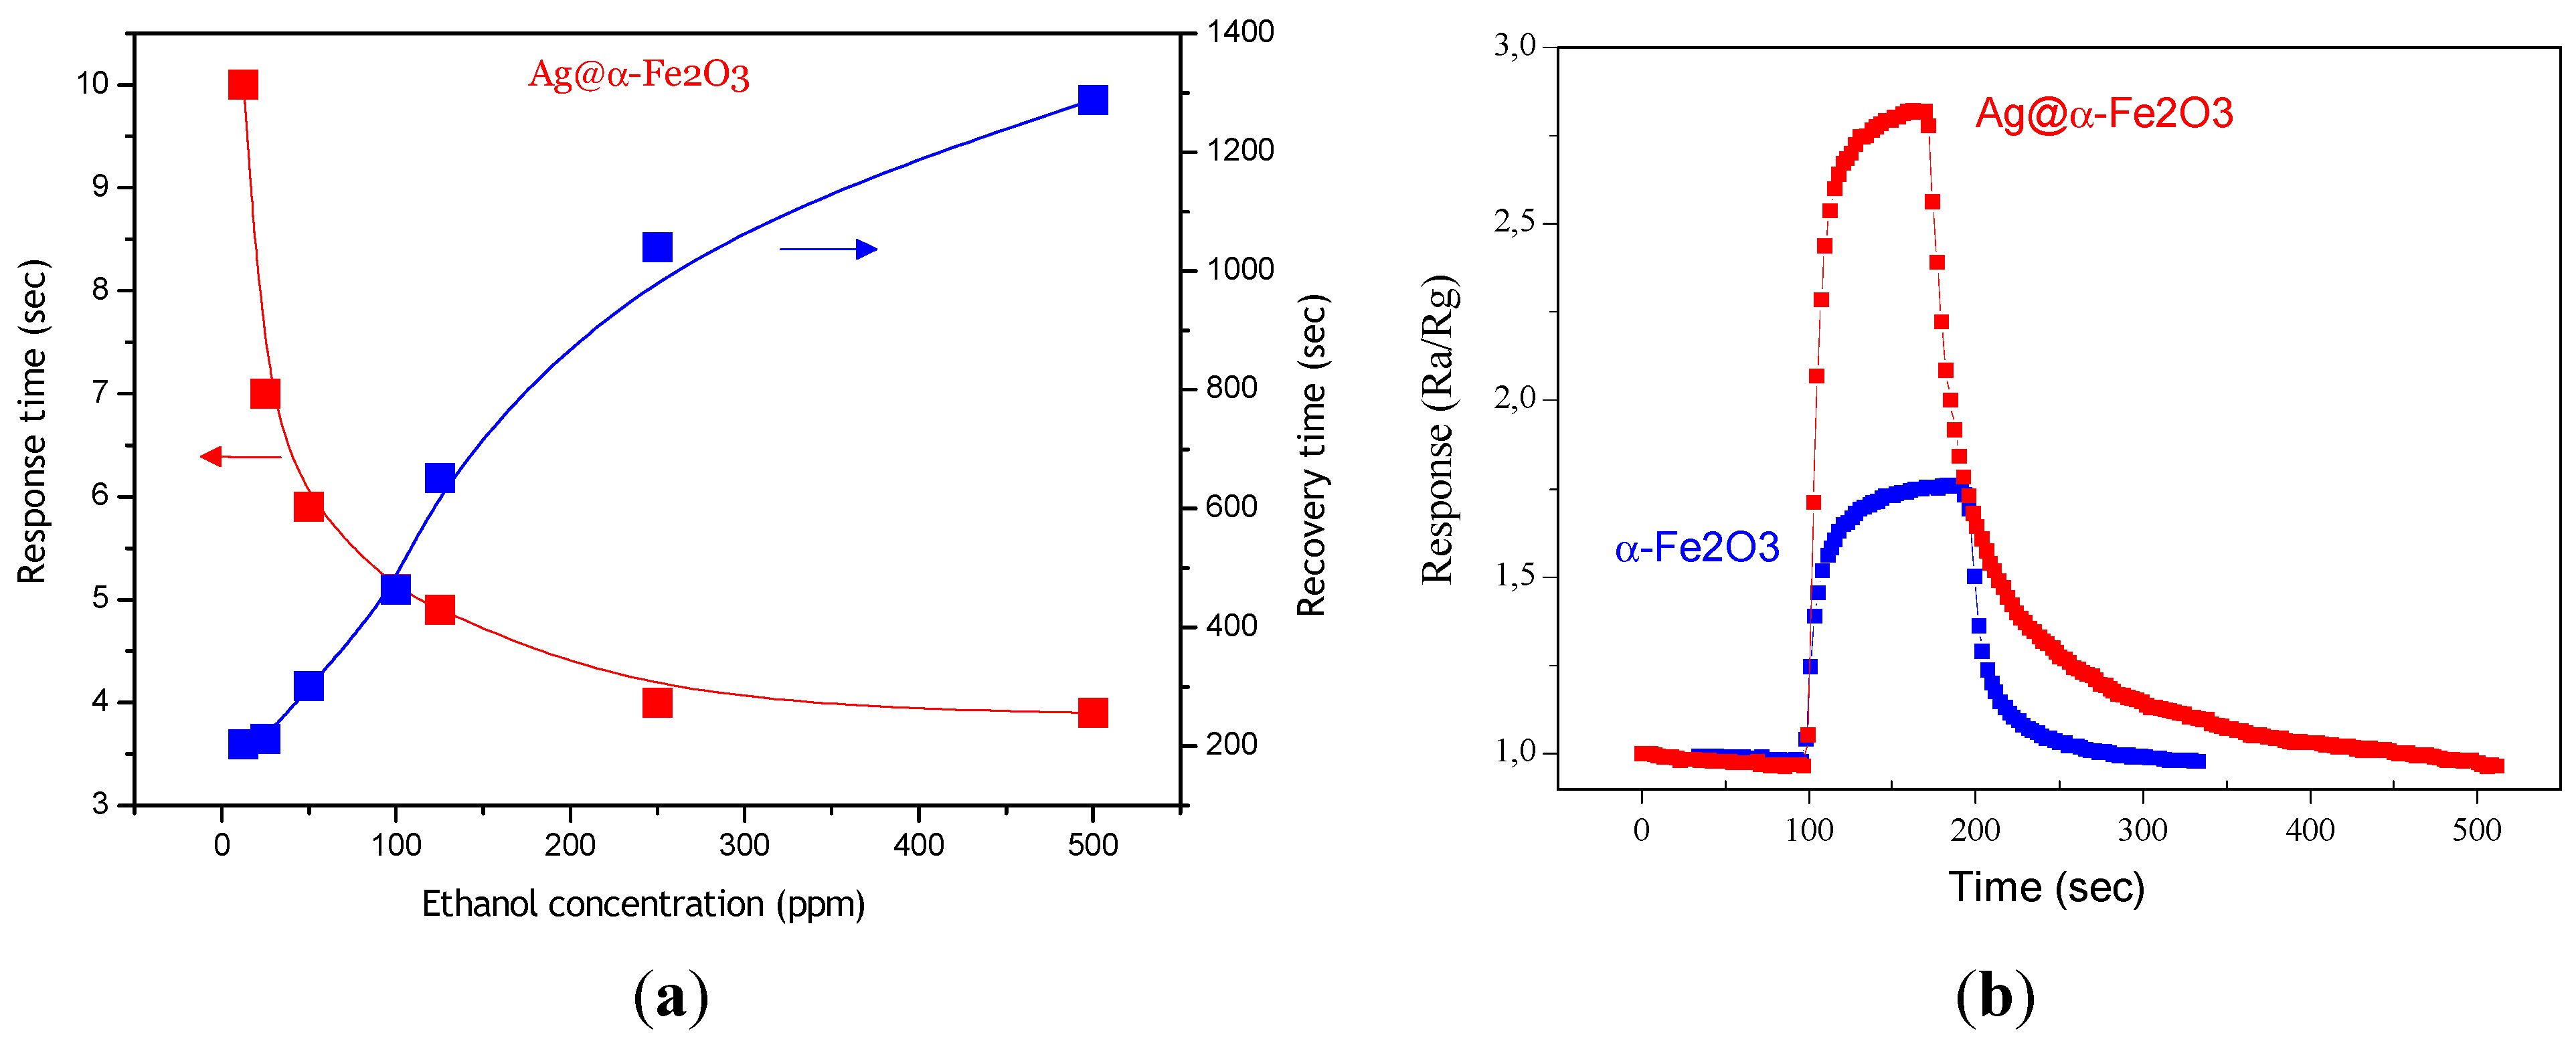
Figure 8a shows response and recovery time for Ag@α-Fe
2O
3 sensor as a function of ethanol concentration. As it can be seen, with increase of ethanol concentration, response time decreases and recovery time increases. Indeed as ethanol concentration increases more ethanol molecules interact with adsorbed oxygen ions, providing a fast response (shorter time), and obviously they need more time to desorb from surface. The response times are shorter for Ag@α-Fe
2O
3 core–shell nanocomposites in comparison with α-Fe
2O
3 (
Figure 8b). According to the response/recovery time definition, for 100 ppm ethanol response time and recovery time are 5.5 s and 16 s, 453 s and 165.39 s for Ag@α-Fe
2O
3 and α-Fe
2O
3, respectively. Decrease in response time is probably due to decrease of activation energy of adsorption of ethanol in the presence of silver. However, recovery times are longer for Ag@α-Fe
2O
3 nanoparticles. The slow recovery can be explained by the sluggish surface reactions regarding the adsorption, dissociation, and ionization of oxygen [
19].
Figure 7.
(a) Sensing response of Ag@α-Fe2O3 and α-Fe2O3 towards different concentrations of ethanol vapor at 250 °C; (b) Linear relationship of log S-log C for Ag@α-Fe2O3 and α-Fe2O3 sensors.
Figure 7.
(a) Sensing response of Ag@α-Fe2O3 and α-Fe2O3 towards different concentrations of ethanol vapor at 250 °C; (b) Linear relationship of log S-log C for Ag@α-Fe2O3 and α-Fe2O3 sensors.
Figure 8.
(a) Response and recovery times for Ag@α-Fe2O3 sensor; (b) Response of Ag@α-Fe2O3 and α-Fe2O3 sensors towards 12.5 ppm ethanol at 250 °C.
Figure 8.
(a) Response and recovery times for Ag@α-Fe2O3 sensor; (b) Response of Ag@α-Fe2O3 and α-Fe2O3 sensors towards 12.5 ppm ethanol at 250 °C.
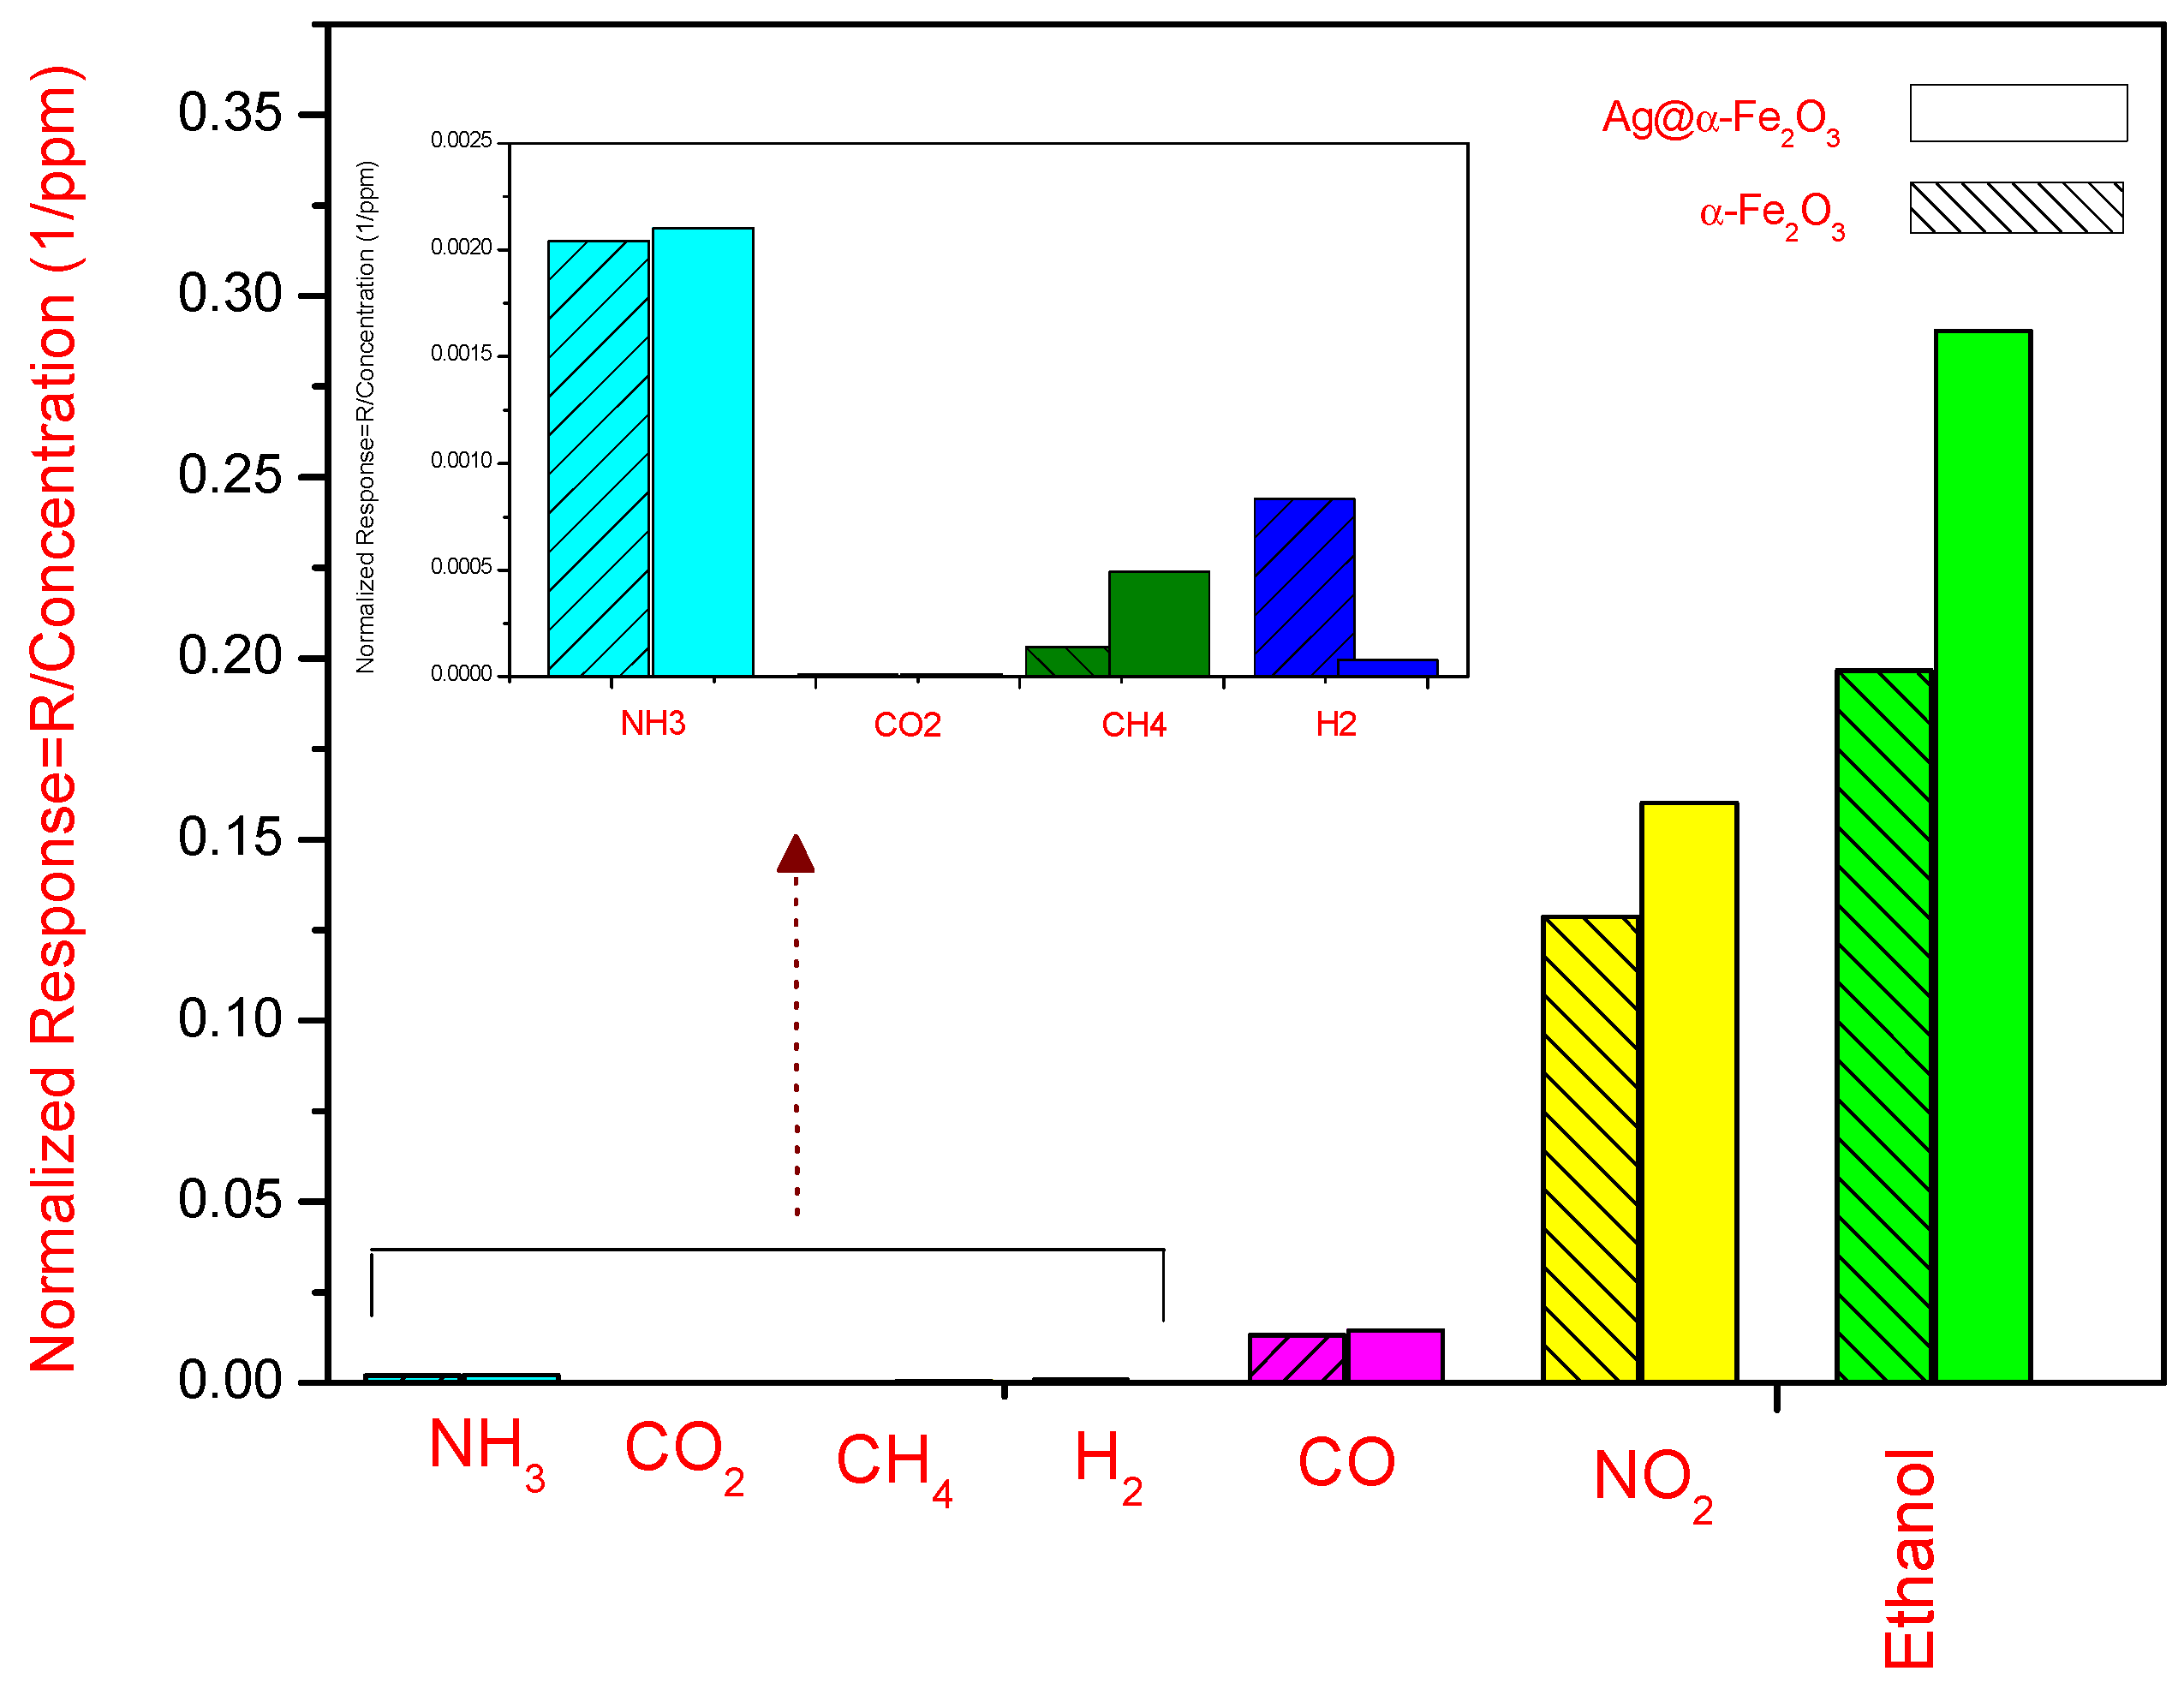
The normalized response (R/concentration) of both sensors towards different gases such as NO
2, CO, CO
2,
etc. is shown in
Figure 9.
It indicates that the sensing response towards ethanol for both sensors is higher than for other reducing gases investigated (especially NH3, CO2, CH4 and H2). The sensors show instead a certain sensitivity to NO2. However, the magnitude of the normalized response, for ethanol and NO2, is 0.2904 and 0.1968, 0.16 and 0.12875 for Ag@α-Fe2O3 and α-Fe2O3 sensors, respectively. These values also demonstrated that Ag@α-Fe2O3 sensor is more selective than α-Fe2O3 sensor.
Figure 9.
Normalized response of Ag@α-Fe2O3 and α-Fe2O3 sensors at 250 °C. In the inset, the response to some reducing gases is magnified.
Figure 9.
Normalized response of Ag@α-Fe2O3 and α-Fe2O3 sensors at 250 °C. In the inset, the response to some reducing gases is magnified.
2.4. Sensing Mechanism
For metal oxide gas sensors, the sensing is based on the change in resistance, which is caused by the adsorption and desorption of ethanol molecules on the surface of sensing films in ethanol atmospheres. When α-Fe
2O
3 or Ag@Fe
2O
3 sensors are exposed to air, oxygen molecules would be adsorbed on the surface of oxide. The adsorbed oxygen molecules would trap electrons from conduction band of α-Fe
2O
3 because of the strong electronegativity of oxygen atom, and produce ionized oxygen species such as
, O
2−. The reaction kinetics may be explained by the following reactions [
20]:
The electrons transfer from the conduction band to the chemisorbed oxygen results in the decrease in the electron concentration and an increase in the resistance of α-Fe
2O
3 and Ag@α-Fe
2O
3. When the α-Fe
2O
3 or Ag@α-Fe
2O
3 sensor is exposed to ethanol, the ethanol molecules could be chemisorbed on the surfaces of α-Fe
2O
3 or Ag@α-Fe
2O
3 nanoparticles, and these chemisorbed ethanol molecules would react with the adsorbed oxygen species to form H
2O and CO
2. The trapped electrons are then released back to the α-Fe
2O
3 or Ag@α-Fe
2O
3 nanoparticles, leading to a decreased resistance of the sensor [
4]:
Accordingly, the magnitude of sensor response depends on two factors: the number of electrons which are captured by adsorbed oxygen molecules from the conduction band and the number of electrons that are released by the ethanol molecules reacting with adsorbed oxygen molecules.
In case of Ag@α-Fe
2O
3, according to [
4,
21], Ag core has three crucial rules: (i) an electron donates to gaseous oxygen, according to Equations (2)–(4), and consequently accelerate these reactions on the surface; (ii) an electron reservoir releases electrons from surface, according to Equations (5)–(7); and (iii) there is decreased ethanol adsorption and desorption energy on the iron oxide shell. Therefore, in the case of Ag@α-Fe
2O
3, sensor response is higher than pure α-Fe
2O
3 and the response times of Ag@α-Fe
2O
3 are shorter than pristine α-Fe
2O
3. A possible sensing mechanism for Ag@α-Fe
2O
3 sensor is presented in
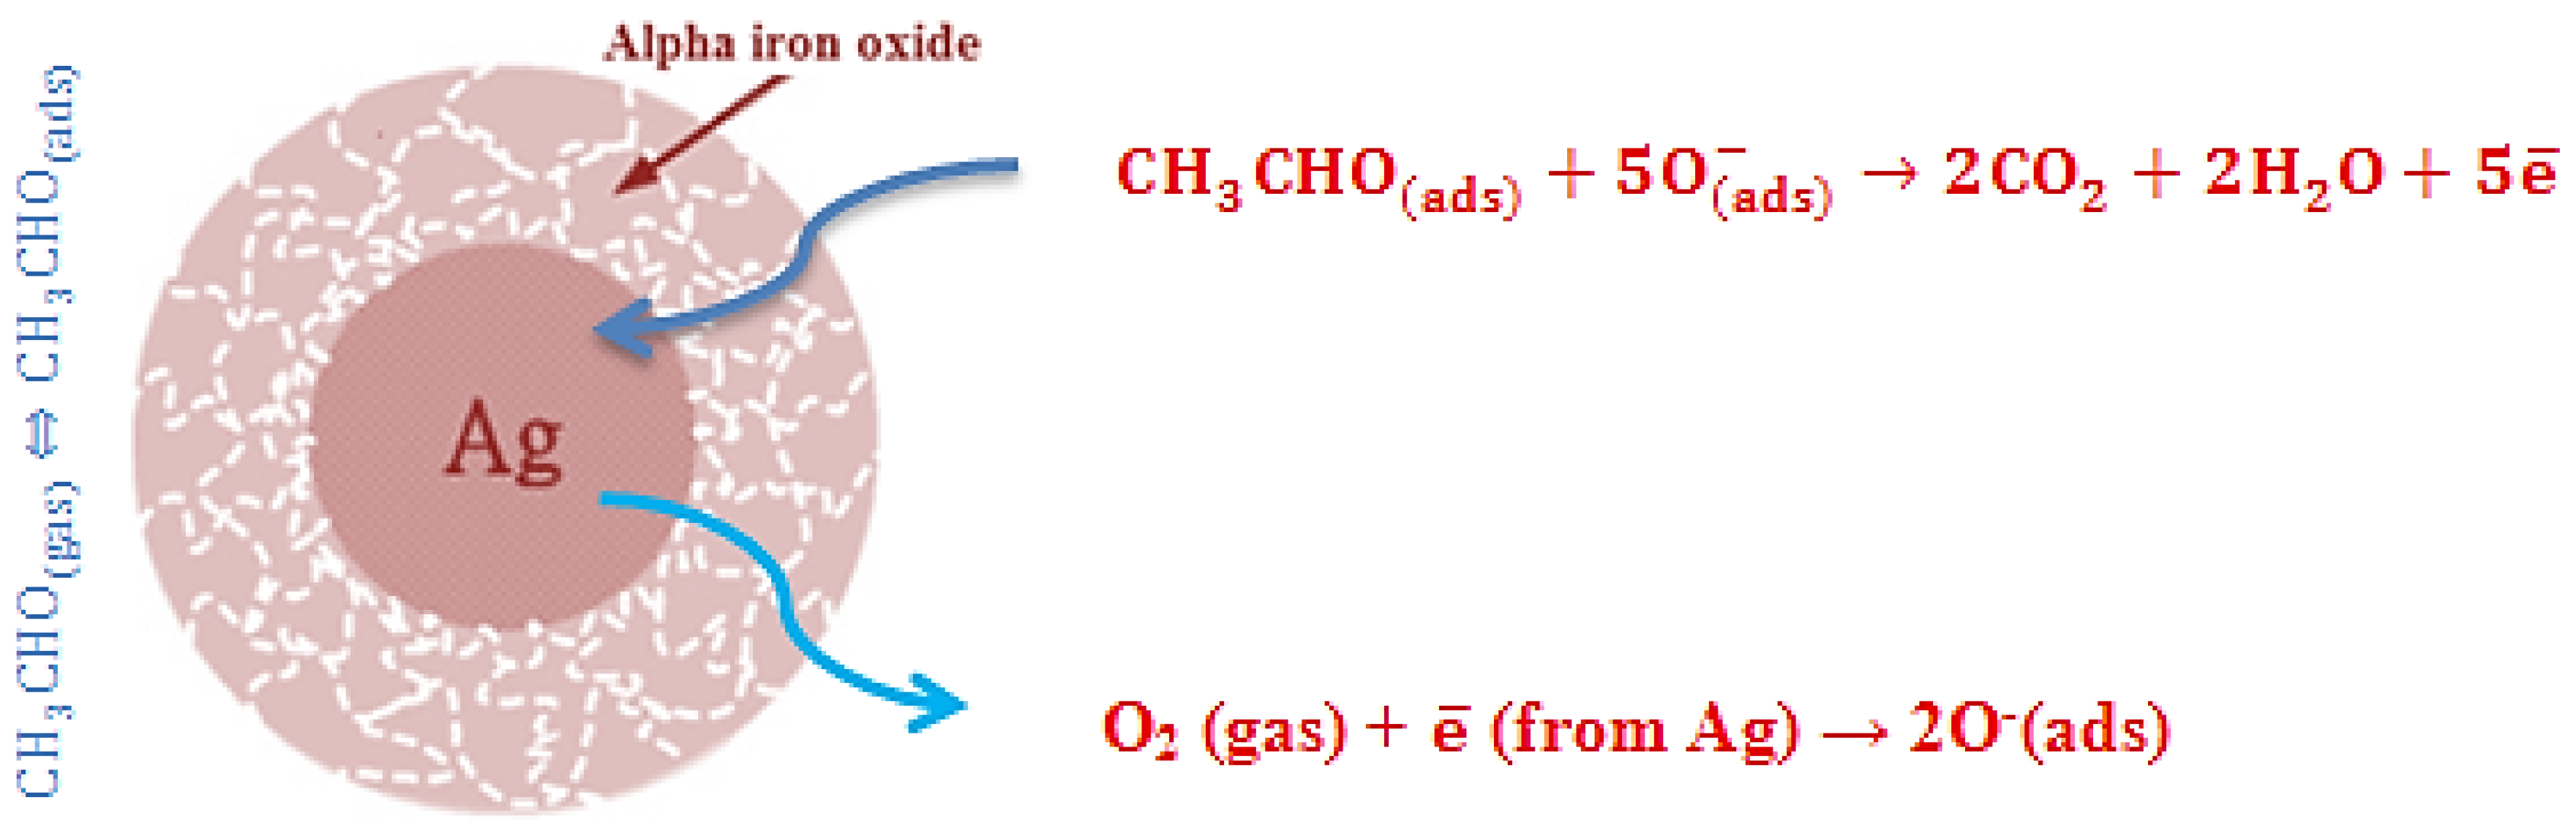
Figure 10.
In summary, the peculiar hierarchical nano-architecture and the chemical and electronic sensitization effect of Ag nanoparticles in Ag@α-Fe2O3 sensors are the key factors in enhancing the ethanol response of the nanocomposite-based sensor in comparison to pristine α-Fe2O3 sensor. The same apply to explain the enhanced selectivity of the Ag@α-Fe2O3 sensor compared to that of α-Fe2O3 one. Indeed, Ag NPs likely promote oxygen adsorption/dissociation, thus favoring the reactions involved in the sensing mechanism and resulting in the surface reactivity enhancement for ethanol with respect to other interfering gases.
Figure 10.
Possible ethanol sensing mechanism by Ag@α-Fe
2O
3 core–shell nanocomposites (according to [
4,
21]).
Figure 10.
Possible ethanol sensing mechanism by Ag@α-Fe
2O
3 core–shell nanocomposites (according to [
4,
21]).


 ,
, 


