
Facile Synthesis of ZnO-CeO2 Heterojunction by Mixture Design and Its Application in Triclosan Degradation: Effect of Urea

 , ,
, ,
Abstract
:1. Introduction
2. Materials and Methods
2.1. Materials
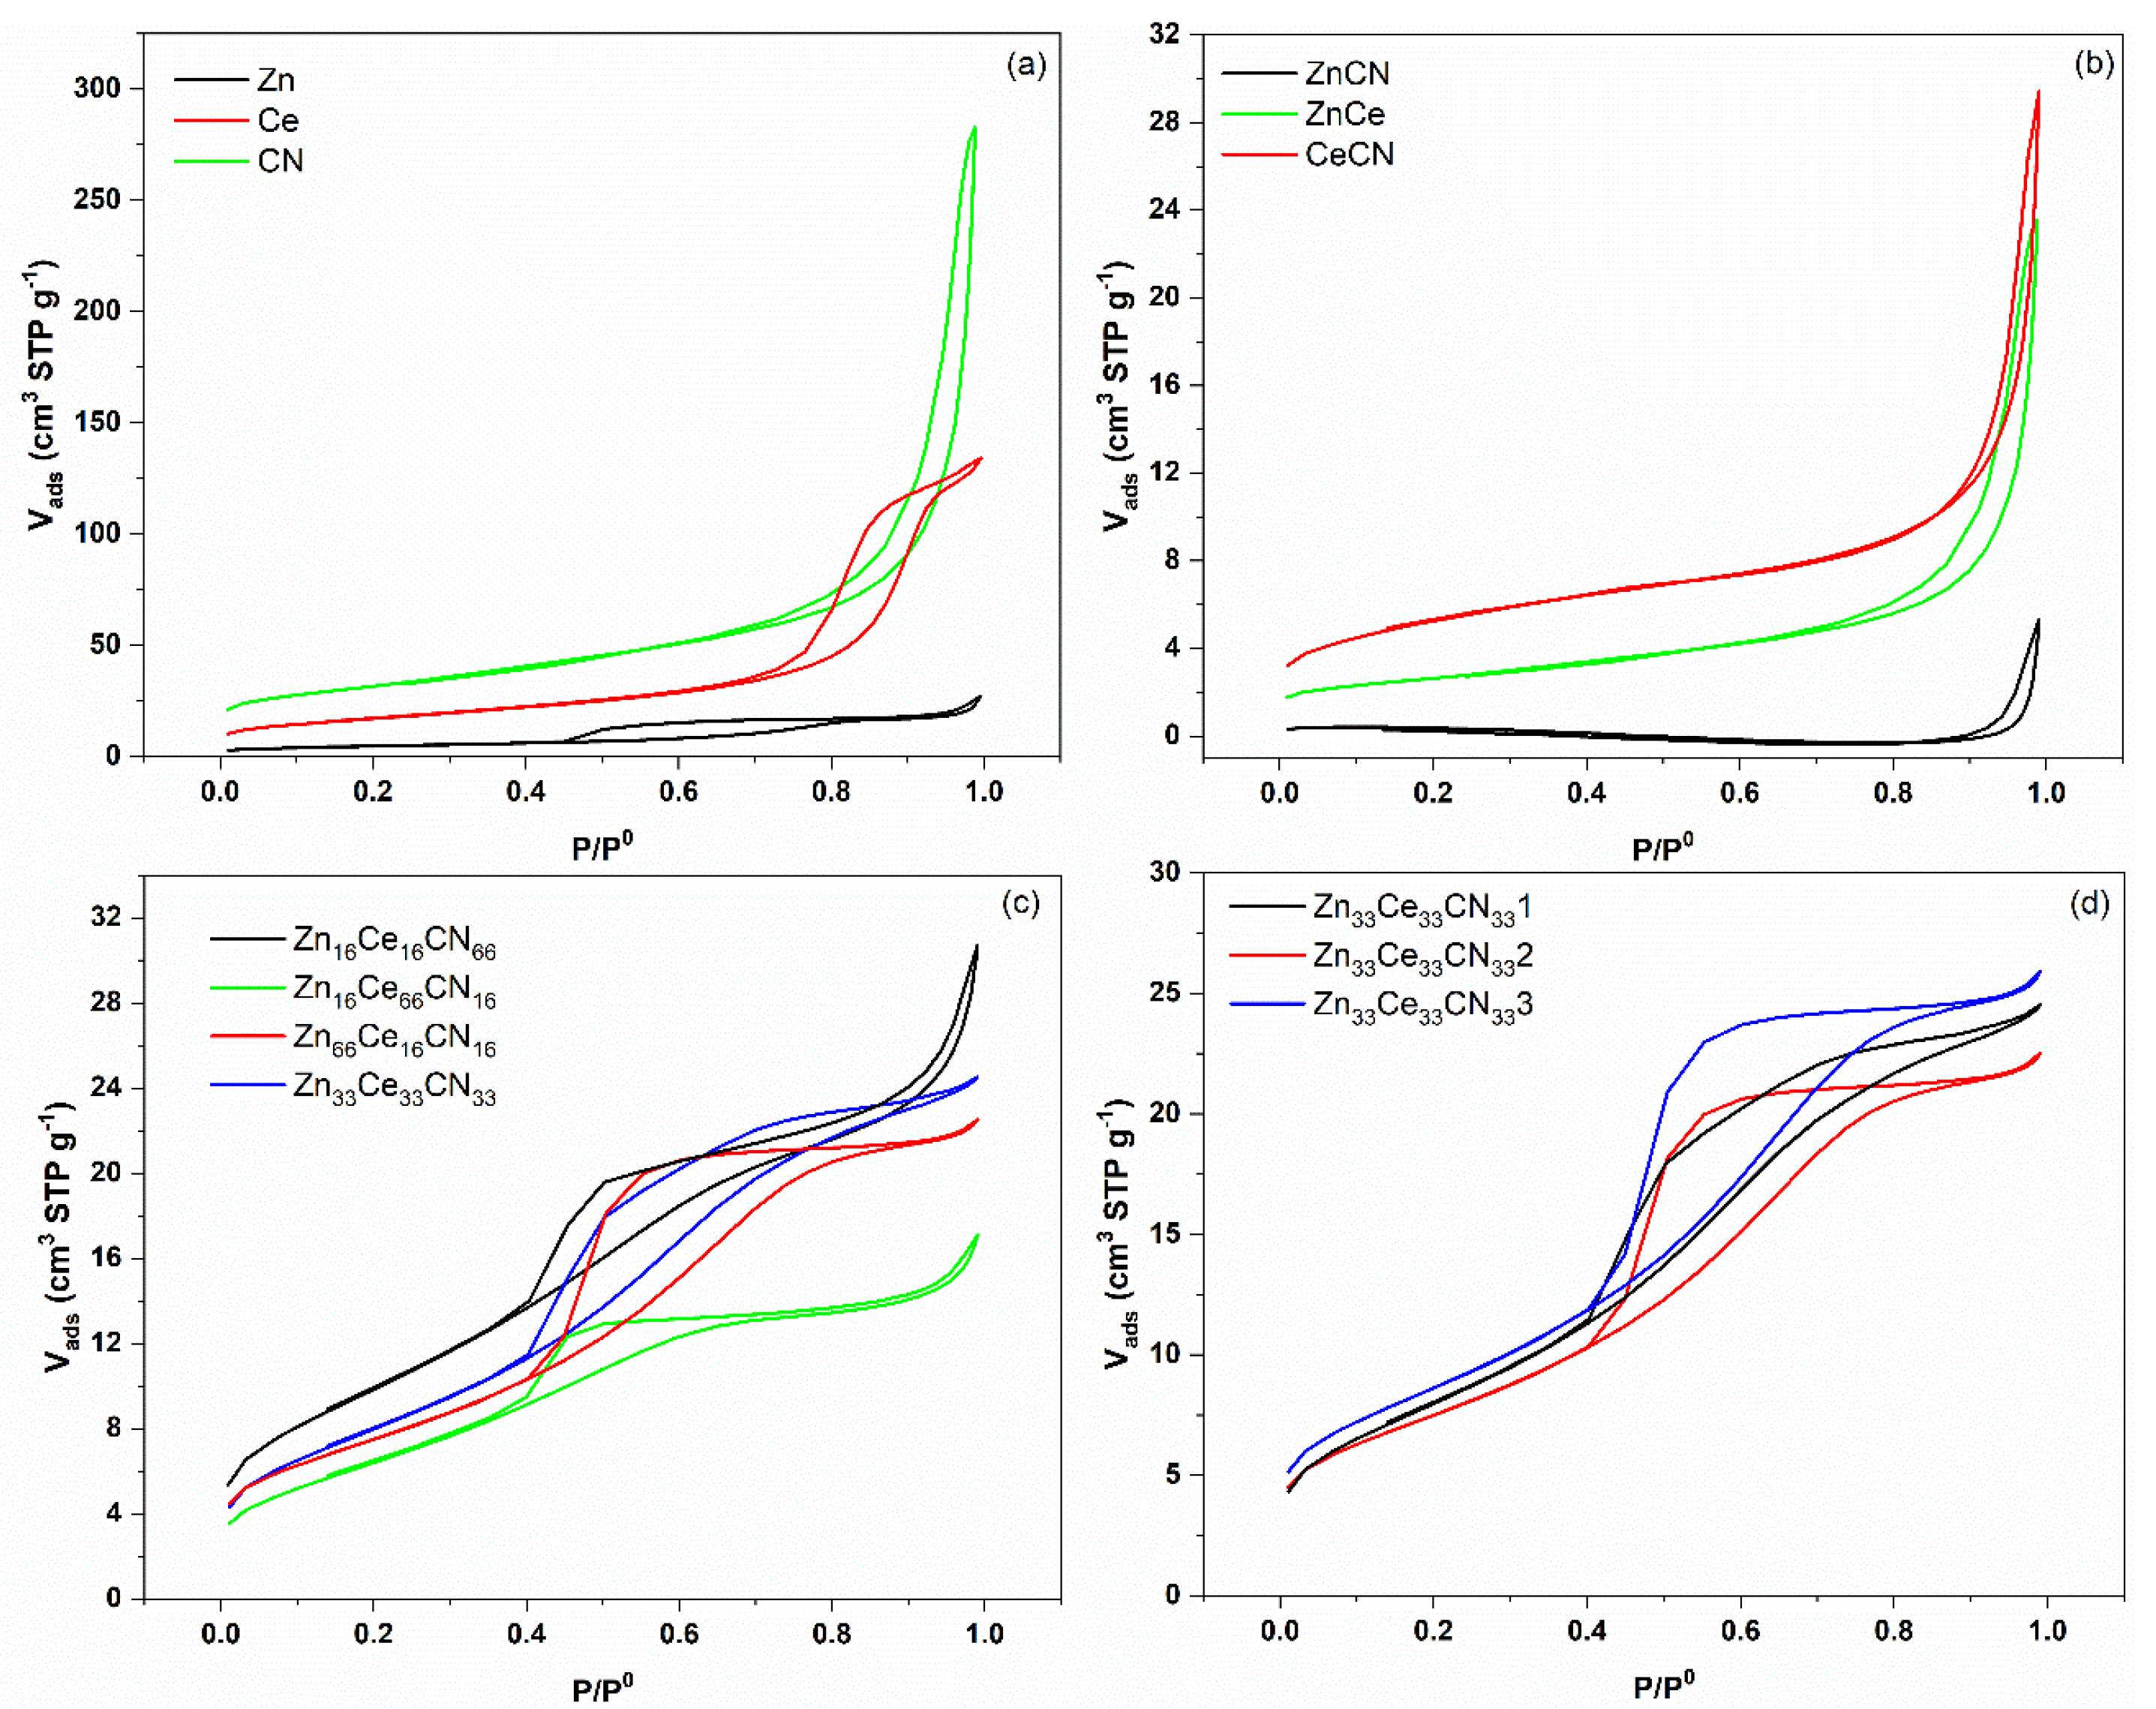
2.2. Nitrogen Adsorption
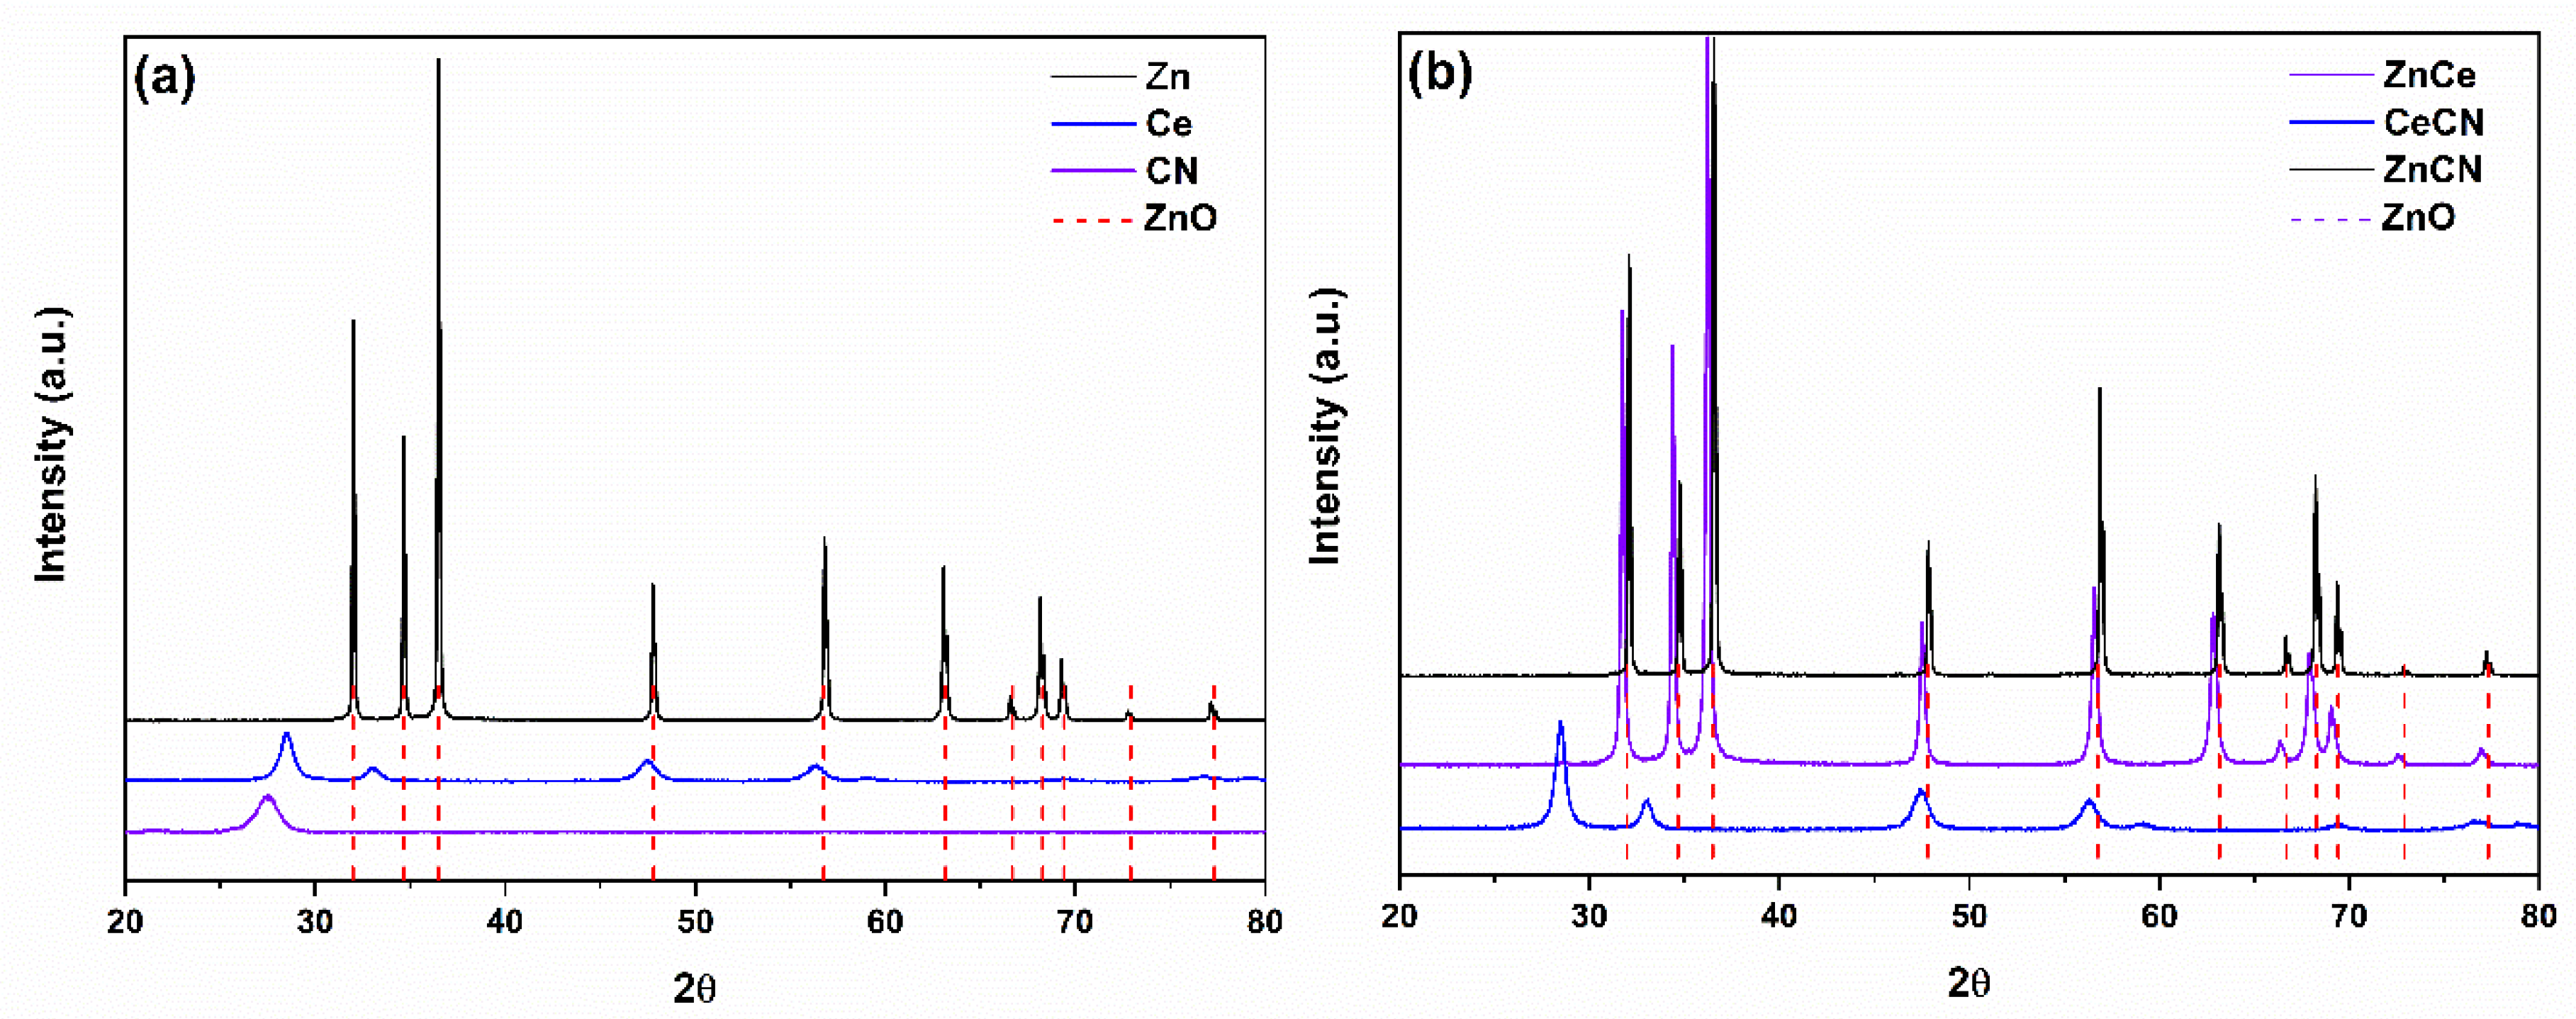
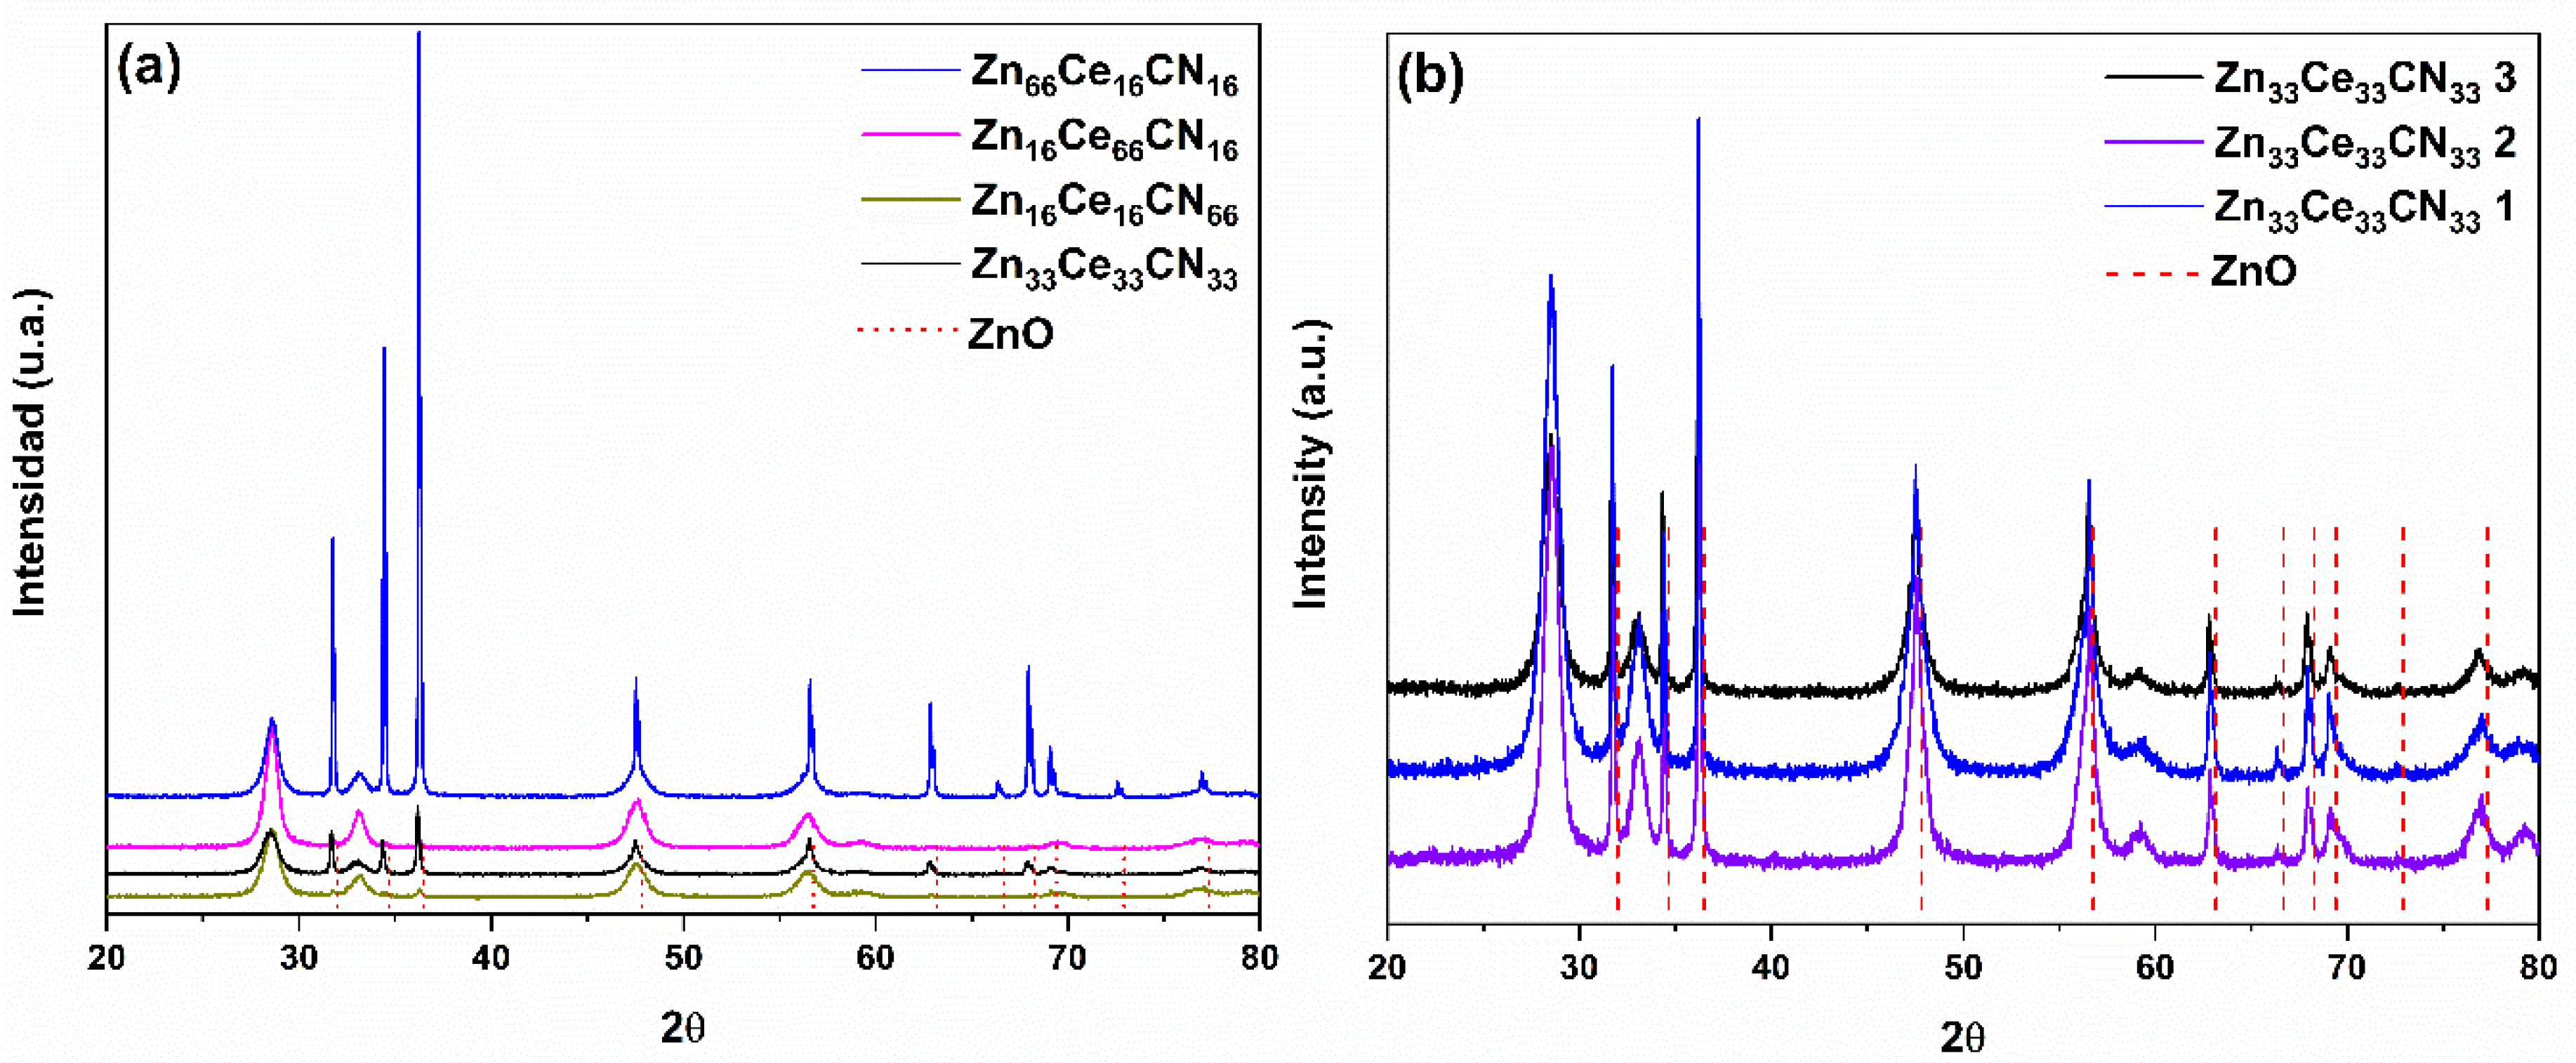
2.3. X-ray Diffraction
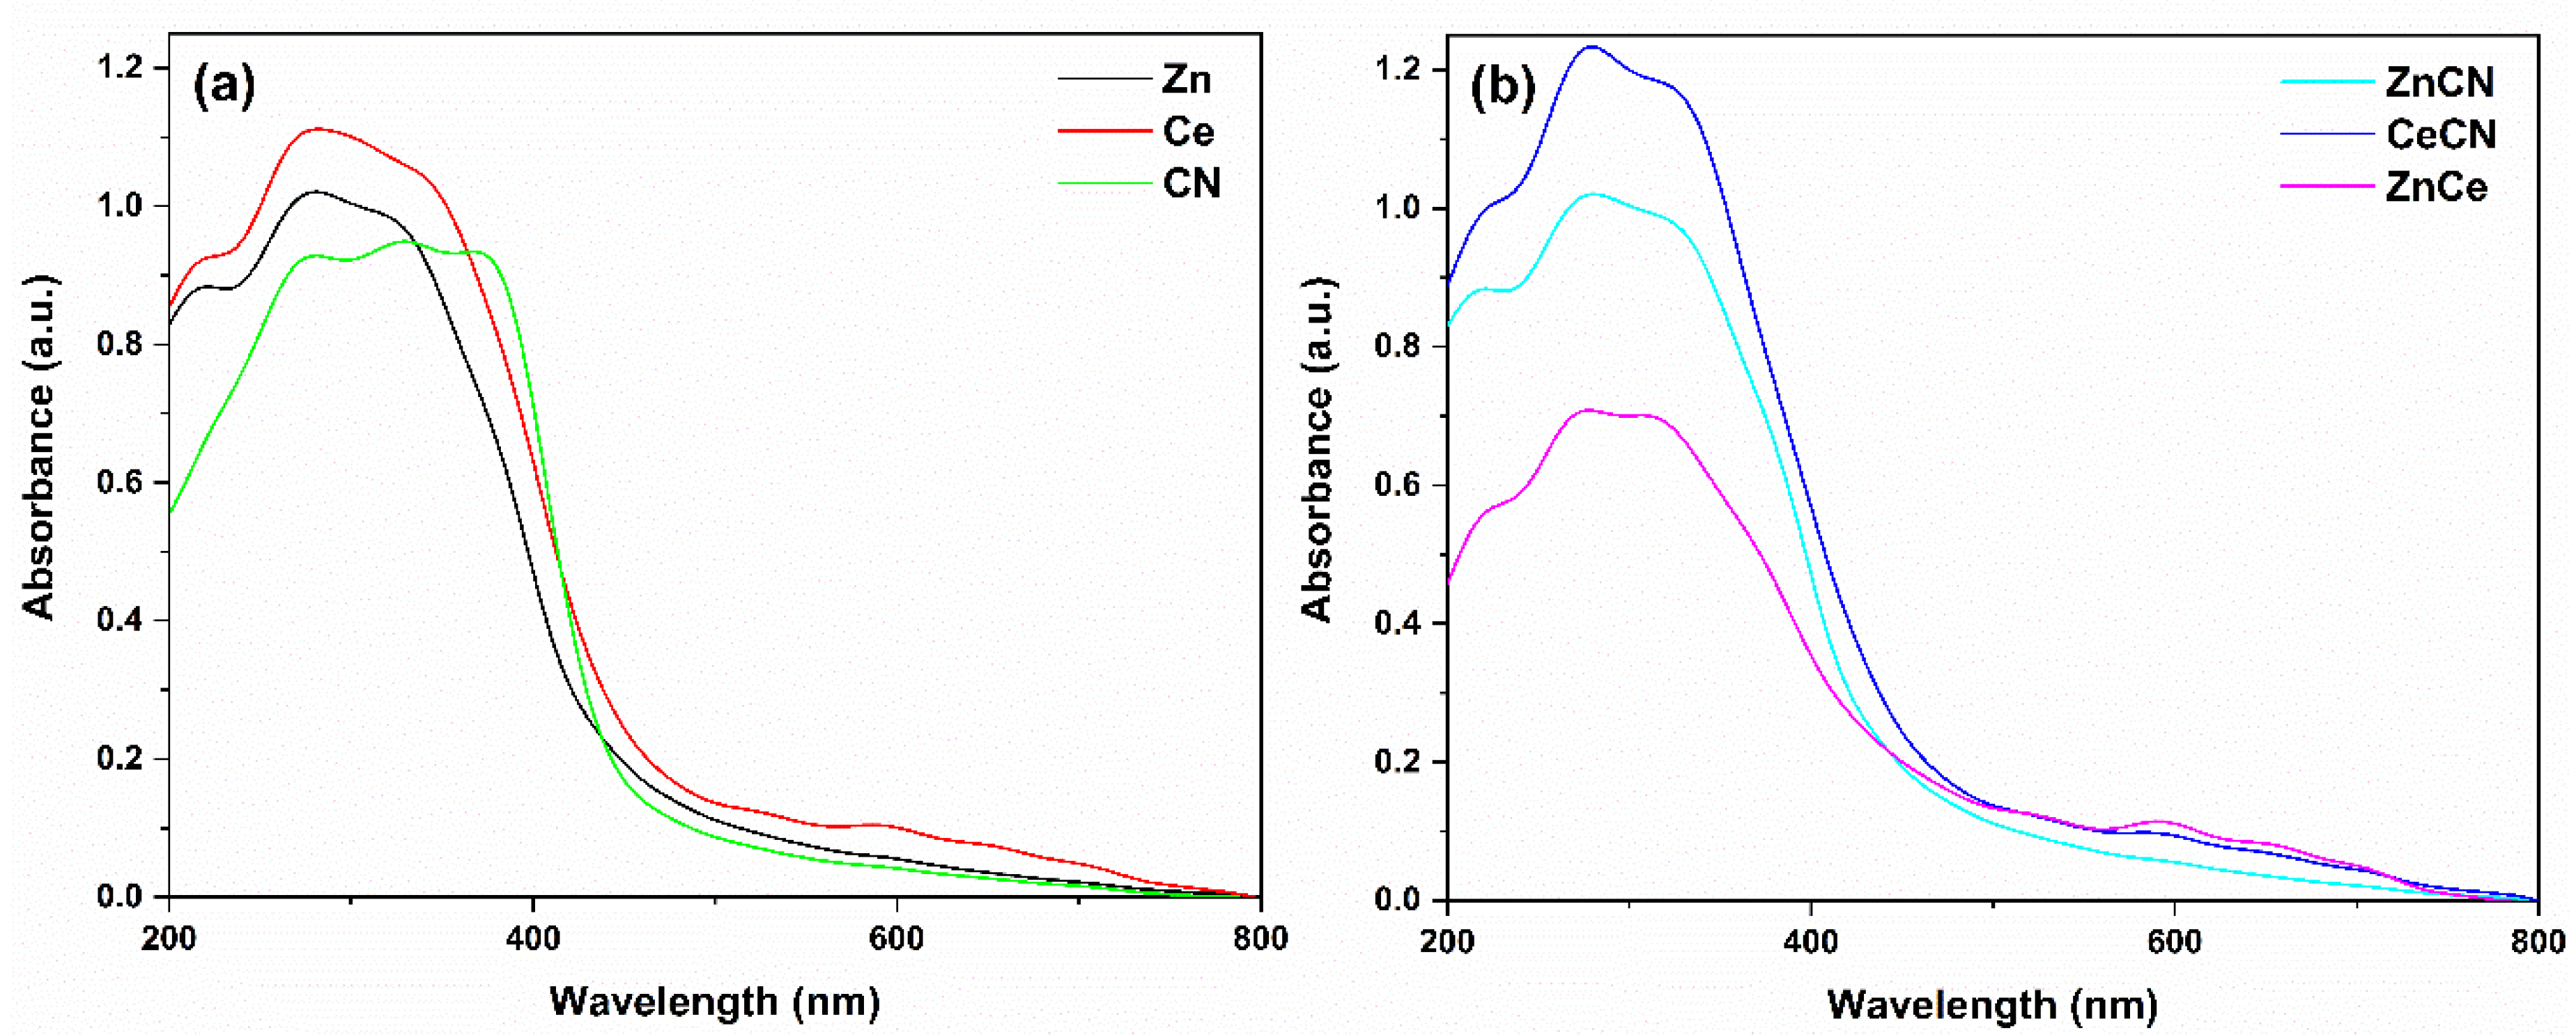
2.4. Diffuse Reflectance UV-Vis Spectroscopy (DRS UV-Vis)
2.5. Catalytic Test
2.6. Simplex-Centroid Mixture
2.7. Temperature Programmed Oxidation (TPO)
3. Results and Discussion
3.1. Nitrogen Adsorption/Desorption
3.2. X-ray Diffraction
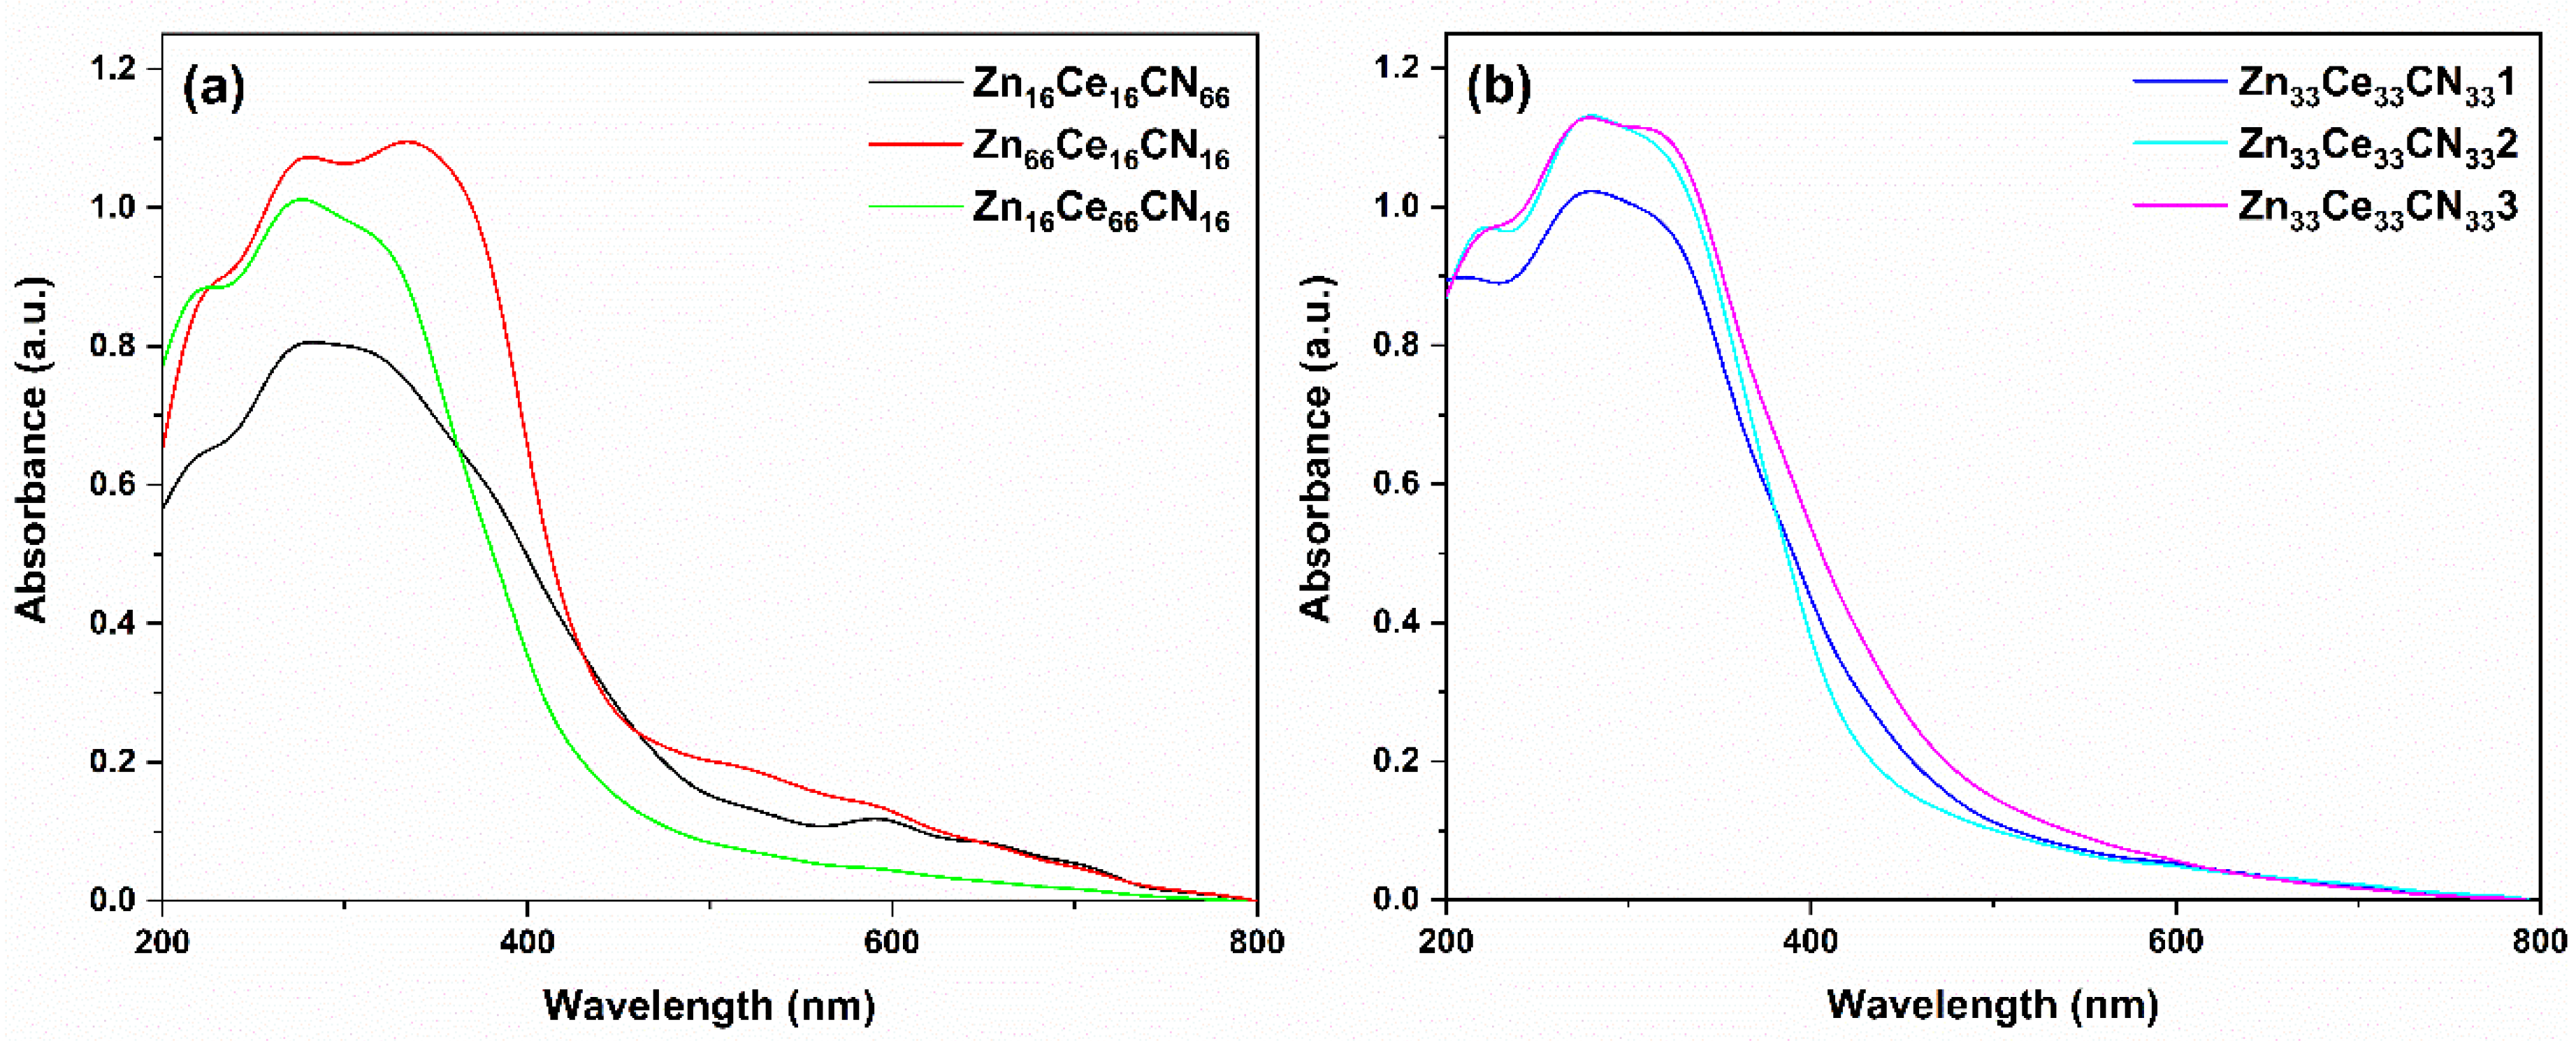
3.3. Diffuse Reflectance UV-Vis Spectroscopy
3.4. Catalytic Test
4. Conclusions
Author Contributions
Funding
Institutional Review Board Statement
Informed Consent Statement
Data Availability Statement
Acknowledgments
Conflicts of Interest
Appendix A

| Model | R2 | SS | dF | MS | F | p-Value |
|---|---|---|---|---|---|---|
| Lineal | 0.279 | 0.106 | 2 | 0.054 | 1.35 | 0.318 |
| Quadratic | 0.861 | 0.327 | 4 | 0.065 | 4.96 | 0.073 |
| Cubic | 0.915 | 0.348 | 6 | 0.058 | 5.41 | 0.097 |
| Factor | Coeff. | Est. Err | T-Statistic | p-Value |
|---|---|---|---|---|
| Urea (A) | 2.488 | 0.101 | 24.86 | 0.0001 |
| Zinc Nitrate (B) | 2.963 | 0.101 | 29.614 | 0.0001 |
| Cerium Nitrate (C) | 3.147 | 0.101 | 31.449 | 0.0001 |
| AB | 1.182 | 0.503 | 2.347 | 0.101 |
| AC | 0.669 | 0.503 | 1.329 | 0.275 |
| BC | −1.419 | 0.503 | −2.818 | 0.066 |
| ABC | 4.595 | 3.321 | 1.383 | 0.261 |
| Model | R2 | SS | dF | MS | F | p-Value |
|---|---|---|---|---|---|---|
| Lineal | 0.568 | 6124 | 2 | 3062 | 4.592 | 0.054 |
| Quadratic | 0.912 | 9838 | 5 | 1967 | 8.26 | 0.031 |
| Cubic | 0.992 | 10699 | 6 | 1783 | 58.32 | 0.003 |
| Factor | Coeff. | Est. Err | T-Statistic | p-Value |
|---|---|---|---|---|
| Urea (A) | 109 | 5.345 | 20.41 | 0.0002 |
| Zinc Nitrate (B) | 1.98 | 5.345 | 0.372 | 0.7351 |
| Cerium Nitrate (C) | 60.5 | 5.345 | 11.32 | 0.0014 |
| AB | −213 | 26.91 | −7.94 | 0.0041 |
| AC | −272 | 26.91 | −10.13 | 0.0020 |
| BC | −118 | 26.91 | −4.42 | 0.0214 |
| ABC | 941 | 177 | 5.30 | 0.0131 |
References
- Register, F. 81 FR 42912-Safety and Effectiveness of Consumer Antiseptics; Topical Antimicrobial Drug Products for Over-the-Counter Human Use; Proposed Amendment of the Tentative Final Monograph; Reopening of Administrative Record; Office of the Federal Register, National Archives and Records Administration: College Park, MD, USA, 2016; 81, pp. 42912–42937. Available online: https://www.govinfo.gov/app/details/FR-2016-06-30/2016-15410 (accessed on 22 April 2020).
- Jones, R.D.; Jampani, H.B.; Newman, J.L.; Lee, A.S. Triclosan: A Review of Effectiveness and Safety in Health Care Settings. Am. J. Infect. Control. 2000, 28, 184–196. [Google Scholar] [CrossRef] [PubMed]
- Schweizer, H.P. Triclosan: A Widely Used Biocide and Its Link to Antibiotics. FEMS Microbiol. Lett. 2001, 202, 1–7. [Google Scholar] [CrossRef] [PubMed]
- Kim, S.A.; Moon, H.; Lee, K.; Rhee, M.S. Bactericidal Effects of Triclosan in Soap Both in Vitro and in Vivo. J. Antimicrob. Chemother. 2015, 70, 3345–3352. [Google Scholar] [CrossRef] [PubMed] [Green Version]
- Drury, B.; Scott, J.; Rosi-Marshall, E.J.; Kelly, J.J. Triclosan Exposure Increases Triclosan Resistance and Influences Taxonomic Composition of Benthic Bacterial Communities. Environ. Sci. Technol. 2013, 47, 8923–8930. [Google Scholar] [CrossRef] [Green Version]
- Nietch, C.T.; Quinlan, E.L.; Lazorchak, J.M.; Impellitteri, C.A.; Raikow, D.; Walters, D. Effects of a Chronic Lower Range of Triclosan Exposure on a Stream Mesocosm Community. Environ. Toxicol. Chem. 2013, 32, 2874–2887. [Google Scholar] [CrossRef]
- Chen, Y.; Pi, B.; Zhou, H.; Yu, N.; Li, L. Triclosan Resistance in Clinical Isolates of Acinetobacter Baumannii. J. Med. Microbiol. 2009, 58, 1086–1091. [Google Scholar] [CrossRef] [Green Version]
- Lee, D.G.; Zhao, F.; Rezenom, Y.H.; Russell, D.H.; Chu, K.H. Biodegradation of Triclosan by a Wastewater Microorganism. Water Res. 2012, 46, 4226–4234. [Google Scholar] [CrossRef]
- McAvoy, D.C.; Schatowitz, B.; Jacob, M.; Huak, A.; Eckhoff, W.S. Measurement of Triclosan in Wastewater Treatment Systems. Environ. Toxicol. Chem. 2002, 21, 1323–1329. [Google Scholar] [CrossRef]
- Fair, P.A.; Lee, H.B.; Adams, J.; Darling, C.; Pacepavicius, G.; Alaee, M.; Bossart, G.D.; Henry, N.; Muir, D. Occurrence of Triclosan in Plasma of Wild Atlantic Bottlenose Dolphins (Tursiops Truncatus) and in Their Environment. Environ. Pollut. 2009, 157, 2248–2254. [Google Scholar] [CrossRef]
- Zhao, C.; Xie, H.J.; Xu, J.; Zhang, J.; Liang, S.; Hao, J.; Ngo, H.H.; Guo, W.; Xu, X.; Wang, Q.; et al. Removal Mechanisms and Plant Species Selection by Bioaccumulative Factors in Surface Flow Constructed Wetlands (CWs): In the Case of Triclosan. Sci. Total Environ. 2016, 547, 9–16. [Google Scholar] [CrossRef] [Green Version]
- Dayan, A.D. Risk Assessment of Triclosan [Irgasan®] in Human Breast Milk. Food Chem. Toxicol. 2007, 45, 125–129. [Google Scholar] [CrossRef] [PubMed]
- Yin, J.; Wei, L.; Shi, Y.; Zhang, J.; Wu, Q.; Shao, B. Chinese Population Exposure to Triclosan and Triclocarban as Measured via Human Urine and Nails. Environ. Geochem. Health 2016, 38, 1125–1135. [Google Scholar] [CrossRef] [PubMed]
- Reichert, G.; Hilgert, S.; Fuchs, S.; de Azevedo, J.C.R. Emerging Contaminants and Antibiotic Resistance in the Different Environmental Matrices of Latin America. Environ. Pollut. 2019, 255, 113140. [Google Scholar] [CrossRef] [PubMed]
- Siebe, C. Nutrient Inputs to Soils and Their Uptake by Alfalfa through Long-Term Irrigation with Untreated Sewage Effluent in Mexico. Soil Use Manag. 1998, 14, 119–122. [Google Scholar] [CrossRef]
- Xin, L.; Sun, Y.; Feng, J.; Wang, J.; He, D. Degradation of Triclosan in Aqueous Solution by Dielectric Barrier Discharge Plasma Combined with Activated Carbon Fibers. Chemosphere 2016, 144, 855–863. [Google Scholar] [CrossRef]
- Wang, F.; Lu, X.; Peng, W.; Deng, Y.; Zhang, T.; Hu, Y.; Li, X.Y. Sorption Behavior of Bisphenol A and Triclosan by Graphene: Comparison with Activated Carbon. ACS Omega 2017, 2, 5378–5384. [Google Scholar] [CrossRef]
- Cho, H.H.; Huang, H.; Schwab, K. Effects of Solution Chemistry on the Adsorption of Ibuprofen and Triclosan onto Carbon Nanotubes. Langmuir 2011, 27, 12960–12967. [Google Scholar] [CrossRef]
- Young, J.; James, A.N. Laccase-Catalysed Oxidation of Aqueous Triclosan. J. Chem. Technol. Biotechnol. 2006, 81, 1344–1352. [Google Scholar] [CrossRef]
- Li, J.; Peng, J.; Zhang, Y.; Ji, Y.; Shi, H.; Mao, L.; Gao, S. Removal of Triclosan via Peroxidases-Mediated Reactions in Water: Reaction Kinetics, Products and Detoxification. J. Hazard. Mater. 2016, 310, 152–160. [Google Scholar] [CrossRef]
- Murugesan, K.; Kim, Y.; Jeon, J.; Chang, Y. Effect of Metal Ions on Reactive Dye Decolorization by Laccase from Ganoderma Lucidum. J. Hazard. Mater. 2009, 168, 523–529. [Google Scholar] [CrossRef]
- Okawa, K.; Tsai, T.Y.; Nakano, Y.; Nishijima, W.; Okada, M. Effect of Metal Ions on Decomposition of Chlorinated Organic Substances by Ozonation in Acetic Acid. Chemosphere 2005, 58, 523–527. [Google Scholar] [CrossRef] [PubMed]
- Orhon, K.B.; Orhon, A.K.; Dilek, F.B.; Yetis, U. Triclosan Removal from Surface Water by Ozonation—Kinetics and by-Products Formation. J. Environ. Manage. 2017, 204, 327–336. [Google Scholar] [CrossRef] [PubMed]
- Hyun-Seok, S.; Jeehyeong, K.; Kyung-Duk, Z. Degradation of Triclosan in the Combined Reaction of Fe2+ and UV-C: Comparison with the Feton and Photolytic Reactions. Environ. Prog. Sustain. Energy 2010, 29, 925–932. [Google Scholar] [CrossRef]
- Rafqah, S.; Wong-Wah-Chung, P.; Nelieu, S.; Einhorn, J.; Sarakha, M. Phototransformation of Triclosan in the Presence of TiO2 in Aqueous Suspension: Mechanistic Approach. Appl. Catal. B Environ. 2006, 66, 119–125. [Google Scholar] [CrossRef]
- Wang, H.; Zhang, L.; Chen, Z.; Hu, J.; Li, S.; Wang, Z.; Liu, J.; Wang, X. Semiconductor Heterojunction Photocatalysts: Design, Construction, and Photocatalytic Performances. Chem. Soc. Rev. 2014, 43, 5234. [Google Scholar] [CrossRef]
- Hoffmann, M.R.; Martin, S.T.; Choi, W.; Bahnemann, D.W. Environmental Applications of Semiconductor Photocatalysis. Chem. Rev. 1995, 95, 69–96. [Google Scholar] [CrossRef]
- Wang, C.; Fan, H.; Ren, X.; Fang, J. Room Temperature Synthesis and Enhanced Photocatalytic Property of CeO2/ZnO Heterostructures. Appl. Phys. A 2018, 124, 99. [Google Scholar] [CrossRef]
- Asahi, R.; Morikawa, T.; Ohwaki, T.; Aoki, K.; Taga, Y. Visible-Light Photocatalysis in Nitrogen-Doped Titanium Oxides. Science 2001, 293, 269–271. [Google Scholar] [CrossRef]
- Subramanian, V.; Wolf, E.E.; Kamat, P.V. Catalysis with TiO2/Gold Nanocomposites. Effect of Metal Particle Size on the Fermi Level Equilibration. J. Am. Chem. Soc. 2004, 126, 4943–4950. [Google Scholar] [CrossRef]
- Diebold, U. The Surface Science of Titanium Dioxide. Surf. Sci. Rep. 2003, 48, 53–229. [Google Scholar] [CrossRef]
- Ranjit, K.T.; Viswanathan, B. Synthesis, Characterization and Photocatalytic Properties of Iron-Doped TiO2 Catalysts. J. Photochem. Photobiol. Chem. 1997, 108, 79–84. [Google Scholar] [CrossRef]
- Díaz-Amgulo, J.; Porras, J.; Mueses, M.; Torres-Palma, R.; Hernandez-Ramirez, A.; Machuca-Masrtinez, F. Coypling of Heterogeneous Photocatalysis and Photosensitized Oxidation for Diclofenac Degradation: Role of the Oxidant Species. J. Photochem. Photobiol. Chem. 2019, 383, 112015. [Google Scholar] [CrossRef]
- Jin, X.; Zhou, X.; Sun, P.; Lin, S.; Cao, W.; Li, Z.; Liu, W. Photocatalytic Degradation of Norfloxacin Using N-Doped TiO2: Optimization, Mechanism, Identification of Intermediates and Toxicity Evaluation. Chemosphere 2019, 237, 124433. [Google Scholar] [CrossRef] [PubMed]
- Yi, C.; Liao, Q.; Deng, W.; Huang, Y.; Mao, J.; Zhang, B.; Wu, G. The Preparation of Amorphous TiO2 Doped with Cationic S and Its Application to the Degradation of DCFs under Visible Light Irradiation. Sci. Total Environ. 2019, 684, 527–536. [Google Scholar] [CrossRef] [PubMed]
- Kumar, M.; Fuentez-torres, M.O.; Alcudia-ramos, M.A.; Ortiz-chi, F.; Espinosa-gonzález, C.G.; Aleman, M.; Torres-torres, J.G.; Godavarthi, S. For Photocatalytic Degradation of an Herbicide. Integr. Med. Res. 2018, 8, 1–8. [Google Scholar] [CrossRef]
- Saravanan, R.; Karthikeyan, N.; Govindan, S.; Narayanan, V.; Stephen, A. Photocatalytic Degradation of Organic Dyes Using ZnO/CeO2 Nanocomposite Material under Visible Light. Adv. Mater. Res. 2012, 584, 381–385. [Google Scholar] [CrossRef]
- Li, C.; Zhang, X.; Dong, W.; Liu, Y. High Photocatalytic Activity Material Based on High-porosity ZnO/CeO2 Nanofibers. Mater. Lett. 2012, 80, 145–147. [Google Scholar] [CrossRef]
- Kaur, J.; Bhukal, S.; Gupta, K.; Tripathy, M.; Bansal, S.; Singhal, S. Nanocomposite of CeO2 and ZnO: An Active Material for the Treatment of Contaminated Water. Mater. Chem. Phys. 2016, 177, 512–520. [Google Scholar] [CrossRef]
- Lv, Z.; Zhong, Q.; Ou, M. Utilizing Peroxide as Precursor for the Synthesis of CeO2/ZnO Composite Oxide with Enhanced Photocatalytic Activity. Appl. Surf. Sci. 2016, 376, 91–96. [Google Scholar] [CrossRef]
- Li, C.; Chen, R.; Zhang, X.; Shu, S.; Xiong, J.; Zheng, Y.; Dong, W. Electrospinning of CeO2–ZnO Composite Nanofibers and Their Photocatalytic Property. Mater. Lett. 2011, 65, 1327–1330. [Google Scholar] [CrossRef]
- Cerrato, E.; Rebolini, E.; Fabbri, D.; Calza, P.; Paganini, M.C. Ternary Systems Based on ZnO/CeO2/CuO for the Degradation of Phenol and Carbamazepine. J. Alloys Compd. 2021, 856, 158167. [Google Scholar] [CrossRef]
- Luo, K.; Li, J.; Hu, W.; Li, H.; Zhang, Q.; Yuan, H.; Yu, F.; Xu, M.; Xu, S. Synthesizing CuO/CeO2/ZnO Ternary Nano-Photocatalyst with Highly Effective Utilization of Photo-Excited Carriers under Sunlight. Nanomaterials 2020, 10, 1946. [Google Scholar] [CrossRef] [PubMed]
- Chen, R.; Zhang, Z.; Feng, C.; Hu, K.; Li, M.; Li, Y.; Shimizu, K.; Chen, N.; Sugiura, N. Application of Simplex-Centroid Mixture Design in Developing and Optimizing Ceramic Adsorbent for As(V) Removal from Water Solution. Microporous Mesoporous Mater. 2010, 131, 115–121. [Google Scholar] [CrossRef]
- BahramParvar, M.; Tehrani, M.M.; Razavi, S.M.A.; Koocheki, A. Application of Simplex-Centroid Mixture Design to Optimize Stabilizer Combinations for Ice Cream Manufacture. J. Food Sci. Technol. 2015, 52, 1480–1488. [Google Scholar] [CrossRef] [PubMed] [Green Version]
- Shokrani, R.; Haghighi, M.; Jodeiri, N.; Ajamein, H.; Abdollahifar, M. Fuel Cell Grade Hydrogen Production via Methanol Steam Reforming over CuO/ZnO/Al2O3 Nanocatalyst with Various Oxide Ratios Synthesized via Urea-Nitrates Combustion Method. Int. J. Hydrog. Energy 2014, 39, 13141–13155. [Google Scholar] [CrossRef]
- Serpone, N.; Pelizzetti, E. Photocatalysis: Fundamentals and Applications; Wiley: Chichester, UK, 1985; p. 650. ISBN 0-471-62603-1. [Google Scholar]
- Cornell, J.A. Experiments with Mixtures: Designs, Models, and the Analysis of Mixture Data, 3rd ed.; Wiley: New York, NY, USA, 2002; ISBN 978-0-471-39367-2. [Google Scholar]
- Wahab, M.A.; Joseph, J.; Atanda, L.; Sultana, U.K.; Beltramini, J.N.; Ostrikov, K.; Will, G.; O’Mullane, A.P.; Abdala, A. Nanoconfined Synthesis of Nitrogen-Rich Metal-Free Mesoporous Carbon Nitride Electrocatalyst for the Oxygen Evolution Reaction. ACS Appl. Energy Mater. 2020, 3, 1439–1447. [Google Scholar] [CrossRef]
- Wahab, M.A.; Hasan, C.M.; Alothman, Z.A.; Hossain, M.S.A. In-Situ Incorporation of Highly Dispersed Silver Nanoparticles in Nanoporous Carbon Nitride for the Enhancement of Antibacterial Activities. J. Hazard. Mater. 2021, 408, 124919. [Google Scholar] [CrossRef]
- Kosera, V.S.; Cruz, T.M.; Chaves, E.S.; Tiburtius, E.R.L. Triclosan Degradation by Heterogeneous Photocatalysis Using ZnO Immobilized in Biopolymer as Catalyst. J. Photochem. Photobiol. Chem. 2017, 344, 184–191. [Google Scholar] [CrossRef]
- Thommes, M.; Kaneko, K.; Neimark, A.V.; Olivier, J.P.; Rodriguez-Reinoso, F.; Rouquerol, J.; Sing, K.S.W. Physisorption of Gases, with Special Reference to the Evaluation of Surface Area and Pore Size Distribution (IUPAC Technical Report). Pure Appl. Chem. 2015, 87, 1051–1069. [Google Scholar] [CrossRef] [Green Version]
- Fuentez-Torres, M.O.; Ortiz-Chi, F.; Espinosa-González, C.G.; Aleman, M.; Cervantes-Uribe, A.; Torres-Torres, J.G.; Kesarla, M.K.; Collins-Martínez, V.; Godavarthi, S.; Martínez-Gómez, L. Facile Synthesis of Zn Doped G-C3N4 for Enhanced Visible Light Driven Photocatalytic Hydrogen Production. Top. Catal. 2021, 64, 65–72. [Google Scholar] [CrossRef]
- Sasirekha, C.; Arumugam, S.; Muralidharan, G. Green Synthesis of ZnO/Carbon (ZnO/C) as an Electrode Material for Symmetric Supercapacitor Devices. Appl. Surf. Sci. 2018, 449, 521–527. [Google Scholar] [CrossRef]
- Osman, H.; Su, Z.; Ma, X.; Liu, S.; Liu, X.; Abduwayit, D. Synthesis of ZnO/C Nanocomposites with Enhanced Visible Light Photocatalytic Activity. Ceram. Int. 2016, 42, 10237–10241. [Google Scholar] [CrossRef]
- Vipin, P.M.; Sanjaynath, V.V.; Varma, H.K.; Warrier, K.G.K.; Damodaran, A.D. Non-Linearity in Rare Earth Doped Zinc Oxide Varistor Prepared by Flash Combustion Method. J. Eur. Ceram. Soc. 1989, 5, 233–236. [Google Scholar] [CrossRef]
- Wynne, A.M. The Thermal Decomposition of Urea: An Undergraduate Thermal Analysis Experiment. J. Chem. Educ. 1987, 64, 180. [Google Scholar] [CrossRef]
- Varma, H.K.; Mukundan, P.; Warrier, K.G.K.; Damodaran, A.D. Flash Combustion Synthesis of Cerium Oxide. J. Mater. Sci. Lett. 1990, 9, 377–379. [Google Scholar] [CrossRef]
- Meng, Q.; Cui, J.; Tang, Y.; Han, Z.; Zhao, K.; Zhang, G.; Diao, Q. Solvothermal Synthesis of Dual-Porous CeO2-ZnO Composite and Its Enhanced Acetone Sensing Performance. Ceram. Int. 2019, 45, 4103–4107. [Google Scholar] [CrossRef]
- Cerrato, E.; Gionco, C.; Paganini, M.C.; Giamello, E.; Albanese, E.; Pacchioni, G. Origin of Visible Light Photoactivity of the CeO2/ZnO Heterojunction. ACS Appl. Energy Mater. 2018, 1, 4247–4260. [Google Scholar] [CrossRef]
- Hezam, A.; Wang, J.; Drmosh, Q.A.; Karthik, P.; Abdullah Bajiri, M.; Namratha, K.; Zare, M.; Lakshmeesha, T.; Shivanna, S.; Cheng, C.; et al. Rational Construction of Plasmonic Z-Scheme Ag-ZnO-CeO2 Heterostructures for Highly Enhanced Solar Photocatalytic H2 Evolution. Appl. Surf. Sci. 2021, 541, 148457. [Google Scholar] [CrossRef]
- Celebi, N.; Arlı, F.; Soysal, F.; Salimi, K. Z-Scheme ZnO@PDA/CeO2 Heterojunctions Using Polydopamine as Electron Transfer Layer for Enhanced Photoelectrochemical H2 Generation. Mater. Today Energy 2021, 21, 100765. [Google Scholar] [CrossRef]
- Chen, X.; Dong, B.; Islam, Q.A.; Song, H.; Wu, Y. Semiconductor-Ionic Properties and Device Performance of Heterogeneous La-Doped CeO2-ZnO Nanocomposites. Int. J. Hydrog. Energy 2021, 46, 9968–9975. [Google Scholar] [CrossRef]
- Das, A.; Patra, M.; Kumar, P.M.; Bhagavathiachari, M.; Nair, R.G. Defect-Induced Visible-Light-Driven Photocatalytic and Photoelectrochemical Performance of ZnO–CeO2 Nanoheterojunctions. J. Alloys Compd. 2021, 858, 157730. [Google Scholar] [CrossRef]
- Huang, L.; Bao, D.; Jiang, X.; Li, J.; Zhang, L.; Sun, X. Fabrication of Stable High-Performance Urchin-like CeO2/ZnO@Au Hierarchical Heterojunction Photocatalyst for Water Remediation. J. Colloid Interface Sci. 2021, 588, 713–724. [Google Scholar] [CrossRef] [PubMed]
- Kumari, V.; Yadav, S.; Mittal, A.; Sharma, S.; Kumari, K.; Kumar, N. Hydrothermally Synthesized Nano-Carrots ZnO with CeO2 Heterojunctions and Their Photocatalytic Activity towards Different Organic Pollutants. J. Mater. Sci. Mater. Electron. 2020, 31, 5227–5240. [Google Scholar] [CrossRef]
- Negi, K.; Kumar, M.; Chauhan, M.S. Solution Combustion Synthesis of CeO2/ZnO Nano-Composite as a Potential Scaffold for Detection and Degradation of p-Nitrophenol. Mater. Chem. Phys. 2019, 226, 59–65. [Google Scholar] [CrossRef]
- Wolski, L.; Grzelak, K.; Muńko, M.; Frankowski, M.; Grzyb, T.; Nowaczyk, G. Insight into Photocatalytic Degradation of Ciprofloxacin over CeO2/ZnO Nanocomposites: Unravelling the Synergy between the Metal Oxides and Analysis of Reaction Pathways. Appl. Surf. Sci. 2021, 563, 150338. [Google Scholar] [CrossRef]
- Xiao, Y.; Yu, H.; Dong, X. Ordered Mesoporous CeO2/ZnO Composite with Photodegradation Concomitant Photocatalytic Hydrogen Production Performance. J. Solid State Chem. 2019, 278, 120893. [Google Scholar] [CrossRef]
- Zhang, Q.; Zhao, X.; Duan, L.; Shen, H.; Liu, R. Controlling Oxygen Vacancies and Enhanced Visible Light Photocatalysis of CeO2/ZnO Nanocomposites. J. Photochem. Photobiol. Chem. 2020, 392, 112156. [Google Scholar] [CrossRef]
- Chi, N.; Mai, T.; Thi, T.; Van, T.; Juang, R. Separation and Puri Fi Cation Technology Enhanced Removal of Various Dyes from Aqueous Solutions by UV and Simulated Solar Photocatalysis over TiO2/ZnO/RGO Composites. Separtion Purif. Technol. 2020, 232, 115962. [Google Scholar] [CrossRef]
- Wittawat, R.; Rittipun, R.; Jarasfah, M.; Nattaporn, B. Synthesis of ZnO/TiO2 Spherical Particles for Blue Light Screening by Ultrasonic Spray Pyrolysis. Mater. Today Commun. 2020, 24, 101126. [Google Scholar] [CrossRef]
- Sharma, H.K.; Archana, R.; Sankar ganesh, R.; Singh, B.P.; Ponnusamy, S.; Hayakawa, Y.; Muthamizhchelvan, C.; Raji, P.; Kim, D.Y.; Sharma, S.K. Substitution of Al3+ to Zn2+ Sites of ZnO Enhanced the Photocatalytic Degradation of Methylene Blue under Irradiation of Visible Light. Solid State Sci. 2019, 94, 45–53. [Google Scholar] [CrossRef]
- Tomova, D.; Iliev, V.; Eliyas, A.; Rakovsky, S. Promoting the Oxidative Removal Rate of Oxalic Acid on Gold-Doped CeO2/TiO2 Photocatalysts under UV and Visible Light Irradiation. Sep. Purif. Technol. 2015, 156, 715–723. [Google Scholar] [CrossRef]
- Ding, J.; Long, G.; Luo, Y.; Sun, R.; Chen, M.; Li, Y.; Zhou, Y.; Xu, X.; Zhao, W. Photocatalytic Reductive Dechlorination of 2-Chlorodibenzo-p-Dioxin by Pd Modified g-C3N4 Photocatalysts under UV-Vis Irradiation: Efficacy, Kinetics and Mechanism. J. Hazard. Mater. 2018, 355, 74–81. [Google Scholar] [CrossRef] [PubMed]
- García-Hernández, L.E.; Frías-Márquez, D.M.; Gpe Pacheco-Sosa, J.; Cervantes-Uribe, A.; Carlos Arévalo-Pérez, J.; Pérez-Vidal, H.; Silahua-Pavón, A.A.; Antonia Lunagómez-Rocha, M.; Torres-Torres, J.G. 2-Chlorophenol Degradation by Catalytic Wetair Oxidation Using Copper Supported on TiO2-CeO2-ZrO2. Water Sci. Technol. 2019, 80, 911–919. [Google Scholar] [CrossRef] [PubMed]
- Ranjithkumar, R.; Lakshmanan, P.; Devendran, P.; Nallamuthu, N.; Sudhahar, S.; Kumar, M.K. Investigations on Effect of Graphitic Carbon Nitride Loading on the Properties and Electrochemical Performance of G-C3N4/TiO2 Nanocomposites for Energy Storage Device Applications. Mater. Sci. Semicond. Process. 2021, 121, 105328. [Google Scholar] [CrossRef]
- Hu, C.; Hu, X.; Li, R.; Xing, Y. MOF Derived ZnO/C Nanocomposite with Enhanced Adsorption Capacity and Photocatalytic Performance under Sunlight. J. Hazard. Mater. 2020, 385, 121599. [Google Scholar] [CrossRef] [PubMed]
- Xiong, Z.; Lei, Z.; Xu, Z.; Chen, X.; Gong, B.; Zhao, Y.; Zhao, H.; Zhang, J.; Zheng, C. Flame Spray Pyrolysis Synthesized ZnO/CeO2 Nanocomposites for Enhanced CO2 Photocatalytic Reduction under UV-Vis Light Irradiation. J. CO2 Util. 2017, 18, 53–61. [Google Scholar] [CrossRef]
- Shen, Z.; Xia, Q.; Li, Y.; Yin, C.; Ge, Z.; Li, X.; Wang, Y. Adsorption-Enhanced Nitrogen-Doped Mesoporous CeO2 as an Efficient Visible-Light-Driven Catalyst for CO2 photoreduction. J. CO2 Util. 2020, 39, 2–7. [Google Scholar] [CrossRef]
- Serpone, N.; Pelizzetti, E. 331 Journal of Organometallic. J. Organomet. Chemestry 1985, 297, 331–340. [Google Scholar]
- Wu, Y.; Zhang, D.B.; Zhao, Z.; Pei, J.; Zhang, B.P. Enhanced Thermoelectric Properties of ZnO: C Doping and Band Gap Tuning. J. Eur. Ceram. Soc. 2021, 41, 1324–1331. [Google Scholar] [CrossRef]
- Rajesh, K.; Sakthivel, P.; Santhanam, A.; Venugobal, J. Incorporation of Silver Ion on Structural and Optical Characteristics of CeO2 Nanoparticles: White LED Applications. Optik 2020, 216, 164800. [Google Scholar] [CrossRef]
- Li, P.; Wang, B.; Qin, C.; Han, C.; Sun, L.; Wang, Y. Band-Gap-Tunable CeO2 Nanoparticles for Room-Temperature NH3 Gas Sensors. Ceram. Int. 2020, 46, 19232–19240. [Google Scholar] [CrossRef]
- Zhu, D.; Zhou, Q. Nitrogen Doped g-C3N4 with the Extremely Narrow Band Gap for Excellent Photocatalytic Activities under Visible Light. Appl. Catal. B Environ. 2021, 281, 119474. [Google Scholar] [CrossRef]
- Kandavelu, V.; Renganathan, R.; Saravanan, D. Photocatalytic Study of Some Common Allergens and Harmful Ingredients Used in Everyday Products. J. Environ. Nanotechnol. 2016, 5, 1–8. [Google Scholar] [CrossRef]
- Hwangbo, M.; Claycomb, E.C.; Liu, Y.; Alivio, T.E.G.; Banerjee, S.; Chu, K.-H. Effectiveness of Zinc Oxide-Assisted Photocatalysis for Concerned Constituents in Reclaimed Wastewater: 1,4-Dioxane, Trihalomethanes, Antibiotics, Antibiotic Resistant Bacteria (ARB), and Antibiotic Resistance Genes (ARGs). Sci. Total Environ. 2019, 649, 1189–1197. [Google Scholar] [CrossRef]
- Sponza, D.T.; Güney, G. Photodegradation of Some Brominated and Phenolic Micropollutants in Raw Hospital Wastewater with CeO2 and TiO2 Nanoparticles. Water Sci. Technol. 2017, 76, 2603–2622. [Google Scholar] [CrossRef] [Green Version]
- Venkatesan Savunthari, K.; Arunagiri, D.; Shanmugam, S.; Ganesan, S.; Arasu, M.V.; Al-Dhabi, N.A.; Chi, N.T.L.; Ponnusamy, V.K. Green Synthesis of Lignin Nanorods/g-C3N4 Nanocomposite Materials for Efficient Photocatalytic Degradation of Triclosan in Environmental Water. Chemosphere 2021, 272, 129801. [Google Scholar] [CrossRef]
- Wang, J.; Yue, M.; Han, Y.; Xu, X.; Yue, Q.; Xu, S. Highly-Efficient Degradation of Triclosan Attributed to Peroxymonosulfate Activation by Heterogeneous Catalyst g-C3N4/MnFe2O4. Chem. Eng. J. 2020, 391, 123554. [Google Scholar] [CrossRef]
- Dias, A.C.; Fontes, M.P.F.; Reis, C.; Bellato, C.R.; Fendorf, S. Simplex-Centroid Mixture Design Applied to Arsenic (V) Removal from Waters Using Synthetic Minerals. J. Environ. Manage. 2019, 238, 92–101. [Google Scholar] [CrossRef]
- Chen, B.; Wang, M.; Lu, W.; Chang, J. Use of Active Consortia of Constructed Ternary Bacterial Cultures via Mixture Design for Azo-Dye Decolorization Enhancement. J. Hazard. Mater. 2007, 145, 404–409. [Google Scholar] [CrossRef]


| Sample | ZnO (%) | CeO2 (%) | Urea (%) | Symbology | Amount (g) |
|---|---|---|---|---|---|
| 1 | − | − | 100 | CN | 9.8 |
| 2 | 100 | − | − | Zn | 11.4 |
| 3 | − | 100 | − | Ce | 12.5 |
| 4 | 50 | 50 | − | Zn-Ce | 6.3/5.7 |
| 5 | − | 50 | 50 | Ce-CN | 6.3/4.9 |
| 6 | 50 | − | 50 | Zn-CN | 5.7/4.9 |
| 7 | 16 | 16 | 66 | Zn16Ce16CN66 | 1.9/2.1/6.5 |
| 8 | 66 | 16 | 16 | Zn66Ce16CN16 | 7.6/2.1/1.6 |
| 9 | 16 | 66 | 16 | Zn16Ce66CN16 | 1.9/8.4/1.6 |
| 10 | 33 | 33 | 33 | Zn33Ce33CN33 | 3.8/4.1/3.2 |
| Sample | Área (m2/g) | D (nm) a | D (nm) b | D (nm) c | Eg (eV) |
|---|---|---|---|---|---|
| CN | 111 | − | − | 7.5 | 2.52 |
| Zn | 1 | 92.0 | − | − | 2.98 |
| Ce | 61 | − | 10.4 | − | 3.11 |
| ZnCe | 1 | 33.9 | − | − | 2.68 |
| ZnCN | 3 | 58.2 | − | − | 3.07 |
| CeCN | 19 | − | 13.0 | − | 2.98 |
| Zn16Ce16CN66 | 36 | 30.1 | 9.4 | − | 2.82 |
| Zn16Ce66CN16 | 24 | 30.5 | 11.3 | − | 3.14 |
| Zn66Ce16CN16 | 4 | 82.0 | 10.6 | − | 2.93 |
| Zn33Ce33CN33 1 | 28 | 48.6 | 9.5 | − | 3.12 |
| Zn33Ce33CN33 2 | 29 | 55.5 | 9.5 | − | 3.14 |
| Zn33Ce33CN33 3 | 27 | 51.3 | 9.4 | − | 3.10 |
| # | Precursores | Aditivos | Método | Ref. | |
|---|---|---|---|---|---|
| Zn | Ce | ||||
| 1 | Zn(NO3)2 | Ce(NO3)2 | Lavander | Sunlight driven | [61] |
| 2 | Zn(aca)2 | Ce(NO3)2 | Polivinylpyrrolidine | Hydrothermal | [62] |
| 3 | Zn(NO3)2 | Ce(NO3)2 | NaOH | Hydrothermal | [63] |
| 4 | Zn(NO3)2 | Ce(NO3)2 | NaOH | Hydrothermal | [64] |
| 5 | Zn(NO3)2 | Ce(NO3)2 | NaOH | Hydrothermal | [65] |
| 6 | Zn(NO3)2 | Ce(NO3)3 | RhB | Hydrothermal | [66] |
| 7 | Zn(NO3)2 | (NH4)2[Ce(NO3)6] | p-nitrophenol | Combustion | [67] |
| 8 | Zn(NO3)2 | Ce(NO3)2 | NaOH | Co-precipitation | [68] |
| 9 | Zn(AC)2 | CeCl2 | NaOH | Preciptation/impregnation | [69] |
| 10 | Zn(OAc)2 | Ce(CH3CO2) | Etanolamine | Sol–Gel | [70] |
| Catalyst | Concentration (g/L) | pH | TCS (ppm) | Conversion (%) | TOC (%) | Time (min) | Power (W) | Ref. |
|---|---|---|---|---|---|---|---|---|
| ZnO/Ca | 0.3 | 10 | 10 | 99 | − | 200 | 125 | [51] |
| ZnO | 3.33 | − | 39 | − | 52 | 160 | 18 | [86] |
| ZnO | 1 | 7 | 5 | 25 | − | 360 | 4 | [87] |
| CeO2 | 0.5 | 7 | − | 88 | − | 45 | 120 | [88] |
| Nanorods g-C3N4 | 0.5 | 7 | 10 | 50 | − | 90 | 125 | [89] |
| g−C3N4/MnFe2O4 | 0.2 | 9 | 9 | 93 | 44 | 60 | − | [90] |
| Model | R2 | SS | dF | MS | F | p-Value |
|---|---|---|---|---|---|---|
| Lineal | 0.046 | 316.77 | 2 | 158.39 | 0.1684 | 0.8484 |
| Quadratic | 0.907 | 6261 | 5 | 1252 | 7.83 | 0.035 |
| Cubic | 0.941 | 6494 | 6 | 1082 | 7.96 | 0.058 |
| Factor | Coeff. | Std. Err | T-Statistic | p-Value |
|---|---|---|---|---|
| Urea (A) | 28.61 | 11.26 | 2.54 | 0.084 |
| Zinc Nitrate (B) | 8.35 | 11.26 | 0.74 | 0.52 |
| Cerium Nitrate (C) | 13.89 | 11.26 | 1.23 | 0.31 |
| AB | 53.93 | 56.71 | 0.95 | 0.41 |
| AC | 181.02 | 56.71 | 3.19 | 0.049 |
| BC | 228.47 | 56.71 | 4.02 | 0.027 |
| ABC | 498.18 | 373.88 | 1.31 | 0.282 |
Publisher’s Note: MDPI stays neutral with regard to jurisdictional claims in published maps and institutional affiliations. |
© 2022 by the authors. Licensee MDPI, Basel, Switzerland. This article is an open access article distributed under the terms and conditions of the Creative Commons Attribution (CC BY) license (https://creativecommons.org/licenses/by/4.0/).
Share and Cite
Cáceres-Hernández, A.; Torres-Torres, J.G.; Silahua-Pavón, A.; Godavarthi, S.; García-Zaleta, D.; Saavedra-Díaz, R.O.; Tavares-Figueiredo, R.; Cervantes-Uribe, A. Facile Synthesis of ZnO-CeO2 Heterojunction by Mixture Design and Its Application in Triclosan Degradation: Effect of Urea. Nanomaterials 2022, 12, 1969. https://doi.org/10.3390/nano12121969
Cáceres-Hernández A, Torres-Torres JG, Silahua-Pavón A, Godavarthi S, García-Zaleta D, Saavedra-Díaz RO, Tavares-Figueiredo R, Cervantes-Uribe A. Facile Synthesis of ZnO-CeO2 Heterojunction by Mixture Design and Its Application in Triclosan Degradation: Effect of Urea. Nanomaterials. 2022; 12(12):1969. https://doi.org/10.3390/nano12121969
Chicago/Turabian StyleCáceres-Hernández, Antonia, Jose Gilberto Torres-Torres, Adib Silahua-Pavón, Srinivas Godavarthi, David García-Zaleta, Rafael Omar Saavedra-Díaz, Renan Tavares-Figueiredo, and Adrián Cervantes-Uribe. 2022. "Facile Synthesis of ZnO-CeO2 Heterojunction by Mixture Design and Its Application in Triclosan Degradation: Effect of Urea" Nanomaterials 12, no. 12: 1969. https://doi.org/10.3390/nano12121969