Article

Investigation of the Ergopeptide Epimerization Process

1
Konrad-Zuse-Zentrum f¨ur Informationstechnik Berlin, Takustr. 7, 14195 Berlin, Germany
2
BAM Federal Institute for Materials Research and Testing, Richard-Willstätter-Str. 11, 1248 Berlin, Germany
*
Author to whom correspondence should be addressed.
Computation 2014, 2(3), 102-111; https://doi.org/10.3390/computation2030102
Submission received: 16 August 2013 / Revised: 10 July 2014 / Accepted: 22 July 2014 / Published: 8 August 2014
(This article belongs to the Section Computational Chemistry)

Abstract

:
Ergopeptides, like ergocornine and α-ergocryptine, exist in an S- and in an R-configuration. Kinetic experiments imply that certain configurations are preferred depending on the solvent. The experimental methods are explained in this article. Furthermore, computational methods are used to understand this configurational preference. Standard quantum chemical methods can predict the favored configurations by using minimum energy calculations on the potential energy landscape. However, the explicit role of the solvent is not revealed by this type of methods. In order to better understand its influence, classical mechanical molecular simulations are applied. It appears from our research that “folding” the ergopeptide molecules into an intermediate state (between the S- and the R-configuration) is mechanically hindered for the preferred configurations.

Graphical Abstract

1. Introduction

Ergopeptides are alkaloids which can be found in fungi like Claviceps purpurea. When consumed in larger doses this causes ergotism, inducing a type of gangrene especially in the extremities [1]. Clinically they are also used in the treatment of certain cases of neurological disorders like Migraine and Parkinson’s disease [2]. In the creation of ergopeptides a tripeptide structure is connected to a ergoline ring with the aid of several enzymes [3].
We examine two chemical agents of the group of ergopeptides, ergocornine and α-ergocryptine which differ in their residues R 1 and R 2 (cf. Figure 1). For both ergopeptides, two stereoisomers (R and S) exist related to the absolute configuration of the C X as sketched in Figure 1. The chirality of the C X determines the toxicity of the two ergotamines ergocornine and α-ergocryptine. The R-epimer is toxic whereas the S-epimer is inactive. We give a possible explanation for the different chemical and physical behavior of the compounds by taking advantage of quantum chemical as well as of classical simulation methods. Our investigations are supplemented by results from laboratory experiments which confirm the simulated details.
Figure 1. Basic structure of the ergotalkaloid. Correct substitution of R 1 and R 2 yield the ergopeptides ergocornine and α-ergocryptine (see Figure 2).
Computation 02 00102 g001
Figure 2. The left column shows the substitutions for R 1 , the right column shows the substitutions for R 2 .
Computation 02 00102 g002

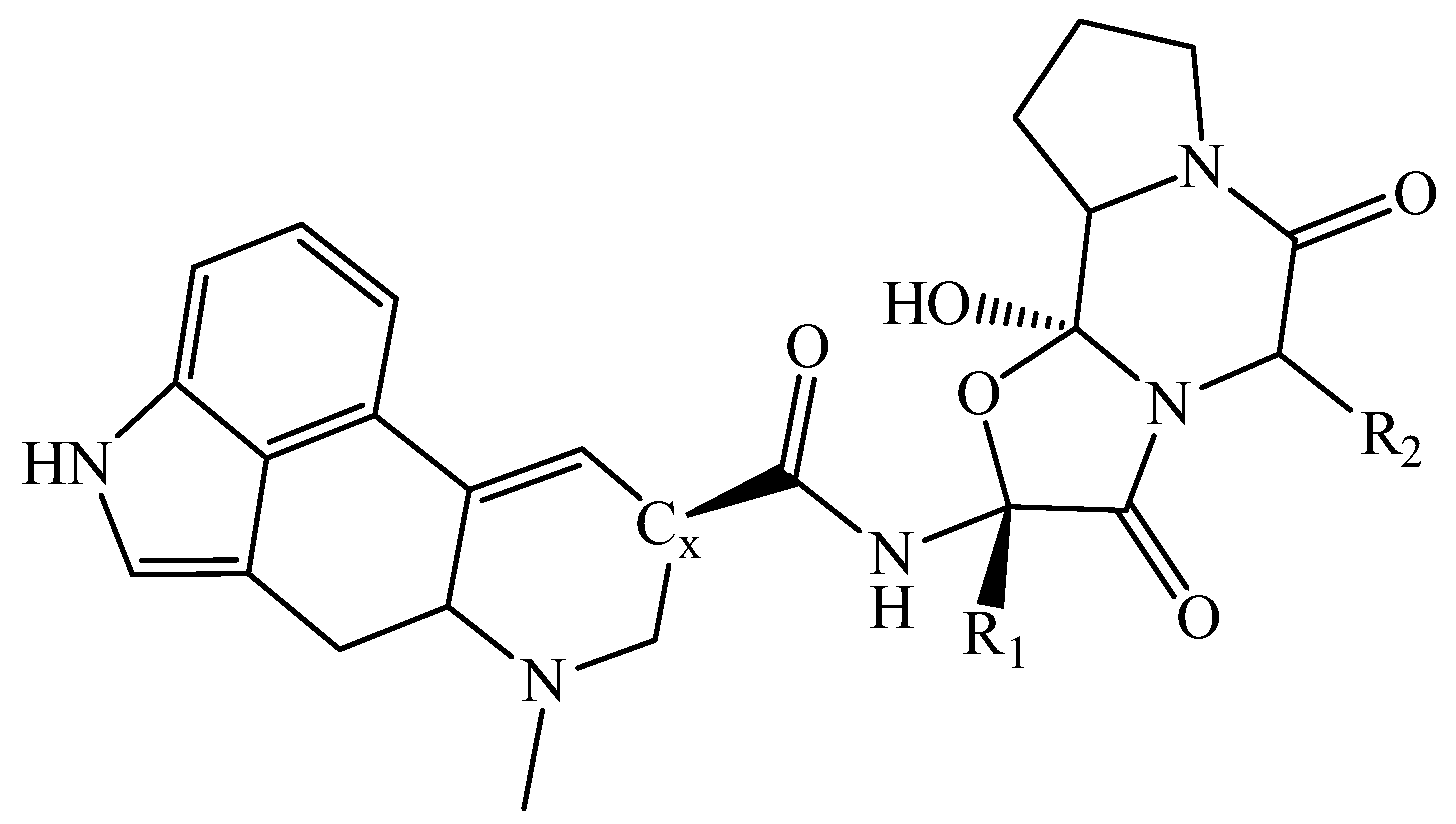
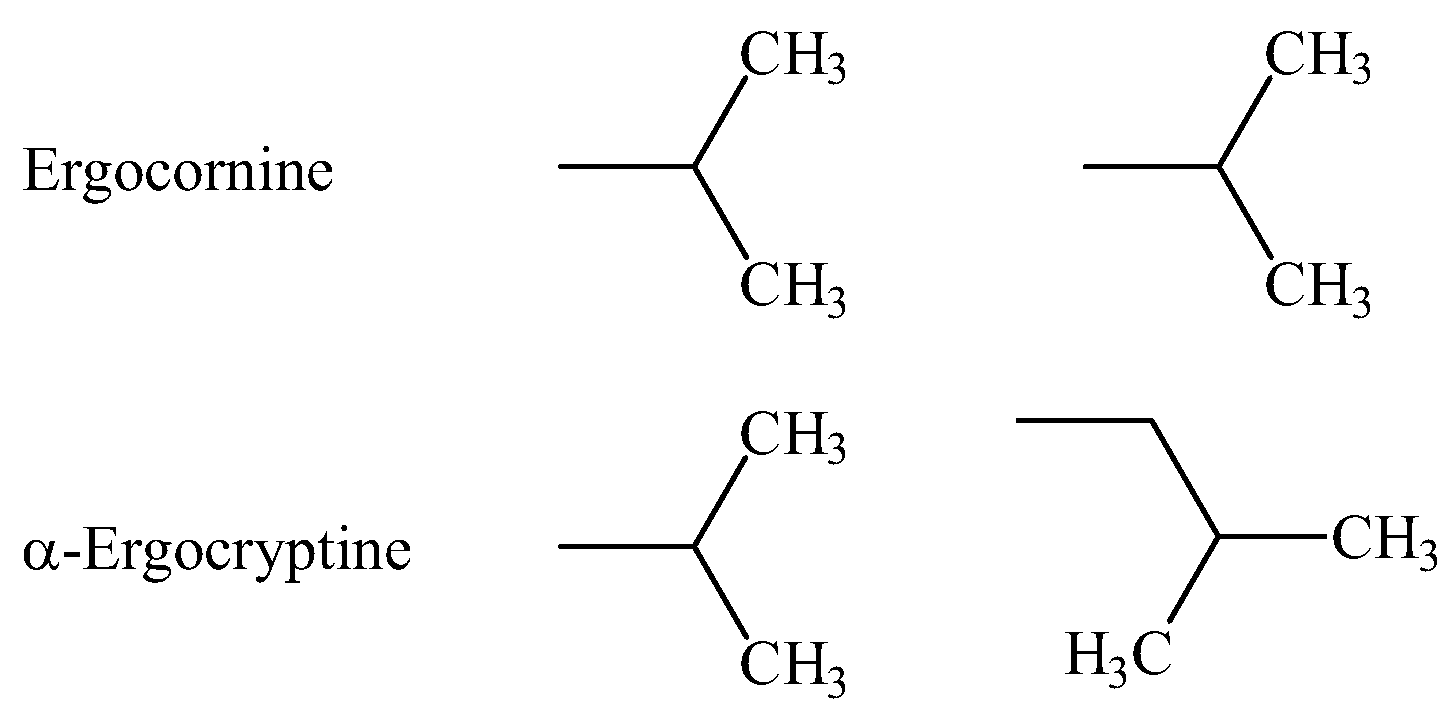
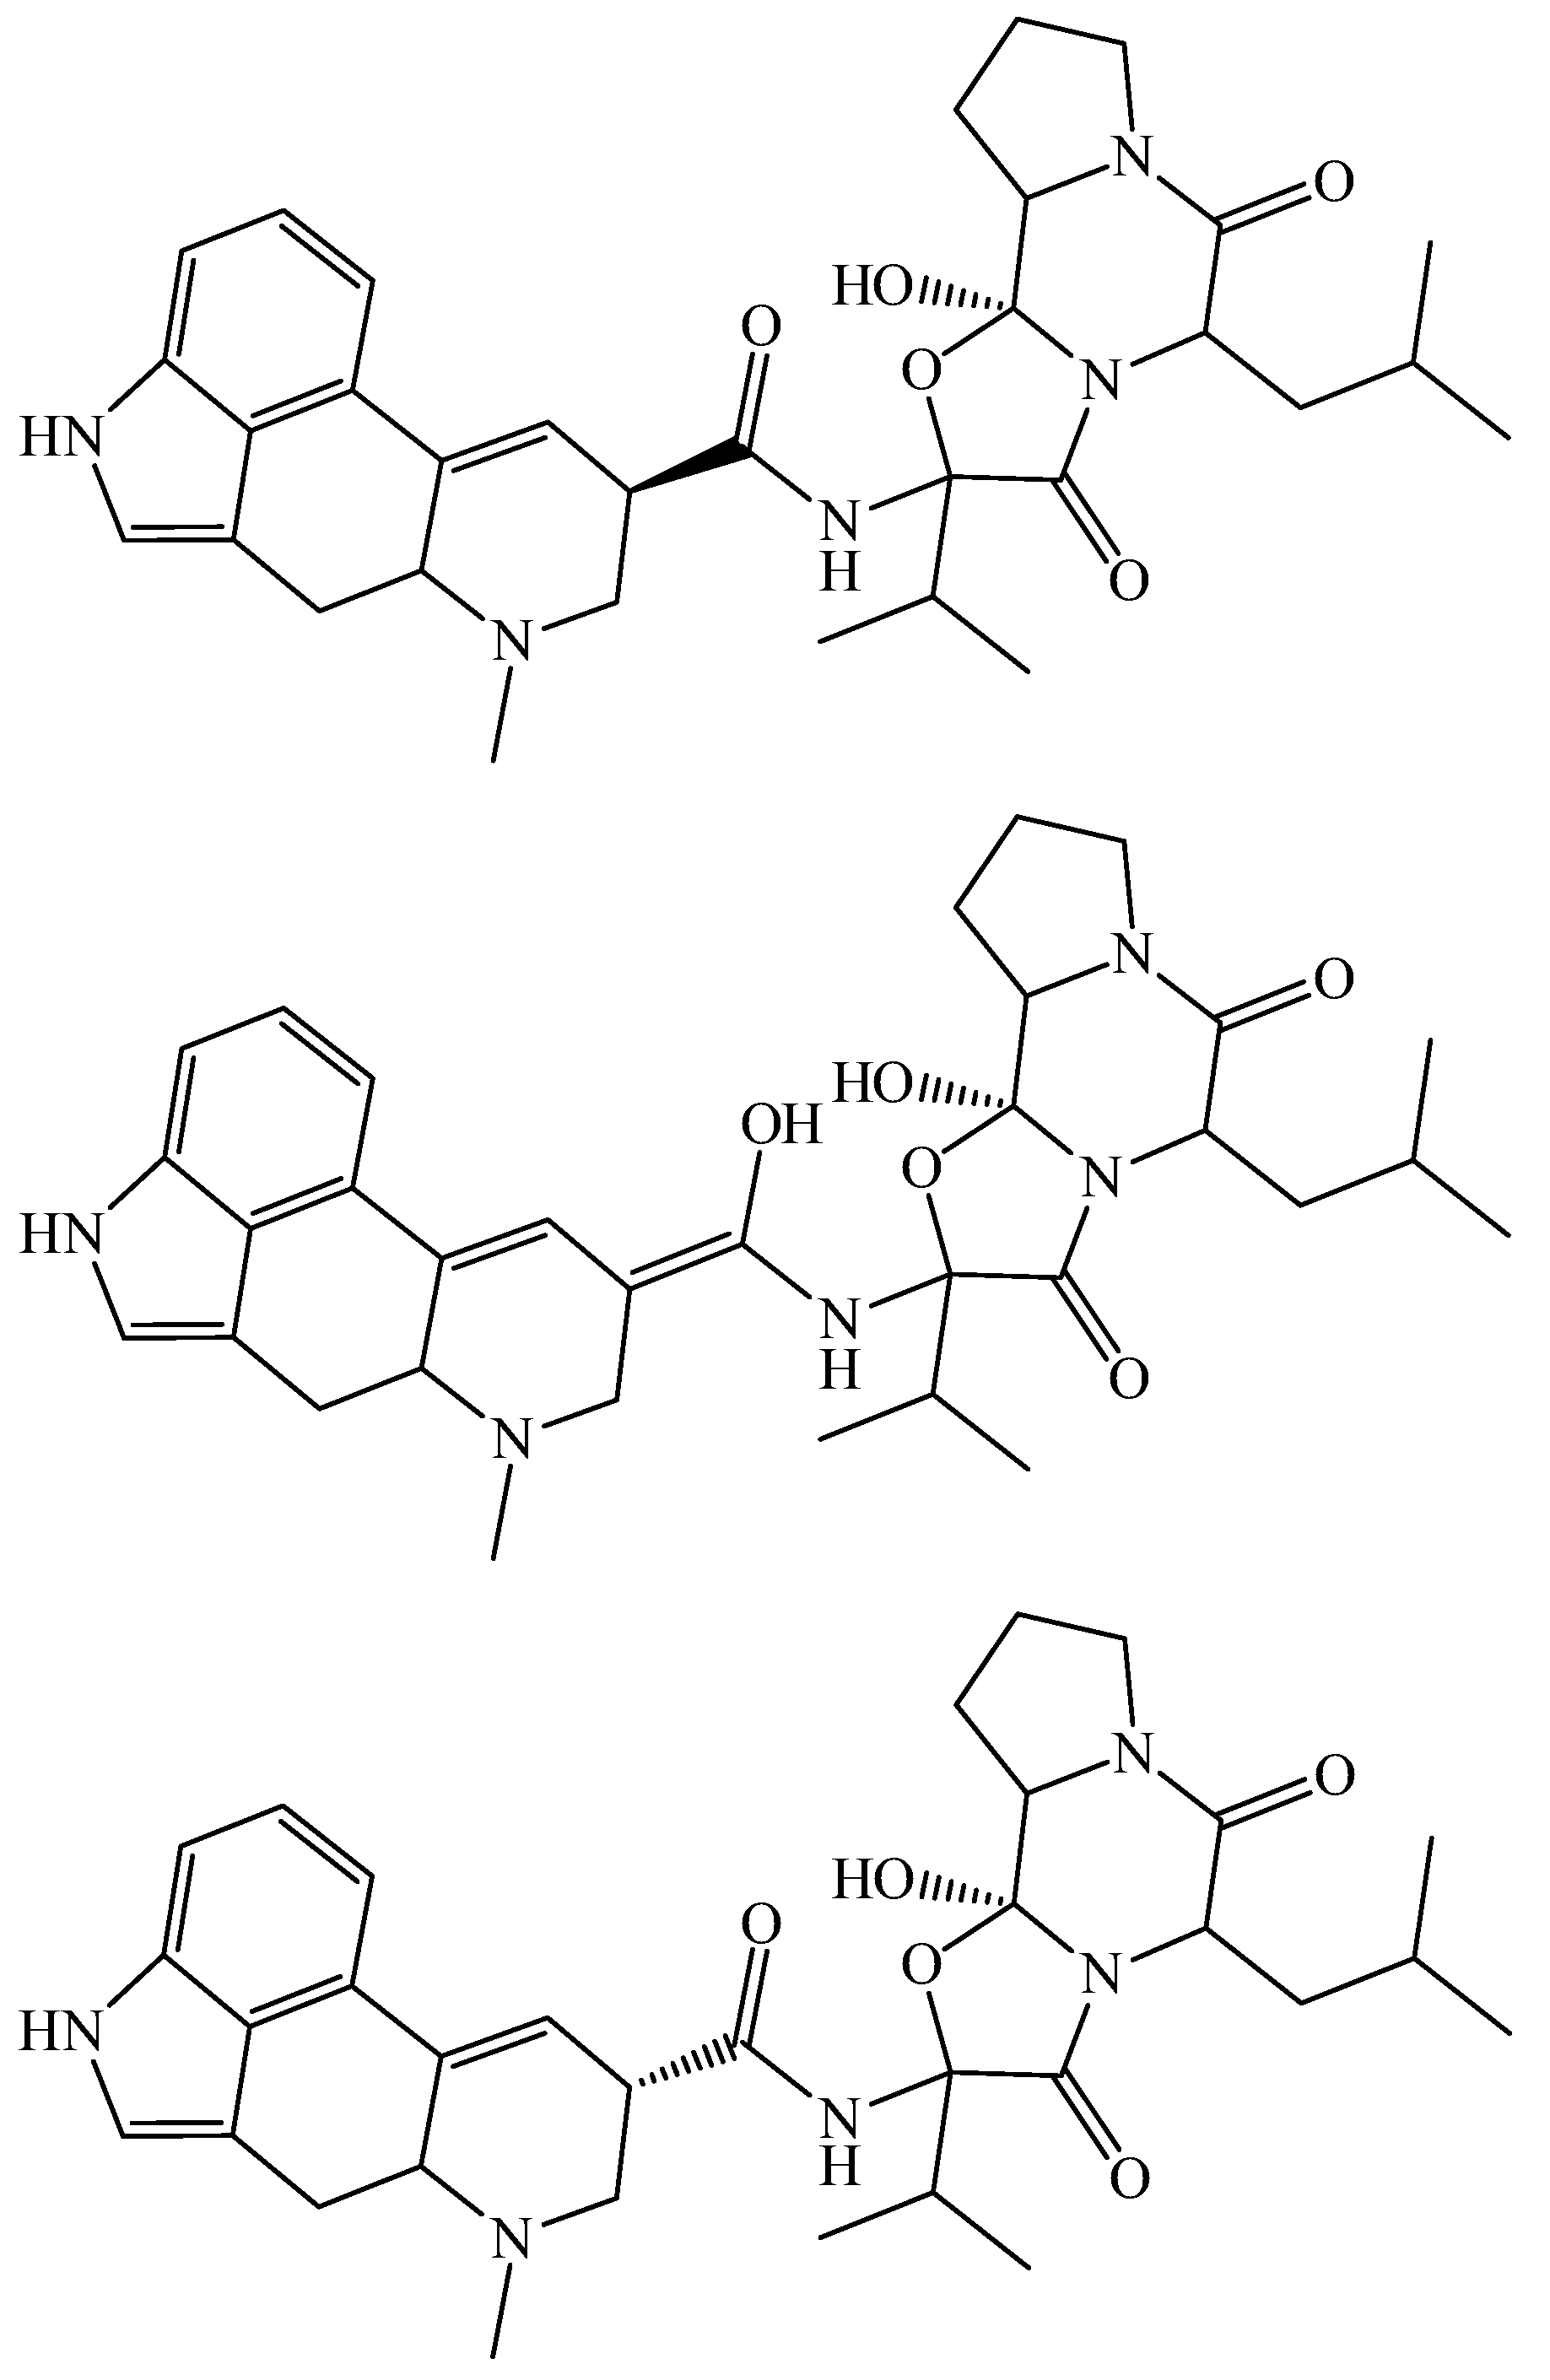
2. Quantum Chemical and Classical Simulation of Ergopeptides

We performed molecular simulations of the two chemical agents. In order to calculate the Gibbs free energy differences Δ G between R and S, the total transition path of one epimer into another has to be incorporated into a model Hamiltonian [4,5,6]. This can only be done by considering the full quantum-chemical nature of the underlying process. With an alternative procedure, derived by Weber et al. [7], we get a more qualitative picture of the free energy difference.
In order to interconvert between the R- and S-epimer, the molecule has to attain a certain intermediate conformation, in which bond breaking and epimerisation can take place. This state IT is denoted as an enol-intermediate. For a “normal" keto-enol tautomerism (e.g., acetone) the enol form is obviously not a transition state. In the case of ergopeptides, two keto forms (R- and S-epimer) exist, which can be converted into each other. In our opinion, it is therefore valid to regard the enol form as an intermediate state. It is known from literature, that the chemical equilibrium of “normal" keto-enol tautomers can shift but usually, the keto form is heavily favored. In HPLC (High-performance liquid chromatography) measurements of ergopeptides, the enol form could never been observed. An enol form would be separated (if present) from the R- and S-epimer due to conformational differences. That experimental finding could be interpreted as a transition state of the enol form. However, since this state has a potential minimum we consider the enol as an intermediate (see Figure 3).
Figure 3. Different stereoisomeric forms of R- and S-α-ergocryptin and the intermediate IT (R top, IT middle, S bottom).
Computation 02 00102 g003
For a better understanding of the molecule’s behavior its conformational space has to be examined [8]. Since molecular dynamics (MD) simulations are known for trapping effects, the molecules underwent a high-temperature Hybrid Monte-Carlo (HMC) [9] simulation phase in order to overcome energetic barriers [10]. After parameterization of all molecules according to the Merck molecular force field [11] (MMFF), five Markov chains with 100,000 states each were generated applying the HMC method at an artificially high temperature of 1200 K in order to efficiently sample the conformational space. Each HMC step included 30 MD steps with a 1.3 fs step size. Convergence of the simulation was checked according to Gelman and Rubin [12] on the basis of the five Markov chains. Afterwards, all geometries were minimized with the conjugate gradient method [13,14] and the lowest energy geometry was chosen as an estimate for the global minimum conformation. As described in Durmaz et al. [15], this strategy seems to provide realistic global minima conformations for small molecules. This conformer was then parameterized according to the general Amber force field [16] (GAFF) using Antechamber from the AmberTools v1.4 package [17]. Charges were assigned with the am1bcc method [18,19] approximating restrained electrostatic potential charges [20]. Each ergopeptide molecule was placed in a box filled with different solvents. To ascertain the influence of the solvent we studied simulations with two different types of solvent, i.e., water [21] and acetonitrile [22].
After having set up the molecular systems with periodic boundary conditions each consisting of one ergopeptide surrounded by solvent molecules using the Gromacs v4.5.4 simulation package [23,24,25], the MD simulation was performed in three major steps: Initially, the system underwent a steepest descent energy minimization phase with either 7000 steps or less if the maximum force acting on any atom yielded a value below 30 kJ mol - 1 nm - 1 . During a subsequent 200 ps equilibration phase, all but the solvent atoms were positionally restrained and the pressure was coupled weakly in accordance with Berendsen’s algorithm [26]. The production run yielded a 500 ps trajectory without position restraints but with constraints on all bonds according to the LINCS approach [27] which allows to increase the discretized time step to 2 fs. The simulation temperature was coupled to 298 K by stochastically rescaling atomic velocities [28]. Energies related to van der Waals and electronic interactions between the ergopeptide and solvent molecules were computed on the basis of smooth particle mesh Ewald summation [29] for the coulomb potential with a cutoff value of 10 Å and a van der Waals cutoff set to 14 Å, respectively.
Exact potential energies were calculated using the B3LYP-based Density Functional Theory (DFT) approach employing the 6-311G basis set as implemented in GAUSSIAN03 program [30]. Frequency calculations were carried out at the same level of theory in order to confirm that the optimized structures were at the minimum of the potential energy surface.
According to the quantum chemical calculations, the S-epimer of ergocornine is 0 . 02 a. u. or 12 . 55 kJ mol - 1 lower in energy than the R-epimer (cf. Table 1). This observation strongly confirms experimental results as presented in Section 3 where the S-epimer only slightly dominates the equilibrium distribution with a fraction of about 60 % . This difference is still more pronounced than in case of α-ergocryptine where the experiment reveals about equal fractions of both epimers. In accordance with that observation, the potential energy differnce of α-ergocryptine epimers computed quantum-chemically amounts to 0 . 01 a.u. or 6 . 31 kJ mol - 1 only. Or, in other words, the preference for one certain epimer (which is the S-form) is more distinctive in case of ergocornine regarding experimental as well as computational results. From our current point of view, the pure treatment of potential energies is partially suitable for a concise interpretation of the experimental data. Section 3 describes in more detail how the rate and equilibrium constants (Equation (4)) were derived from the measured data depicted as spots in Figure 4. Equilibrium constants K close to 1 are associated with similar fractions of the epimers at chemical equilibrium. On the basis of the simulation data, no equilibrium constants have been calculated since we do not have any structural information about the real transition state and, thus, no value of the activation energy.
Table 1. The minimum of the quantum chemical potential energy E m i n of the epimers α-ergocryptine and ergocornine in the implicit solvent water expressed using atomic units.
EpimersEnergy in a.u.
R-α-ergocryptine−1893.9465
R-ergocornine−1854.6201
S-α-ergocryptine−1893.9364
S-ergocornine−1854.6401
I-α-ergocryptine−1893.9113
I-ergocornine−1854.5965
Figure 4. Change in ratio of R-epimer to sum of both epimers in a 1:4 (volume fraction) acetonitrile water mixture containing 10 mM ammonium carbamate.
Computation 02 00102 g004
Solvent effects were included by employing classical MD simulations with an explicit treatment of water and acetonitrile molecules, respectively, as described above. For both solvents, Table 2 shows the time-averaged torsional angles ϕ along with their variances spanned by the nitrogen atom, the keto carbon, the carbon atom C X and its adjacent sp2-hybridized ring carbon (see Figure 1). Using these torsional angles and taking the enol form as a basis for the epimerization process, we estimated the conformational distance of both R and S-epimer to the intermediate enol form as sketched in Figure 3. Theoretically, this torsional angle is supposed to have about ϕ 180 (or, alternatively, ϕ 0 ), however, in our simulations, ϕ 170 every pairwise combination of a solvent with an ergo peptide except for α-ergocryptine in acetonitrile. In all other (regular) cases, the R-epimer has a smaller torsional distance (about 30– 40 ) to the enol form than the S-epimer (about 65 ). In addition, the torsional variances of the R-epimers, in particular in case of ergocornine, are significantly larger than those of the S-epimers.
Table 2. The dihedral angle ϕ is defined by the three chemical bond vectors, consisting of the following four atoms: the nitrogen atom, the keto carbon, the carbon atom C X and its adjacent sp2-hybridized ring carbon (cf. Figure 1). The mean angle ϕ and its variance Var ( ϕ ) are determined once in each of the solvents water and acetonitrile (ACN).
ErgotalkaloidWater ACN
ϕVar ( ϕ ) ϕVar ( ϕ )
R-α-ergocryptine139.79.7 142.78.3
R-ergocornine134.316.7 129.821.1
S-α-ergocryptine105.96.2 76.16.0
S-ergocornine105.76.5 106.56.3
I-α-ergocryptine169.67.9 103.54.3
I-ergocornine168.08.8 170.07.5
These results reveal a preference of the transition from the R to the S epimer due to sterical reasons whereas the opposite transition appears to be disadvantaged. The R-epimer is supposed to epimerize easier since it is much closer to a flat (i.e., the intermediate) structure and due to a higher variance regarding the crucial torsional angle. Moreover, the geometries of the conformations showed that the spatial arrangement of the IT-epimer is similar to the geometry of the R-epimer. Thus, the S-epimer has to undergo a more complex spatial rearrangement in order to yield the IT-epimer than the R-epimer does.

3. Laboratory Experiments

3.1. Experimental Procedure

For both peptide ergot alkaloids, ergocornine and α-ergocryptine, the epimerization kinetcs as well as the ratio of R- and S-epimers at thermodynamic equilibrium have been investigated experimentally. Both compounds were dissolved in two different solvent mixtures containing (i) acetonitrile:water +10 mM ammonium carbamate (1:4, v:v) [31] and (ii) acetonitrile:water +200 mg/L - 1 ammonium carbamate (1:1, v:v) [32] which has been proved suitable for the extraction of ergot alkaloids from rye flour or as solvent for storage of sample extracts. The ergot alkaloid content of both epimers was measured over a time period of 173 h at 39 equally distributed sampling points for each solvent mixture (Figure 4) using high performance liquid chromatography (HPLC) combined with a fluorescence detector exciting at 330 nm wave length and emitting at 415 nm. For further details of the experimental setup, please refer to the Section 3.3.

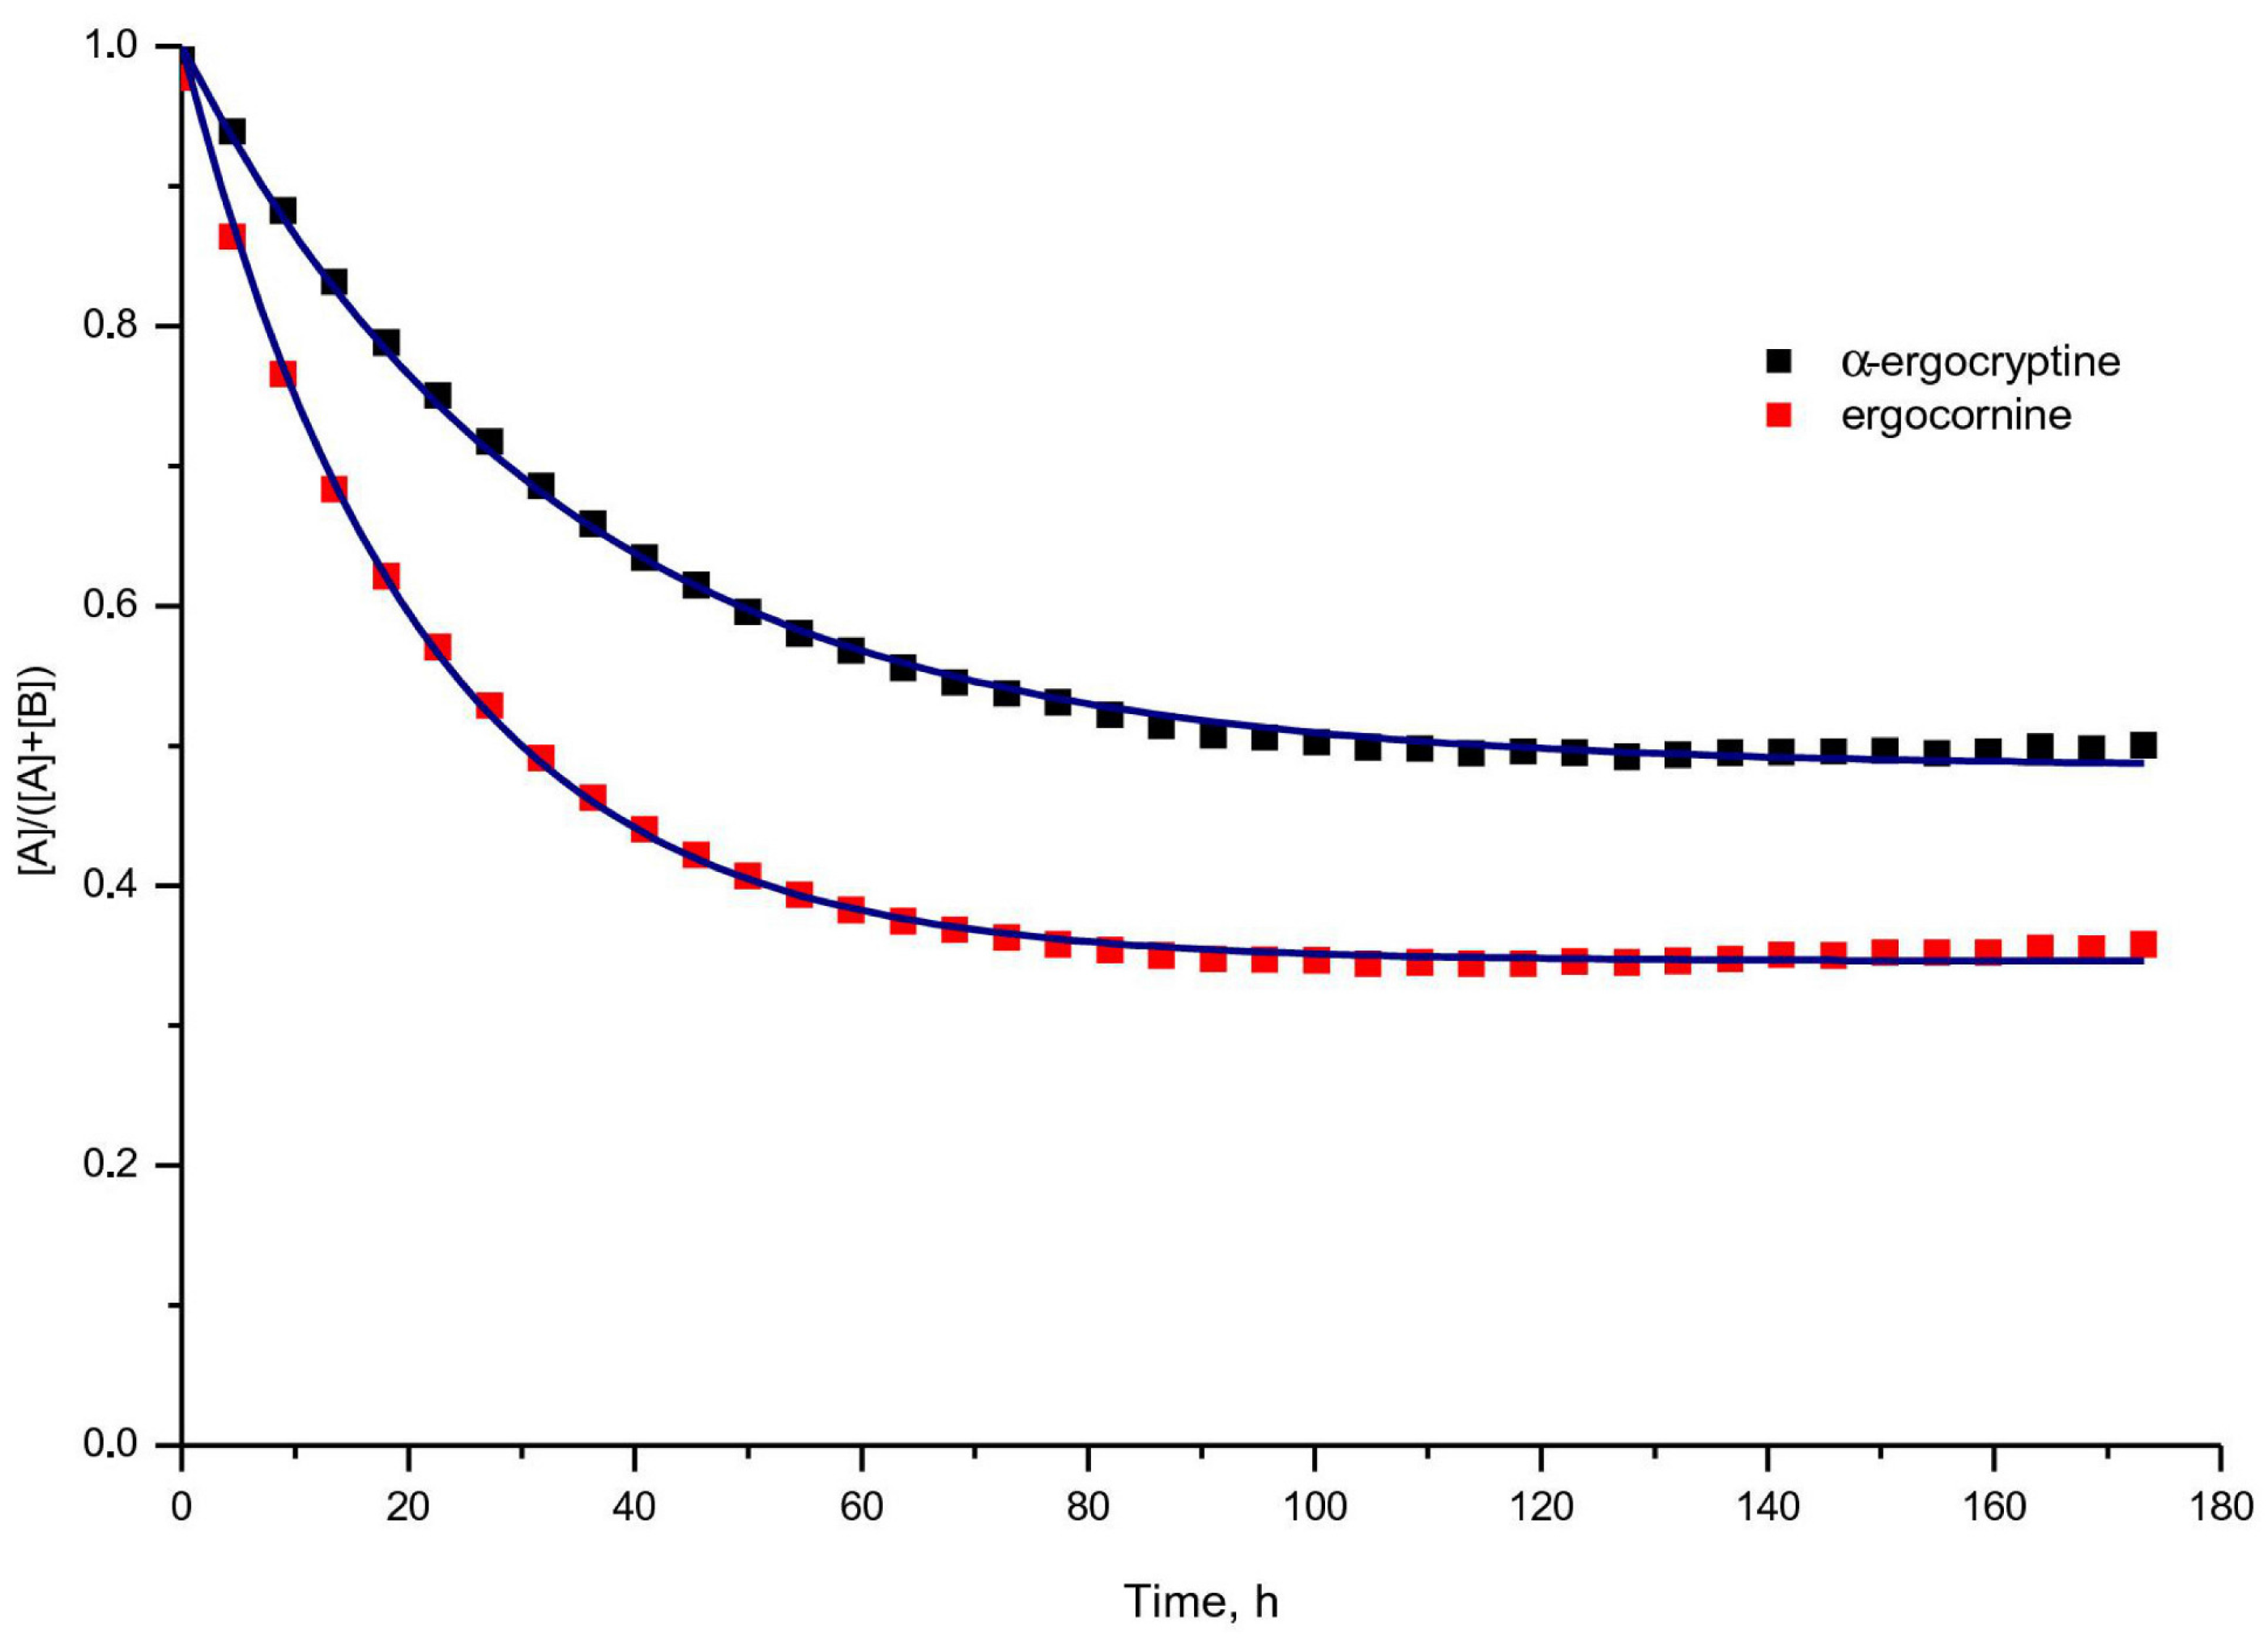
3.2. Standard Kinetic Analysis

The data gained from the experimental measurements allowed the calculation of the reaction rate constants k and k for forward and backward reaction, respectively, of the epimerization
R - epimer k k S - epimer
At the beginning of the reaction ( t = 0 ), only the R-epimer A was present in the solvent mixture and no S-epimer B, [ A ] + [ B ] = [ A 0 ] , leading to the differential equation for the epimerization reaction:
d A d t = - k [ A ] + k ( [ A 0 ] - [ A ] ) = - ( k + k ) [ A ] + k [ A 0 ]
The solution for the differential equation is
[ A ] = k + k e - ( k + k ) t k + k [ A 0 ]
The reaction rate constants k and k were determined iteratively. Afterwards, the equilibrium constant K was calculated by
K = [ B ] [ A ] = k k
Table Table 3 shows the experimental results. For every pairwise combination of an ergot alkaloid with a solvent mixture, the equilibrium is shifted towards the S-epimer, K > 1 .
Table 3. Kinetic parameters for α-ergocryptine and ergocornine in solvent mixtures i, ii.
Solvent MixtureErgot Alkaloidk,10 3 h - 1 k’,10 3 h - 1 K R 2 Fit-Function
iα-ergo-cryptine15.67 ± 0.1614.75 ± 0.221.06 ± 0.020.9982
ergo-cornine31.54 ± 0.3116.70 ± 0.231.89 ± 0.030.9983
iiα-ergo-cryptine1.64 ± 0.010.58 ± 0.072.83 ± 0.340.9997
ergo-cornine3.70 ± 0.072.20 ± 0.251.68 ± 0.190.9959
The best least-squares fit to the measurement points sketched in Figure 4 was achieved when taking a first order kinetics as a basis (Equations (2) and (3)). This is a valid approach if we bear in mind that the hydrogen for the enol form of the respective oxygen may originate either from the epimer itself which provides several polar hydrogens among unpolar ones, from the HPLC additive ammonium carbamate or from the solvent, or from some combination. Due to the excellent fit of an first order rate equation to the measurements, we tend to exclude ammonium carbamate as well as a second ergot alkaloid molecule. Since the solvent is ubiquitary, its concentration is not decisive for the tautomerism and epimerism process supporting a first order kinetics model. Hence, it must be considered as a hydrogen donator just as the affected ergot alkaloid itself due also to a internal mechanism supporting the first order model.

3.3. Experimental Setting

All solvents were of high-performance liquid chromatography gradient grade. Ammonium carbamate (ABCR, Karlsruhe, Germany), ammonium formate (Sigma-Aldrich, Steinheim, Germany) and ammonium carbonate (Merck, Darmstadt, Germany) were of analytical reagent grade. Ultrapure water was obtained from a Seralpur PRO 90CN system (Seral, Ransbach-Baumbach, Germany). Ergot alkaloids were obtained from Alfarma s.r.o. (Cerošice, Czech Republic). For all experiments both epimers of ergocornine and α-ergocryptine were dissolved and diluted in acetonitrile resulting in stock solutions with a content of 500 μg kg - 1 , respectively. All solutions were prepared gravimetrically. Aliquots of these solutions (R-epimers only) were evaporated to dryness and redissolved in solvent mixtures i, ii, respectively (see Table 3). Quantification of both epimeric forms was done via an external six-point calibration curve. Instrumental measurements were performed using an Agilent 1200 Series HPLC equipped with a degasser, binary pump, column oven (thermostatic at 30 C ), diode array detector, and fluorescence detector set at λ = 330 nm (excitation) and λ = 415 nm (emission). A Phenomenex Gemini C18 column (2.1 × 150 mm, 3 μm particle size) was used including a Gemini C18 guard column (4 × 2 mm, 3 μm particle size). The chromatographic parameters were as follows: solvent A: water modified with 200 mg L - 1 ammonium carbonate and solvent B: acetonitrile. The flow rate was 0.3 mL min - 1 . The following linear gradient was used: 15% to 36% B 0–4 min, 46% to 60% B 4–20 min, 60% to 100% B 20–22 min, 100% B 22–30 min, and 15% B for 10 min (re-equilibration). The total runtime was 40 min. The injection volume was 10 μL. For determination of kinetic parameters k and k Origin 8.5 software (OriginLab Corporation, Northampton, MA, USA) was used.

4. Conclusions

We examined the epimerization process of two peptide ergot alkaloids, ergocornine and α-ergocryptine, using quantum chemical and classical simulation methods and compared the results to experimental kinetcs and the equilibrium distribution of R and S-epimers.
According to the quantum chemical calculations, the preference for the S-epimer is more distinctive in case of ergocornine regarding confirming experimental results. The smaller potential energy difference between R and S in case of α-ergocryptine supports the balanced distribution of its epimers.
From the classical explicit solvent simulations of both epimers and of an intermediate state that we assumed to be an enol form, we extracted a geometrical observable regarding the torsional angle distance of the epimers from the intermediate state. For ergocornine, this observable’s average and variance is in good qualitative agreement with the experimentally measured equilibrium distribution since we expect a higher sterical hindrance for the epimerization given a larger torsional distance. For α-ergocryptine, the computational result does not correlate with the experimental observation.
Even today and despite the available computational power and the sophisticated mathematical and algorithmic models, we observe a couple of discrepancies between simulational and experimental results. There are many possible sources of errors such as the choice of a suitable basis set for quantum chemical calculations or empirical force fields that are fit to certain molecular systems on the computational side and the model-based least-squares fit on the experimental side.

Author Contributions

Andrae: Abstract and Section 2. (quantum chemical results); Merkel: Section 3. (laboratory experiments: experimental procedure, experimental setting); Durmaz: Conclusion and Section 2. (classical simulation of ergopeptides); Fackeldey: Section 2. (quantum chemical simulations); Köppen: Section 3: (laboratory experiments: standard kinetic analysis); Weber: Section 2. (geometric results); Koch: Section 1. (introduction).

Conflicts of Interest

The authors declare no conflicts of interest.

References

  1. Richards, I.S. Principles and Practice of Toxicology in Public Health; Jones & Bartlett: Sudbury, MA, USA, 2008; p. 64. [Google Scholar]
  2. Lüllmann, H.; Mohr, K.; Hein, L. Pharmakologie und Toxikologie; Thieme: Stuttgart, Germany, 2006; p. 283. [Google Scholar]
  3. Schardl, C.L.; Panaccione, D.G.; Tudzynski, P. Ergot alkaloids–biology and molecular biology. Alkaloids: Chem. Biol. 2006, 63, 45–86. [Google Scholar]
  4. Christ, C.D.; Mark, A.E.; van Gunsteren, W.F. Basic ingredients of free energy calculations: A review. J. Comput. Chem. 2010, 31, 1569–1582. [Google Scholar] [CrossRef] [PubMed]
  5. Pohorille, A.; Jarzynski, C.; Chipot, C. Good Practices in Free-Energy Calculations. J. Phys. Chem. B 2010, 114, 10235–10253. [Google Scholar] [CrossRef] [PubMed]
  6. Villa, A.; Mark, A.E. Calculation of the free energy of solvation for neutral analogs of amino acid side chains. J. Comput. Chem. 2002, 23, 548–553. [Google Scholar] [CrossRef] [PubMed]
  7. Weber, M.; Becker, R.; Köppen, R.; Durmaz, V. Classical hybrid Monte-Carlo simulations of the interconversion of hexabromocyclododecane. J. Mol. Simul. 2008, 34, 727–736. [Google Scholar] [CrossRef]
  8. Kriegl, J.M.; Nienhaus, K.; Deng, P.; Fuchs, J.; Nienhaus, G.U. Ligand Dynamics in a Protein Internal Cavity. Proc. Natl. Acad. Sci. USA 2003, 100, 7069–7074. [Google Scholar] [CrossRef] [PubMed]
  9. Duane, S.; Kennedy, A.D.; Pendleton, B.J.; Roweth, D. Hybrid Monte Carlo. Phys. Lett. B 1987, 195, 216–222. [Google Scholar] [CrossRef]
  10. Brass, A.; Pendleton, B.J.; Chen, Y.; Robson, B. Hybrid Monte Carlo Simulations Theory and Initial Comparison with Molecular Dynamics. Biopolymers 1993, 33, 1307–1315. [Google Scholar] [CrossRef]
  11. Halgren, T.A. Merck Molecular Force Field: I–V. J. Comp. Chem. 1996, 17, 490–641. [Google Scholar] [CrossRef]
  12. Gelman, A.; Rubin, D. Inference from Iterative Simulation using Multiple Sequences. Statist. Sci. 1992, 7, 457–511. [Google Scholar] [CrossRef]
  13. Hestenes, M.R.; Stiefel, E. Methods of Conjugate Gradients for Solving Linear Systems. J. Res. Nat. Bur. Stand. 1952, 49, 409–436. [Google Scholar] [CrossRef]
  14. Fletcher, R.; Reeves, C.M. Function minimization by conjugate gradients. Comput. J. 1962, 7, 149–154. [Google Scholar] [CrossRef]
  15. Durmaz, V.; Becker, R.; Weber, M. How to Simulate Affinities for Host-Guest Systems Lacking Binding Mode Information: Application in the Liquid Chromatographic Separation of Hexabromocyclododecane Stereoisomers. J. Mol. Model. 2012, 18, 2399–2408. [Google Scholar] [CrossRef] [PubMed]
  16. Wang, J.; Wolf, R.M.; Caldwell, J.W.; Kollman, P.A.; Case, D.A. Development and Testing of a General Amber Force Field. J. Comput. Chem. 2004, 25, 1157–1174. [Google Scholar] [CrossRef] [PubMed]
  17. Wang, J.; Wang, W.; Kollman, P.A.; Case, D.A. Automatic atom type and bond type perception in molecular mechanical calculations. J. Mol. Graphics Model. 2006, 25, 247–260. [Google Scholar] [CrossRef] [PubMed]
  18. Jakalian, A.; Bush, B.L.; Jack, D.B.; Bayly, C.I. Fast, Efficient Generation of High-Quality Atomic Charges. AM1-BCC Model: I. Method. J. Comput. Chem. 2000, 21, 132–146. [Google Scholar]
  19. Jakalian, A.; Jack, D.B.; Bayly, C.I. Fast, Efficient Generation of High-Quality Atomic Charges. AM1-BCC Model: II. Parameterization and Validation. J. Comput. Chem. 2002, 23, 1623–1641. [Google Scholar] [PubMed]
  20. Cornell, W.D.; Cieplak, P.; Bayly, C.I.; Kollman, P.A. Application of RESP Charges To Calculate Conformational Energies, Hydrogen Bond Energies, and Free Energies of Solvation. J. Am. Chem. Soc. 1993, 115, 9620–9631. [Google Scholar] [CrossRef]
  21. Horn, H.W.; Swope, W.C.; Pitera, J.W.; Madura, J.D.; Dick, T.J.; Hura, G.L.; Head-Gordon, T. Development of an improved four-site water model for biomolecular simulations: TIP4P-Ew. J. Chem. Phys. 2004, 120, 9665–9678. [Google Scholar] [CrossRef] [PubMed]
  22. Nikitin, A.M.; Lyubartsev, A.P. New Six-site Acetonitrile Model for Simulations of Liquid Acetonitrile and its Aqueous Mixtures. J. Comput. Chem. 2007, 28, 2020–2026. [Google Scholar] [CrossRef] [PubMed]
  23. Hess, B.; Kutzner, C.; van der Spoel, D.; Lindahl, E. GROMACS 4: Algorithms for Highly Efficient, Load-Balanced, and Scalable Molecular Simulation. J. Chem. Theory Comput. 2008, 4, 435–447. [Google Scholar] [CrossRef]
  24. Van der Spoel, D.; Lindahl, E.; Hess, B.; Groenhof, G.; Mark, A.E.; Berendsen, H.J.C. GROMACS: Fast, Flexible, and Free. J. Comput. Chem. 2005, 26, 1701–1718. [Google Scholar] [CrossRef] [PubMed]
  25. Berendsen, H.J.C.; van der Spoel, D.; van Drunen, R. GROMACS: A message-passing parallel molecular dynamics implementation. Comput. Phys. Commun. 1995, 91, 43–56. [Google Scholar] [CrossRef]
  26. Berendsen, H.J.C.; Postma, J.P.M.; van Gunsteren, W.F.; DiNola, A.; Haak, J.R. Molecular dynamics with coupling to an external bath. Comput. Phys. Commun. 1984, 81, 3684–3690. [Google Scholar] [CrossRef]
  27. Hess, B.; Bekker, H.; Berendsen, H.J.C.; Fraaije, J.G.E.M. LINCS: A Linear Constraint Solver for Molecular Simulations. J. Comput. Chem. 1997, 18, 1463–1472. [Google Scholar] [CrossRef]
  28. Bussi, G.; Donadio, D.; Parrinello, M. Canonical sampling through velocity rescaling. J. Chem. Phys. 2007, 126, 014101. [Google Scholar] [CrossRef] [PubMed]
  29. Essmann, U.; Perera, L.; Berkowitz, M.L. A smooth particle mesh Ewald method. J. Chem. Phys. 1995, 103, 8577–8592. [Google Scholar] [CrossRef]
  30. Frisch, M.J.; Trucks, G.W.; Schlegel, H.B.; Scuseria, G.E.; Robb, M.A.; Cheeseman, J.R.; Montgomery, J.A., Jr.; Vreven, T.; Kudin, K.N.; Burant, J.C.; et al. Gaussian 03, Revision C.02; Gaussian, Inc.: Wallingford, CT, USA, 2004. [Google Scholar]
  31. Storm, I.D.; Rasmussen, P.H.; Strobel, B.W.; Hansen, H.C.B. Ergot alkaloids in rye flour determined by solid-phase cation-exchange and high-pressure liquid chromatography with fluorescence detection. Food Addit. Contam. 2008, 25, 338–346. [Google Scholar] [CrossRef] [PubMed]
  32. Müller, C.; Klaffke, H.S.; Krauthause, W.; Wittkowski, R. Determination of ergot alkaloids in rye and rye flour. Mycotoxin Res. 2006, 22, 197–200. [Google Scholar] [CrossRef] [PubMed]

