
Modeling and Simulating an Epidemic in Two Dimensions with an Application Regarding COVID-19

Mathematics Department, College of Sciences and Arts, Northern Border University, Rafha 76316, Saudi Arabia
Computation 2024, 12(2), 34; https://doi.org/10.3390/computation12020034
Submission received: 17 January 2024
/
Revised: 1 February 2024
/
Accepted: 5 February 2024
/
Published: 12 February 2024
(This article belongs to the Special Issue Computational Approaches to Solving Differential Equations)
Abstract
:We derive a reaction–diffusion model with time-delayed nonlocal effects to study an epidemic’s spatial spread numerically. The model describes infected individuals in the latent period using a structured model with diffusion. The epidemic model assumes that infectious individuals are subject to containment measures. To simulate the model in two-dimensional space, we use the continuous Runge–Kutta method of the fourth order and the discrete Runge–Kutta method of the third order with six stages. The numerical results admit the existence of traveling wave solutions for the proposed model. We use the COVID-19 epidemic to conduct numerical experiments and investigate the minimal speed of spread of the traveling wave front. The minimal spreading speeds of COVID-19 are found and discussed. Also, we assess the power of containment measures to contain the epidemic. The results depict a clear drop in the spreading speed of the traveling wave front after applying containment measures to at-risk populations.
1. Introduction
Mathematical models have been extensively used in epidemiology, since they provide a clear understanding of the dynamical behavior of an epidemic; see, for example, [1,2,3,4,5,6,7,8,9,10]. The work by Alanazi et al. [1,2,3] proposed a model to study and analyze the disease of rabies; they compared the results to popular studies published about the disease and to the rabies epizootic that happened in Europe from 1940 to 1980. The most basic and classic models of epidemics are susceptible-infected-removed (SIR) models. For this kind of model, we refer to the study by Chekroun et al. [4]. In [4], the authors mathematically analyzed an SIR model, which transferred to a system of a reaction–diffusion equation and a Volterra integral equation. Epidemic models considering the infection age are typically systems of nonlinear differential equations. Modeling the infection age could lead to systems with time-delayed and nonlocal effects. For example, So et al. [11] formulated a model with a fixed maturation period. Then, the total number of mature populations can be obtained using a reaction–diffusion model with time-delayed nonlocal effects [11]. The literature is rich in mathematical models focusing on traveling wave solutions and their minimum speeds; for the readers, we choose the following studies: [6,8,12,13,14,15] and references therein.
Sometimes, containment measures should be applied to at-risk populations to avoid another wave of an epidemic or weaken the spreading virus. In the recent epidemic of COVID-19, for instance, several control measures have been applied to contain the disease [16,17,18,19,20]. For more studies about the COVID-19 epidemic, we refer the reader to [21,22,23,24,25,26,27,28,29,30,31].
This work aims to mathematically predict the spreading speeds of the traveling wave front. Also, we aim to assess the power of containment measures to contain the disease. We derive a new mathematical model with time-delayed and nonlocal effects to numerically study an epidemic’s spatial dynamics in two-dimensional space to reach these goals. We simulate the model on a bounded domain of and predict the minimal front wave spreading speeds to assess the power of containment measures to control the disease. The results are compared and discussed with the data reported by the National Health Commission of China and other available data in the literature.
The paper is organized as follows. In Section 2, the unbounded model with time-delayed and nonlocal effects is derived. To approximate the solution of the model, we consider a bounded domain of for discretization in space first, then in time (Section 3 and Section 4). To solve the ordinary differential equations in time, we use the continuous Runge–Kutta method of the fourth order and the discrete Runge–Kutta method of the third order with six stages (Section 4). This numerical method is proposed and discussed in [32,33,34]. In Section 5, we use the COVID-19 epidemic as an example to conduct the numerical experiment. The results are discussed in detail in Section 6, with remarks about the limitations of the proposed model and future studies.
2. Derivation of the Unbounded Model
The model assumes that individuals in the susceptible and infected stages can move and diffuse from one place to another. Also, the model assumes no natural deaths in the population. Furthermore, the model assumes that some infectious individuals who leave the incubation period are subject to containment measures with rate Applying the containment measures to all of the infectious population is not possible, so it is reasonable to assume Furthermore, we assume that the infectious time is a fixed constant, where .
Let x be the location in unbounded domain and t be the time. The density of susceptible individuals is , and the density of nonisolated infectious individuals is . Then, the model is defined as follows:
where and is the density of infected individuals with infection age , and it is described by the standard structured model with diffusion as follows:
In the model, and are the diffusion coefficients of susceptible, nonisolated infectious, and infected populations, respectively. is the disease transmission coefficient. The term is the mean length of the infectious period. is the death rate of the infected population. The force of containment measures is denoted by where
Next, we solve the system (2) for to find Let and ; see also [35]. Then, we have the following:
We solve the linear reaction–diffusion system (3) and obtain
where is the fundamental solution of Therefore, for and we obtain
Incorporating (4) into (1) leads to the following reaction–diffusion system with nonlocal delay:
where and We define the initial densities as follows:
where and In the next section, we will incorporate boundary conditions into the bounded model.
3. Spatial Discretization of the Bounded Model
Let Then, the model (6) takes the form
where and Here,
where is the Euclidean norm on and The initial densities are
where To numerically approximate the solution of (8)–(10), we assume with the following boundary conditions:
Let and where Let the spatial grids be defined as
where N and M are positive integers. Then, we have the following discrete form of (8):
where and The discrete form of the initial conditions are
where and Also, the boundary conditions are now expressed as
and are approximated using the central finite differences such as
and
Similarly for and we have
and
Let
We use the composite trapezoidal rule to find an approximation to the integral in (15) [1]:
where and The functions from to are given by
where and According to the Equations (14)–(20), the system (12) has the form
where and The initial and boundary conditions are defined in (13) and (14), respectively.
4. Discretization in Time
In this section, we numerically solve the model of ordinary differential equations (22) in time by applying the continuous Runge–Kutta method of the fourth order and the discrete Runge–Kutta method of the third order with stages. This method was introduced by Owren and Zennaro [32,33,34,36].
Let and be written as and , respectively. Let
and
The initial conditions are
where The system of ordinary and delay differential equations in (22) can be expressed as
where and
The continuous approximation of order p of for the solution at a point is found by
and the discrete approximation of order is calculated as
Here, , and The optimal values of the coefficients used by this method are given in the folllowing Butcher table:
where the polynomials are given by
The Euclidean norm of and is defined as follows:
This gives an estimate of the local discretization error of the explicit continuous Runge–Kutta method at The initial stepsize is computed by
according to Refs. [37,38], where the accuracy tolerance is chosen by the user of the code. The new stepsize from to is computed by
where is a safety coefficient that reduces the number of rejected steps during the implementation time. The new stepsize is accepted when
and it is rejected when
If is rejected, another attempt is taken with a halved stepsize ; see also [1,2].
5. Numerical Experiment: Spatial Propagation of COVID-19
The coronavirus disease (COVID-19) emerged in Wuhan, China in December 2019. The disease is registered as an epidemic in many regions of the world. In this section, we use the model described in Section 2 to study the spread of COVID-19 in two-dimensional space for two cases. In the first case, we assume that no containment measures are applied; thus, For the second case, we assume that the force of containment measures is We assume that and Also, we assume no deaths for the infected individuals in the latent period, i.e., [1/day]. The other numerical values of the parameters are given in Table 1.
Let and where We define Dirichlet boundary conditions as
The initial conditions are defined on to be
and
5.1. The Force of Containment Measures when
If the force of containment measure is zero, then contour plots in the x direction are demonstrated in Figure 1, which show that COVID-19 propagates uniformly to all directions, with a minimal wave speed that equals
The two-dimensional approximated solutions of to and to at different times are presented in Figure 2 and Figure 3. Figure 4 displays the rejected stepsize h, as discussed in Section 4.
5.2. The Force of Containment Measures when
6. Discussion
We developed a reaction–diffusion model with a latent period, described by a standard structured model with age-independent diffusion and death rates. The resulting system consists of partial differential equations with a time-delayed nonlocal term. We assumed a bounded domain to solve the model numerically in two-dimensional space using the continuous Runge–Kutta method of the fourth order and the discrete Runge–Kutta method of the third order with stages. As an advantage of this numerical method, users can choose the accuracy tolerance , which helps to reduce the local discretization error. The local discretization error is given by
The higher the accuracy tolerance we choose, the more accurate and stable the results we gain. However, the code requires more time to calculate the results as we apply a higher accuracy tolerance , which could be considered a disadvantage. The new stepsize from to is computed as
where is a safety coefficient that reduces the number of rejected steps during the implementation time. The new stepsize is accepted when
and it is rejected when
If is rejected, another attempt is taken with a halved stepsize [37,38]. In Figure 4, we demonstrate the number of rejected steps for different values of , , and Figure 4 depicts that is associated with a higher number of reject steps.
The model’s approximated solutions, contour plots, and rejected stepsize h are depicted in Figure 1, Figure 2, Figure 3, Figure 4, Figure 5, Figure 6 and Figure 7. Since the incubation period of the disease lasts for three days, the density of susceptible individuals and the density of nonisolated infectious individuals will not change for After this time, when the density of susceptible individuals starts to decrease, while the density of nonisolated infectious individuals starts to increase, as demonstrated in Figure 2, Figure 3, Figure 6, and Figure 7. Clearly, Figure 6 and Figure 7 show less severe epidemic outbreaks, since the force of the containment measures is applied to half of the infected population, i.e., On the other hand, when the disease moves faster and quickly reaches the boundary of the infected area, as shown in Figure 2 and Figure 3.
Figure 1 and Figure 5 are also quite important, because we use them to determine the minimal spreading speeds of COVID-19. Based on our choice for the parameter values, the minimum speed of spread of COVID-19 is about
when no containment measures are applied to the populations, i.e., ; see Figure 1. When the force of the containment measures equals Figure 5 shows that COVID-19 propagates with a minimal spreading speed of
The force of the containment measures is applied only to the infectious individuals who already left the latent period.
The literature is replete with papers estimating the numerical values of the parameters [18,20,24,29,39,40], since they highly influence the spreading speeds of COVID-19. The population density of susceptible is another factor that is very important with respect to how it impacts the speed of the disease; see also [19]. Table 2 demonstrates the dependence of COVID-19 spreading speeds on which indicates that can reduce the speed of the spreading virus by more than Also, the results show that quarantining infectious individuals helps control the disease faster than quarantining the susceptible individuals. In addition, Table 2 suggests that the spreading speeds of COVID-19 can be described as a monotone increasing function of To calculate in Table 2, we used the parameter values in the previous section.
According to the National Health Commission of China and the data reported by [41], Wuhan was the only city with confirmed COVID-19 cases as of 17 January 2020. The disease quickly moved to other cities adjacent to Wuhan. Three weeks later, on 7 February 2020, new cases were reported in Ezhou (about 60 km from Wuhan); see [41] (Figure 1). Table 2 displays that the disease virus will reach the city of Ezhou after three weeks when the density of susceptible individuals available to be infected equals 6 and This shows that the model gives an excellent estimate of the spreading speeds of COVID-19 compared with the actual data published by the National Health Commission of China and the data reported by [41].
Lastly, we conclude with a remark about the limitations of the proposed model and some future studies. The model assumes that the parameters are constant when, in reality, they are not. For instance, we assumed the diffusion and death rate to be age-independent, but we will have more realistic results if we allow them to be age-dependent. This will lead to a more complicated model that is hard to deal with analytically and numerically. However, we will discuss this issue and allow the model parameters to be age-independent in future work. Also, future studies will cover the stability of steady states locally and globally.
Funding
The author extends his appreciation to the Deanship of Scientific Research at Northern Border University, Arar, KSA, for funding this research work through the project number NBU-FFR-2024-133-01.
Data Availability Statement
Data are contained within the article.
Conflicts of Interest
The author declares no conflicts of interest.
References
- Alanazi, K.M.; Jackiewicz, Z.; Thieme, H.R. Numerical simulations of the spread of rabies in two-dimensional space. Appl. Numer. Math. 2019, 135, 87–98. [Google Scholar] [CrossRef]
- Alanazi, K.M.; Jackiewicz, Z.; Thieme, H.R. Numerical simulations of spread of rabies in a spatially distributed fox population. Math. Comput. Simul. 2019, 159, 161–182. [Google Scholar] [CrossRef]
- Alanazi, K.M.; Jackiewicz, Z.; Thieme, H.R. Spreading speeds of rabies with territorial and diffusing rabid foxes. Discret. Contin. Dyn.-Syst.-Ser. B 2020, 25, 2143. [Google Scholar] [CrossRef]
- Chekroun, A.; Kuniya, T. Global threshold dynamics of an infection age-structured SIR epidemic model with diffusion under the Dirichlet boundary condition. J. Differ. Equ. 2020, 269, 117–148. [Google Scholar] [CrossRef]
- Diekmann, O. Limiting behaviour in an epidemic model. Nonlinear Anal. TMA 1977, 1, 459–470. [Google Scholar] [CrossRef]
- Gourley, S.A.; Liu, R.; Wu, J. Some vector borne diseases with structured host populations: Extinction and spatial spread. SIAM J. Appl. Math. 2007, 67, 408–433. [Google Scholar] [CrossRef]
- Lu, H.; Giannino, F.; Tartakovsky, D.M. Parsimonious models of in-host viral dynamics and immune response. Appl. Math. Lett. 2023, 145, 108781. [Google Scholar] [CrossRef]
- Ou, C.; Wu, J. Spatial spread of rabies revisited: Influence of age-dependent diffusion on nonlinear dynamics. SIAM J. Appl. Math. 2006, 67, 138–163. [Google Scholar] [CrossRef]
- Thieme, H.R. A model for the spatial spread of an epidemic. J. Math. Biol. 1977, 4, 337–351. [Google Scholar] [CrossRef]
- Thieme, H.R. Mathematics in Population Biology; Princeton University Press: Princeton, NJ, USA, 2003. [Google Scholar]
- So, J.W.-H.; Wu, J.; Zou, X. A reaction–diffusion model for a single species with age structure. I Travelling wavefronts on unbounded domains. Proc. R. Soc. Lond. Ser. A Math. Phys. Eng. Sci. 2001, 457, 1841–1853. [Google Scholar] [CrossRef]
- Ducrot, A.; Langlais, M.; Magal, P. Multiple travelling waves for an SI-epidemic model. Netw. Heterog. Media 2013, 8, 171–190. [Google Scholar] [CrossRef]
- Gourley, S.A.; Kuang, Y. A delay reaction-diffusion model of the spread of bacteriophage infection. SIAM J. Appl. Math. 2004, 65, 550–566. [Google Scholar] [CrossRef]
- Liang, D.; Wu, J.; Zhang, F. Modelling population growth with delayed nonlocal reaction in 2-dimensions. Math. Biosci. Eng. 2004, 2, 111–132. [Google Scholar] [CrossRef] [PubMed]
- Wu, J.; Zou, X. Traveling wave fronts of reaction-diffusion systems with delay. J. Dyn. Differ. Equ. 2001, 13, 651–687. [Google Scholar] [CrossRef]
- Cui, Q.; Hu, Z.; Li, Y.; Han, J.; Teng, Z.; Qian, J. Dynamic variations of the COVID-19 disease at different quarantine strategies in Wuhan and mainland China. J. Infect. Public Health 2020, 13, 849–855. [Google Scholar] [CrossRef] [PubMed]
- Hellewell, J.; Abbott, S.; Gimma, A.; Bosse, N.I.; Jarvis, C.I.; Russell, T.W.; Munday, J.D.; Kucharski, A.J.; Edmunds, W.J.; Funk, S.; et al. Feasibility of controlling COVID-19 outbreaks by isolation of cases and contacts. Lancet Glob. Health 2020, 8, E488–E496. [Google Scholar] [CrossRef] [PubMed]
- Lin, Q.; Zhao, S.; Gao, D.; Lou, Y.; Yang, S.; Musa, S.S.; Wang, M.H.; Cai, Y.; Wang, W.; Yang, L.; et al. A conceptual model for the coronavirus disease 2019 (COVID-19) outbreak in Wuhan, China with individual reaction and governmental action. Int. J. Infect. Dis. 2020, 93, 211–216. [Google Scholar] [CrossRef] [PubMed]
- Sun, Z.; Zhang, H.; Yang, Y.; Wan, H.; Wang, Y. Impacts of geographic factors and population density on the COVID-19 spreading under the lockdown policies of China. Sci. Total Environ. 2020, 746, 141347. [Google Scholar] [CrossRef] [PubMed]
- Wang, Y.; Wang, Y.; Chen, Y.; Qin, Q. Unique epidemiological and clinical features of the emerging 2019 novel coronavirus pneumonia (COVID-19) implicate special control measures. J. Med. Virol. 2020, 92, 568–576. [Google Scholar] [CrossRef]
- Anastassopoulou, C.; Russo, L.; Tsakris, L.; Siettos, C. Modelling and forecasting of the COVID-19 outbreak. PLoS ONE 2020, 15, e0230405. [Google Scholar] [CrossRef]
- Arino, J.; Portet, S. A simple model for COVID-19. Infect. Dis. Model. 2020, 5, 309–315. [Google Scholar] [CrossRef] [PubMed]
- Berestycki, H.; Roquejoffre, J.M.; Rossi, L. Propagation of epidemics along lines with fast diffusion. Bull. Math. Biol. 2021, 83, 2. [Google Scholar] [CrossRef]
- Chen, J. Pathogenicity and transmissibility of 2019-nCoV—A quick overview and comparison with other emerging viruses. Microbes Infect. 2020, 22, 69–71. [Google Scholar] [CrossRef]
- Kouidere, A.; Youssoufi, L.E.; Ferjouchia, H.; Balatif, O.; Rachik, M. Optimal control of mathematical modeling of the spread of the COVID-19 pandemic with highlighting the negative impact of quarantine on diabetics people with cost-effectiveness. Chaos Solitons Fractals 2021, 145, 110777. [Google Scholar] [CrossRef] [PubMed]
- Kucharski, A.J.; Russell, T.W.; Diamond, C.; Liu, Y.; Edmunds, J.; Funk, S.; Eggo, R.M.; Centre for Mathematical Modelling of Infectious Diseases COVID-19 Working Group. Early dynamics of transmission and control of COVID-19: A mathematical modelling study. Lancet Infect. Dis. 2020, 20, 553–558. [Google Scholar] [CrossRef] [PubMed]
- Viguerie, A.; Lorenzo, G.; Auricchio, F.; Baroli, D.; Hughes, T.J.; Patton, A.; Reali, A.; Yankeelov, T.E.; Veneziani, A. Simulating the spread of COVID-19 via a spatially-resolved susceptible–exposed–infected–recovered–deceased (SEIRD) model with heterogeneous diffusion. Appl. Math. Lett. 2021, 111, 106617. [Google Scholar] [CrossRef] [PubMed]
- Wei, F.; Zhou, R.; Jin, Z.; Huang, S.; Peng, Z.; Wang, J.; Xu, X.; Zhang, X.; Xu, J.; Bai, Y.; et al. COVID-19 transmission driven by age-group mathematical model in Shijiazhuang City of China. Infect. Dis. Model. 2023, 8, 1050–1062. [Google Scholar] [CrossRef]
- Wu, J.T.; Leung, K.; Leung, G.M. Nowcasting and forecasting the potential domestic and international spread of the 2019-nCoV outbreak originating in Wuhan, China: A modelling study. Lancet 2020, 395, 689–697. [Google Scholar] [CrossRef]
- Zhao, S.; Lin, Q.; Ran, J.; Musa, S.S.; Yang, G.; Wang, W.; Lou, Y.; Gao, D.; Yang, L.; He, D.; et al. Preliminary estimation of the basic reproduction number of novel coronavirus (2019-nCoV) in China, from 2019 to 2020: A data-driven analysis in the early phase of the outbreak. Int. J. Infect. Dis. 2020, 92, 214–217. [Google Scholar] [CrossRef]
- Zhu, C.C.; Zhu, J. Dynamic analysis of a delayed COVID-19 epidemic with home quarantine in temporal-spatial heterogeneous via global exponential attractor method. Chaos Solitons Fractals 2021, 143, 110546. [Google Scholar] [CrossRef]
- Owren, B.; Zennaro, M. Order barriers for continuous explicit Runge-Kutta methods. Math. Comput. 1991, 56, 645–661. [Google Scholar] [CrossRef]
- Owren, B.; Zennaro, M. Derivation of efficient, continuous, explicit Runge-Kutta methods. SIAM J. Sci. Stat. Comput. 1992, 13, 1488–1501. [Google Scholar] [CrossRef]
- Owren, B.; Zennaro, M. Continuous explicit Runge-Kutta methods. In Computational Ordinary Differential Equations; Institute of Mathematics and Its Applications Conference Series—New Series 39; Oxford University Press: New York, NY, USA, 1992; pp. 97–105. [Google Scholar]
- Thieme, H.R.; Zhao, X.-Q. Asymptotic speeds of spread and traveling waves for integral equations and delayed reaction-diffusion models. J. Differ. Equ. 2003, 195, 430–470. [Google Scholar] [CrossRef]
- Bellen, A.; Zennaro, M. Numerical Methods for Delay Differential Equations; Oxford Science Publications, Clarendon Press: Oxford, UK, 2003. [Google Scholar]
- Gladwell, I.; Shampine, L.F.; Brankin, R.W. Automatic selection of the initial step size for an ODE solver. J. Comput. Appl. Math. 1987, 18, 175–192. [Google Scholar] [CrossRef]
- Shampine, L.F.; Gordon, M.K. Computer Solution of Ordinary Differential Equations: The Initial Value Problem; W.H. Freeman: San Francisco, CA, USA, 1975. [Google Scholar]
- Read, J.M.; Bridgen, J.R.; Cummings, D.A.; Ho, A.; Jewell, C.P. Novel coronavirus 2019-nCoV (COVID-19): Early estimation of epidemiological parameters and epidemic size estimates. Philos. Trans. R. Soc. B 2021, 376, 20200265. [Google Scholar] [CrossRef]
- Xu, R.; Rahmandad, H.; Gupta, M.; DiGennaro, C.; Ghaffarzadegan, N.; Amini, H.; Jalali, M.S. Weather, air pollution, and SARS-CoV-2 transmission: A global analysis. Lancet Planet. Health 2021, 5, e671–e680. [Google Scholar] [CrossRef]
- Feng, Y.; Li, Q.; Tong, X.; Wang, R.; Zhai, S.; Gao, C.; Lei, Z.; Chen, S.; Zhou, Y.; Wang, J.; et al. Spatiotemporal spread pattern of the COVID-19 cases in China. PLoS ONE 2020, 15, e0244351. [Google Scholar] [CrossRef]
Figure 1.
Contour plots of (top) and (bottom) in x direction when and .
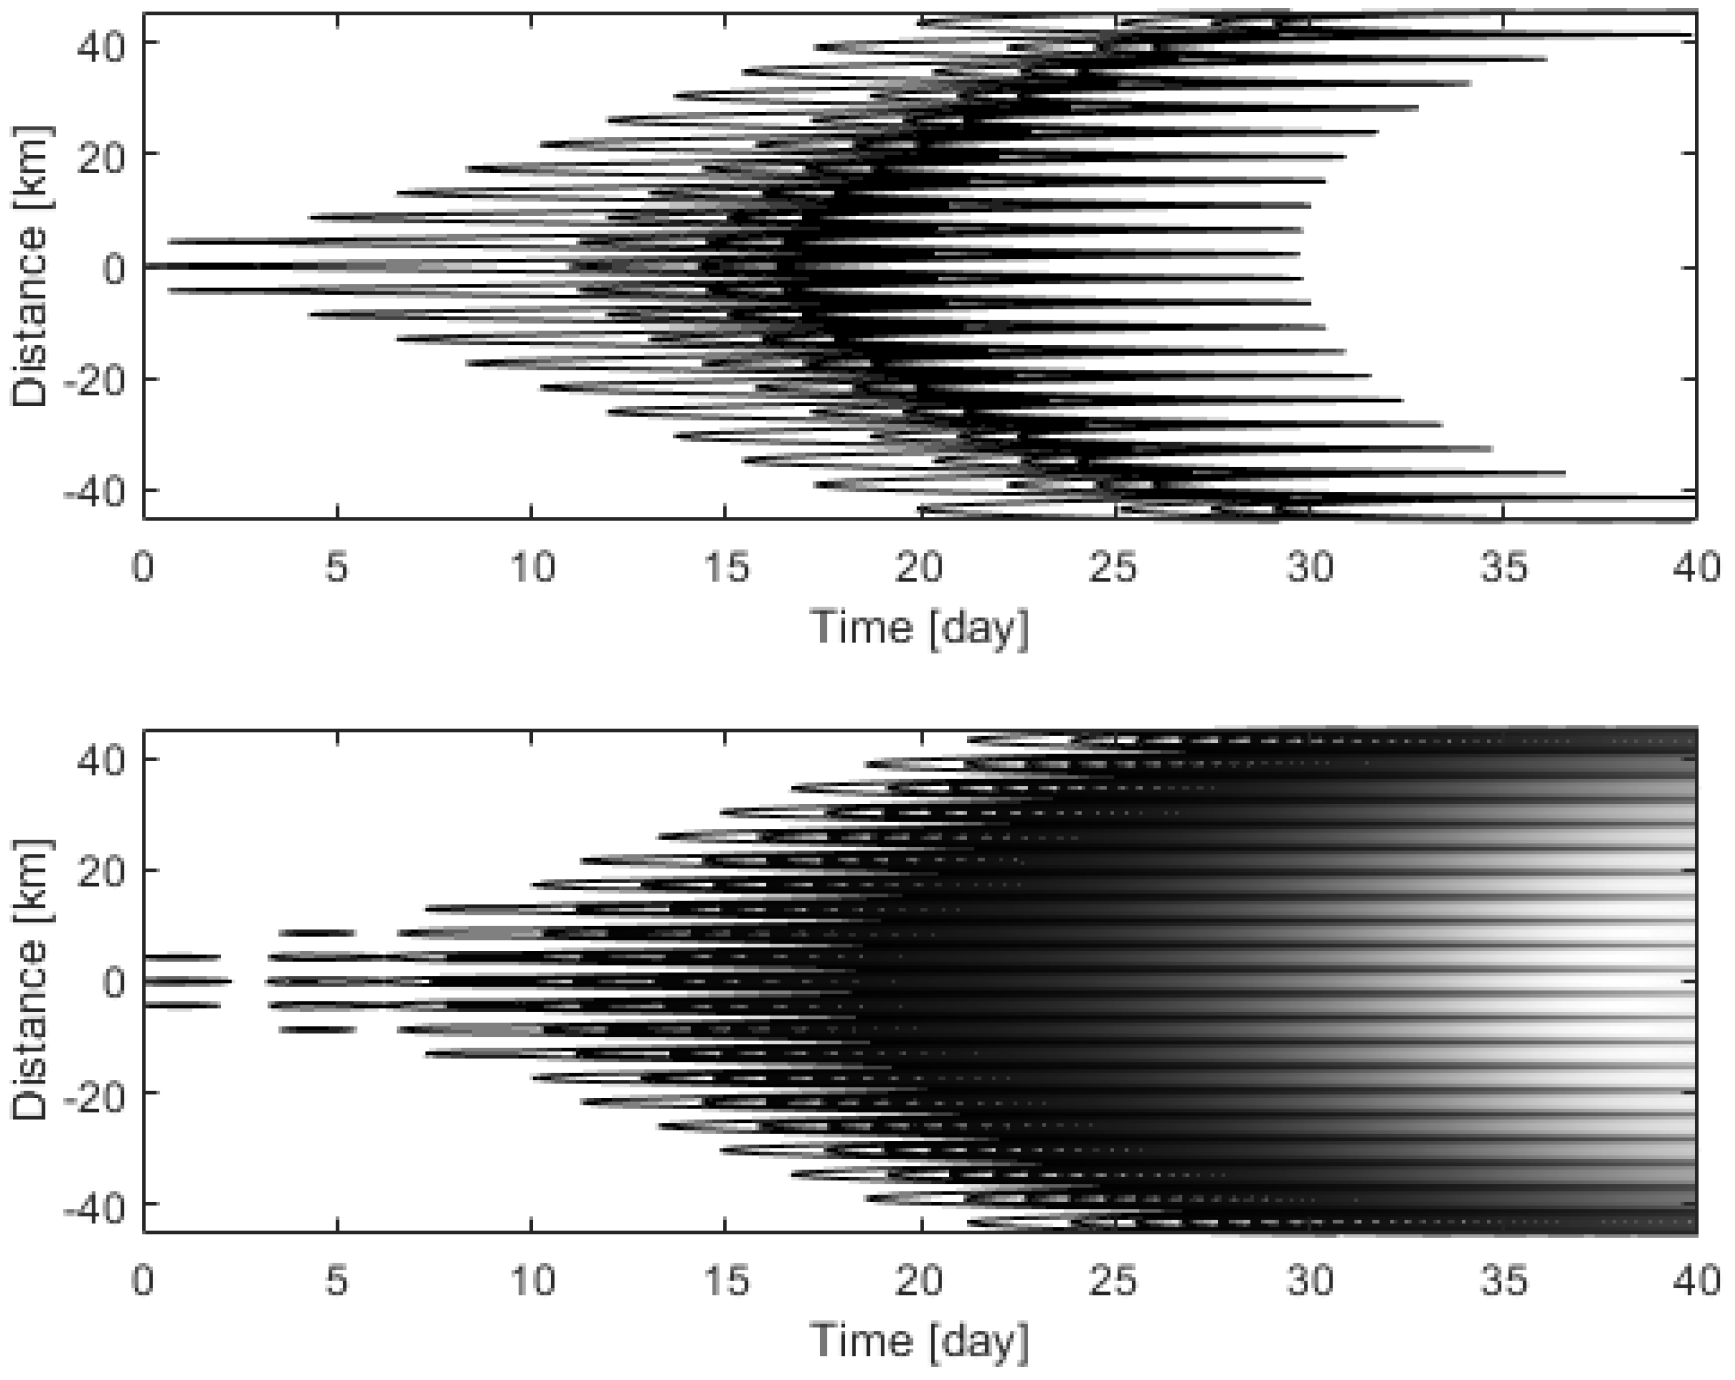
Figure 2.
Two-dimensional approximation of to when (a) , (b) (c) (d) (e) (f) .
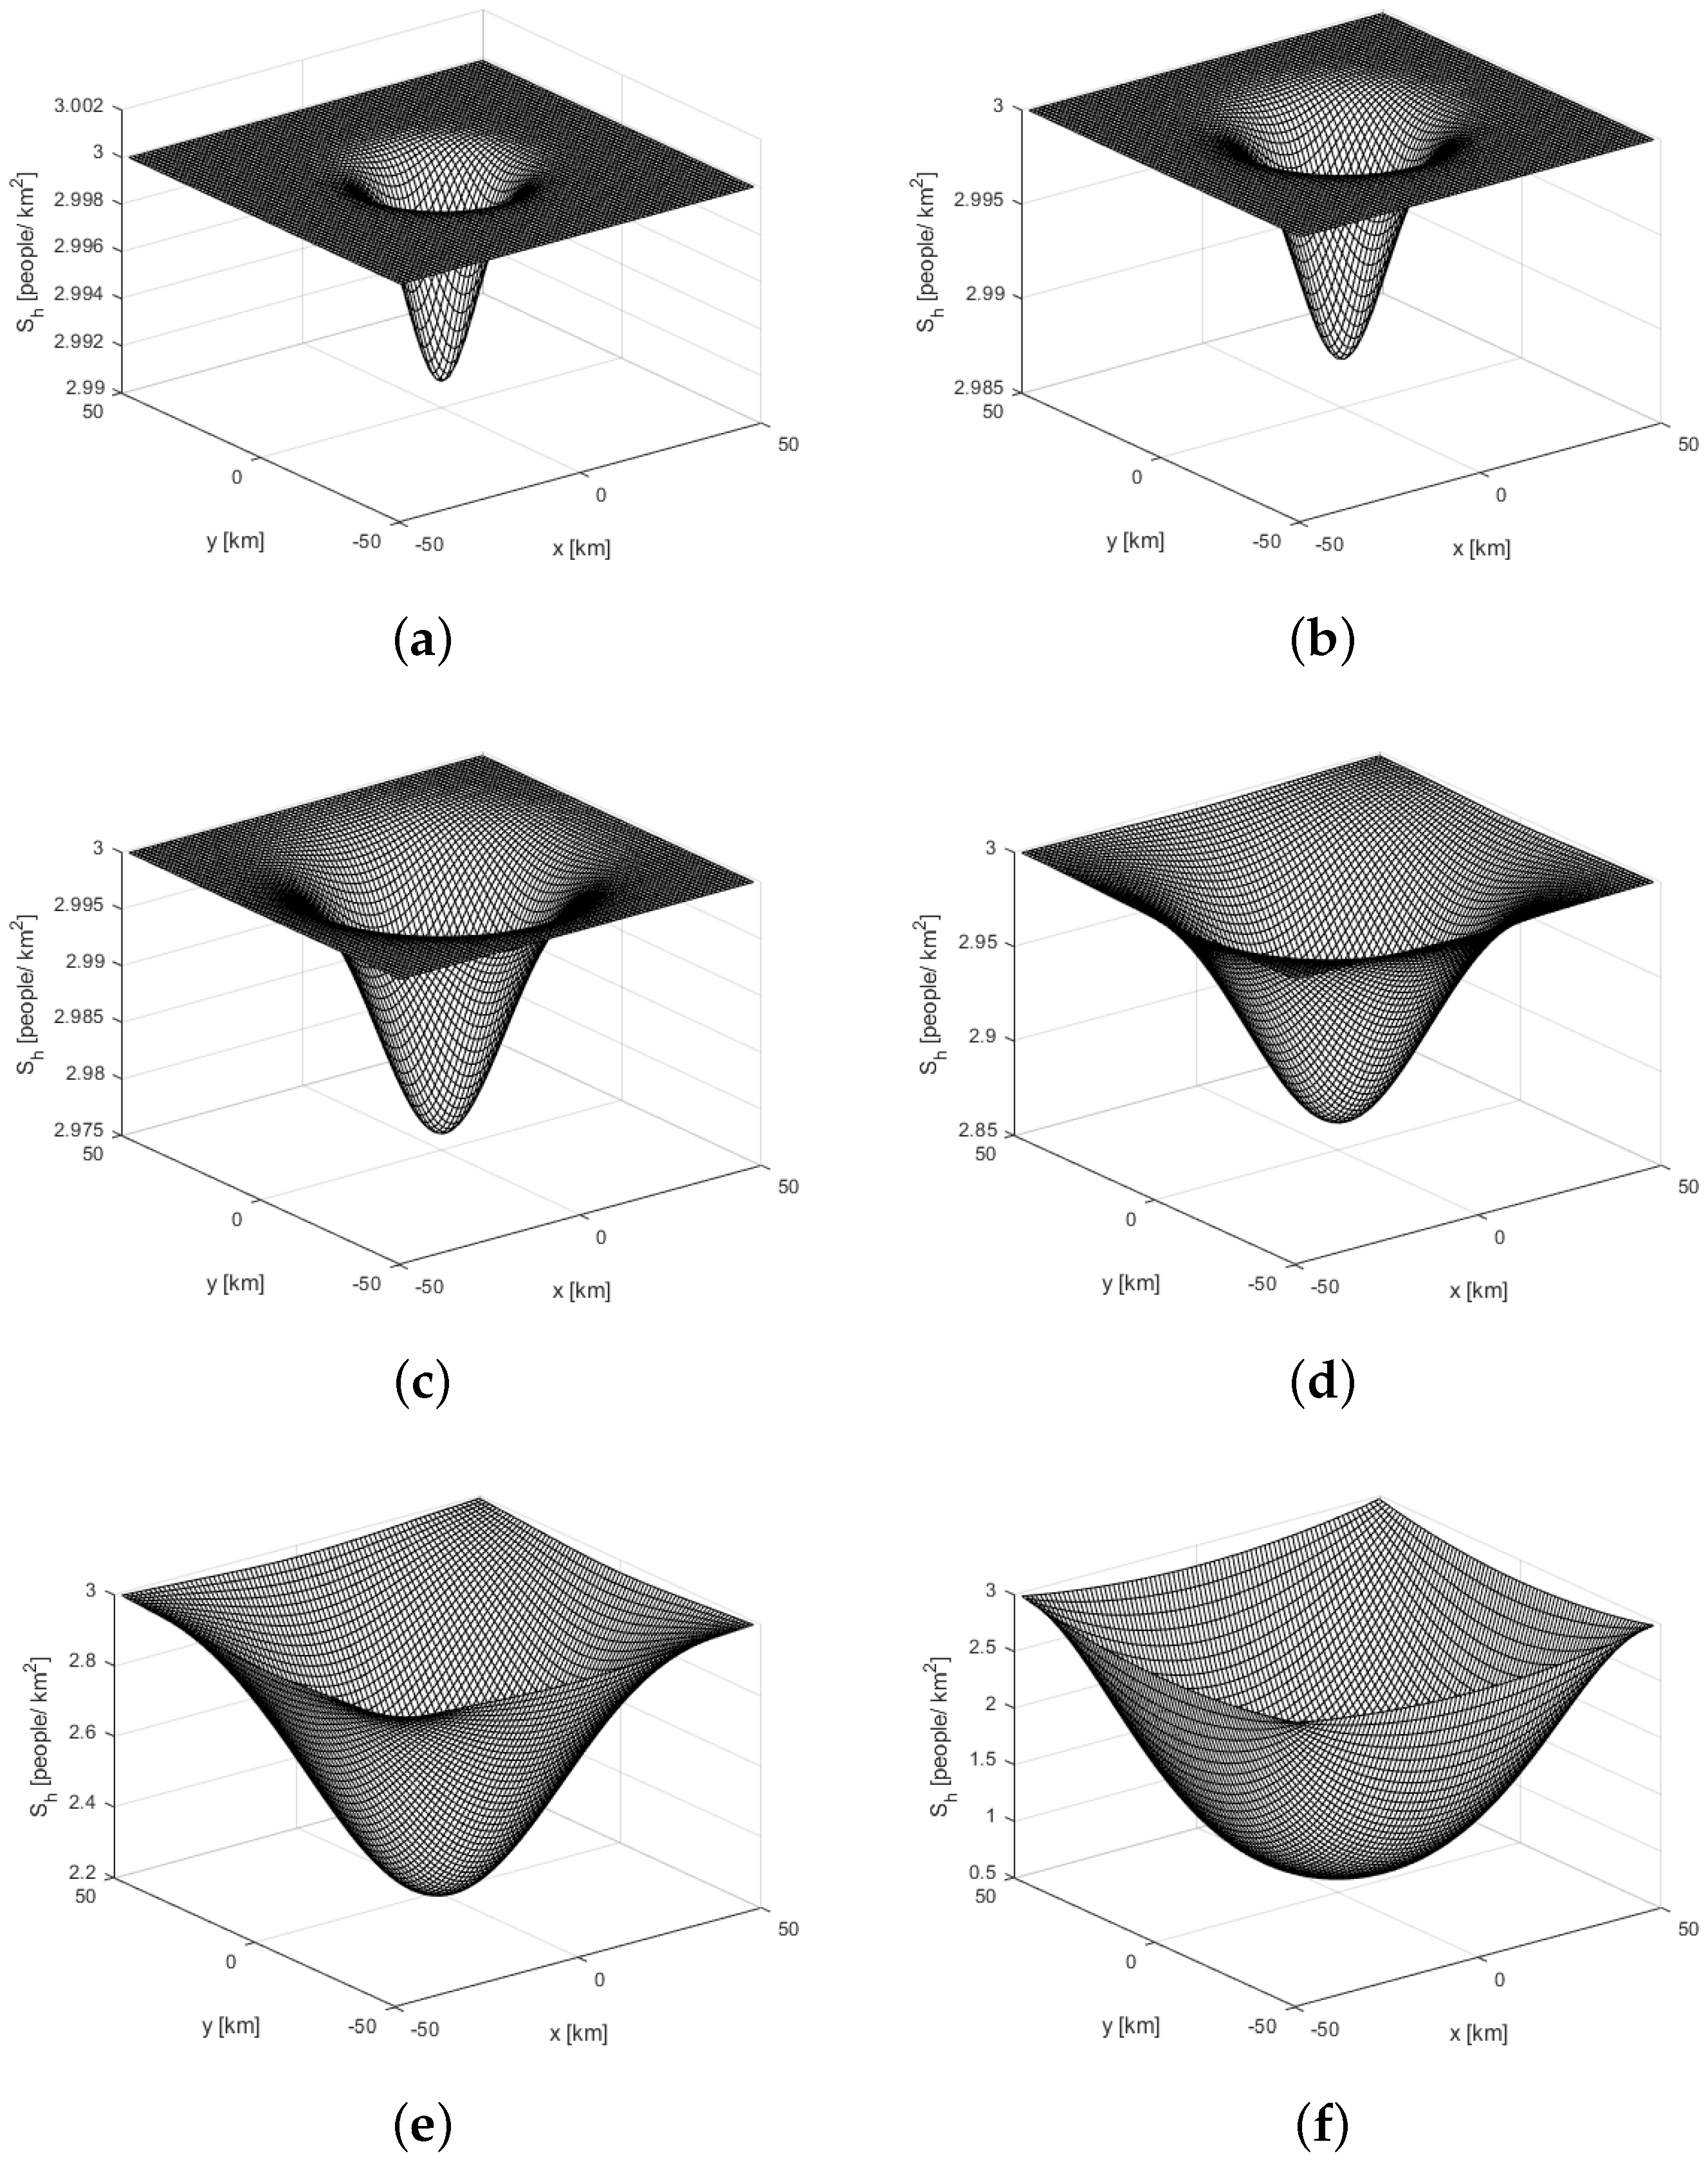
Figure 3.
Two-dimensional approximation of to when (a) , (b) (c) (d) (e) (f) .

Figure 4.
The plot of stepsize h taken between time and for , , and when and .

Figure 5.
Contour plots of (top) and (bottom) in x direction when and .

Figure 6.
Two-dimensional approximation of to when (a) , (b) (c) (d) (e) (f) .

Figure 7.
Two-dimensional approximation of to when (a) , (b) (c) (d) (e) (f) .


Table 1.
Numerical values of the parameters.
| Parameter | Biological Meaning | Units | Values | References |
|---|---|---|---|---|
| The initial number of susceptible | [people/] | 3 | Assumed | |
| Disease transmission coefficient | [/day] | [18] | ||
| s | Incubation period fixed value | [day] | 3 | [18] |
| The mean length of infectious period | [day] | [39] |
Table 2.
Dependence of COVID-19 spreading speeds on .
| 4 | [km/day] = 16.4703 [km/week] | [km/day] = 10 [km/week] |
| 5 | [km/day] = 18.6669 km/week] | [km/day] = 12.1737 [km/week] |
| 6 | [km/day] = 19.9997 [km/week] | [km/day] = 14 [km/week] |
Disclaimer/Publisher’s Note: The statements, opinions and data contained in all publications are solely those of the individual author(s) and contributor(s) and not of MDPI and/or the editor(s). MDPI and/or the editor(s) disclaim responsibility for any injury to people or property resulting from any ideas, methods, instructions or products referred to in the content. |
© 2024 by the author. Licensee MDPI, Basel, Switzerland. This article is an open access article distributed under the terms and conditions of the Creative Commons Attribution (CC BY) license (https://creativecommons.org/licenses/by/4.0/).
Share and Cite
MDPI and ACS Style
Alanazi, K.M. Modeling and Simulating an Epidemic in Two Dimensions with an Application Regarding COVID-19. Computation 2024, 12, 34. https://doi.org/10.3390/computation12020034
AMA Style
Alanazi KM. Modeling and Simulating an Epidemic in Two Dimensions with an Application Regarding COVID-19. Computation. 2024; 12(2):34. https://doi.org/10.3390/computation12020034
Chicago/Turabian StyleAlanazi, Khalaf M. 2024. "Modeling and Simulating an Epidemic in Two Dimensions with an Application Regarding COVID-19" Computation 12, no. 2: 34. https://doi.org/10.3390/computation12020034
Note that from the first issue of 2016, this journal uses article numbers instead of page numbers. See further details here.