
Regional Contribution in Electrophysiological-Based Classifications of Attention Deficit Hyperactive Disorder (ADHD) Using Machine Learning

Department of Electronic Engineering, Daegu University, Gyeongsan 38453, Republic of Korea
*
Author to whom correspondence should be addressed.
Computation 2023, 11(9), 180; https://doi.org/10.3390/computation11090180
Submission received: 10 August 2023
/
Revised: 31 August 2023
/
Accepted: 31 August 2023
/
Published: 8 September 2023
(This article belongs to the Special Issue Computational Medical Image Analysis)
Abstract
:Attention deficit hyperactivity disorder (ADHD) is a common neurodevelopmental condition in children and is characterized by challenges in maintaining attention, hyperactivity, and impulsive behaviors. Despite ongoing research, we still do not fully understand what causes ADHD. Electroencephalography (EEG) has emerged as a valuable tool for investigating ADHD-related neural patterns due to its high temporal resolution and non-invasiveness. This study aims to contribute to diagnostic accuracy by leveraging EEG data to classify children with ADHD and healthy controls. We used a dataset containing EEG recordings from 60 children with ADHD and 60 healthy controls. The EEG data were captured during cognitive tasks and comprised signals from 19 channels across the scalp. Our primary objective was to develop a machine learning model capable of distinguishing ADHD subjects from controls using EEG data as discriminatory features. We employed several well-known classifiers, including a support vector machine, random forest, decision tree, AdaBoost, Naive Bayes, and linear discriminant analysis, to discern distinctive EEG patterns. To further enhance classification accuracy, we explored the impact of regional data on the classification outcomes. We arranged the EEG data according to the brain regions from which they were derived (namely frontal, temporal, central, parietal, and occipital) and examined their collective effects on the accuracy of our classifications. Notably, we considered combinations of three regions at a time and found that certain combinations led to enhanced accuracy. Our findings underscore the potential of EEG-based classification in distinguishing children with ADHD from healthy controls. The Naive Bayes classifier yielded the highest accuracy (84%) when applied to specific region combinations. Moreover, we evaluated the classification performance based on hemisphere-specific EEG data and found promising results, particularly when using the right hemisphere region channels.
1. Introduction
Attention deficit hyperactivity disorder (ADHD) is a neurodevelopmental condition prevalent in children that often persists into adulthood [1,2]. Global studies indicate a prevalence of approximately 5–12% among school-going children, with a higher prevalence observed in males [3]. This disorder encompasses three subtypes (predominantly inattentive, predominantly hyperactive–impulsive, and combined) and is characterized by primary symptoms such as inattention, impulsivity, and hyperactivity [4]. Early detection and intervention can greatly benefit children with ADHD, their parents, and their communities. Presently, clinical interviews, observations, and ratings from various sources, including parents and teachers, are employed for diagnosis [5]. Traditional clinical procedures are time-consuming and prone to ambiguity, underscoring the need for objective diagnostic methods based on biological signals that reflect ADHD behaviors.
Electroencephalography (EEG) has emerged as a valuable tool for investigating ADHD-related neural patterns due to its non-invasiveness and high temporal resolution [6]. EEG signals have been utilized in the diagnosis of various neurological disorders by extracting distinctive features and employing different classifiers in automated detection systems. EEG signals have been employed for the automatic detection of neurophysiological conditions such as alcoholism [7], dementia [8], epilepsy [9], schizophrenia [10], Parkinson’s disease [11], and depressive disorders [12]. The EEG patterns of children with ADHD display differences in complexity, randomness, amplitude, and frequency compared with those of typically developing children. Researchers have applied diverse feature extraction techniques and classifiers to utilize EEG signals for ADHD identification [13,14,15].
EEG is widely recognized as a functional imaging technique that measures the electrical activity of the brain. It offers valuable insights into neural processes, cognitive functions, and neurological disorders through the recording of voltage fluctuations produced by neuronal activity. This functional imaging modality provides real-time information on brain dynamics, making it an essential tool in neuroscience research [16]. EEG is increasingly acknowledged as a functional imaging modality, and researchers have capitalized on its exceptional temporal resolution to reveal swift alterations in neural dynamics [17]. Its versatility is evident in its wide-ranging applications, which include obtaining real-time neurofeedback for anesthesia optimization [18] and investigating spatiotemporal dynamics in functional connectivity [19]. Notably, ongoing discussions surround the classification of EEG as a functional imaging technique because of its unique temporal capabilities that enhance our understanding of neural processes and complement other imaging methods. This article aims to contribute to this ongoing discourse by offering a comprehensive investigation that employs EEG in the domain of ADHD classification.
The accessibility of machine learning models has spurred interest in their application to psychiatric disorder research. Machine learning models, which are mathematical constructs capable of learning intricate patterns within existing datasets, have the potential to predict outcomes in new datasets and emphasize key variables in such predictions [16]. For instance, in [20], SVM was utilized to classify ADHD based on EEG signals, and this yielded promising results in distinguishing between ADHD and healthy controls. Our proposed method builds upon this foundation by not only employing SVM but also integrating a comprehensive feature-selection strategy based on distinct brain regions. This enables our model to capture intricate neural patterns that could be missed using a single algorithm. Similarly, [21] employed RF and DT algorithms to identify ADHD in children using event-related potentials (ERPs), highlighting the potential of these classifiers to capture distinctive neural patterns linked to the disorder. We extend this approach by incorporating both RF and DT classifiers within a unified framework and thereby enhancing the robustness of our classification model. Neural networks were used to diagnose ADHD from EEG data in [22]. In contrast, our method offers interpretable insights by considering specific brain regions, thus making it more transparent and clinically applicable. A systematic review in [23] emphasized the application of SVM, RF, and DT in the EEG-signal-based analysis of mental tasks, further reinforcing their relevance in ADHD classification studies. Notably, the integration of electrodermal activity (EDA) features in classification models has shown potential [24]; SVMs have been employed in a multiclass brain–computer interface classification study, underscoring their ability to enhance ADHD classification accuracy. Our approach, however, surpasses this by focusing solely on EEG data, which are more directly relevant to the neural patterns associated with ADHD.
In this paper, we focus on exploring the significance and contribution of different brain regions in classifying children with ADHD and healthy controls. Various brain regions exhibit distinct electrical activity levels, influenced by EEG acquisition conditions and inter-regional connectivity. The frontal region is essential for attention and concentration, reasoning, and judgment. The parietal and central regions process senses and motor movements, the temporal region is responsible for memory and language understanding, and the occipital lobe governs vision and object recognition. Additionally, the brain’s two hemispheres, left and right, control different functions. Individuals with ADHD often exhibit information-processing deficits in the right hemisphere, leading to self-reported inattention symptoms. Our research intends to investigate the impact of particular brain regions, interhemispheric regions, or combinations of these regions on obtaining significant accuracy rates in distinguishing ADHD patients from healthy controls.
Using EEG data from both ADHD patients and a healthy control group, we employ various machine learning models, including support vector machine (SVM), random forest (RF), decision tree (DT), AdaBoost, Naive Bayes, and linear discriminant analysis (LDA). Our investigation explores distinctive EEG patterns linked to ADHD, investigating the impact of individual brain regions and their combinations on achieving high classification accuracy. By investigating regional differences in EEG activity between patients with ADHD and healthy controls, this study aims to enhance our understanding of this disorder.
2. Materials and Methods
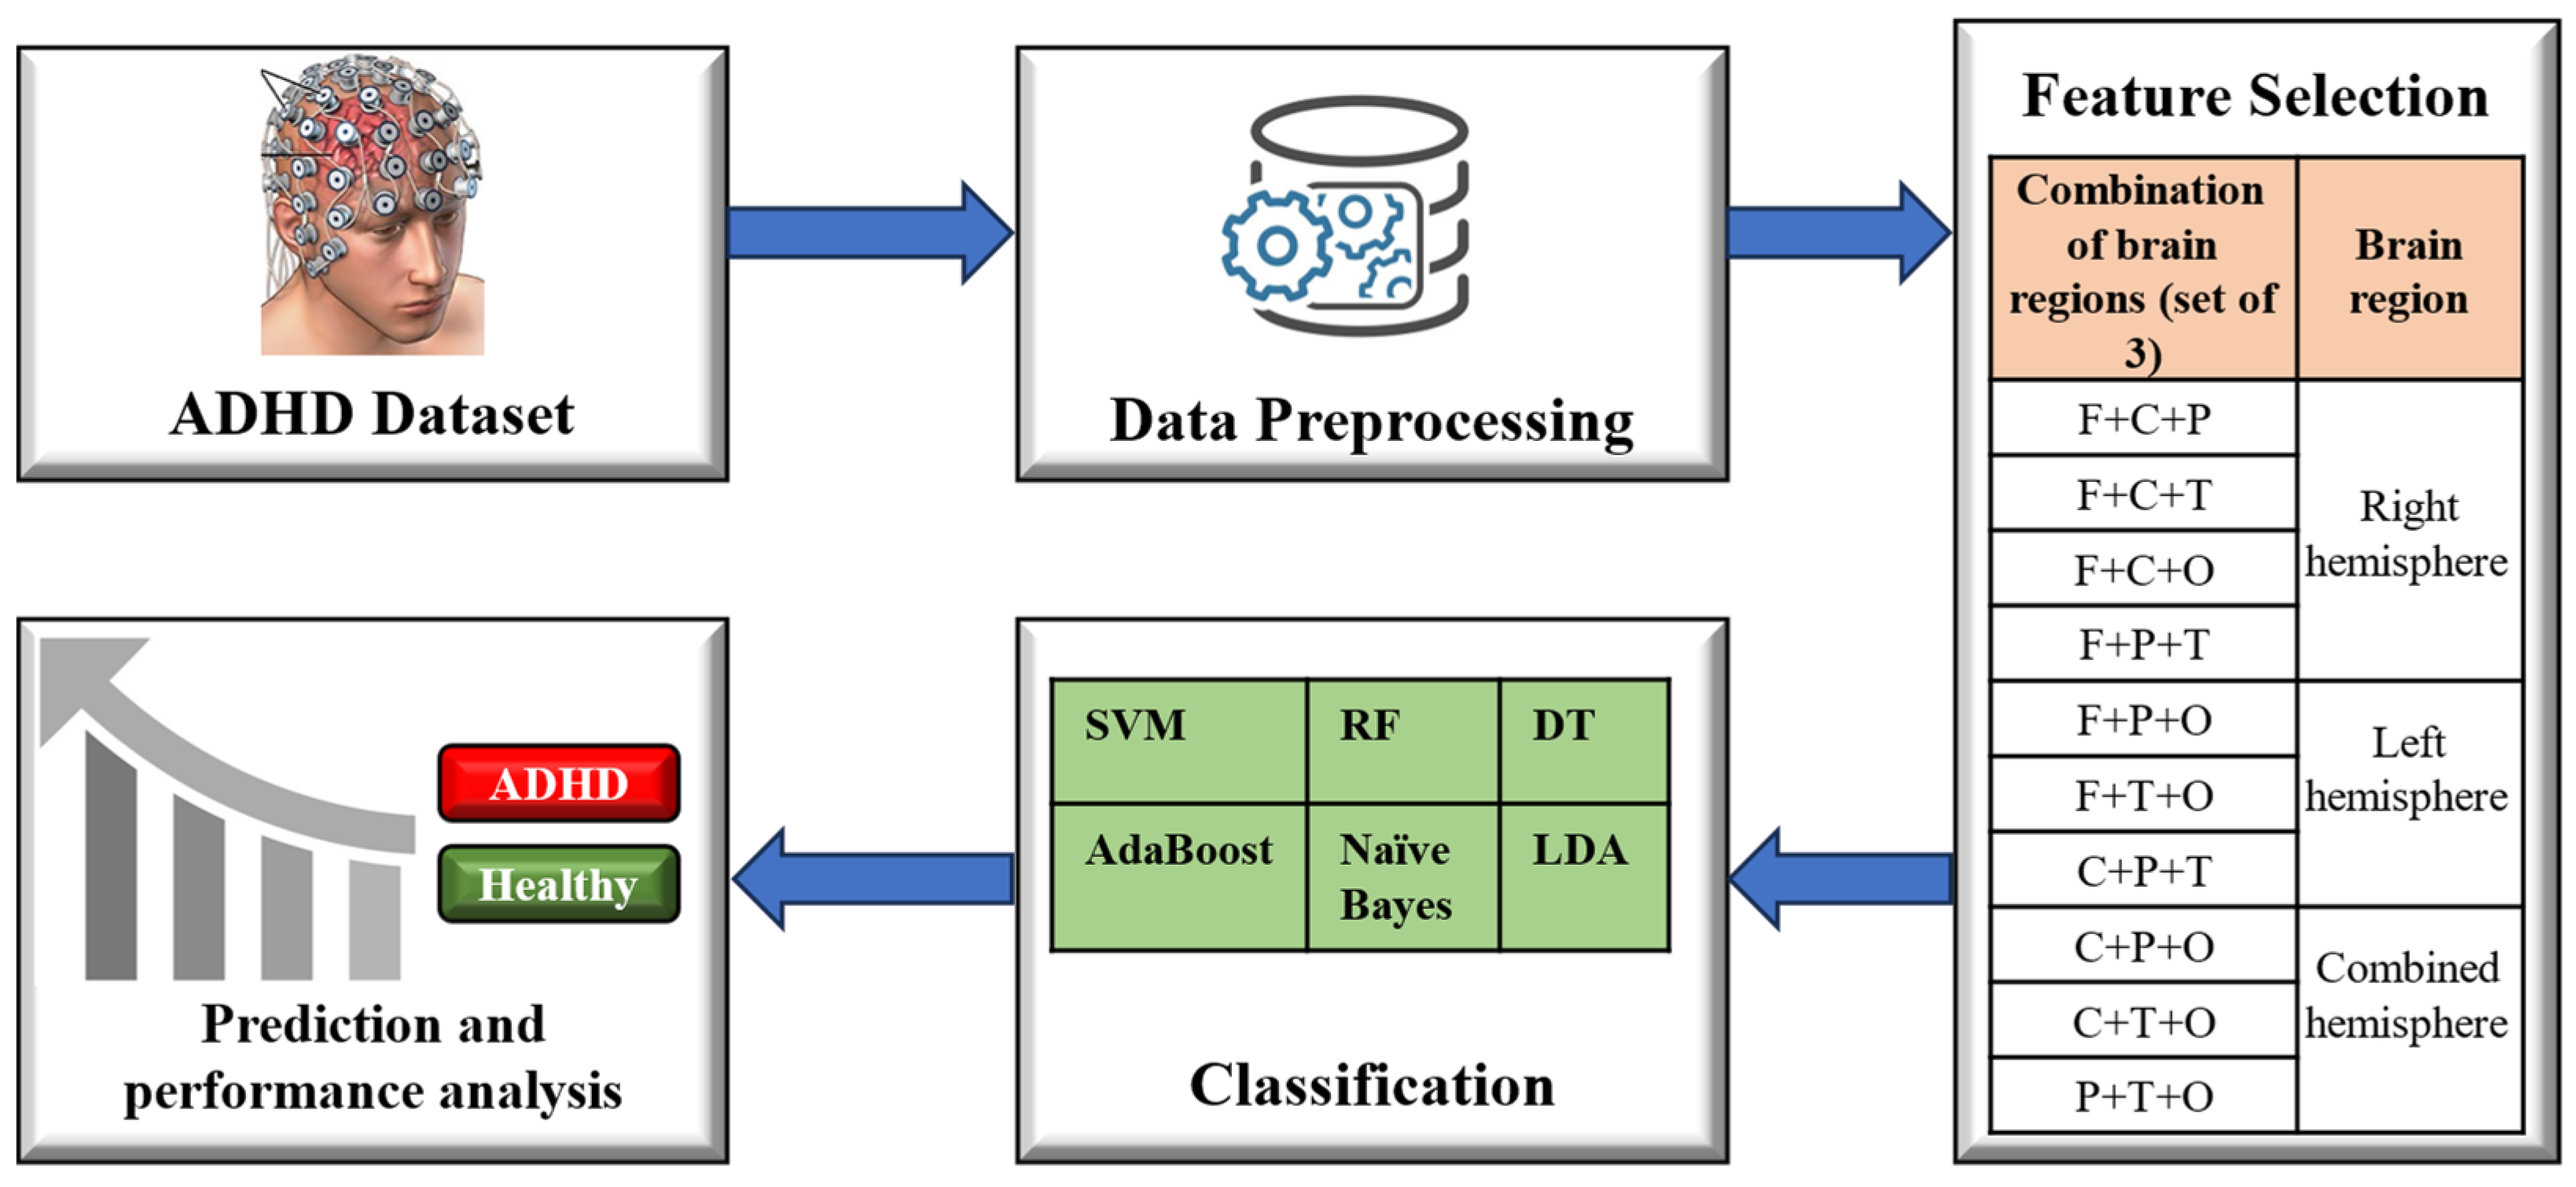
Figure 1 illustrates the framework for the machine learning-based classification of ADHD. To conduct a comparative analysis, various machine learning algorithms were applied to state-of-the-art ADHD datasets. The experimentation was performed using the Python language, utilizing the Scikit-learn library for implementing machine learning models. Specifically, six ML algorithms, namely SVM [25], RF [26], DT [27], AdaBoost [28], Naive Bayes [29], and LDA [30] were employed to the ADHD dataset. Extensive experimentation was carried out to achieve two main objectives:
- Our goal is to highlight brain regions or combinations that are crucial for accurately classifying ADHD and healthy controls;
- We aim to identify the optimal machine learning algorithm that effectively utilizes regional combinations of EEG data for enhanced ADHD classification accuracy.
Figure 1.
Classification Framework for ADHD and healthy controls.
2.1. Dataset
In this study, we utilized a publicly available EEG dataset accessed on 8 August 2023, from the following source: https://ieee-dataport.org/open-access/eegdata-adhd-control-children) [31].
This dataset comprises EEG recordings from two groups: 61 children diagnosed with ADHD (48 boys and 13 girls, average age of 9.61 ± 1.75 years) and 60 healthy children (50 boys and 10 girls, average age of 9.85 ± 1.77 years). ADHD diagnoses were made by an experienced child and adolescent psychiatrist based on DSM-IV criteria [32]. Healthy children from elementary schools were recruited, excluding those with a history of significant neurological conditions, brain injuries, major medical ailments, learning or speech difficulties, other psychiatric disorders, or use of benzodiazepine or barbiturate medications.
During data collection, EEG recordings were taken at a sampling frequency of 128 Hz. Given the challenge of visual attention deficits in ADHD children, EEG data were captured during visual attention tasks. The children were presented with a series of cartoon character images and asked to count the characters. Each image contained a random assortment of characters ranging from 0 to 16, and the images were designed to be sufficiently large for easy viewing and counting. Images were rapidly displayed following the child’s response, ensuring a consistent stimulus presentation. Consequently, the duration of EEG recordings varied based on each child’s performance in this cognitive visual task, specifically their response speed.
The EEG data were acquired using an SD-C24 machine with 19 channels, following the 10–20 electrode placement system. Figure 2 illustrates the 10–20 standard electrode positions for EEG recording [33]. The 10–20 standard system is a widely employed methodology for the consistent placement of electrodes during electroencephalography (EEG) recordings. This system involves dividing the scalp into specific regions and designating unique labels to key points based on a standardized percentage of distances between prominent anatomical landmarks, such as the nasion and inion. Electrodes are positioned precisely at these predetermined locations, ensuring uniform and reproducible EEG signal collection from diverse brain regions. The nomenclature “10–20” denotes the standardized distances of either 10% or 20% between electrode placements, creating a systematic grid that fosters consistent electrode positioning across different subjects and research settings. This approach not only guarantees methodological rigor in data acquisition but also facilitates meaningful cross-subject and cross-study comparisons, making it an integral tool in the field of EEG-based research. The topoplot (topographic map of a scalp) was generated using the MNE-python software package [34]. Different color shades depict the five brain regions: frontal, central, occipital, temporal, and parietal, each corresponding to specific channels.
2.2. Data Preprocessing
EEG signals are prone to the presence of numerous artifacts and sources of noise, necessitating their thorough preprocessing before they can be reliably utilized in analyses. The datasets employed in this study were preprocessed in advance to mitigate such concerns. A comprehensive breakdown of the preprocessing procedures is provided below [35].
The dataset owners used a modified iteration of Makoto’s preprocessing pipeline, adjusted for use with EEGLab functions (version 14.1.1; Delorme & Makeig, 2004, San Diego, CA, USA) and executed using MATLAB 2018a. Initially, artifacts stemming from eye movements and muscle activity were carefully removed through manual visual inspection. Channels containing erroneous or inaccurately captured data were excluded, and interpolation using neighboring channel signals was employed to restore the missing information. To eliminate artifacts, a band-pass finite impulse response (FIR) filter spanning from 0.5 Hz to 48 Hz was administered to the continuous EEG data. Subsequently, the CleanLine plugin was applied to further suppress line noise. To enhance artifact rejection, the EEG data underwent decomposition using independent component analysis (ICA). Independent components (ICs) associated with eye blinks and muscle artifacts were identified based on their spectral properties, scalp maps, and temporal characteristics. These components were manually excluded. Following a thorough cleaning, the time series were filtered across classical EEG frequency bands [delta (0.5–4 Hz), theta (4–8 Hz), alpha (8–13 Hz), beta (13–30 Hz), and lower gamma (30–45 Hz)] using a zero-phase shift FIR filter that maintains phase coherence. Throughout the filtering stages, a zero-phase Hamming-windowed filter was incorporated through the first plugin from EEGLab, featuring a −6 dB cutoff frequency.
For each subject, the time series were segmented into 1024 sample (8 s) segments, albeit with variable counts due to task-specific timings. The minimum task duration was 50 s for a participant from the control group, while the maximum duration reached 285 s for a subject with ADHD. The mean segment count stood at 13.18 (standard deviation = 3.15) for the control group and 16.14 segments (standard deviation = 6.42) for the ADHD group.
2.3. Feature Selection
The EEG data collected from 19 channels (listed in Table 1) were utilized as input features for the classifiers. These features were used in various combinations to train the classifiers. The entire feature set was partitioned into different combinations of frontal (F), central (C), parietal (P), temporal (T), and occipital (O) regions. Detailed information about these regions and their corresponding channels is provided in Table 1.
2.4. Classification
After obtaining the various combinations of feature channels, the features were set as inputs to six different machine learning algorithms: SVM, RF, DT, AdaBoost, Naive Bayes, and LDA. Here is a detailed explanation of how each of these algorithms works:
2.4.1. Support Vector Machine (SVM)
SVM is a robust supervised learning algorithm employed for both classification and regression tasks. Its fundamental principle involves identifying an optimal hyperplane that effectively separates data points belonging to different classes. In the context of binary classification, SVM endeavors to determine the hyperplane that maximizes the margin or distance between classes. The data points nearest to the hyperplane are known as support vectors and significantly influence the delineation of the decision boundary. SVM efficiently manages high-dimensional feature spaces and excels in handling non-linearly separable data through the use of kernel functions.
2.4.2. Decision Tree (DT)
A decision Tree is a versatile machine learning algorithm used primarily for classification and regression tasks. It operates by recursively partitioning the data based on feature values to create a hierarchical structure resembling a tree. At every node of the tree, a decision is made to determine which feature it will use for splitting, with the goal of minimizing uncertainty within each branch. The leaves of the tree correspond to the final class predictions. DTs can efficiently handle both numerical and categorical features, and their intuitive structure makes them interpretable and useful for feature selection.
2.4.3. Random Forest (RF)
RF is an ensemble learning technique that combines multiple decision trees to pro-duce robust predictions. Each tree is individually constructed using a subset of the data and a random assortment of features. During the training process, each tree recursively partitions the data into subsets by considering the selected features. The final prediction is derived by combining the predictions from each individual tree. RF effectively counteracts overfitting concerns and adeptly manages high-dimensional data. Its proficiency lies in its accuracy and capacity to capture intricate relationships within the data.
2.4.4. AdaBoost (Adaptive Boosting)
AdaBoost is a type of ensemble learning that uses multiple weak learners to build a strong classifier. It assigns higher weights to misclassified data points in each iteration, with a focus on challenging-to-classify samples. In subsequent iterations, it allocates more attention to misclassified instances, thereby refining the model’s predictive performance. Through an iterative process of adjusting sample weights, AdaBoost develops a potent classifier capable of accurate classification. Its adaptability to varying complexities of data and potential for boosting model accuracy are notable attributes.
2.4.5. Naive Bayes
Naive Bayes is a probabilistic classification algorithm based on Bayes’ theorem. It assumes that features are conditionally independent when you know the class label, which is why it is called “naive”. Naive Bayes computes the probability of a data point belonging to a certain class based on its feature values and prior class probabilities. Despite its simplistic assumptions, Naive Bayes often performs remarkably well, particularly when the independence assumption is not drastically violated. It is computationally efficient, requires relatively small amounts of training data, and is particularly useful for text classification tasks.
2.4.6. Linear Discriminant Analysis (LDA)
LDA is a dimensionality reduction technique often used in the context of classification. It seeks to find the linear combinations of features that best separate different classes while minimizing the variance within each class. LDA essentially projects data onto a lower-dimensional space, maximizing class separability. It is particularly useful when classes have distinct distributions, and it is known for its effectiveness in reducing overfitting in high-dimensional data.
2.5. Performance Analysis
The comparative analysis involved assessing performance metrics across different combinations of features, regions, and classifiers. The primary objective was to identify the optimal combinations of channels/features and classifiers that demonstrated superior results in terms of two key performance metrics: accuracy and the area under the curve (AUC).
Accuracy performance, commonly utilized in classification tasks, is determined by the ratio of correctly predicted instances (both true positives and true negatives) to the total number of instances in the dataset. This can be mathematically formulated using the following Equation (1) [36]:
Here, TP: True positive, TN: True negative, FP: False positive, and FN: False negative.
The AUC score is a widely used metric for evaluating the performance of binary classification models. It measures the classifier’s capacity to differentiate between positive and negative instances by plotting the True Positive Rate (TPR) against the False Positive Rate (FPR) across various discrimination thresholds. A higher AUC value signifies superior classification performance. The AUC score can be computed using Equation (2) as provided below [36]:
Here, TPR and FPR can be measured using Equations (3) and (4):
In the next section, we will present a detailed overview of the experimental results and provide a thorough analysis.
3. Results and Discussion
In this study, we assessed how effectively different classifiers performed with various combinations of brain regions, as shown in Table 2. Among all of the classifiers examined, SVM displayed interesting accuracy in several combinations, particularly the highest accuracy of 76% attained for the brain region combination F+C+P. RF displayed competitive accuracy, reaching 72% accuracy in the F+C+O and F+P+O combinations. DT exhibited varying accuracy, with the highest value of 64% in the F+C+P configuration. AdaBoost demonstrated its effectiveness with the F+C+T combination, yielding 72% accuracy. Surprisingly, Naïve Bayes displayed relatively lower accuracy across the board, indicating limitations in capturing the non-linear relationships present in the data. Furthermore, it is noteworthy that the Naïve Bayes classifier, despite demonstrating lower accuracy in some configurations, showcased a remarkable accuracy of 84% in the F+T+O combination. LDA consistently exhibited moderate accuracy, with its highest value of 56% obtained in the P+T+O combination. Overall, the classifiers’ performances were influenced by the specific combination of brain regions, highlighting the importance of tailored feature selection in optimizing classification accuracy.
Figure 3 shows a graph that summarizes how accurate different classifiers were with different combinations of three brain regions. The values depicted in the graph correspond to the accuracy scores presented in Table 1. Notably, the Naïve Bayes classifier demonstrates a sufficient accuracy of 84% in both the F+T+O and F+P+T combinations due to its ability to effectively capture and model complex relationships within these specific combinations of brain regions. The amalgamation of these brain region combinations likely encompasses unique neural patterns that are indicative of ADHD-related activity. Additionally, the Naïve Bayes classifier’s proficiency in modeling probabilistic relationships between features and classes makes it well-suited for capturing the nuanced distinctions present in these particular combinations of brain regions. This graph provides an intuitive representation of the performance trends of different classifiers across distinct regional sets, offering insights into their varying strengths in capturing relevant features and interactions within the EEG data.
As shown in Table 3, among the various combinations of brain regions and classifiers evaluated in the study, the combination “F+C+T” stands out as having achieved the highest AUC performance. This combination demonstrates the ability to effectively distinguish between ADHD and healthy control subjects with remarkable AUC scores, which is shown in Figure 4. Specifically, the classifiers RF and AdaBoost exhibit notable AUC values of 75.9% and 67.5%, respectively, when employed with this brain region combination. These elevated AUC scores indicate the classifiers’ proficiency in capturing the distinctive patterns and features associated with ADHD and healthy control subjects within the selected brain regions. The significant performance of “F+C+T” in terms of AUC underscores its potential as a discriminative feature set, showcasing the effectiveness of RF and AdaBoost classifiers in this context. This finding serves as valuable insight into the optimal feature combination and classifier choice for accurate classification between the two subject groups.
Table 4 presents the accuracy performance of various classifiers across different brain region combinations, focusing on the right hemisphere, left hemisphere, and the fusion of both hemispheres. Notably, the analysis highlights the highest accuracy achieved by any classifier within each dataset, providing valuable insights into their efficacy in detecting ADHD-related patterns in region-specific EEG data. In the right hemisphere dataset, the Naïve Bayes classifier exhibited the highest accuracy of 84%, underscoring its ability to discern distinctive neural patterns associated with ADHD. For the left hemisphere dataset, the RF classifier achieved the highest accuracy of 64%, whereas the Naïve Bayes classifier demonstrated an accuracy of 28%. Remarkably, in the combined hemisphere dataset, the RF classifier attained the highest accuracy of 68% along with SVM, reaffirming the proficiency of these classifiers in capturing intricate relationships across neural regions. These outcomes underscore the variability in accuracy across classifiers and brain regions, providing valuable insights into their performance in classifying ADHD patterns based on hemisphere-specific neural activity. The accuracy plot depicting the performance of all classifiers based on hemisphere-specific regions is illustrated in Figure 5.
Furthermore, the AUC values for the different hemisphere regions were meticulously evaluated, as illustrated in Table 5. In the “Right hemisphere”, the highest AUC score of 86.3% was achieved with the SVM, closely trailed by Naïve Bayes at 85.7%. Intermediate AUC results were demonstrated with RF (59.4%) and AdaBoost (50.3%), while DT (42.2%) and LDA (34.4%) exhibited relatively lower AUC values. Shifting to the “Left hemisphere”, RF excelled with an AUC of 63.3%, outperforming the other classifiers that registered comparatively lower AUC scores. Notably, when examining the “Combined hemisphere” scenario, RF continued its prominent performance by achieving the highest AUC of 72.7%, closely pursued by AdaBoost at 63.6%. In this consolidated context, SVM, Naïve Bayes, and DT showcased relatively lower AUC values. Collectively, these AUC findings offer insightful comparisons of the classifiers’ capabilities in discerning EEG patterns across distinct brain hemisphere regions, with RF and AdaBoost emerging as top performers, particularly in the combined setting. Figure 6 displays a plot of AUC scores, which illustrates how all the classifiers performed when considering hemisphere-specific regions.
The comprehensive analysis of classification performance across different brain region combinations, focusing on the right hemisphere, left hemisphere, and the combined hemisphere, has provided valuable insights into the discriminatory capabilities of various classifiers for ADHD-related patterns. In terms of accuracy, we observed an interesting variation based on distinct features obtained from different hemisphere regions. Notably, the right hemisphere dataset exhibited remarkable accuracy performance by the Naïve Bayes classifier, achieving the highest accuracy of 84%. This can be attributed to Naïve Bayes’ probabilistic nature, which assumes feature independence given the class label. In cases where the underlying patterns are well-approximated by the independence assumption, Naïve Bayes excels, as seen in the distinctive neural patterns associated with ADHD discerned in the right hemisphere. On the other hand, in the left hemisphere, the RF classifier achieved the highest accuracy of 64%. RF’s capacity to capture complex relationships among features played a significant role. Interestingly, in the combined hemisphere dataset, both the RF classifier and SVM achieved the highest accuracy of 68%. This underlines the proficiency of RF in capturing intricate relationships across neural regions, complemented by SVM’s ability to define an optimal hyperplane for class separation. The AUC results further substantiate these findings. Notably, in the right hemisphere, Naïve Bayes and SVM achieved the highest AUC scores, capitalizing on the probabilistic and hyperplane-based approaches, respectively. RF’s excellence in capturing complex patterns enabled it to attain the highest AUC in the left hemisphere. Remarkably, in the combined hemisphere, the RF classifier continued its prominent performance, emphasizing its adaptability to amalgamate neural region information. These findings collectively underscore the strengths of specific classifiers in discerning ADHD-related patterns, driven by their inherent characteristics and adaptability to distinct data distributions.
The varying performance of the Naive Bayes classifier across different brain region combinations can be attributed to its underlying assumption of feature independence. In cases where the features within a specific combination of brain regions are indeed conditionally independent given the class label, the Naive Bayes classifier excels by effectively capturing the underlying patterns; however, its performance diminishes when faced with brain region combinations characterized by intricate inter-feature relationships and non-linear interactions. In such scenarios, the assumption of feature independence becomes less valid, leading to suboptimal classification accuracy. This disparity underscores the significance of tailored feature selection and highlights that the Naive Bayes classifier’s effectiveness is contingent upon the specific nature of the data it encounters.
The computational complexity of the study can be categorized as moderate to high because we implemented and evaluated several machine learning models, such as SVM, RF, DT, AdaBoost, Naive Bayes, and LDA. The investigation into various combinations of brain regions and hemispheres, coupled with feature selection, further contributes to the complexity. Additionally, hyperparameter tuning, potential cross-validation, ensemble methods, feature scaling, and multiple evaluation metrics amplify the computational workload. For experimentation, Python 3.8.5 was employed on a Samsung PC with an Intel Core i5-8400 CPU @ 2.80GHz, 8GB RAM and a GeForce GTX 1070 Ti 8GB GPU to facilitate these computations. The study strikes a balance between computational complexity and the research’s significance in yielding valuable insights from the obtained results.
There are several limitations in this study that need to be acknowledged. We employed EEG data derived from different brain region combinations to conduct ADHD classification against healthy control subjects using various machine learning techniques. Unlike several prior works, we deliberately refrained from employing external feature extraction techniques or feature engineering approaches to manipulate the classification features. While such comparisons could provide valuable insights, it is important to note that conducting direct performance comparisons with other studies may not yield fair or reliable results due to variations in datasets, preprocessing pipelines, features, and classifiers employed in each study. Additionally, the absence of deep learning techniques in our methodology is another limitation. Deep learning has shown promising results in various classification tasks, including medical image analysis, and its exploration could offer further improvements in the accuracy and robustness of the classification model. It is our intention to address these limitations in a future work, where we plan to include comparative analyses and explore the integration of deep learning methods to enhance the classification performance.
4. Conclusions
In this paper, we explore the application of EEG data for the classification of ADHD subjects and healthy controls. Leveraging machine learning techniques, we aimed to enhance the accuracy of ADHD diagnosis by exploiting distinctive neural patterns captured through EEG recordings. Our study uncovered several key findings that shed light on the potential of EEG-based classification in ADHD research. Through comprehensive analysis, we demonstrated the effectiveness of various classifiers, including SVM, RF, DT, AdaBoost, Naive Bayes, and LDA, in distinguishing between ADHD and healthy control groups. Notably, the Naive Bayes classifier achieved a sufficient e accuracy of 84% when considering specific combinations of brain regions. This highlights the discriminatory power of EEG data in revealing patterns associated with ADHD. Furthermore, our investigation into regional contributions revealed the significant impact of hemisphere-specific EEG data on classification performance. We observed higher AUC values in the right hemisphere, particularly with the SVM and Naive Bayes classifiers. This supports the notion that EEG data from specific brain regions can provide valuable insights into ADHD-related neural activity. The exploration of combined hemisphere data highlighted the potential of the RF classifier, which achieved a promising AUC of 72.7%. This finding underscores the importance of selecting appropriate classifiers and brain regions to maximize classification accuracy. While these classifiers have shown promising performance in previous studies and are well-suited for capturing complex relationships within the data, we acknowledge that neural networks, especially deep learning models, have gained significant attention in recent years for their capacity to learn intricate patterns in large and complex datasets. However, due to the relatively smaller size of our dataset and the interpretability offered by traditional classifiers, we opted to focus on them for our current investigation. In summary, this research advances our understanding of EEG-based ADHD classification by demonstrating the efficacy of distinct classifiers and brain region combinations. Numerous intriguing directions remain open for future explorations. Firstly, the integration of advanced machine learning techniques, such as deep learning models like convolutional neural networks (CNNs) and recurrent neural networks (RNNs), could potentially yield even more accurate and robust classification results. Additionally, the incorporation of multi-modal data, combining EEG with other physiological or behavioral measures, could provide a more comprehensive understanding of ADHD-related neural patterns. Furthermore, exploring the generalizability of our findings to larger and more diverse populations could enhance the clinical applicability of our approach. These approaches show potential for improving ADHD diagnosis methods and enhancing our knowledge of neurodevelopmental disorders.
Author Contributions
Conceptualization, N.C. and B.-J.C.; methodology, N.C.; software, N.C.; validation, N.C. and B.-J.C.; formal analysis, N.C.; investigation, N.C.; resources, B.-J.C.; data curation, N.C.; writing—original draft preparation, N.C.; writing—review and editing, N.C.; visualization, N.C.; supervision, B.-J.C.; project administration, B.-J.C.; funding acquisition, B.-J.C. All authors have read and agreed to the published version of the manuscript.
Funding
This research was supported by the Korea Institute of Advancement of Technology (KIAT) grant funded by the Korean government (MOTIE) (P0012724, HRD Program for Industrial Innovation).
Institutional Review Board Statement
Not applicable.
Informed Consent Statement
Not applicable.
Data Availability Statement
Not applicable.
Conflicts of Interest
The authors declare no conflict of interest.
References
- American Psychiatric Association. Diagnostic and Statistical Manual of Mental Disorders, 5th ed.; American Psychiatric Publishing: Arlington, VA, USA, 2013. [Google Scholar]
- Konrad, K.; Eickhoff, S.B. Is the ADHD brain wired differently? A review on structural and functional connectivity in attention deficit hyperactivity disorder. Human Brain Mapp. 2010, 31, 904–916. [Google Scholar] [CrossRef] [PubMed]
- Smith, M. Hyperactive around the world? The history of ADHD in global perspective. Soc. Hist. Med. 2017, 30, 767–787. [Google Scholar] [CrossRef]
- Arns, M.; Heinrich, H.; Strehl, U. Evaluation of neurofeedback in ADHD: The long and winding road. Biol. Psychol. 2014, 95, 108–115. [Google Scholar] [CrossRef] [PubMed]
- Emerson, E.; Einfeld, S.; Stancliffe, R.J. The mental health of young children with intellectual disabilities or borderline intellectual functioning. Soc. Psychiatry Psychiatr. Epidemiol. 2010, 45, 579–587. [Google Scholar] [CrossRef] [PubMed]
- Arns, M.; Conners, C.K.; Kraemer, H.C. A decade of EEG theta/beta ratio research in ADHD: A meta-analysis. J. Atten. Disord. 2013, 17, 374–383. [Google Scholar] [CrossRef]
- Patidar, S.; Pachori, R.B.; Upadhyay, A.; Acharya, U.R. An integrated alcoholic index using tunable-Q wavelet transform based features extracted from EEG signals for diagnosis of alcoholism. Appl. Soft Comput. 2017, 50, 71–78. [Google Scholar] [CrossRef]
- Micanovic, C.; Pal, S. The diagnostic utility of EEG in early-onset dementia: A systematic review of the literature with narrative analysis. J. Neural Transm. 2014, 121, 59–69. [Google Scholar] [CrossRef]
- Daftari, C.; Shah, J.; Shah, M. Detection of Epileptic Seizure Disorder Using EEG Signals. In Artificial Intelligence-Based Brain-Computer Interface; Academic Press: Cambridge, MA, USA, 2022; pp. 163–188. [Google Scholar] [CrossRef]
- Ko, D.-W.; Yang, J.-J. EEG-Based Schizophrenia Diagnosis through Time Series Image Conversion and Deep Learning. Electronics 2022, 11, 2265. [Google Scholar] [CrossRef]
- Aljalal, M.; Aldosari, S.A.; Molinas, M.; AlSharabi, K.; Alturki, F.A. Detection of Parkinson’s disease from EEG signals using discrete wavelet transform, different entropy measures, and machine learning techniques. Sci. Rep. 2022, 12, 22547. [Google Scholar] [CrossRef]
- Wu, C.T.; Huang, H.C.; Huang, S.; Chen, I.M.; Liao, S.C.; Chen, C.K.; Lin, C.; Lee, S.H.; Chen, M.H.; Tsai, C.F.; et al. Resting-State EEG Signal for Major Depressive Disorder Detection: A Systematic Validation on a Large and Diverse Dataset. Biosensors 2021, 11, 499. [Google Scholar] [CrossRef]
- Alba, G.; Pereda, E.; Mañas, S.; Méndez, L.D.; González, A.; González, J.J. Electroencephalography signatures of attention-deficit/hyperactivity disorder: Clinical utility. Neuropsychiatr. Dis. Treat. 2015, 11, 2755–2769. [Google Scholar] [PubMed]
- Loo, S.K.; Makeig, S. Clinical utility of EEG in attentiondeficit/hyperactivity disorder: A research update. Neurotherapeutics 2012, 9, 569–587. [Google Scholar] [CrossRef] [PubMed]
- Khoshnoud, S.; Nazari, M.A.; Shamsi, M. Functional brain dynamic analysis of ADHD and control children using nonlinear dynamical features of EEG signals. J. Integr. Neurosci. 2018, 17, 17–30. [Google Scholar] [CrossRef]
- Michel, C.M.; Murray, M.M. Towards the utilization of EEG as a brain imaging tool. NeuroImage 2012, 61, 371–385. [Google Scholar] [CrossRef] [PubMed]
- Huster, R.J. Brinkman Perspective: The potential of real-time EEG neurofeedback for optimizing anesthesia. Front. Hum. Neurosci. 2020, 14, 19. [Google Scholar]
- Engemann, D.A.; Gramfort, A. Microstates as a tool to explore the spatiotemporal dynamics of functional connectivity in EEG. Hum. Brain Mapp. 2020, 41, 3972–3992. [Google Scholar]
- Smith, M.E. Current advances in functional imaging of mild traumatic brain injury. Curr. Opin. Neurol. 2018, 31, 687–693. [Google Scholar]
- Alchalabi, A.E.; Shirmohammadi, S.; Eddin, A.N.; Elsharnouby, M. FOCUS: Detecting ADHD Patients by an EEG-Based Serious Game. IEEE Trans. Instrum. Meas. 2018, 67, 1512–1520. [Google Scholar] [CrossRef]
- Rashid, M.H.; Siddique, N.H. A novel feature extraction and selection method for classification of EEG signals using SVM. J. Neurosci. Methods 2017, 284, 48–60. [Google Scholar]
- Wang, Z.; Li, Y.; Zhou, Z.; He, L.; Wu, S.; Guo, L. Identification of ADHD children based on ERP and machine learning methods. IEEE Trans. Neural Syst. Rehabil. Eng. 2020, 28, 3–13. [Google Scholar]
- Chen, X.; Lai, Y.; Li, Y. Classification of ADHD children based on EEG data using neural networks. J. Ambient Intell. Humaniz. Comput. 2020, 11, 1113–1121. [Google Scholar]
- Xie, Y.; Oniga, S. A Review of Processing Methods and Classification Algorithm for EEG Signal. Carpathian J. Electron. Comput. Eng. 2020, 13, 23–29. [Google Scholar] [CrossRef]
- Barachant, A.; Bonnet, S.; Congedo, M.; Jutten, C. Multiclass brain–computer interface classification by Riemannian geometry. IEEE Trans. Biomed. Eng. 2013, 59, 920–928. [Google Scholar] [CrossRef] [PubMed]
- Vapnik, V.N. An overview of statistical learning theory. IEEE Trans. Neural Netw. 1999, 10, 988–999. [Google Scholar] [CrossRef] [PubMed]
- Breiman, L. Random forests. Mach. Learn. 2001, 45, 5–32. [Google Scholar] [CrossRef]
- Quinlan, J.R. Induction of Decision Trees. Mach. Learn. 1986, 1, 81–106. [Google Scholar] [CrossRef]
- Freund, Y.; Schapire, R.E. A decision-theoretic generalization of on-line learning and an application to boosting. J. Comput. Syst. Sci. 1997, 55, 119–139. [Google Scholar] [CrossRef]
- Mitchell, T. Machine Learning. In Chapter 6: “Bayesian Learning” Covers Naive Bayes Algorithms; McGraw-Hill: New York, NY, USA, 1997; ISBN 0070428077. [Google Scholar]
- Boucsein, W. Electrodermal Activity; Springer Science & Business Media: Berlin, Germany, 2012. [Google Scholar]
- Nasrabadi, A.M.; Allahverdy, A.; Samavati, M.; Mohammadi, M.R. EEG Data ADHD/Control Children. IEEE Dataport 2020. [Google Scholar] [CrossRef]
- Morgan, A.E.; Hynd, G.W.; Riccio, C.A.; Hall, J. Validity of DSM-IV ADHD Predominantly Inattentive and Combined Types: Relationship to Previous DSM Diagnoses/Subtype Differences. J. Am. Acad. Child Adolesc. Psychiatry 1996, 35, 325–333. [Google Scholar] [CrossRef]
- Onton, J.; Delorme, A.; Makeig, S. Frontal midline EEG dynamics during working memory. NeuroImage 2005, 27, 341–356. [Google Scholar] [CrossRef]
- Larson, E.; Gramfort, A.; Engemann, D.A.; Leppakangas, J.; Brodbeck, C.; Jas, M.; Brooks, T.; Sassenhagen, J.; Luessi, M.; McCloy, D.; et al. Mne-Python. Zenodo. 23 February 2023. Available online: https://zenodo.org/record/7671973 (accessed on 8 August 2023).
- Huang, J.; Ling, C.X. Using AUC and accuracy in evaluating learning algorithms. IEEE Trans. Knowl. Data Eng. 2005, 17, 299–310. [Google Scholar] [CrossRef]
Figure 2.
EEG electrode positions according to the 10–20 standard system. Different shades indicate distinct regions and their corresponding channels. The figure displays the left and right hemispheres along with the channels included within each hemisphere.
Figure 2.
EEG electrode positions according to the 10–20 standard system. Different shades indicate distinct regions and their corresponding channels. The figure displays the left and right hemispheres along with the channels included within each hemisphere.
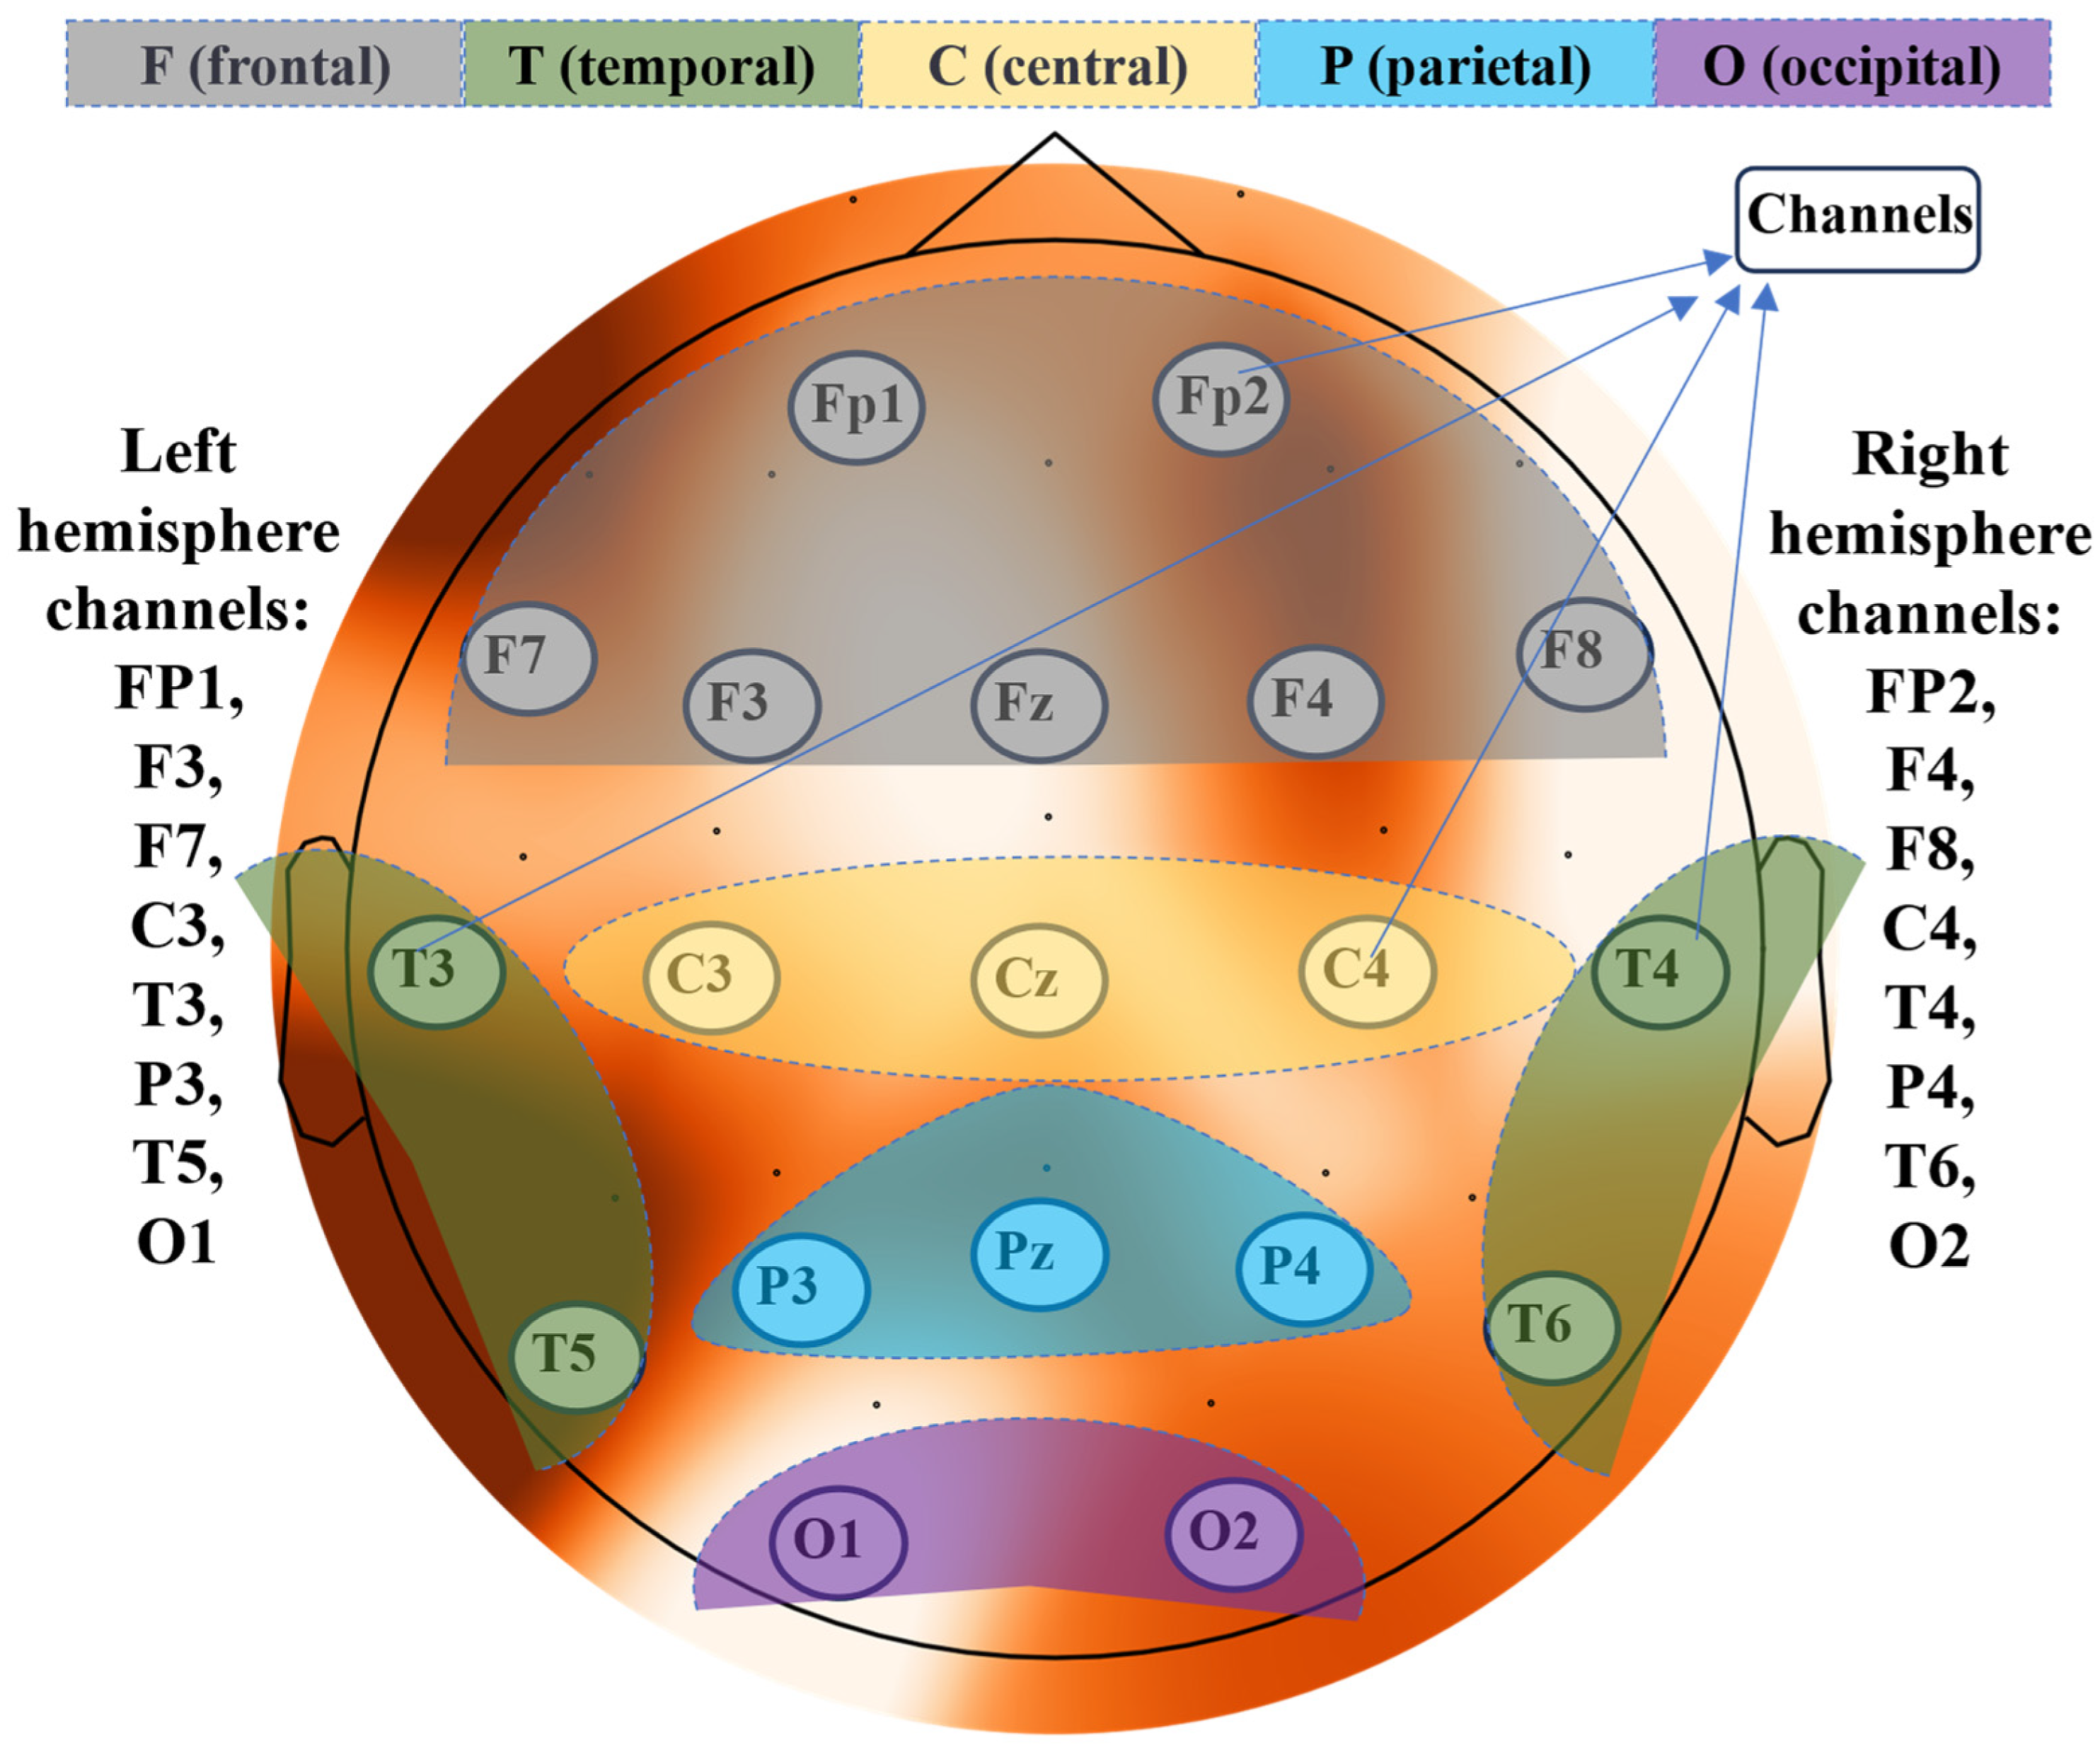
Figure 3.
Accuracy of different classifiers across three brain region combinations.
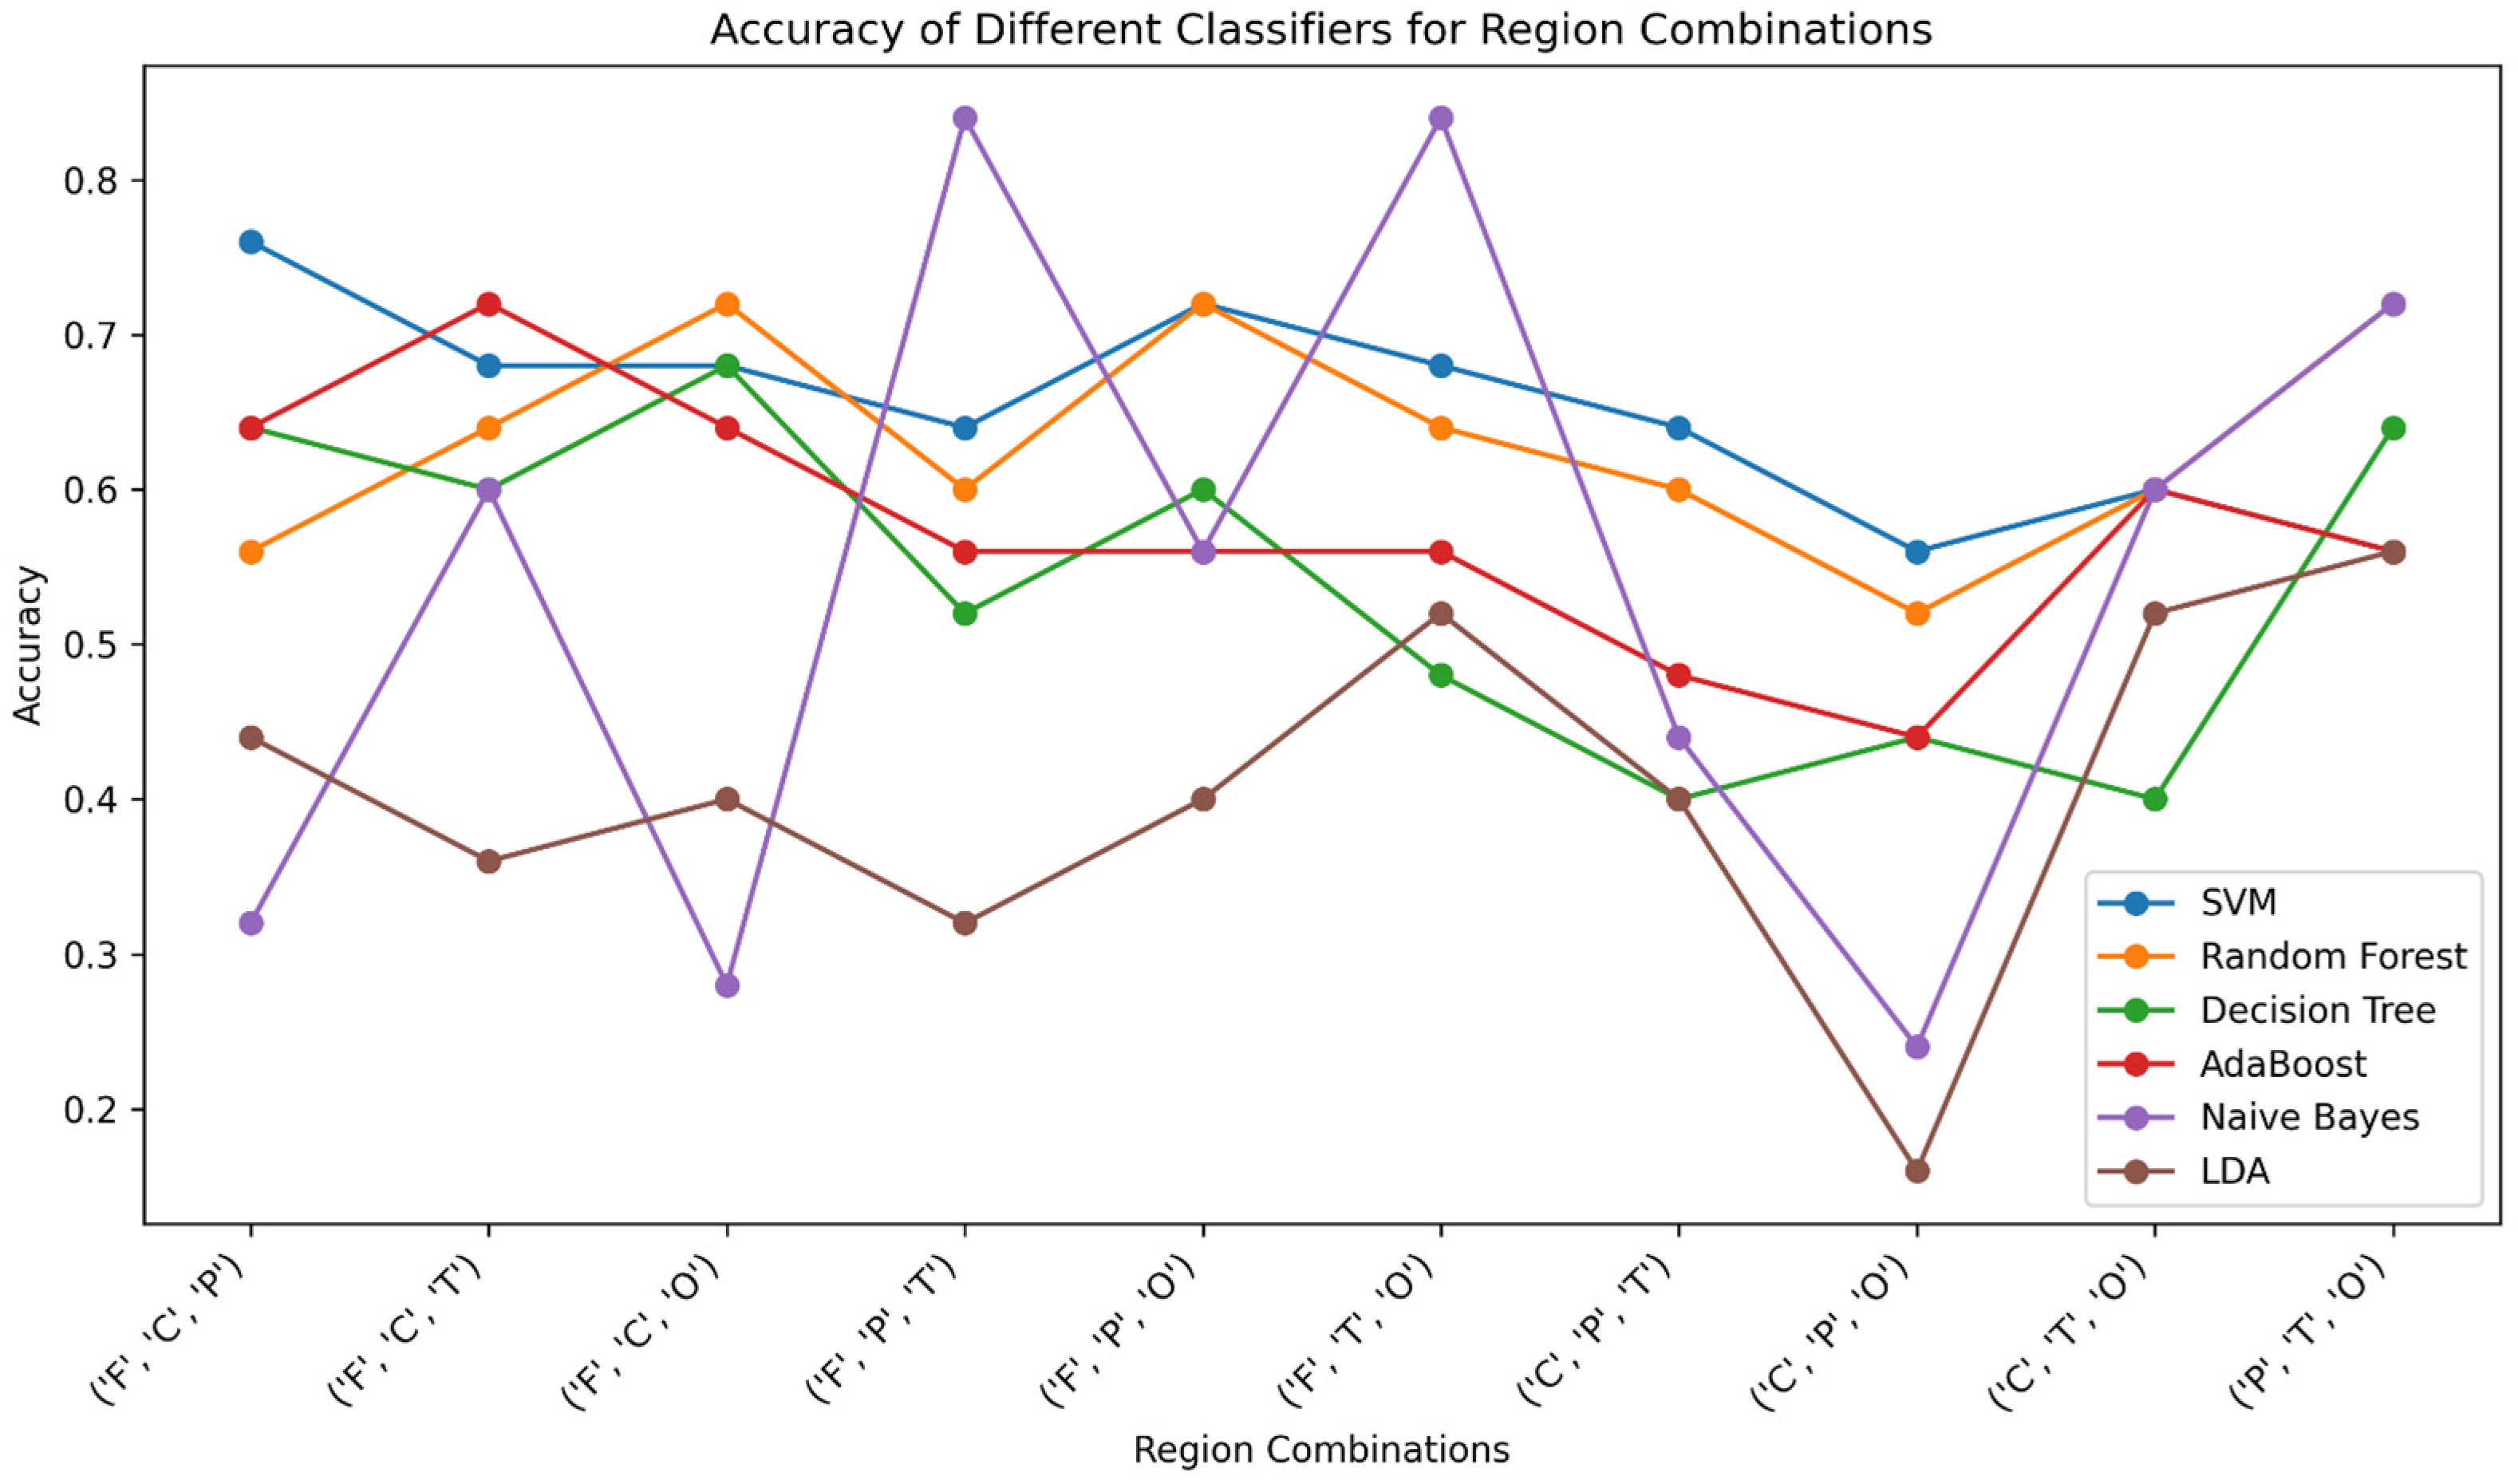
Figure 4.
AUC performance of classifiers based on different brain region combinations.
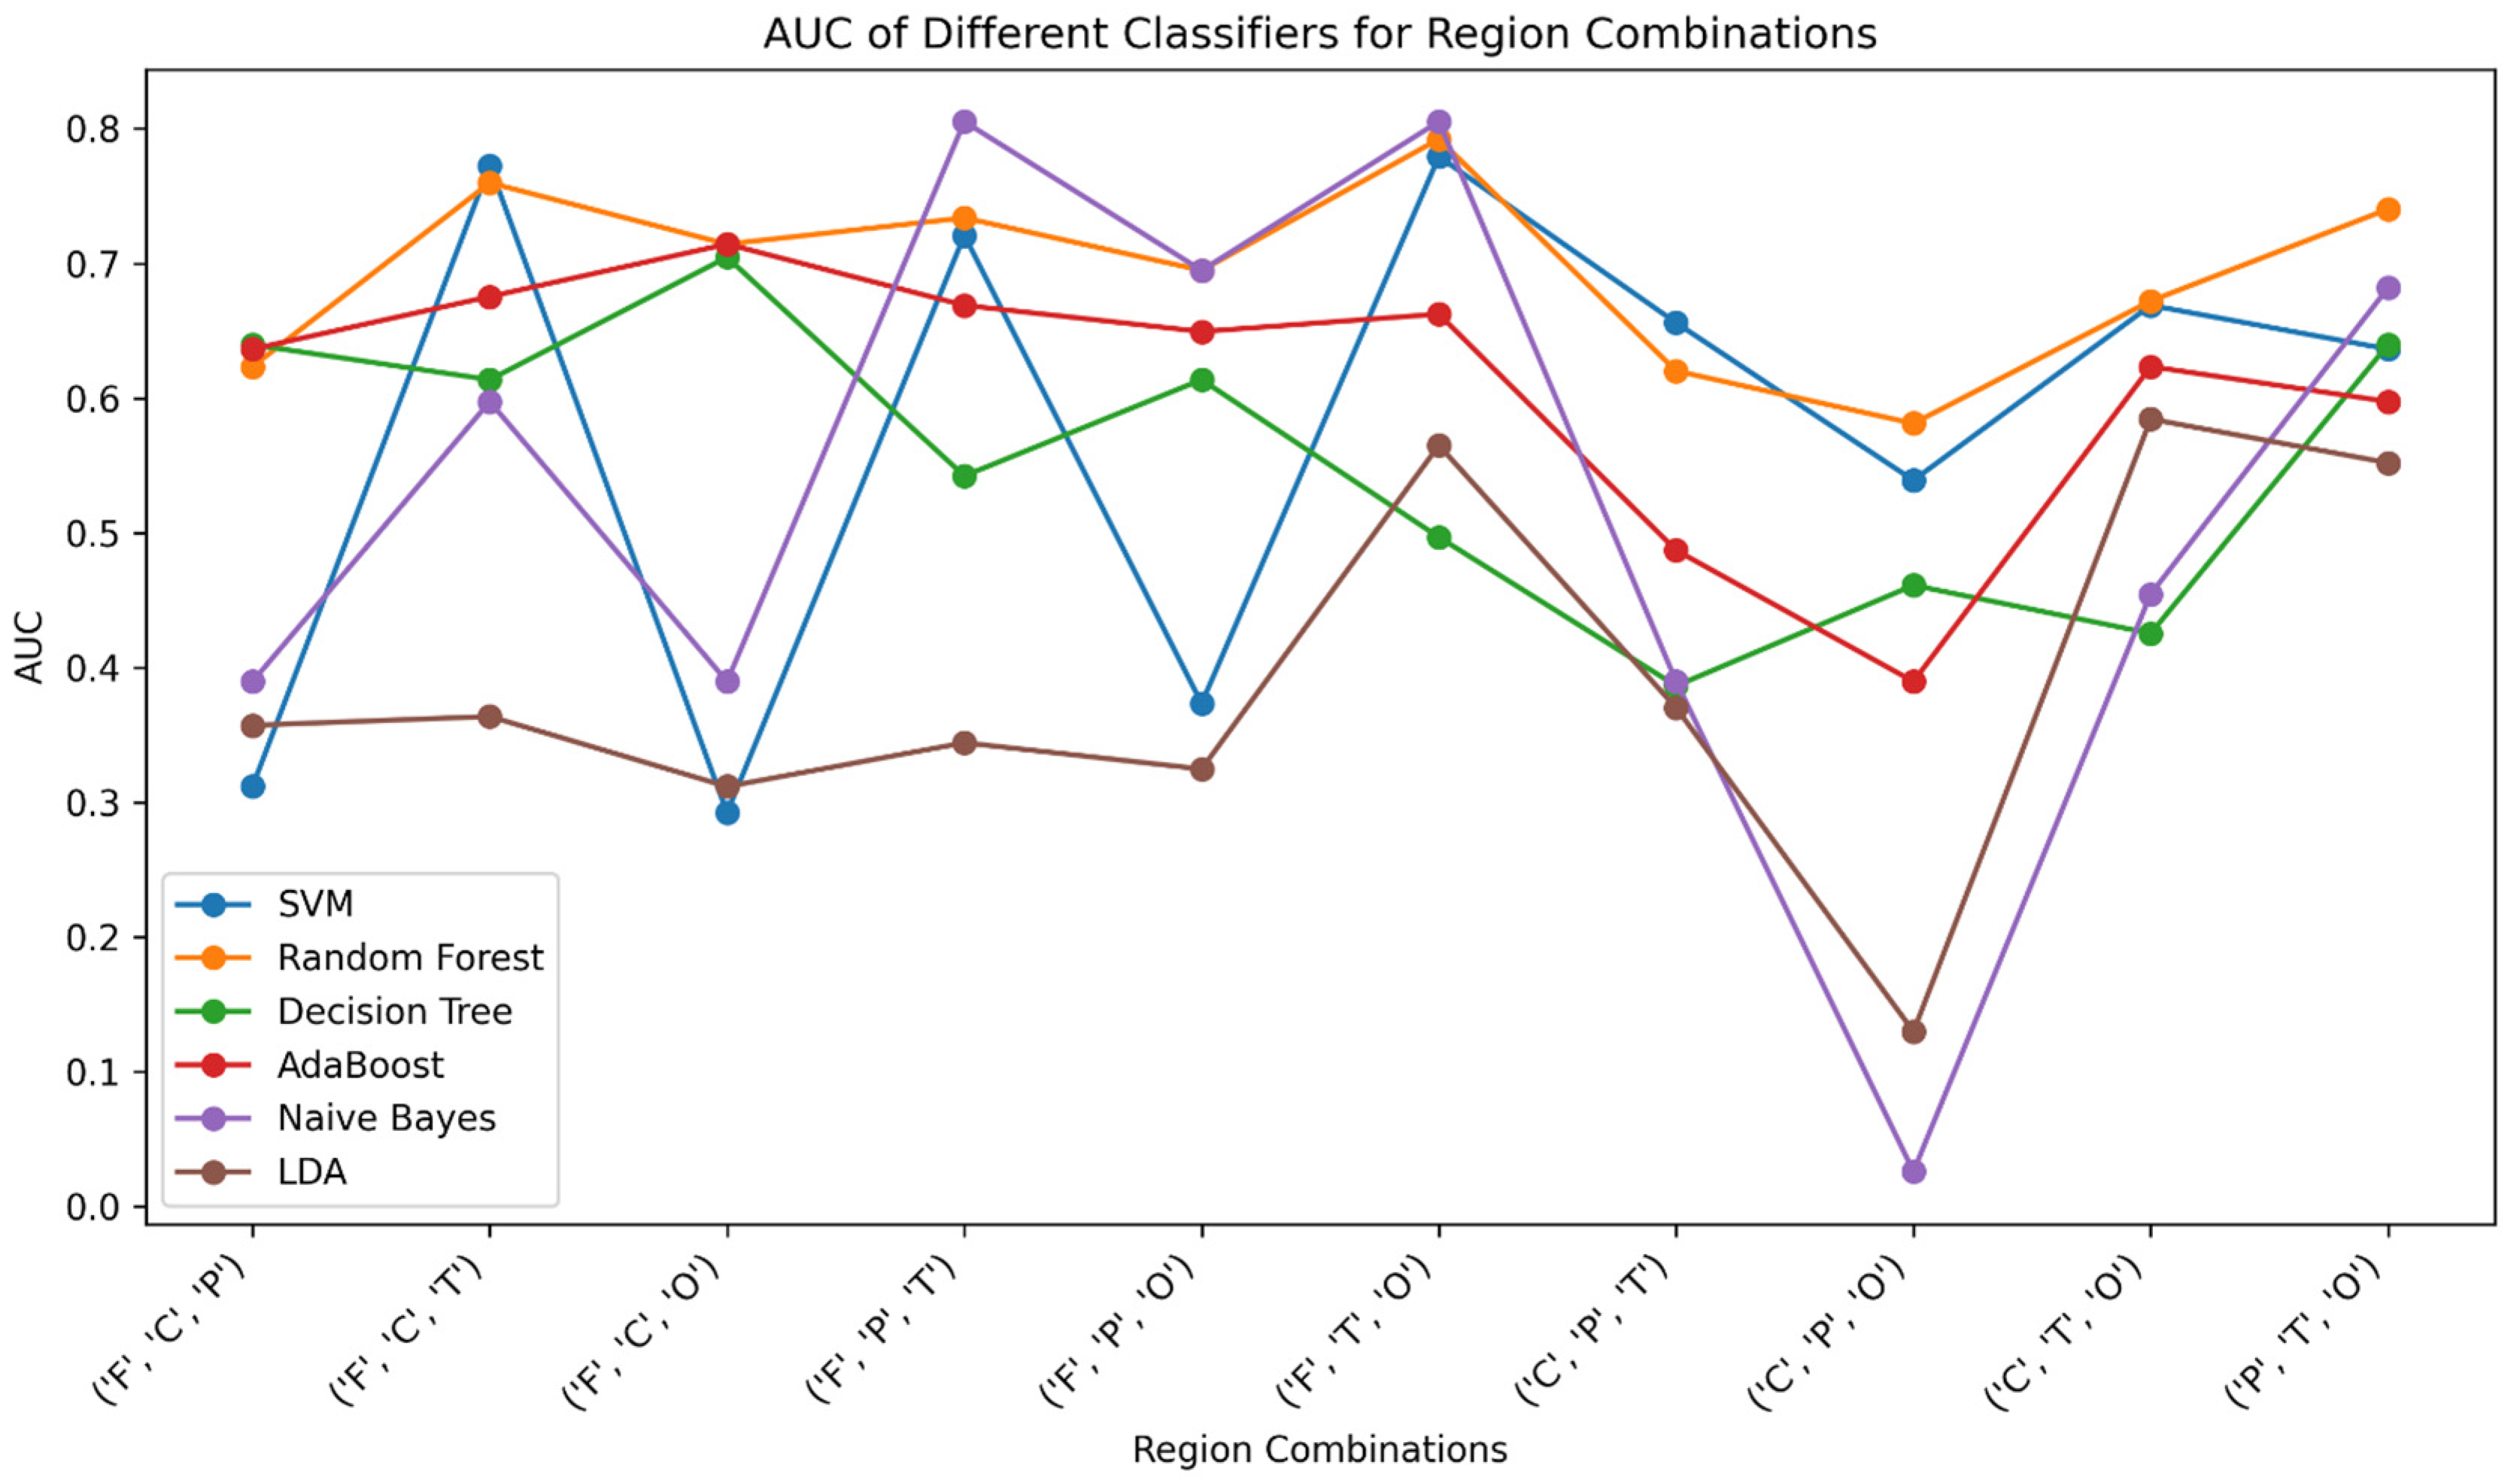
Figure 5.
Accuracy plot for classifier performance based on hemisphere-specific regions.
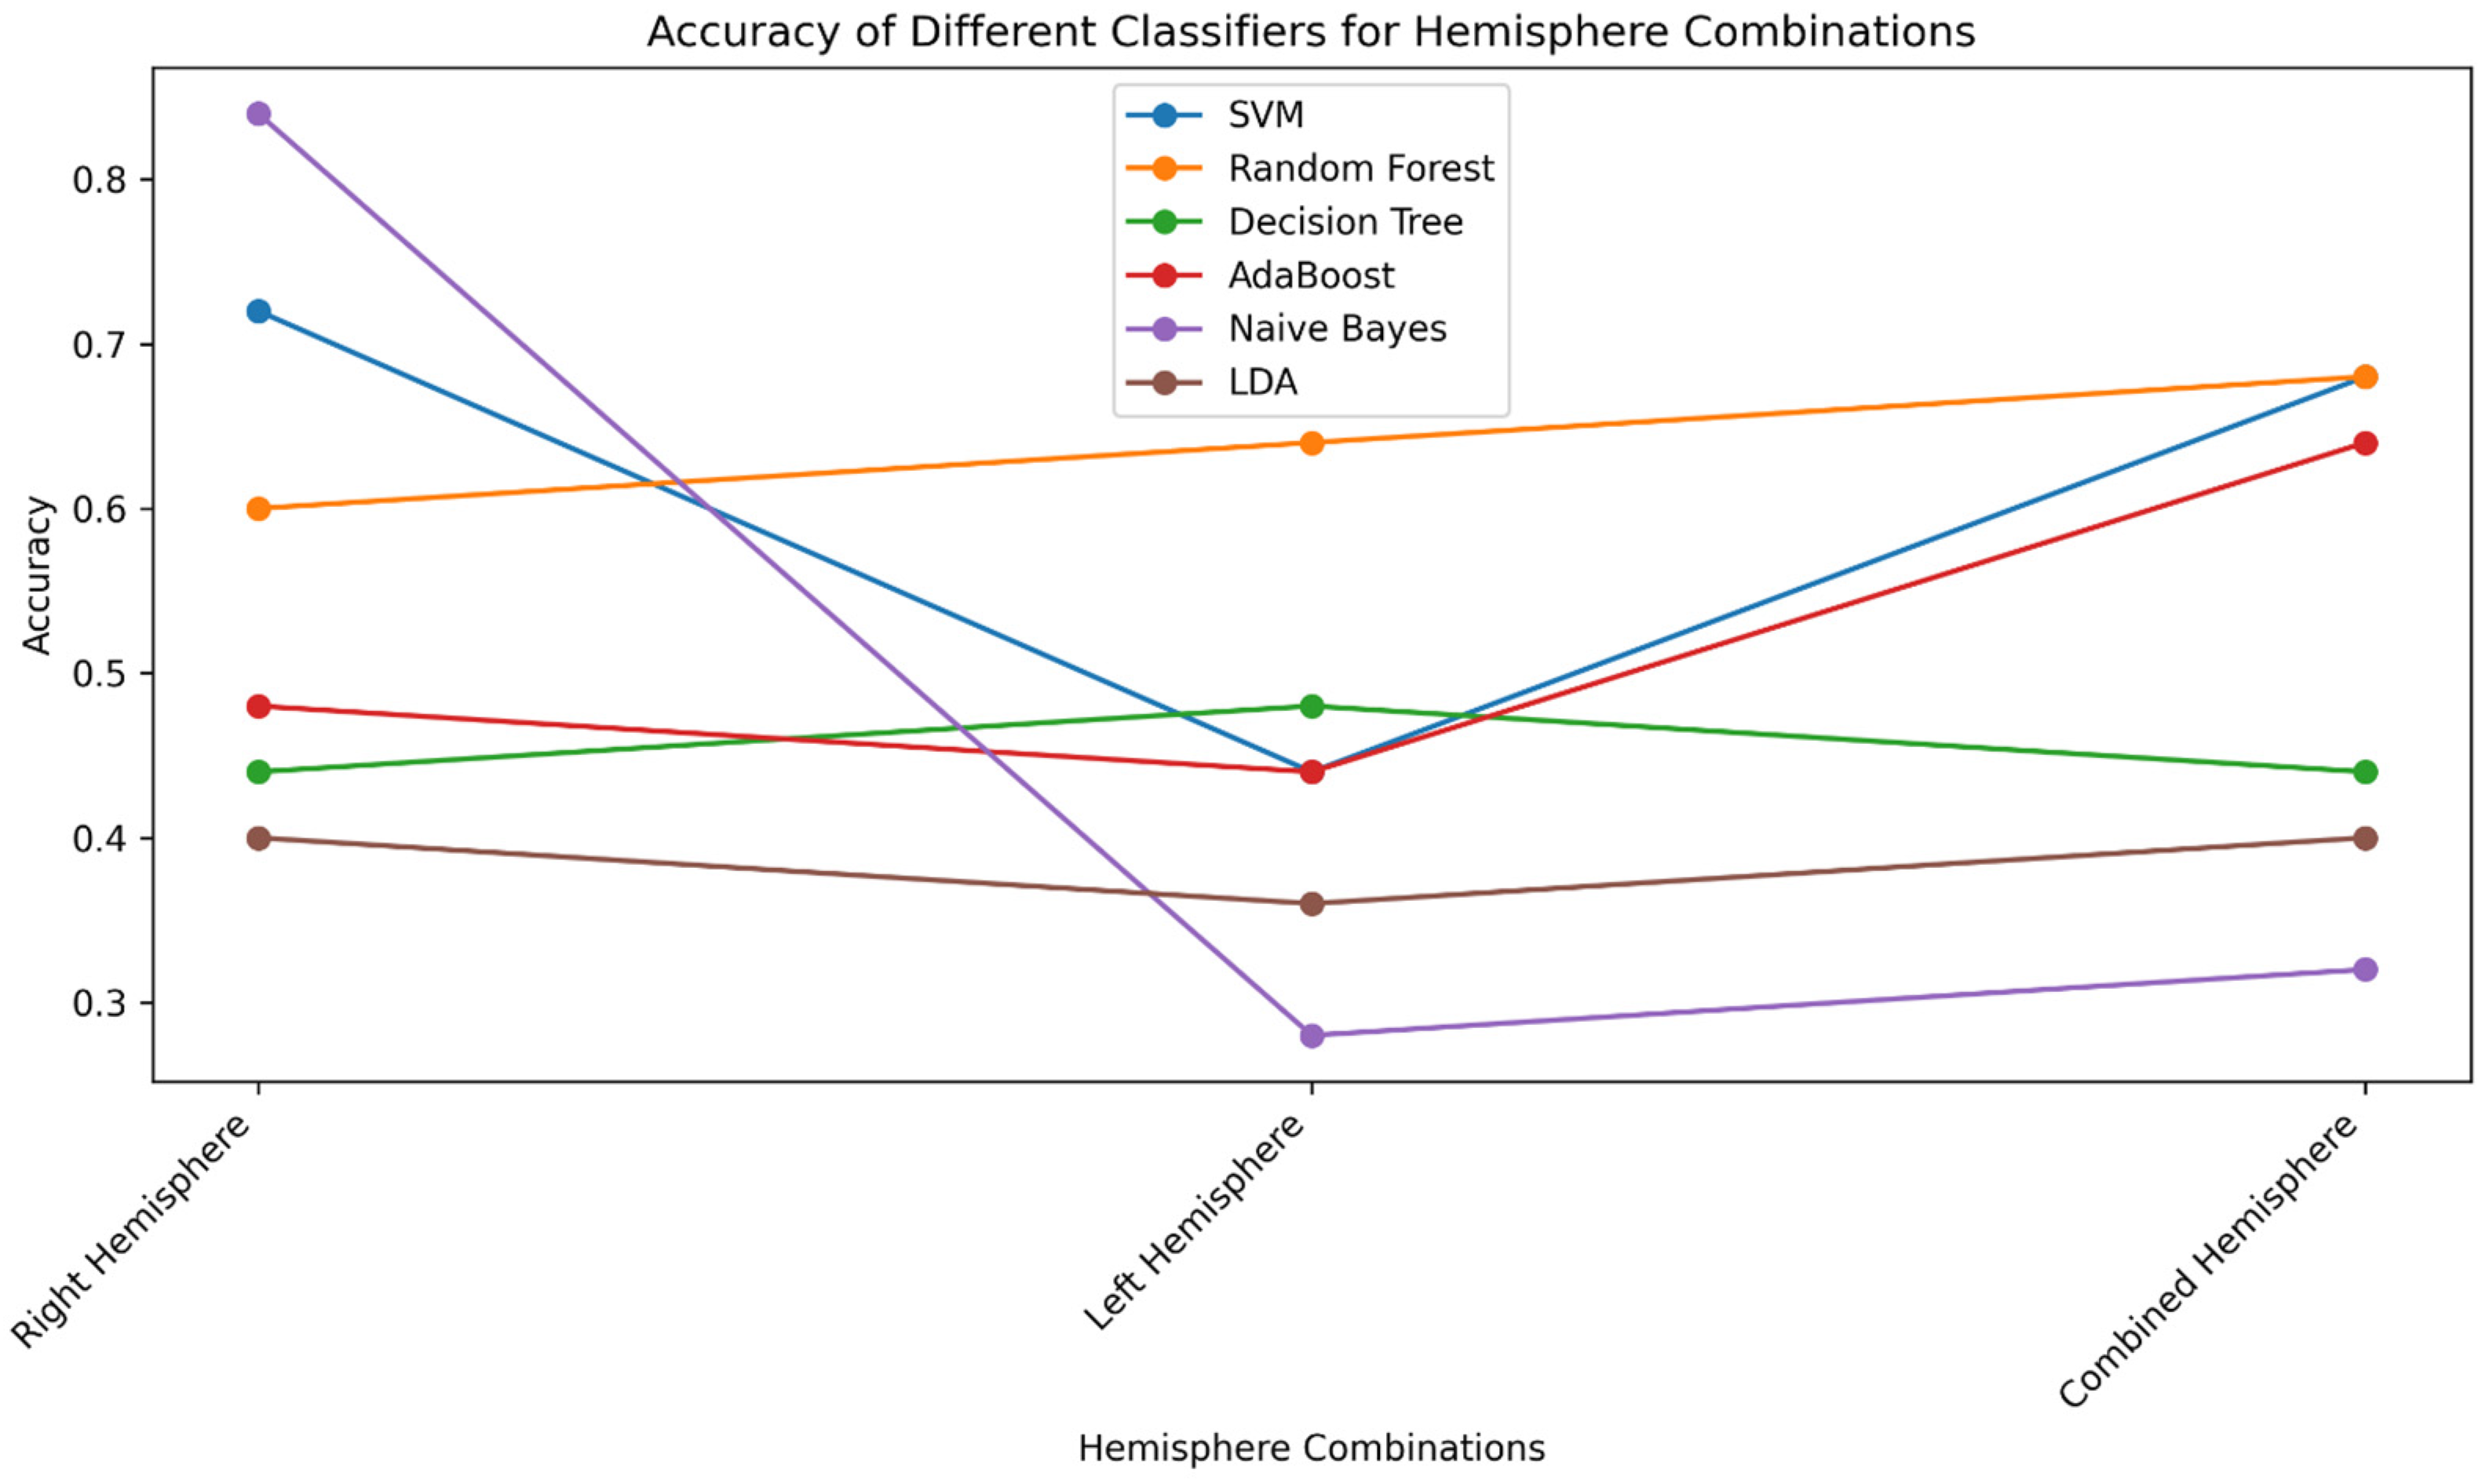
Figure 6.
AUC score plot for classifier performance across hemisphere-specific regions.


Table 1.
Brain regions and their corresponding channels.
| Regions | Combined Channels |
|---|---|
| F (frontal) | Fz, FP1, FP2, F3, F4, F7, F8 |
| C (central) | Cz, C3, C4 |
| P (parietal) | Pz, P3, P4 |
| T (temporal) | T3, T4, T5, T6 |
| O (occipital) | O1, O2 |
| Right hemisphere | FP2, F4, F8, C4, T4, P4, T6, O2 |
| Left hemisphere | C3, T3, FP1, F3, F7, P3, T5, O1 |
Table 2.
Classification accuracy using a set of 3 regional combinations.
| Combination of Brain Regions (Set of 3) | Classifiers (Accuracy) | |||||
|---|---|---|---|---|---|---|
| SVM | RF | DT | AdaBoost | Naïve Bayes | LDA | |
| F+C+P | 76 | 56 | 64 | 64 | 32 | 44 |
| F+C+T | 68 | 64 | 60 | 72 | 60 | 36 |
| F+C+O | 68 | 72 | 68 | 64 | 28 | 40 |
| F+P+T | 64 | 60 | 52 | 56 | 84 | 32 |
| F+P+O | 72 | 72 | 60 | 56 | 56 | 40 |
| F+T+O | 68 | 64 | 48 | 56 | 84 | 52 |
| C+P+T | 64 | 60 | 40 | 48 | 44 | 40 |
| C+P+O | 56 | 52 | 44 | 44 | 24 | 16 |
| C+T+O | 60 | 60 | 40 | 60 | 60 | 52 |
| P+T+O | 56 | 72 | 64 | 56 | 72 | 56 |
Table 3.
AUC performance of different brain region combinations and classifiers.
| Combination of Brain Regions (Set of 3) | Classifiers (AUC) | |||||
|---|---|---|---|---|---|---|
| SVM | RF | DT | AdaBoost | Naïve Bayes | LDA | |
| F+C+P | 31.1 | 62.3 | 63.9 | 63.6 | 38.9 | 35.7 |
| F+C+T | 77.2 | 75.9 | 61.3 | 67.5 | 59.7 | 36.6 |
| F+C+O | 29.2 | 71.4 | 70.4 | 71.4 | 38.9 | 31.1 |
| F+P+T | 72 | 73.3 | 54.2 | 66.8 | 80.5 | 34.4 |
| F+P+O | 37.6 | 69.4 | 61.3 | 64.9 | 69.4 | 32.4 |
| F+T+O | 77.9 | 79.2 | 49.6 | 66.2 | 80.5 | 56.4 |
| C+P+T | 66.2 | 62.2 | 38.6 | 48.7 | 38.9 | 37.1 |
| C+P+O | 44.8 | 58.1 | 46.1 | 38.9 | 2.5 | 12.9 |
| C+T+O | 66.8 | 67.2 | 42.5 | 62.3 | 45.4 | 58.4 |
| P+T+O | 63.6 | 74 | 63.9 | 59.7 | 68.1 | 55.19 |
Table 4.
Classification accuracy is based on specific regions.
| Brain Region | Classifiers (Accuracy) | |||||
|---|---|---|---|---|---|---|
| SVM | RF | DT | AdaBoost | Naïve Bayes | LDA | |
| Right hemisphere | 72 | 60 | 44 | 48 | 84 | 40 |
| Left hemisphere | 44 | 64 | 48 | 44 | 28 | 36 |
| Combined hemisphere | 68 | 68 | 44 | 64 | 32 | 40 |
Table 5.
AUC score based on hemispheres-specific regions.
| Brain Region | Classifiers (AUC) | |||||
|---|---|---|---|---|---|---|
| SVM | RF | DT | AdaBoost | Naïve Bayes | LDA | |
| Right hemisphere | 86.3 | 59.4 | 42.2 | 50.3 | 85.7 | 34.4 |
| Left hemisphere | 49.3 | 63.3 | 46.7 | 39.6 | 27.9 | 22.72 |
| Combined hemisphere | 28.5 | 72.7 | 44.1 | 63.6 | 48 | 28.5 |
Disclaimer/Publisher’s Note: The statements, opinions and data contained in all publications are solely those of the individual author(s) and contributor(s) and not of MDPI and/or the editor(s). MDPI and/or the editor(s) disclaim responsibility for any injury to people or property resulting from any ideas, methods, instructions or products referred to in the content. |
© 2023 by the authors. Licensee MDPI, Basel, Switzerland. This article is an open access article distributed under the terms and conditions of the Creative Commons Attribution (CC BY) license (https://creativecommons.org/licenses/by/4.0/).
Share and Cite
MDPI and ACS Style
Chauhan, N.; Choi, B.-J. Regional Contribution in Electrophysiological-Based Classifications of Attention Deficit Hyperactive Disorder (ADHD) Using Machine Learning. Computation 2023, 11, 180. https://doi.org/10.3390/computation11090180
AMA Style
Chauhan N, Choi B-J. Regional Contribution in Electrophysiological-Based Classifications of Attention Deficit Hyperactive Disorder (ADHD) Using Machine Learning. Computation. 2023; 11(9):180. https://doi.org/10.3390/computation11090180
Chicago/Turabian StyleChauhan, Nishant, and Byung-Jae Choi. 2023. "Regional Contribution in Electrophysiological-Based Classifications of Attention Deficit Hyperactive Disorder (ADHD) Using Machine Learning" Computation 11, no. 9: 180. https://doi.org/10.3390/computation11090180
Note that from the first issue of 2016, this journal uses article numbers instead of page numbers. See further details here.