
Machine Learning in X-ray Diagnosis for Oral Health: A Review of Recent Progress
by
 , , and
Mónica Vieira Martins
1,*,
Luís Baptista
1,
Henrique Luís
1,2,3,4,
Victor Assunção
1,2,3,4,
Mário-Rui Araújo
1 and
Valentim Realinho
1,5 1
Polytechnic Institute of Portalegre, 7300-110 Portalegre, Portugal
2
Faculdade de Medicina Dentária, Universidade de Lisboa, Unidade de Investigação em Ciências Orais e Biomédicas (UICOB), Rua Professora Teresa Ambrósio, 1600-277 Lisboa, Portugal
3
Faculdade de Medicina Dentária, Universidade de Lisboa, Rede de Higienistas Orais para o Desenvolvimento da Ciência (RHODes), Rua Professora Teresa Ambrósio, 1600-277 Lisboa, Portugal
4
Center for Innovative Care and Health Technology (ciTechcare), Polytechnic of Leiria, 2410-541 Leiria, Portugal
5
VALORIZA—Research Center for Endogenous Resource Valorization, 7300-555 Portalegre, Portugal
*
Author to whom correspondence should be addressed.
Computation 2023, 11(6), 115; https://doi.org/10.3390/computation11060115
Submission received: 8 May 2023
/
Revised: 5 June 2023
/
Accepted: 8 June 2023
/
Published: 10 June 2023
(This article belongs to the Special Issue Computational Medical Image Analysis)
Abstract
:The past few decades have witnessed remarkable progress in the application of artificial intelligence (AI) and machine learning (ML) in medicine, notably in medical imaging. The application of ML to dental and oral imaging has also been developed, powered by the availability of clinical dental images. The present work aims to investigate recent progress concerning the application of ML in the diagnosis of oral diseases using oral X-ray imaging, namely the quality and outcome of such methods. The specific research question was developed using the PICOT methodology. The review was conducted in the Web of Science, Science Direct, and IEEE Xplore databases, for articles reporting the use of ML and AI for diagnostic purposes in X-ray-based oral imaging. Imaging types included panoramic, periapical, bitewing X-ray images, and oral cone beam computed tomography (CBCT). The search was limited to papers published in the English language from 2018 to 2022. The initial search included 104 papers that were assessed for eligibility. Of these, 22 were included for a final appraisal. The full text of the articles was carefully analyzed and the relevant data such as the clinical application, the ML models, the metrics used to assess their performance, and the characteristics of the datasets, were registered for further analysis. The paper discusses the opportunities, challenges, and limitations found.
1. Introduction
Dental caries and periodontal disease are two of the most common dental conditions that affect people worldwide. Dental caries, also known as tooth decay, is a multifactorial disease mainly caused by the interaction of the bacteria present in dental plaque and sugars from the diet, which produces acids that erode the tooth structure [1]. Periodontitis, on the other hand, is a chronic inflammatory condition that affects the supporting structures of the teeth, including the gums, periodontal ligament, dental root cement, and alveolar bone. It is also multifactorial and is caused by the accumulation of bacterial plaque and dental calculus around the teeth, which triggers an immune response that leads to tissue destruction [2].
X-ray exams are essential diagnostic tools in dentistry. They allow oral health professionals to visualize the internal structures of the teeth and jaws, which are not visible during a clinical examination. There are several types of dental X-ray exams, including bitewing, periapical, panoramic, and cone beam computed tomography (CBCT). Bitewing X-rays are used to detect dental caries. Periapical X-rays are used to detect dental caries and bone loss due to periodontitis and periapical lesions, while panoramic and CBCT X-rays are used to evaluate the overall condition of the teeth and the upper and lower jaws, including the presence of periodontal disease and other abnormalities [3].
Dental X-rays have revolutionized the practice of dentistry by providing detailed information about oral structures. They allow dental professionals to detect dental caries, periodontal diseases, and other conditions at an early stage, which can prevent further complications and improve treatment outcomes. Dental X-rays can also reveal other conditions, such as impacted teeth, tumors, and cysts, which may not be visible during a clinical examination. Additionally, they are useful in treatment planning and monitoring the progress of ongoing treatments [4,5].
Fast-emerging artificial intelligence (AI) technology is changing many scenarios in our society. The oral health field is not an exception, mainly because of its regular use of digitized imaging and electronic health records which facilitate AI algorithms [6,7]. The science is recent and caution should be used. Human supervision is needed, but the door is open and it is important to understand the real benefits of this technology in health activities [8].
The availability of clinical dental images and the development of deep learning algorithms in recent years has led to significant improvements in the accuracy and robustness of these algorithms in supporting the diagnosis of various dental conditions.
Convolutional neural networks (CNN) [9] are a type of deep learning neural network that are considered the most prominent algorithm used, due to their high accuracy and ability to learn and extract features from images. A CNN consists of multiple layers, including convolutional, pooling, and fully connected layers. CNNs have shown remarkable performance in image classification tasks and have been widely used in a variety of fields, including medical image analysis, object detection, and natural language processing.
Transfer learning is a machine learning technique that involves the use of a pretrained model (e.g., a CNN model), which has already learned relevant features from a large image dataset, such as ImageNet [10], COCO [11], MNIST [12], CIFAR-10/100 [13], or VOC [14]. It is then fine-tuned on a smaller dataset for a specific task. Pretrained image models are used as a starting point for training the new model and the most popular pretrained image architectures include GoogLeNet Inception [15], ResNet [16], VGG [17], and Xception [18]. Among these, GoogleLeNEt Inception and ResNet hold special significance in oral health applications. GoogLeNet Inception–v3 architecture was introduced in 2014 and demonstrated excellent performance in the ImageNet Large Scale Visual Recognition Challenge. It was trained with more than a million images of 1000 object categories from the ImageNet dataset. The original architecture has 22 deep layers, allowing different scale features to be obtained by applying convolutional filters of different sizes in the same layers.
ResNet was introduced in 2015, and it has since become a foundational architecture in the field of deep learning, serving as a basis for many subsequent advancements. It addresses the problem of vanishing gradients that can occur when training very deep neural networks by using residual connections, where shortcut connections are added to bypass one or more layers.
Other works use a mixed approach that applies traditional machine learning methods, such as support vector machine (SVM) [19], k-nearest neighbors (kNN) [20], random forest [21], or extreme gradient boosting (XGBOOST) [22] for classification, using the image features previously extracted employing a CNN.
This scoping review aims to explore the current state of the art of AI-assisted diagnosis in oral health using X-ray-based images, focusing on the last five years. The specific objectives are to summarize several aspects of the current state of the art in the field and to identify limitations and research gaps that must be addressed to advance the field.
By providing a comprehensive overview of the quality and advancements of predictive models developed using artificial intelligence-based methods for oral X-ray diagnosis, this scoping review identifies trends, challenges, and gaps in the development and evaluation of these models. The review’s findings offer valuable insights into the feasibility and effectiveness of AI-based approaches in dental imaging, potentially improving diagnostic accuracy and patient outcomes in oral healthcare.
2. Methods
This review aims to obtain important insights into scientific production to identify the status of machine learning in diagnosis using X-ray-based images in oral health.
Our research questions were built using the PICOT [23] framework. The PICOT framework is widely used in healthcare research to generate specific research questions and concisely guide study design. It is an acronym that stands for population, intervention, control, outcome, and time. The PICOT elements for this review are presented in Table 1.
Therefore, the research question was formulated as follows:
“What is the quality of the predictive models being used for diagnosis in oral health using X-ray-based images?”
According to the formulated question, the systematic literature search was performed with the following inclusion criteria:
- Studies between 1 January 2018 to 31 December 2022, since the goal was to access the most recent progress in a rapidly evolving field;
- Studies with a focus on dental/oral imaging techniques based on X-rays, including cone beam computed tomography (CBCT);
- Studies with a focus on diagnostic applications. To our knowledge, this is the first paper that exclusively reviews the application of ML methods in oral health diagnosis.
The three different databases shown in Table 2 were used for information retrieval.
The search strategy was built by logical operators used for query search in the databases. Since each database uses different syntaxes for queries, a specific query was built for each one. An example of a query used is as follows:
(Dental OR Dentistry) AND (Imaging OR Images) AND (“Machine Learning” OR “Artificial Intelligence”)
The search was limited to journal articles written in the English language excluding conference papers, reviews, and editorials. The search was conducted by one reviewer (M.V.M.), who also evaluated the search results for relevance based on their title and abstract. After the remotion of duplicates, the abstracts of the papers selected for screening were evaluated by blinded pairs of researchers (M.V.M., L.B., H.L., V.A., M.R.A., V.R.) using the web app Rayyan [24]. After individual evaluation, discrepancies were solved by reaching a consensus. The full text of the selected studies was examined in detail for eligibility (M.V.M., L.B., H.L., V.A., M.R.A., V.R.). At this stage, a few papers were excluded for not meeting the inclusion criteria. Data extraction from the included publications was then performed (M.V.M., L.B., H.L., V.A., M.R.A., V.R.) and recorded in a spreadsheet. At all stages, there was complete consensus among the evaluators on the literature selection process and the classification of the publications.
The study characteristics recorded included the year of publication, country, the aim of the study, clinical application, type of X-ray images used, data source, size and partition (training, test, and validation sizes), if augmentation strategies were used, the type of task (classification, regression), machine learning models used, the metrics used to evaluate the models and their best reported values, and if human comparators were employed.
3. Results
3.1. Search and Study Selection
The Prisma [23] diagram presented in Figure 1 shows the flowchart for the study search and selection process. The initial search identified 104 papers. After the remotion of duplicates, a total of 92 papers were left for screening. During the screening phase, 52 papers were excluded. Reasons for exclusion included the study not dealing with diagnosis questions; the study did not use X-ray-based images; the metrics of the developed models were not reported. A total of 40 papers were then accessed for eligibility, and a further 18 papers were excluded for not dealing with diagnosis issues or not using X-ray images. A total of 22 papers were included in this review.
3.2. Included Studies
Some of the characteristics of the selected papers are presented in Table 3. The complete information can be found in Supplementary Table S1.
All studies included were published between 2018 and 2022, with a notable increase in the last year considered, which represented 50% of all studies (Figure 2).
The 22 included studies involved a total number of 153 researchers affiliated with 17 countries. Of these 153 researchers, 65% (n = 100) had their affiliation with institutions related to health (colleges or departments of oral health and similar, hospitals and clinics), and the rest (35%, n = 53) with institutions from areas related to computer science, physics, engineering and similar. The majority of the first authors were affiliated in China and South Korea with four papers, and the United States with three papers (Figure 3). These three countries represent 50% of the included studies.
The studies were published in sixteen different journals, with the Journal of Dentistry being the one that published the most articles, with 23% of the total (n = 5), and Diagnostics being the second one with 14% (n = 3). The remaining papers were distributed by the fourteen other sources shown in Table 4.
The keywords used in the studies (Figure 4) totalized 120 terms, with the most used being “artificial intelligence” (n = 13), followed by “machine learning” and “deep learning” (each n = 11). Less used keywords were “convolutional neural network” (n = 4), “radiography”, “supervised machine learning”, “dental caries” (each n = 3), “classification”, “digital image/radiology”, “endodontics”, “diagnosis”, “panoramic radiograph” and “cysts” (each n = 2). The rest of the terms, a total of n = 60, each appeared only in one study.
3.3. Clinical Applications, Image Types, Data Sources and Labeling
Most of the studies analyzed (n = 8) applied the machine learning models to the diagnosis of dental caries, followed by the diagnosis of periodontal diseases (n = 7), diagnosis of oral lesions (n = 4), and diagnosis of apical lesions (n = 3). A small number of papers addressed the diagnosis of implant defects (n = 1), ectopic eruption (n = 1), and impacted teeth (n = 1).
The vast majority of the studies considered in this review used periapical (n = 10) or panoramic images (n = 10), while one paper used both periapical and bitewing images. Only two papers used CBCT images. One of these used both CBCT and panoramic images. One paper did not specify the type of X-ray image being used.
Universities were the most common source of data (n = 12), followed by hospitals (n = 6). There were also studies based on external datasets (n = 2) and a small number used data from private clinics (n = 2). The majority of datasets consisted of data from a single institution. However, there was one particular paper [43] that constructed its dataset by incorporating information from two different hospitals. The papers that used external data sources did not include a description of the labeling process. Among the remaining papers, two did not describe the labeling process. Only 15 papers provided information regarding the number of annotators. They ranged from one to six annotators, with varying degrees of experience. Only seven papers provided information regarding the seniority of the annotators, which ranged from 3 to 33 years of experience. In three of those papers, the annotators had a minimum of 3 years of experience, while in four they had at least 10 years of experience.
3.4. Datasets Size, Partitions, and Data Augmentation
The majority of the 22 papers (68%, 15), use data augmentation, namely zooming, rotation, shearing, flipping, and shifting. For a reliable comparison between papers, the dataset size must consider the data augmentation process. So, for each paper where data augmentation was used, we considered the actual number of examples that fed the machine learning algorithm, instead of the original dataset size. In practical terms, data augmentation corresponds to an increment in the dataset size.
Table 5 sums up the dataset size distribution. The sizes ranged from small datasets of one hundred examples to an enormous dataset of 1,292,360 examples. Half of the datasets were below 1500 instances; only three datasets were above 100,000 instances and all the other nineteen datasets were below 50,000 instances.
Dataset images typically have many teeth, but five (23%) datasets used images with only one tooth.
Datasets are split into three sets: training, validation, and test. There were two papers that did not have information regarding the division of the dataset. In these cases, we assumed that the training set was the dataset. Half of the training sets had sizes above 87% of the dataset size, and the training set size with the minimum percentage was 60% of the dataset size.
There were four papers that did not use or had no information regarding the test set. All the other 18 papers used a test set for evaluating the ML algorithms. Usually, this is a subset from the original dataset. However, there was a particular paper [38] that used an external dataset as a test set.
Regarding the validation set, 36% (n = 8) of the papers had no information, 32% (n = 7) of the papers used cross-validation and the other 32% (n = 7) used a validation set.
3.5. Machine Learning Tasks and Models
Most of the papers addressed the machine learning application to the diagnosis in dental health as a classification task (n = 20). One study addressed the problem as a regression task, and another study used a combination of regression and generative machine learning models.
The huge majority of studies used exclusively convolutional neural networks (n = 19), but three studies used a combination of CNN and traditional algorithms. In these three studies, the approach was to use CNN for feature extraction and then traditional algorithms, such as support vector machine (n = 2), k-nearest neighbors (n = 2), naïve Bayes (n = 2), and random forest (n = 1) for classification.
Among the papers that used CNN, 41% (n = 9) used exclusively proprietary architectures. One study used both a proprietary CNN and pretrained CNNs via transfer learning.
Transfer learning was used by a considerable number of studies (n = 10), usually by changing the last layers in the original architectures and fine tuning the model with the dataset used in the paper. The preferred pretrained models were GoogLeNet Inception (n = 6), ResNet (n = 6), different versions of VGG (n = 4), Xception (n = 2) and AlexNet (n = 2). Other architectures used were DeepLab [47], Mask R-CNN [48], DETR [47], DenseNet [49], Yolo [50], MobileNet [51], and DarkNet [51] (each n = 1).
The preferred pretrained model was the GoogLeNet Inception. In several studies, GoogleLeNet Inception V3 was used as the main model for their respective classification tasks [25,30,34]. Hashem et al. used the Inception original architecture, and adjusted output layers to classify the images in one of three kinds of cysts [30]. The weights of the model were optimized by adjusting the hyperparameters including the learning rate, batch size, dropout rate, and by using batch normalization. Lee et al. also adapted the last layer for an adequate number of categories (presence or absence of dental caries), but provided less detail about the process of hyperparameter tuning [25].
Some papers used the results obtained with GoogleLeNet Inception V3 for comparison with other models, such as a proprietary model developed in the paper for a specific diagnosis task ([33] for the detection and classification of dental implants), a specific model which was optimized ([41] for AlexNet), or other pretrained models (such as DenseNet, VGG, and ResNEt-50 in [39]). Very often, when the pretrained model was used for comparison, there was a lack of detail in the description of the adaptation of the original model to the specific task being handled.
ResNet was the other preferred pretrained model used in the selected papers. ResNet was used by Cha et al. for training a classification model created for sorting upper and lower periapical radiographs [35]. The weights of the pretrained model were used, with the last connected layer modified to meet the number of classes (upper and lower maxillary). The radiograph image was then fed into another model trained specially for the upper or lower maxillary. This second set of models used a version of the R-CNN architecture for localizing the implants and finding key points, thus allowing the calculation of the marginal bone loss ratio. Li et al. use a modification of the ResNet-18 to detect the crown categories (caries or normal) and root categories (periapical periodontitis/normal) of the tooth. For a single tooth, the model needed to be executed twice: the first time to obtain the dental root results and the second time to obtain the dental crown results. It was, however, not clear how the modified model was trained on the available dataset [37].
In the study conducted by Feher et al., the authors employed an approach that combined object detection and image segmentation of anatomical structures to predict two classes of cysts: odontogenic and non-odontogenic [43]. The object detection model consisted of a feature pyramid network using a pretrained ResNet as the backbone that outputs a bounding box with the location of the cysts. In parallel, a pretrained U-Net segmentation model was used to obtain relevant anatomical structures, such as the maxilla, mandible, mandibular canal, maxillary sinuses, dentition, and individual teeth. The overlap of the detection boxes and segmented anatomical structures was computed, and fed into a random forest classifier for cyst classification. Tsoromokos et al. used an architecture named faster R-CNN, an object detection network based on R-CNN and fast-RCNN [45]. The objective was to classify teeth in periapical images as caries or non-caries. The main architecture was composed of a feature extraction network, a regional proposal network, and a prediction and localization network. The feature extraction component used the pretrained weights of ResNet, and the global model was trained with a small dataset of 720 instances. The paper omitted the details of how validation was performed.
Bui et al. focused on extracting pertinent features to optimize the classification of tooth images as either caries or non-caries [34]. Several well-known pretrained models, such as AlexNet, Inception, VGG, ResNet, and Xception were used to extract deep-activated features. Experiments were performed to find out which deep layer (before the prediction layer) provided the highest performance features. At this stage, it is worth noting that no details were provided regarding the parameters used for feature extraction with each model. The extracted features were then fused with statistical and texture features computed at the pixel level, such as mean, contrast, entropy, or correlation. The fused set of features was fed into traditional machine learning algorithms, such as SVM, NB, KNN, DT, and RF to obtain a prediction of the two categories. Sunnetci et al. had a similar approach but with the aim of classifying the images as periodontal bone loss or non-periodontal bone loss [46]. The paper used pretrained AlexNet and SqueezeNet to extract features from a defined deep layer in each model. The deep image features were then fed to algorithms such as kNN, NB, SVM, and tree ensemble algorithms that performed the classification task. The paper also referred to the use of efficient net for comparison purposes, but no further details were provided. Geetha et al. had a similar but simpler approach, where a segmentation algorithm using an adaptive threshold and morphological processing was used for statistical feature extraction [28]. The extracted features were then fed into a neural network with one hidden layer used to classify the images as either caries or normal. The results were compared with the results from methods such as SVM, kNN, and XGBoost. It is worth mentioning that this was one of the papers where it was not possible to identify the test set used. It was also one of the papers with the smallest training dataset, which justified the simple neural network used.
In the study conducted by Endres et al., a 26-layer U-net-based architecture was employed for image segmentation [29]. This methodology was specifically designed to detect radiolucent alteration in panoramic images. Those alterations are common radiographic findings that have a differential diagnosis including infections, granuloma, cysts, and tumors. The model outputs an intensity map indicating regions of high or low confidence for containing a radiolucent periapical alteration.
The YOLO algorithm was used by Tajima et al. to detect cyst-like radiolucent lesions of the jaws [42]. The YOLO algorithm has gained significant attention in the field of computer vision and medical imaging, as it predicts the bounding boxes and class probabilities directly from the full image in one pass. The model described in the paper used 75 convolutional layers and the ResNet structure for feature extraction, followed by a deep learning network to generate the bounding boxes where the lesions were present. The metrics reported were all above 90%, but few details were provided regarding the deep network employed.
Ekert et al. developed a seven layer neural network to classify panoramic images into apical or non-apical lesions [26]. The network contained four convolutional layers and two dense layers. The architecture was optimized for the numbers of neuronal units, the number of filters for each particular convolutional layer, the kernel sizes, the configurations of the max pooling layers and the dropout layers. A relatively small dataset with fewer than 3000 images was used. The authors justified the preference for custom-made architecture by the fact that more complex, state-of-the-art pretrained models caused overfitting with their limited-size dataset. Similar work was performed by Kros et al., but for the task of detecting periodontal bone loss [27].
In the study conducted by Hashem et al., conventional procedures for image segmentation and feature extraction were employed [31]. Subsequently, these extracted features were then fed into neural networks to classify the images and determine the presence of infection. The authors referred to the use of four different models of deep neural networks. However, the information provided does not allow us to understand the architectures, or how the models were trained with a small dataset of 80 images.
Liu et al. devised a deep neural architecture specifically designed for the identification of ectopic eruptions from panoramic images [38]. It consisted of one first and three last plain convolutional layers, with middle layers for feature extraction. These middle layers used specific kernels for position-wise and channel-wise feature extraction. The model was trained with defined parameters with a dataset of 2960 region images from children’s panoramic images. No information was provided on how the validation was performed. Interestingly, this paper used an independent dataset collected from another hospital as an external testing set.
The authors of [32] used a simplified adaptation of DenseNet to develop a model for segmentation and lesion detection with CBCT images. The input for the model was both images and oral-anatomical knowledge, such as constraints regarding the spatial location of lesions, the connection of restorative material, or the location of the background. The rationale behind the incorporation of anatomical knowledge was to limit the search space for the deep learning algorithm to find the optimal parameters. The model was trained on a very small dataset of 100 slices of CBCT images. It is not clear what test set was used.
One paper employed generative adversarial networks (GAN) to facilitate the measurement of clinical attachment levels [36]. GANs are a class of machine learning models that consist of a generator and a discriminator, competing against each other to generate realistic data and distinguish it from real data, respectively. The authors developed a GAN to predict the out-of-view anatomy in bitewing images for the measurement of clinical attachment levels. The generative adversarial network with partial convolutions comprises two generators and three discriminator CNNs. An encoder-decoder generator focuses the network on the missing regions of the images and fills in missing anatomy, while an encoder-decoder generator encourages the overall realism of the image and helps refine the predictions. The intermediate prediction images resulting from the GAN are fed into a refined encoder-decoder generator, a pretrained VGG discriminator and a final discriminator. The resulting images are then fed into deep learning open-source prediction algorithms (DETR and DeepLab). The model was trained, validated, and tested in a large set of some thousand teeth images.
A deep neural network based on UNet and Trans-UNET was developed by Ying et al. for carie segmentation [40]. Trans-UNet is an extension of UNet introduced in 2001 [52] that incorporates transformer modules, inspired by the success of transformers in natural language processing tasks. Trans-UNet combines convolutional and self-attention mechanisms to improve the modeling capability of UNet. The proposed model was trained with a small dataset of 800 teeth images extracted from periapical images. Despite the high metric values obtained, the authors recognized that the training set might be too small to train the deep architecture. There was no information on how validation was performed.
3.6. Outcome Metrics and Model Performance
The studies based on classification tasks all used a combination of two or more metrics to evaluate the model’s performance. The minimum number of metrics used was two, the maximum was seven, and the mean was 4.75. Recall, also referred to as sensitivity or true positive rate (n = 17), precision, also referred to as positive predictive value (n = 16), specificity, also referred to as true negative rate (n = 14), and F1 score, also referred to as the Dice coefficient (n = 13), were the most used metrics. Other metrics commonly used were accuracy (n = 9), receiver operating characteristic–area under curve (n = 8), and negative predictive value (n = 7). Confusion matrices, false positive rate, precision-recall curve, Youden’s index, and Matthews correlation coefficient were also used in the classification studies.
The regression studies used a smaller group of metrics to access model performance, namely mean absolute error, mean bias error (n = 1), and mean squared error (n = 1).
The values reported for model performance vary widely. Table 6 presents the average, minimum, and maximum values of the most used metrics, computed over the best reported values in each study. Average values were above 0.81 and below 0.93; maximum values were very high and between 0.96 and 1.0; minimum values ranged between 0.51 and 0.85. The lowest average values were obtained for precision and F1 score and the highest was obtained for ROC-AUC.
The lowest values for recall, precision, and F1 score were obtained in a study using panoramic images for the diagnosis of apical lesions and a dataset size of 3099. The lowest values of specificity and negative predictive value were reported in a study using panoramic images for the diagnosis of oral lesions and a dataset of 800 images. The lowest values of accuracy and ROC-AUC were also obtained with panoramic images, for the diagnosis of periodontal diseases (dataset size 2538), and of oral lesions (dataset size 120), respectively.
The highest value of recall was obtained in a study that used CBCT images for the diagnosis of oral lesions, and a dataset size of 170,525. The highest values of precision, specificity, F1 score, and accuracy were obtained in a study using panoramic images for the diagnosis of oral lesions, with a dataset size of 1546. The best value for ROC-AUC was reported in a study using periapical images for the diagnosis of implant defects, with a dataset size of 533. The highest value of NPV was reported in a study using panoramic images for the diagnosis of apical lesions, with a dataset size of 2877.
The study that used both CBCT and panoramic images obtained higher performance metrics for the models that used CBCT images. The study that used periapical and panoramic images obtained higher performance models using the periapical images.
3.7. Human Comparators
Only a small number of studies (n = 5) compared the machine learning model’s performance with human performance. Those were all classification tasks, with dataset sizes ranging from 708 to 7924 instances, and using either proprietary CNN or pretrained models via transfer learning [10,11,12,13,14]. The number of dentists ranged from one junior dentist to twenty-four oral and maxillofacial surgeons (OMF). The reported experience ranged from 3 to 10 years. Most of the studies (n = 4) concluded that the machine learning models reached a similar diagnostic performance to experienced dentists. One of the studies that used a high number of experts [29] additionally concluded that the ML model outperformed 58% of OMF surgeons. Another of these studies [38] additionally found that the ML algorithm was much faster at reaching a similar to human performance and that the best detection performance was obtained by human experts assisted by the automatic model.
One study [37] found that the ML model achieved significantly higher performance than that of young dentists, and, with the assistance of the model, the experts not only reached a higher diagnostic accuracy but also increased interobserver agreement.
4. Discussion
The growth in the number of published studies that investigate the use of machine learning techniques in X-ray diagnostics for oral health demonstrates the growing interest that the field has aroused in the scientific community. Most of the researchers involved in these publications are affiliated with clinical institutions and the majority of the papers were published in clinical journals, as opposed to technical journals. Moreover, the majority of those clinical journals belong to the specific clinical field of oral health (Journal of Dentistry, Journal of Oral and Maxillofacial Surgery, Medicine, and Pathology, International Dental Journal, Journal of Endodontics, Oral Diseases). These facts are in contrast with previous literature reviews [53], and seem to indicate an evolution in the maturity of the field. The focus of the research is slowly being displaced from the technical development of the models to an initial stage in the evaluation of their use as a potential clinical tool.
The sizes of the datasets and the ML strategies used vary widely in the studies analyzed in this review. There seems to be a relation between the dataset sizes and the use of pretrained machine learning models. For instance, the average size of the datasets when pretrained models were used was above 21,000, instances; even if the largest dataset was not considered, while slightly below 2000 instances when proprietary architectures were used. Interestingly, there were two small datasets with less than 500 instances that used pretrained models with accuracy results above 0.95.
Several limitations regarding the data were identified in the reviewed studies. Some of these problems are common in the application of ML to other areas of medical imaging as well. One major limitation is that datasets are often constructed using data from a single institution, which limits their generality and heterogeneity. To minimize potential biases, datasets should be as diverse as possible. Additionally, a significant number of studies rely on small datasets with poorly described curation processes. There is often a lack of adequate description of dataset characteristics, such as category distribution. For large datasets collected over long periods of time, the diversity of data acquisition (clinical protocols and equipment) was not always clear. The issue of labeling is also relevant. Usually, multiple annotators are necessary to obtain a gold standard label for the data. In the revised studies, it was not always identified how the quality of the labeling process through multiple annotators was assured. For instance, in some cases the task was performed by a single annotator. In other cases, it was unclear how disagreements were resolved. Additionally, some studies lacked information on the annotation procedures employed.
The analysis of the performance of the models did not allow us to draw plain conclusions, either concerning the type of image being used, the ML approach, the clinical application or the dataset size. For instance, some of the best results were obtained for panoramic images, and some of the worst results were also obtained for panoramic images. Some of the highest performance models were obtained with big datasets, but some others with datasets with as low as 533 instances, data augmentation included. On the other hand, some of the worst performance models were obtained with datasets with several thousand instances. These results are in line with the findings of other reviews [53] and seem to indicate the need for the standardization of procedures.
Some of the studies analyzed displayed a few limitations in their described methodology. Frequently, there was a lack of information regarding the validation procedure or the nature of the test set used. These are two aspects that serve as reference in machine learning, ensuring the prevention of data leakage that can lead to falsely inflated metric values. The absence of such information raises concerns about the actual quality of the reported models. It was also observed that the information provided on model training was not always sufficiently comprehensive. In some cases, there was a lack of information on the hyperparameters used or the strategy employed to select specific parameters.
No single ML approach could be identified as “the best” approach in the analyzed papers. They encompass a wide range of ML methods, including vanilla methods using transfer learning from pretrained models, as well as custom state-of-the-art approaches using transformers or GANs. Due to the diverse characteristics of the datasets, tasks, and metrics employed, making meaningful comparisons becomes challenging. Unlike other areas where ML is used in medical imaging, the absence of large, curated datasets that can serve as benchmarks also hinders any comparison. The lack of reporting standards further complicates this task.
Indeed, the lack of standardized experimental design and reporting in machine learning research, including oral health applications, contrasts with the presence of reporting guidelines commonly used in the medical field. While existing standards, such as TRIPOD [54] and PROBAST [55], might not perfectly fit ML research in medical imaging, efforts should be made to adhere to reporting guidelines. The upcoming extension to TRIPOD and PROBAST for AI applications [56], which are also relevant for oral health applications, is a positive development. In the meantime, there are checklists available that can and should serve as guidance for researchers and reviewers [57,58]. One approach that might contribute to the progressive adoption and acceptance of ML technology in oral health is the application of formal methods [59]. Formal verification techniques can provide guarantees on the robustness and generalizability of the models, aiding in the detection of potential biases, and therefore contributing to enhancing the reliability, explainability and trustworthiness of the diagnostic systems. However, collaboration and further research are necessary to refine and expand the use of formal methods of ML in healthcare, namely in oral health diagnosis. Only a small number of studies compared the performance of the machine learning models with dentists. Notably, in all cases, the models matched or outperformed the dentists. The main conclusion to be drawn is that the assistance of AI seems to help experts improve their diagnosis performance, especially in interpreting difficult cases [38]. These are very interesting results, which need to be confirmed by future investigations, along with their implications in the clinical setting.
Indeed, the majority of studies focused primarily on the technical aspects of the automated diagnosis of oral conditions, with limited exploration of the broader healthcare implications. While the technical components of these systems are unquestionably important, it is crucial to also consider the impact of these innovations on patient care and clinical decision-making as the field progresses. Adopting a more comprehensive approach that takes into account both technological advancements and healthcare perspectives could be beneficial for future research endeavors.
Finally, it is crucial to address the complex ethical considerations surrounding privacy and algorithm biases. These issues require careful attention and consideration to ensure that patient privacy is protected and that the algorithms used do not perpetuate biases. Addressing these ethical concerns is essential for the responsible development and deployment of AI technologies in oral healthcare.
This paper acknowledges some limitations. First, our query, although capturing a considerable number of papers, was relatively simple, might not have captured some relevant articles on the subject while including many unrelated papers not pertaining to diagnosis in oral health. Second, the omission of more specific terms in the query may have resulted in overlooking potentially relevant literature that could have provided further insights into our research topic. Additionally, to enhance the comprehensiveness of the review, it would have been beneficial to supplement the systematic search with snowballing techniques. These techniques involve reviewing the reference lists of identified articles and conducting citation searches to identify additional relevant studies that may have been missed in the initial search. Moreover, by not including the PubMed database, we may have overlooked papers published in biomedical or clinical journals. Future work should consider incorporating both snowballing techniques and a more specific query, including a search in the PubMed database, to address these limitations and enhance the quality of the research.
5. Conclusions
The application of AI in the diagnosis of oral health issues using X-ray-based images is a rapidly developing field. There is still a clear need for further investigation of the role of AI in dental diagnosis in the clinical setting. The present review of the literature seems to indicate that the field should naturally evolve toward the use of predictive models as an effective, stable and sustainable beneficial tool for oral health professionals performing diagnosis.
Supplementary Materials
The following supporting information can be downloaded at: https://www.mdpi.com/article/10.3390/computation11060115/s1, Table S1: Papers included in the review and their characteristics.
Author Contributions
Conceptualization, methodology, investigation: M.V.M., L.B., H.L., V.A., M.-R.A. and V.R.; formal analysis: M.V.M., L.B. and V.R.; data curation: M.V.M.; writing—original draft preparation: M.V.M., L.B. and V.A.; writing—review and editing: H.L., V.A. and M.-R.A.; visualization: V.R.; project administration: M.V.M. All authors have read and agreed to the published version of the manuscript.
Funding
This research was funded by national funds through the Fundação para a Ciência e a Tecnologia. I.P. (Portuguese Foundation for Science and Technology) by the project UIDB/05064/2020 (VALORIZA—Research Centre for Endogenous Resource Valorization).
Data Availability Statement
All relevant data are available through the paper and Supplementary Material. Additional information is available from the authors upon reasonable request.
Conflicts of Interest
The authors declare no conflict of interest. The funders had no role in the design of the study; in the collection. analyses. or interpretation of data; in the writing of the manuscript; or in the decision to publish the results.
References
- Pitts, N.B.; Zero, D.T.; Marsh, P.D.; Ekstrand, K.; Weintraub, J.A.; Ramos-Gomez, F.; Tagami, J.; Twetman, S.; Tsakos, G.; Ismail, A. Dental Caries. Nat. Rev. Dis. Prim. 2017, 3, 17030. [Google Scholar] [CrossRef] [Green Version]
- Kinane, D.F.; Stathopoulou, P.G.; Papapanou, P.N. Periodontal Diseases. Nat. Rev. Dis. Prim. 2017, 3, 17038. [Google Scholar] [CrossRef]
- The Use of Dental Radiographs: Update and Recommendations. J. Am. Dent. Assoc. 2006, 137, 1304–1312. [CrossRef]
- Ludlow, J.B.; Ivanovic, M. Comparative Dosimetry of Dental CBCT Devices and 64-Slice CT for Oral and Maxillofacial Radiology. Oral Surg. Oral Med. Oral Pathol. Oral Radiol. 2008, 106, 106–114. [Google Scholar] [CrossRef]
- Tadinada, A. Dental Radiography BT. In Evidence-Based Oral Surgery: A Clinical Guide for the General Dental Practitioner; Ferneini, E.M., Goupil, M.T., Eds.; Springer International Publishing: Cham, Switzerland, 2019; pp. 67–90. ISBN 978-3-319-91361-2. [Google Scholar]
- Shan, T.; Tay, F.R.; Gu, L. Application of Artificial Intelligence in Dentistry. J. Dent. Res. 2021, 100, 232–244. [Google Scholar] [CrossRef]
- Carrillo-Perez, F.; Pecho, O.E.; Morales, J.C.; Paravina, R.D.; Della Bona, A.; Ghinea, R.; Pulgar, R.; Pérez, M.D.M.; Herrera, L.J. Applications of Artificial Intelligence in Dentistry: A Comprehensive Review. J. Esthet. Restor. Dent. 2022, 34, 259–280. [Google Scholar] [CrossRef]
- Mahdi, S.S.; Battineni, G.; Khawaja, M.; Allana, R.; Siddiqui, M.K.; Agha, D. How Does Artificial Intelligence Impact Digital Healthcare Initiatives? A Review of AI Applications in Dental Healthcare. Int. J. Inf. Manag. Data Insights 2023, 3, 100144. [Google Scholar] [CrossRef]
- LeCun, Y.; Bottou, L.; Bengio, Y.; Haffner, P. Gradient-Based Learning Applied to Document Recognition. Proc. IEEE 1998, 86, 2278–2324. [Google Scholar] [CrossRef] [Green Version]
- Deng, J.; Dong, W.; Socher, R.; Li, L.-J.; Li, K.; Li, F.-F. ImageNet: A Large-Scale Hierarchical Image Database. In Proceedings of the 2009 IEEE Conference on Computer Vision and Pattern Recognition, Miami, FL, USA, 20–25 June 2009. [Google Scholar]
- Lin, T.-Y.; Maire, M.; Belongie, S.; Hays, J.; Perona, P.; Ramanan, D.; Dollár, P.; Zitnick, C.L. Microsoft COCO: Common Objects in Context BT. In Computer Vision—ECCV 2014; Fleet, D., Pajdla, T., Schiele, B., Tuytelaars, T., Eds.; Springer International Publishing: Cham, Switzerland, 2014; pp. 740–755. [Google Scholar]
- Deng, L. Digit Images for Machine Learning Research. IEEE Signal Process. Mag. 2012, 29, 141–142. [Google Scholar] [CrossRef]
- Krizhevsky, A. Learning Multiple Layers of Features from Tiny Images. 2009. Available online: https://www.cs.toronto.edu/~kriz/learning-features-2009-TR.pdf (accessed on 5 May 2023).
- Everingham, M.; Eslami, S.M.A.; Van Gool, L.; Williams, C.K.I.; Winn, J.; Zisserman, A. The Pascal Visual Object Classes Challenge: A Retrospective. Int. J. Comput. Vis. 2015, 111, 98–136. [Google Scholar] [CrossRef]
- Szegedy, C.; Liu, W.; Jia, Y.; Sermanet, P.; Reed, S.; Anguelov, D.; Erhan, D.; Vanhoucke, V.; Rabinovich, A. Going Deeper with Convolutions. In Proceedings of the 2015 IEEE Conference on Computer Vision and Pattern Recognition (CVPR), Boston, MA, USA, 7–12 June 2015. [Google Scholar]
- He, K.; Zhang, X.; Ren, S.; Sun, J. Deep Residual Learning for Image Recognition. In Proceedings of the 2016 IEEE Conference on Computer Vision and Pattern Recognition (CVPR), Las Vegas, NV, USA, 27–30 June 2016. [Google Scholar]
- Simonyan, K.; Zisserman, A. Very Deep Convolutional Networks for Large-Scale Image Recognition. In Proceedings of the 3rd International Conference on Learning Representations, ICLR 2015, San Diego, CA, USA, 7–9 May 2015. [Google Scholar]
- Chollet, F. Xception: Deep Learning with Depthwise Separable Convolutions. In Proceedings of the 2017 IEEE Conference on Computer Vision and Pattern Recognition (CVPR), Honolulu, HI, USA, 21–26 July 2017. [Google Scholar]
- Cortes, C.; Vapnik, V. Support-Vector Networks. Mach. Learn. 1995, 20, 273–297. [Google Scholar] [CrossRef]
- Fix, E.; Hodges, J.L. Discriminatory Analysis. Nonparametric Discrimination: Consistency Properties. Int. Stat. Rev. 1989, 57, 238–247. [Google Scholar] [CrossRef]
- Breiman, L. Random Forests. Mach. Learn. 2001, 45, 5–32. [Google Scholar] [CrossRef] [Green Version]
- Chen, T.; Guestrin, C. XGBoost: A Scalable Tree Boosting System. In Proceedings of the ACM SIGKDD International Conference on Knowledge Discovery and Data Mining, Washington DC USA, 14–18 August 2016. [Google Scholar]
- Huang, X.; Lin, J.; Demner-Fushman, D. Evaluation of PICO as a Knowledge Representation for Clinical Questions. AMIA Annu. Symp. Proc. AMIA Symp. 2006, 2006, 359–363. [Google Scholar]
- Ouzzani, M.; Hammady, H.; Fedorowicz, Z.; Elmagarmid, A. Rayyan-a Web and Mobile App for Systematic Reviews. Syst. Rev. 2016, 5, 210. [Google Scholar] [CrossRef] [Green Version]
- Lee, J.H.; Kim, D.H.; Jeong, S.N.; Choi, S.H. Detection and Diagnosis of Dental Caries Using a Deep Learning-Based Convolutional Neural Network Algorithm. J. Dent. 2018, 77, 106–111. [Google Scholar] [CrossRef]
- Ekert, T.; Krois, J.; Meinhold, L.; Elhennawy, K.; Emara, R.; Golla, T.; Schwendicke, F. Deep Learning for the Radiographic Detection of Apical Lesions. J. Endod. 2019, 45, 917–922.e5. [Google Scholar] [CrossRef]
- Krois, J.; Ekert, T.; Meinhold, L.; Golla, T.; Kharbot, B.; Wittemeier, A.; Dörfer, C.; Schwendicke, F. Deep Learning for the Radiographic Detection of Periodontal Bone Loss. Sci. Rep. 2019, 9, 8495. [Google Scholar] [CrossRef] [Green Version]
- Geetha, V.; Aprameya, K.S.; Hinduja, D.M. Dental Caries Diagnosis in Digital Radiographs Using Back-Propagation Neural Network. Health Inf. Sci. Syst. 2020, 8, 8. [Google Scholar] [CrossRef]
- Endres, M.G.; Hillen, F.; Salloumis, M.; Sedaghat, A.R.; Niehues, S.M.; Quatela, O.; Hanken, H.; Smeets, R.; Beck-Broichsitter, B.; Rendenbach, C.; et al. Development of a Deep Learning Algorithm for Periapical Disease Detection in Dental Radiographs. Diagnostics 2020, 10, 430. [Google Scholar] [CrossRef]
- Lee, J.H.; Kim, D.H.; Jeong, S.N. Diagnosis of Cystic Lesions Using Panoramic and Cone Beam Computed Tomographic Images Based on Deep Learning Neural Network. Oral Dis. 2020, 26, 152–158. [Google Scholar] [CrossRef]
- Hashem, M.; Youssef, A.E. Teeth Infection and Fatigue Prediction Using Optimized Neural Networks and Big Data Analytic Tool. Clust. Comput. 2020, 23, 1669–1682. [Google Scholar] [CrossRef]
- Zheng, Z.; Yan, H.; Setzer, F.C.; Shi, K.J.; Mupparapu, M.; Li, J. Anatomically Constrained Deep Learning for Automating Dental CBCT Segmentation and Lesion Detection. IEEE Trans. Autom. Sci. Eng. 2021, 18, 603–614. [Google Scholar] [CrossRef]
- Lee, D.W.; Kim, S.Y.; Jeong, S.N.; Lee, J.H. Artificial Intelligence in Fractured Dental Implant Detection and Classification: Evaluation Using Dataset from Two Dental Hospitals. Diagnostics 2021, 11, 233. [Google Scholar] [CrossRef] [PubMed]
- Bui, T.H.; Hamamoto, K.; Paing, M.P. Deep Fusion Feature Extraction for Caries Detection on Dental Panoramic Radiographs. Appl. Sci. 2021, 11, 2005. [Google Scholar] [CrossRef]
- Cha, J.Y.; Yoon, H.I.; Yeo, I.S.; Huh, K.H.; Han, J.S. Peri-Implant Bone Loss Measurement Using a Region-Based Convolutional Neural Network on Dental Periapical Radiographs. J. Clin. Med. 2021, 10, 1009. [Google Scholar] [CrossRef]
- Kearney, V.P.; Yansane, A.I.M.; Brandon, R.G.; Vaderhobli, R.; Lin, G.H.; Hekmatian, H.; Deng, W.; Joshi, N.; Bhandari, H.; Sadat, A.S.; et al. A Generative Adversarial Inpainting Network to Enhance Prediction of Periodontal Clinical Attachment Level. J. Dent. 2022, 123, 104211. [Google Scholar] [CrossRef] [PubMed]
- Li, S.; Liu, J.; Zhou, Z.; Zhou, Z.; Wu, X.; Li, Y.; Wang, S.; Liao, W.; Ying, S.; Zhao, Z. Artificial Intelligence for Caries and Periapical Periodontitis Detection. J. Dent. 2022, 122, 104107. [Google Scholar] [CrossRef]
- Liu, J.; Liu, Y.; Li, S.; Ying, S.; Zheng, L.; Zhao, Z. Artificial Intelligence-Aided Detection of Ectopic Eruption of Maxillary First Molars Based on Panoramic Radiographs. J. Dent. 2022, 125, 104239. [Google Scholar] [CrossRef]
- Aljabri, M.; Aljameel, S.S.; Min-Allah, N.; Alhuthayfi, J.; Alghamdi, L.; Alduhailan, N.; Alfehaid, R.; Alqarawi, R.; Alhareky, M.; Shahin, S.Y.; et al. Canine Impaction Classification from Panoramic Dental Radiographic Images Using Deep Learning Models. Inform. Med. Unlocked 2022, 30, 100918. [Google Scholar] [CrossRef]
- Ying, S.; Wang, B.; Zhu, H.; Liu, W.; Huang, F. Caries Segmentation on Tooth X-Ray Images with a Deep Network. J. Dent. 2022, 119, 104076. [Google Scholar] [CrossRef] [PubMed]
- Imak, A.; Celebi, A.; Siddique, K.; Turkoglu, M.; Sengur, A.; Salam, I. Dental Caries Detection Using Score-Based Multi-Input Deep Convolutional Neural Network. IEEE Access 2022, 10, 18320–18329. [Google Scholar] [CrossRef]
- Tajima, S.; Okamoto, Y.; Kobayashi, T.; Kiwaki, M.; Sonoda, C.; Tomie, K.; Saito, H.; Ishikawa, Y.; Takayoshi, S. Development of an Automatic Detection Model Using Artificial Intelligence for the Detection of Cyst-like Radiolucent Lesions of the Jaws on Panoramic Radiographs with Small Training Datasets. J. Oral Maxillofac. Surg. Med. Pathol. 2022, 34, 553–560. [Google Scholar] [CrossRef]
- Feher, B.; Krois, J. Emulating Clinical Diagnostic Reasoning for Jaw Cysts with Machine Learning. Diagnostics 2022, 12, 1968. [Google Scholar] [CrossRef]
- Tsoromokos, N.; Parinussa, S.; Claessen, F.; Moin, D.A.; Loos, B.G. Estimation of Alveolar Bone Loss in Periodontitis Using Machine Learning. Int. Dent. J. 2022, 72, 621–627. [Google Scholar] [CrossRef] [PubMed]
- Zhu, Y.; Xu, T.; Peng, L.; Cao, Y.; Zhao, X.; Li, S.; Zhao, Y.; Meng, F.; Ding, J.; Liang, S. Faster-RCNN Based Intelligent Detection and Localization of Dental Caries. Displays 2022, 74, 102201. [Google Scholar] [CrossRef]
- Muhammed Sunnetci, K.; Ulukaya, S.; Alkan, A. Periodontal Bone Loss Detection Based on Hybrid Deep Learning and Machine Learning Models with a User-Friendly Application. Biomed. Signal Process. Control 2022, 77, 103844. [Google Scholar] [CrossRef]
- Chen, L.C.; Papandreou, G.; Kokkinos, I.; Murphy, K.; Yuille, A.L. DeepLab: Semantic Image Segmentation with Deep Convolutional Nets, Atrous Convolution, and Fully Connected CRFs. IEEE Trans. Pattern Anal. Mach. Intell. 2018, 40, 834–848. [Google Scholar] [CrossRef] [Green Version]
- He, K.; Gkioxari, G.; Dollár, P.; Girshick, R. Mask R-CNN. IEEE Trans. Pattern Anal. Mach. Intell. 2020, 42, 386–397. [Google Scholar] [CrossRef]
- Huang, G.; Liu, Z.; Van Der Maaten, L.; Weinberger, K.Q. Densely Connected Convolutional Networks. In Proceedings of the 2017 IEEE Conference on Computer Vision and Pattern Recognition (CVPR), Honolulu, HI, USA, 21–26 July 2017; pp. 2261–2269. [Google Scholar] [CrossRef] [Green Version]
- Redmon, J.; Divvala, S.; Girshick, R.; Farhadi, A. You Only Look Once: Unified, Real-Time Object Detection. In Proceedings of the 2016 IEEE Conference on Computer Vision and Pattern Recognition (CVPR), Las Vegas, NV, USA, 27–30 June 2016; pp. 779–788. [Google Scholar] [CrossRef] [Green Version]
- Sandler, M.; Howard, A.; Zhu, M.; Zhmoginov, A.; Chen, L.C. MobileNetV2: Inverted Residuals and Linear Bottlenecks. In Proceedings of the 2018 IEEE/CVF Conference on Computer Vision and Pattern Recognition, Salt Lake City, UT, USA, 18–23 June 2018; pp. 4510–4520. [Google Scholar] [CrossRef] [Green Version]
- Chen, J.; Lu, Y.; Yu, Q.; Luo, X.; Adeli, E.; Wang, Y.; Lu, L.; Yuille, A.L.; Zhou, Y. TransUNet: Transformers Make Strong Encoders for Medical Image Segmentation. arXiv 2021, arXiv:2102.04306. [Google Scholar]
- Schwendicke, F.; Golla, T.; Dreher, M.; Krois, J. Convolutional Neural Networks for Dental Image Diagnostics: A Scoping Review. J. Dent. 2019, 91, 103226. [Google Scholar] [CrossRef]
- Collins, G.S.; Reitsma, J.B.; Altman, D.G.; Moons, K.G.M. Transparent Reporting of a Multivariable Prediction Model for Individual Prognosis or Diagnosis (TRIPOD): The TRIPOD Statement. BMC Med. 2015, 13, 1. [Google Scholar] [CrossRef] [Green Version]
- Wolff, R.F.; Moons, K.G.M.; Riley, R.D.; Whiting, P.F.; Westwood, M.; Collins, G.S.; Reitsma, J.B.; Kleijnen, J.; Mallett, S. PROBAST: A Tool to Assess the Risk of Bias and Applicability of Prediction Model Studies. Ann. Intern. Med. 2019, 170, 51–58. [Google Scholar] [CrossRef] [PubMed] [Green Version]
- Collins, G.S.; Dhiman, P.; Navarro, C.L.A.; Ma, J.; Hooft, L.; Reitsma, J.B.; Logullo, P.; Beam, A.L.; Peng, L.; Van Calster, B.; et al. Protocol for Development of a Reporting Guideline (TRIPOD-AI) and Risk of Bias Tool (PROBAST-AI) for Diagnostic and Prognostic Prediction Model Studies Based on Artificial Intelligence. BMJ Open 2021, 11, e048008. [Google Scholar] [CrossRef] [PubMed]
- Schwendicke, F.; Singh, T.; Lee, J.H.; Gaudin, R.; Chaurasia, A.; Wiegand, T.; Uribe, S.; Krois, J. Artificial Intelligence in Dental Research: Checklist for Authors, Reviewers, Readers. J. Dent. 2021, 107, 103610. [Google Scholar] [CrossRef] [PubMed]
- Norgeot, B.; Quer, G.; Beaulieu-Jones, B.K.; Torkamani, A.; Dias, R.; Gianfrancesco, M.; Arnaout, R.; Kohane, I.S.; Saria, S.; Topol, E.; et al. Minimum Information about Clinical Artificial Intelligence Modeling: The MI-CLAIM Checklist. Nat. Med. 2020, 26, 1320–1324. [Google Scholar] [CrossRef]
- Bonfanti, S.; Gargantini, A.; Mashkoor, A. A Systematic Literature Review of the Use of Formal Methods in Medical Software Systems. J. Softw. Evol. Process 2018, 30, e1943. [Google Scholar] [CrossRef]
Figure 1.
Flowchart of the search, where n represents the number of papers.
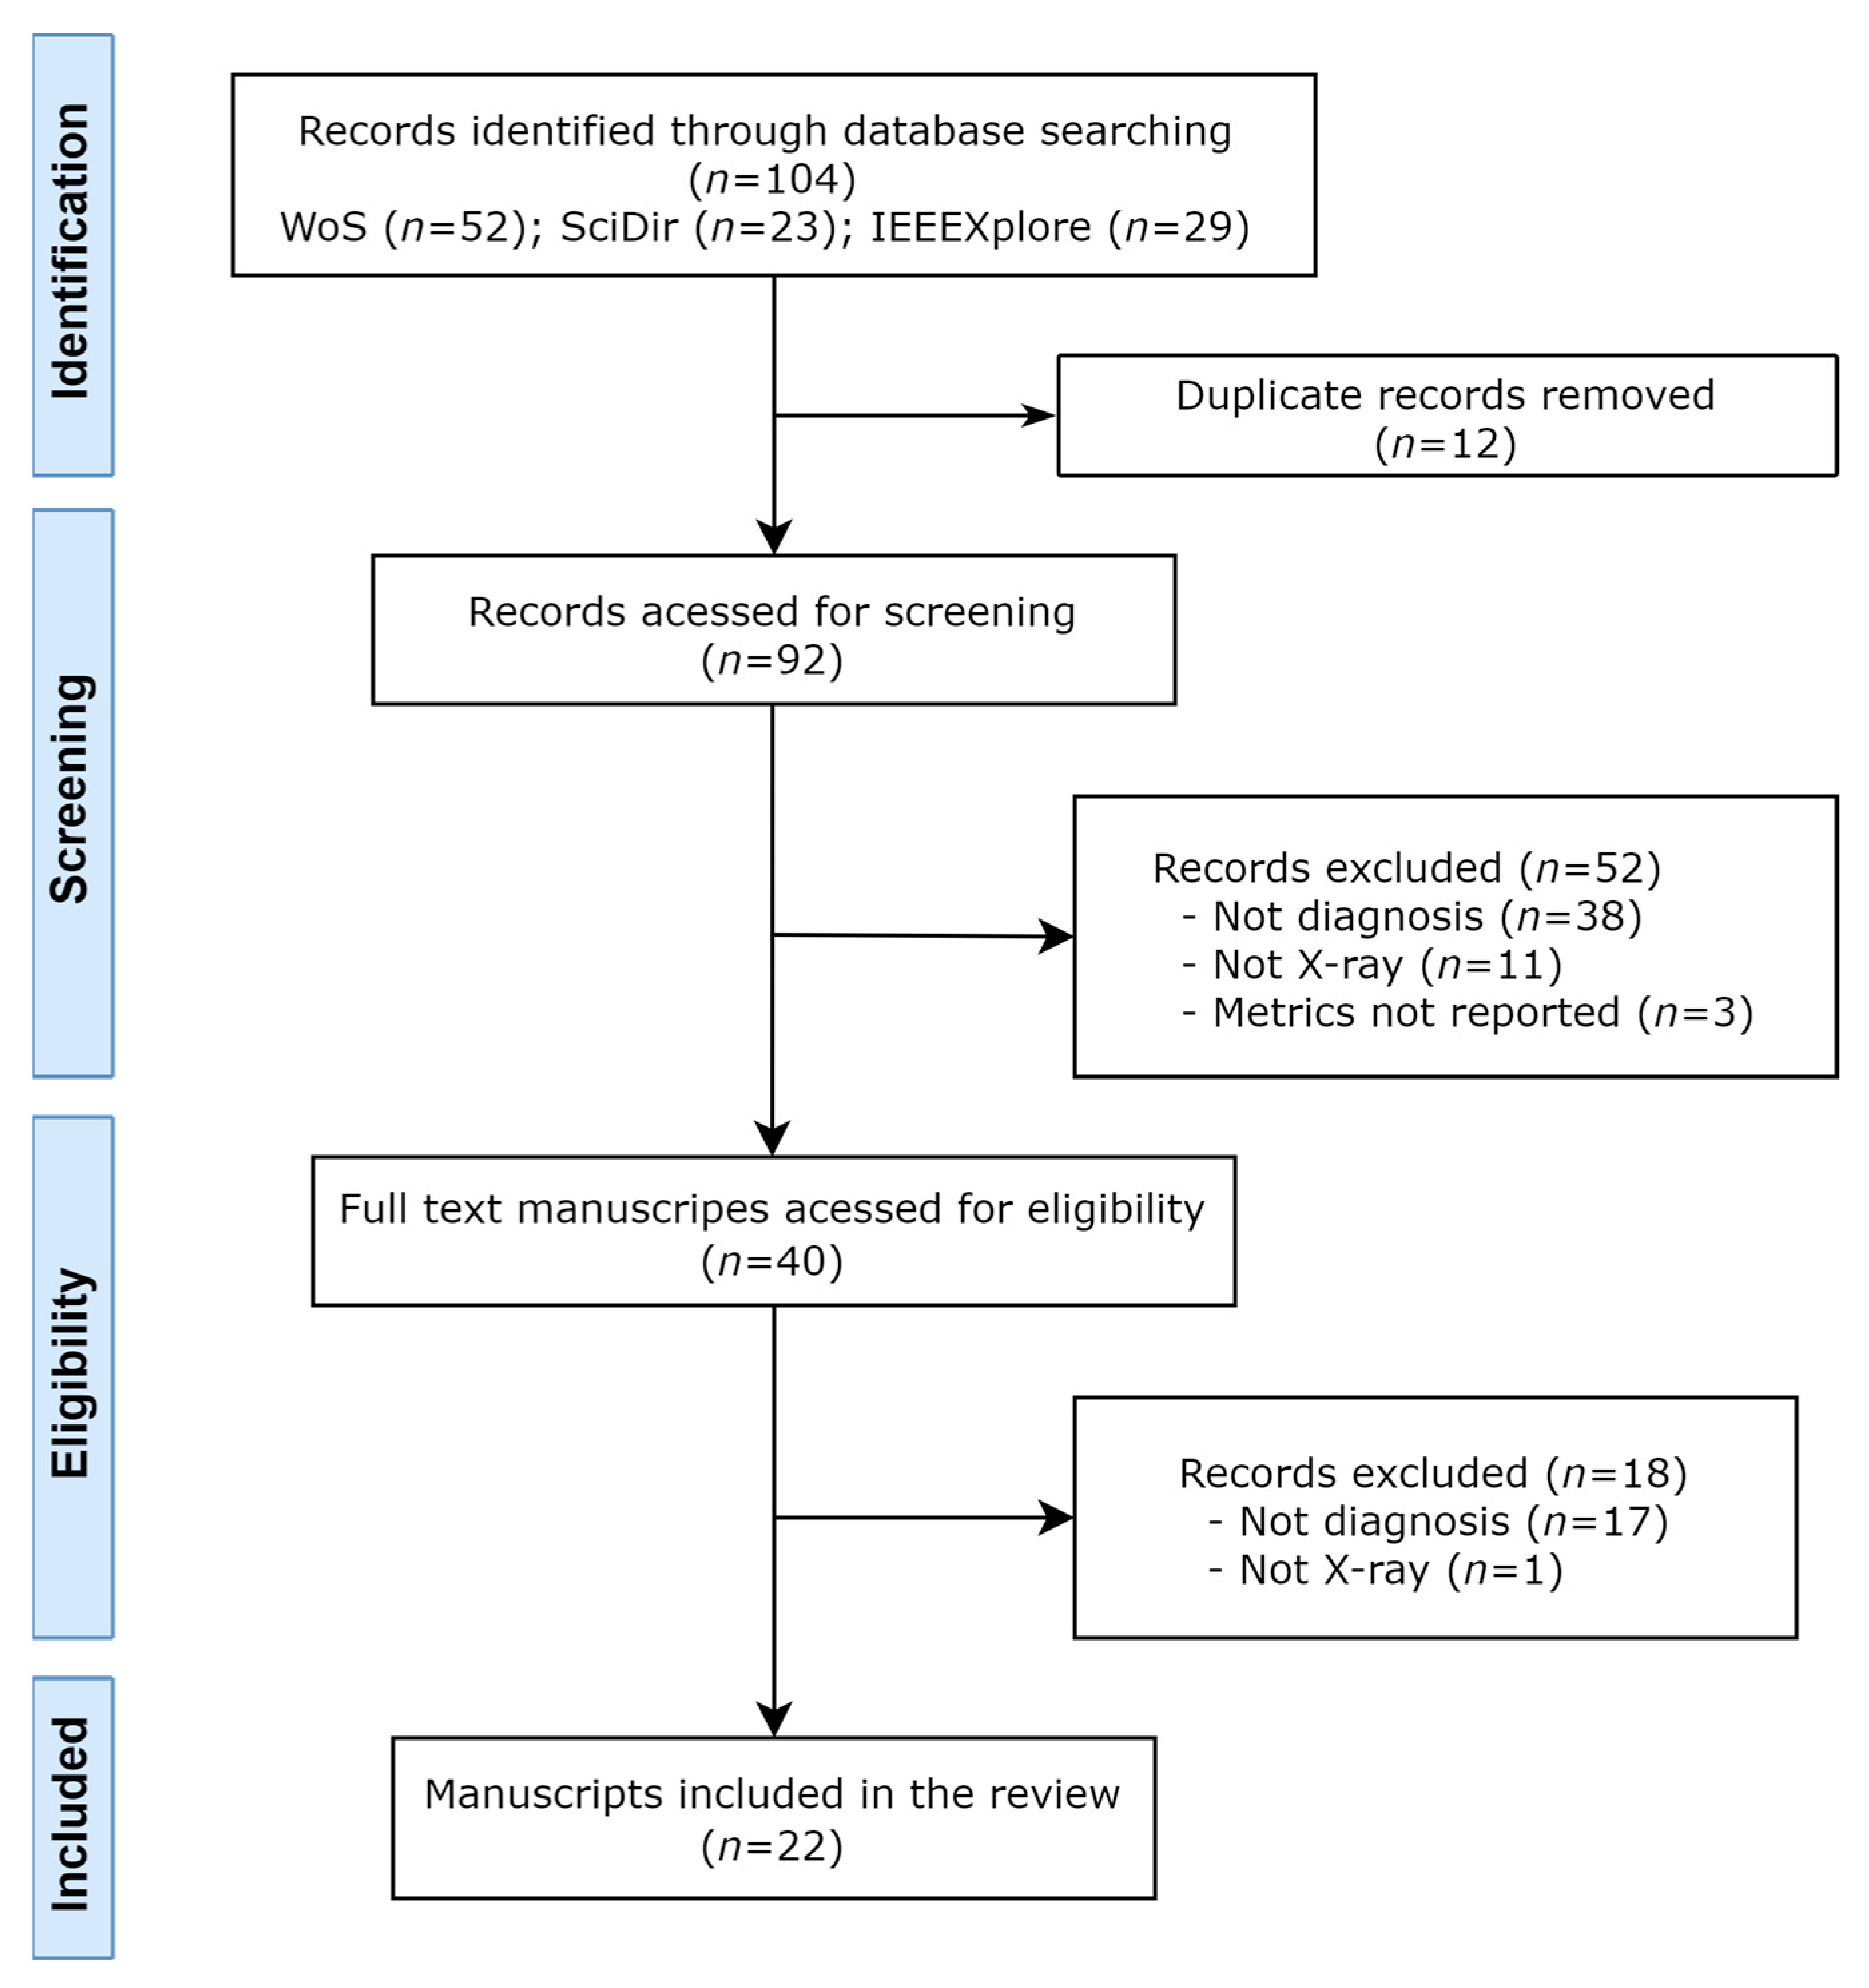
Figure 2.
Number of included studies per year of publication.

Figure 3.
Geographic distribution of the country affiliation of the first author of the studies.

Figure 4.
Word cloud of keywords.


Table 1.
Description of the PICOT elements.
| Study Question | |
|---|---|
| Population | Oral X-ray diagnostic images of patients (radiography, CBCT) |
| Intervention | Artificial intelligence-based forms of diagnosis |
| Control | Oral health |
| Outcome | Quality of the predictive models |
| Time | Last five years |
Table 2.
Databases used to conduct the search.
| Name | Acronym | URL |
|---|---|---|
| IEEE Xplore | IEEEXplore | https://ieeexplore.ieee.org/Xplore/home.jsp (accessed on 6 March 2023) |
| Science Direct | SciDir | https://www.sciencedirect.com/ (accessed on 6 March 2023) |
| Web of Science | WoS | https://www.webofscience.com/wos/ (accessed on 6 March 2023) |
Table 3.
Characteristics of the selected papers.
| Study | Country, Year | Diagnosis of | ImageType | Data Source | Dataset Size | Machine Learning Task | Metrics | Models |
|---|---|---|---|---|---|---|---|---|
| [25] | South Korea, 2018 | Dental caries | Periapical | Hospital | 24,600 | Classification | Acc, Sens, Spec, PPV, NPV, ROC-AUC | GoogLeNet |
| [26] | Germany, 2019 | Apical lesions | Panoramic | University | 2877 | Classification | ROC-AUC, Sens, Spec, PPV, NPV | Proprietary CNN |
| [27] | Germany, 2019 | Periodontal diseases | Panoramic | University | 2538 | Classification | Acc, ROC-AUC, F1, Sens, Spec, PPV, NPV | Proprietary CNN |
| [28] | India, 2020 | Dental caries | Periapical | University | 105 | Classification | Acc, FPR, PRC, MCC | BPNN |
| [29] | Germany, 2020 | Apical lesions | Panoramic | University | 3099 | Classification | PPV, Sens, F1, Prec, TPR | U-Net |
| [30] | South Korea, 2020 | Oral lesions | CBCT, Panoramic | University | 170,525 | Classification | ROC-AUC, Sens, Specificity | GoogLeNet |
| [31] | Saudi Arabia, 2020 | Apical lesions, dental caries, periodontal diseases | Periapical | Database | 120 | Classification | Acc, Spec, Prec, Rec, F1 | Proprietary CNN |
| [32] | USA, 2021 | Oral lesions | CBCT | University | 100 | Classification | Prec, Rec, Dice, Acc | Proprietary CNN |
| [33] | South Korea, 2020 | Implant defects | Periapical, Panoramic | Hospital | 1,292,360 | Classification | ROC-AUC, Sens, Spec, YI | VGG, GoogLeNet, Proprietary CNN |
| [34] | Japan, 2021 | Dental caries | Panoramic | Hospital | 533 | Classification | Acc, Sens, Spec, PPV, NPV, F1 | Alexnet, GoogLeNet, VGG, ResNet, Xception, SVM, KNN, DT, NB, RF |
| [35] | South Korea, 2021 | Periodontal diseases | Periapical | University | 708 | Classification | Prec, Rec, mOKS | Mask R-CNN, ResNet |
| [36] | USA, 2022 | Periodontal diseases | Bitewing, Periapical | Private clinic | 133,304 | Generative; Regression | MAE, MBE | Proprietary CNN, DeepLabV3, DETR |
| [37] | China, 2022 | Periodontal diseases, Dental caries | Periapical | Hospital | 7924 | Classification | Sens, Spec, PPV, NPV, F1, ROC-AUC | Modified ResNet-18 |
| [38] | China, 2022 | Ectopic eruption | Panoramic | Hospital | 3160 | Classification | Sens, Spec, PPV, NPV, ROC-AUC, F1 | Proprietary CNN |
| [39] | Saudi Arabia, 2022 | Impacted tooth | Panoramic | University | 416 | Classification | Acc, Prec, Rec, Spec, F1 | DenseNet, VGG, Inception V3, ResNet-50 |
| [40] | China, 2022 | Dental caries | Periapical | University | 840 | Classification | DICE, Prec, Sens, Spec | Proprietary CNN |
| [41] | Turkey, 2022 | Dental caries | Periapical | Private clinic | 340 | Classification | Acc, ROC-AUC, CM | Proprietary CNN, VGG, SqueezeNet, GoogleNet, ResNet, ShuffleNet, Xception, MobileNet, DarkNet |
| [42] | Japan, 2022 | Oral lesions | Panoramic | Hospital | 7260 | Classification | Acc, Sens, Spec, Prec, Rec, F1 | YOLO v3 |
| [43] | Germany, 2022 | Oral lesions | Panoramic | University | 1239 | Classification | Prec, Rec, NPV, Spec, F1 | ResNet, RF |
| [44] | Netherlands, 2022 | Periodontal diseases | Periapical | University | 1546 | Regression | MSE | Proprietary CNN |
| [45] | China, 2022 | Dental caries | Periapical | University | 800 | Classification | Prec, F1 | Proprietary CNN |
| [46] | Turkey, 2022 | Periodontal diseases | X-ray, type not defined | Database | 1432 | Classification | Acc, Sens, Spec, Prec, F1 | AlexNet, SqueezeNet, EfficientNet, DT, KNN, NB, RUSBoost, SVM, |
Acc: accuracy; CM: confusion matrix; DT: decision tree; FPR: false positives ratio; KNN: K-nearest neighbor; NB: naïve Bayes; MAE: mean absolute error; MBE: mean bias error; MCC: Matthews correlation coefficient; mOKS: mean object keypoint similarity; MSE: mean squared error; NPV: negative predictive value; Prec: precision; PPV: positive predictive value; PRC: precision-recall curve; RF: random forest; Rec: recall; ROC-AUC: receiver operator characteristic–area under the curve; Sens: sensitivity; Spec: specificity; SVM: support vector machine; TPR: true positives ratio; USA: United States of America; YI: Youden index.
Table 4.
Journal sources of the included papers.
| Journal | n | % |
|---|---|---|
| Journal of Dentistry | 5 | 23% |
| Diagnostics | 3 | 14% |
| Biomedical Signal Processing and Control | 1 | 5% |
| Scientific Reports | 1 | 5% |
| Journal of Oral and Maxillofacial Surgery, Medicine, and Pathology | 1 | 5% |
| Informatics in Medicine Unlocked | 1 | 5% |
| Cluster Computing | 1 | 5% |
| International Dental Journal | 1 | 5% |
| Journal of Clinical Medicine | 1 | 5% |
| Displays | 1 | 5% |
| Journal of Endodontics | 1 | 5% |
| Health Information Science and Systems | 1 | 5% |
| Oral Diseases | 1 | 5% |
| IEEE Access | 1 | 5% |
| Applied Sciences | 1 | 5% |
| IEEE Transactions on Automation Science and Engineering | 1 | 5% |
Table 5.
Dataset size distribution.
| Dataset Size | Number of Datasets |
|---|---|
| <500 | 5 |
| 500–1000 | 4 |
| 1000–1500 | 2 |
| 1500–2000 | 1 |
| 2000–5000 | 4 |
| 5000–10,000 | 2 |
| 10,000–50,000 | 1 |
| 50,000–100,000 | 0 |
| 10,000–500,000 | 2 |
| 500,000–1,000,000 | 0 |
| >1,000,000 | 1 |
Table 6.
Average, minimum, and maximum values of the most used metrics, considering the best reported values in each manuscript.
Table 6.
Average, minimum, and maximum values of the most used metrics, considering the best reported values in each manuscript.
| Metric | n | Average | Minimum | Maximum |
|---|---|---|---|---|
| Recall | 17 | 0.84 | 0.51 | 0.96 |
| Precision | 16 | 0.81 | 0.67 | 0.99 |
| Specificity | 14 | 0.85 | 0.51 | 1.00 |
| F1 score | 13 | 0.81 | 0.58 | 0.97 |
| Accuracy | 9 | 0.92 | 0.81 | 0.98 |
| ROC-AUC * | 8 | 0.93 | 0.85 | 0.98 |
| NPV ** | 7 | 0.83 | 0.68 | 0.95 |
* ROC-AUC: receiver operating characteristic–area under curve; ** NPV: negative predictive value.
Disclaimer/Publisher’s Note: The statements, opinions and data contained in all publications are solely those of the individual author(s) and contributor(s) and not of MDPI and/or the editor(s). MDPI and/or the editor(s) disclaim responsibility for any injury to people or property resulting from any ideas, methods, instructions or products referred to in the content. |
© 2023 by the authors. Licensee MDPI, Basel, Switzerland. This article is an open access article distributed under the terms and conditions of the Creative Commons Attribution (CC BY) license (https://creativecommons.org/licenses/by/4.0/).
Share and Cite
MDPI and ACS Style
Martins, M.V.; Baptista, L.; Luís, H.; Assunção, V.; Araújo, M.-R.; Realinho, V. Machine Learning in X-ray Diagnosis for Oral Health: A Review of Recent Progress. Computation 2023, 11, 115. https://doi.org/10.3390/computation11060115
AMA Style
Martins MV, Baptista L, Luís H, Assunção V, Araújo M-R, Realinho V. Machine Learning in X-ray Diagnosis for Oral Health: A Review of Recent Progress. Computation. 2023; 11(6):115. https://doi.org/10.3390/computation11060115
Chicago/Turabian StyleMartins, Mónica Vieira, Luís Baptista, Henrique Luís, Victor Assunção, Mário-Rui Araújo, and Valentim Realinho. 2023. "Machine Learning in X-ray Diagnosis for Oral Health: A Review of Recent Progress" Computation 11, no. 6: 115. https://doi.org/10.3390/computation11060115
Note that from the first issue of 2016, this journal uses article numbers instead of page numbers. See further details here.