The DPSIR Approach for Coastal Risk Assessment under Climate Change at Regional Scale: The Case of Apulian Coast (Italy)

 , , and
Abstract
:1. Introduction
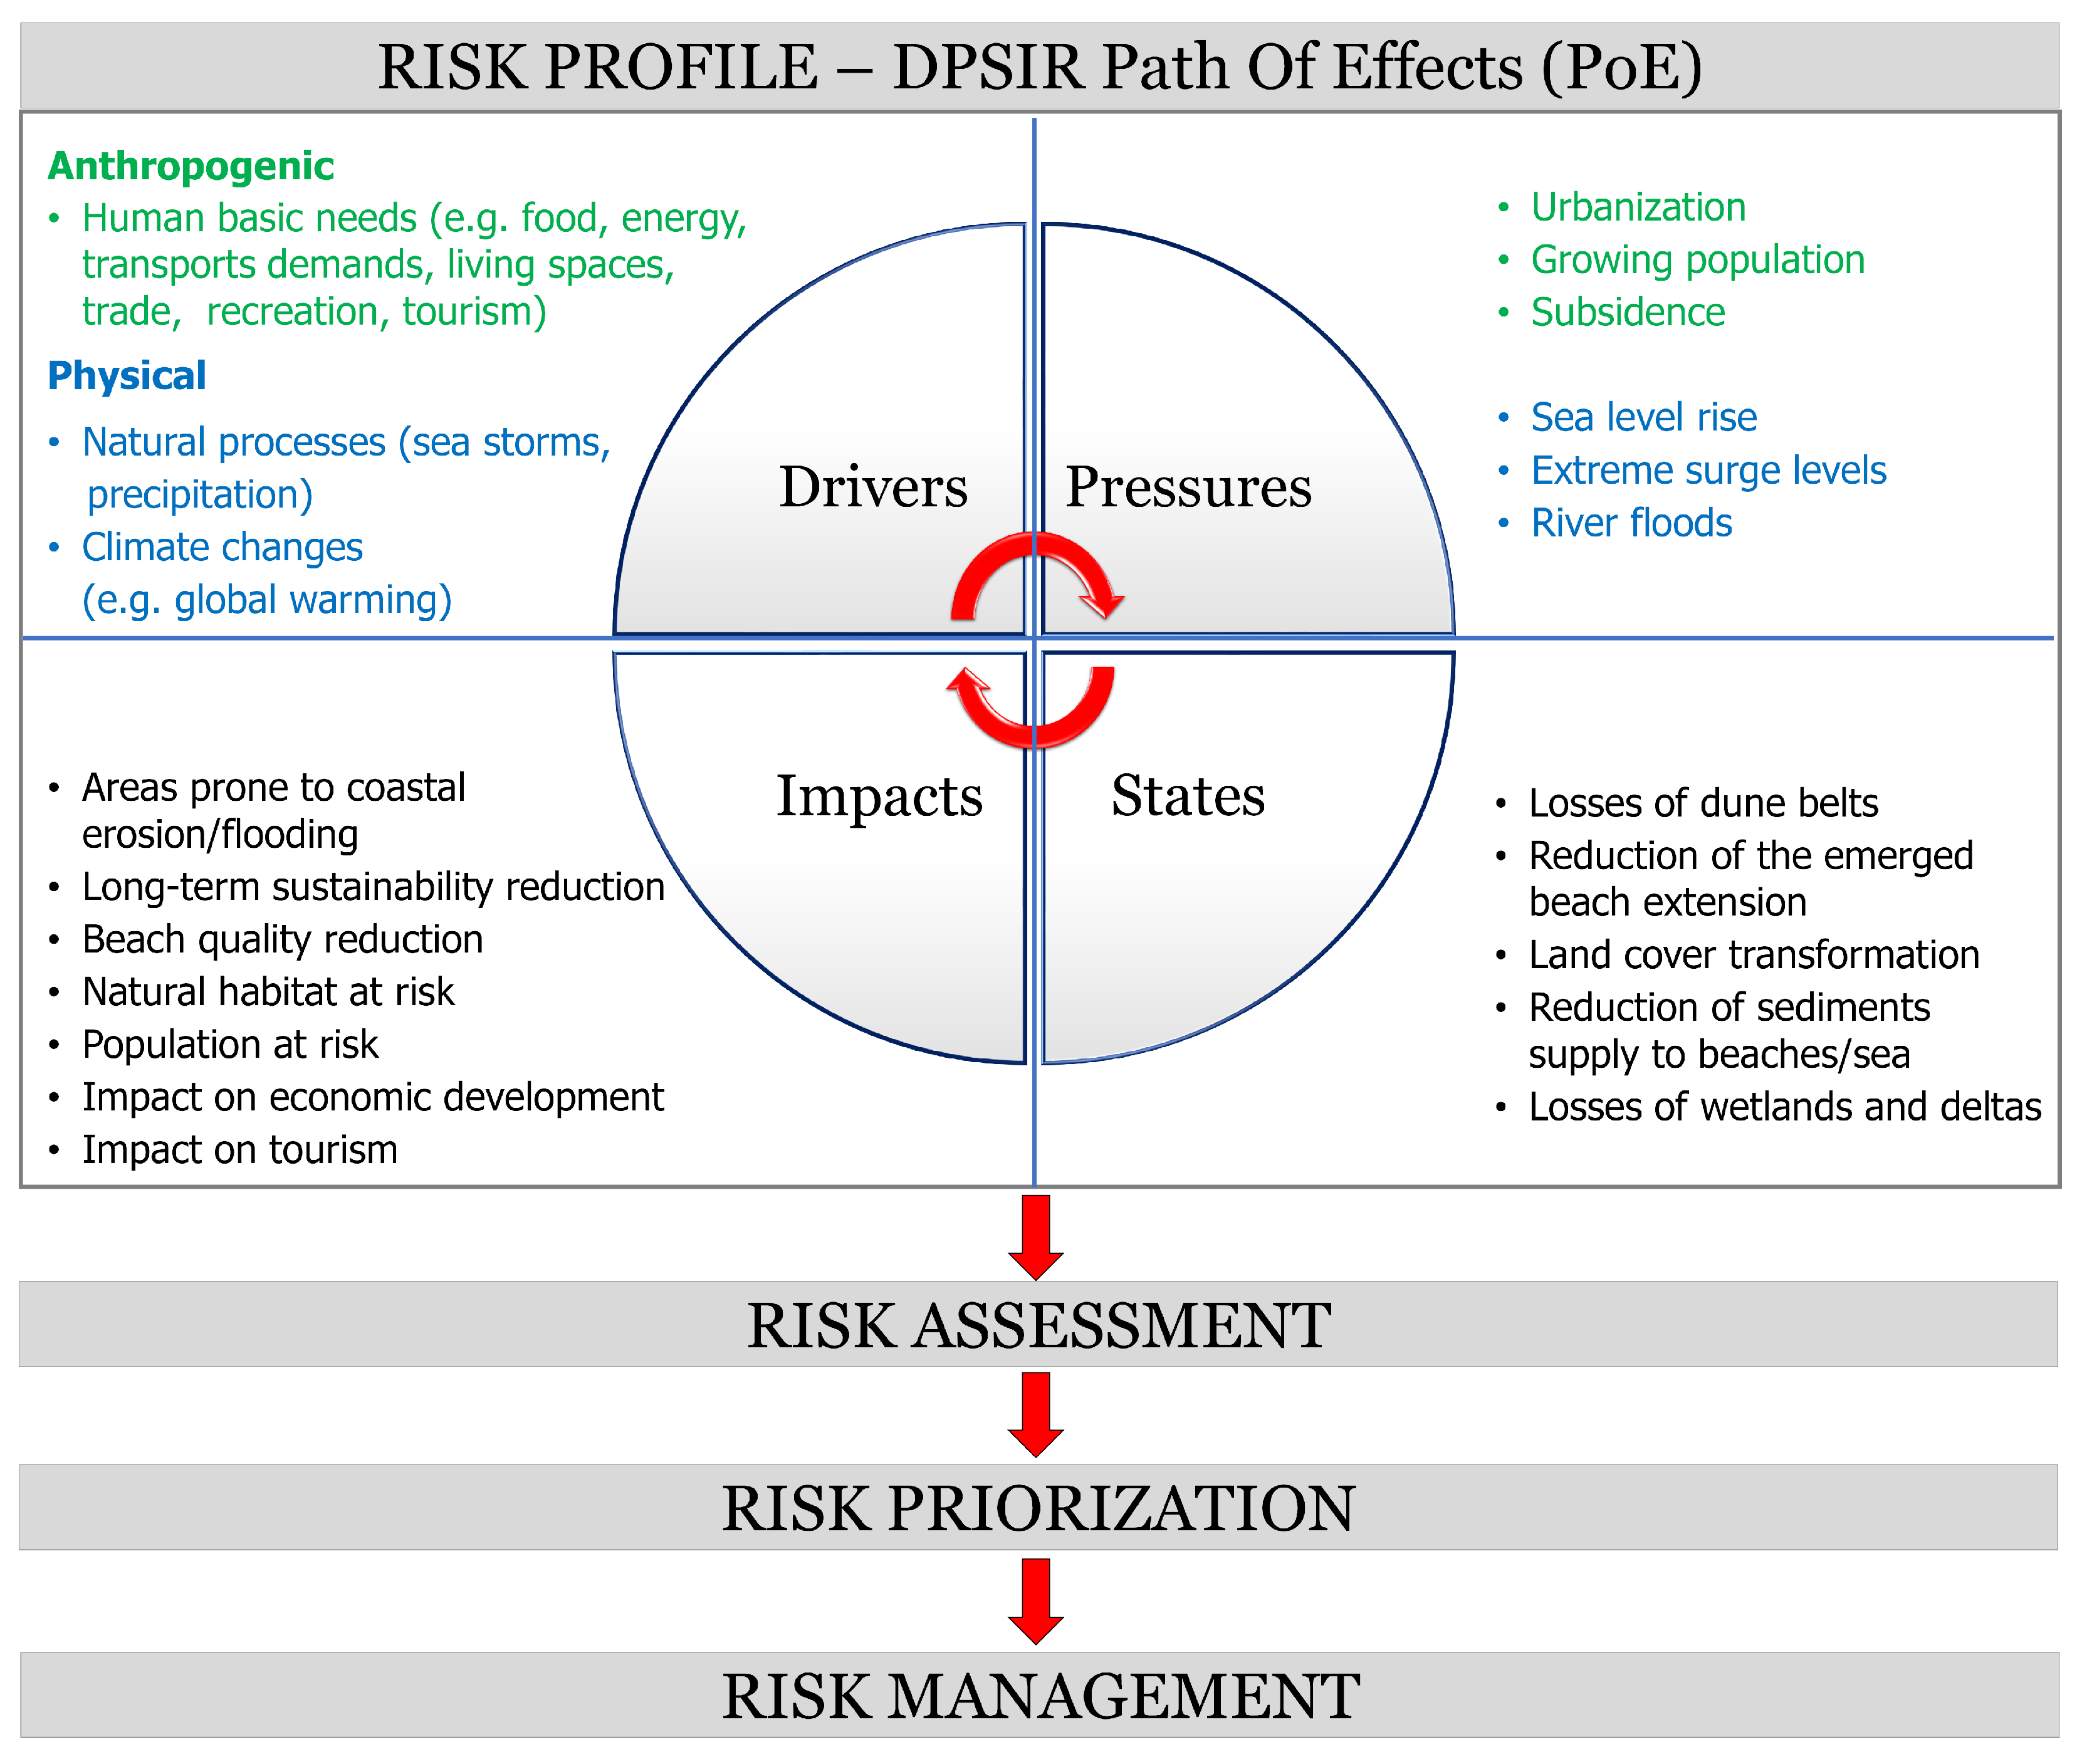
2. Risk Model
2.1. EUrosion Model
2.2. Modified EUrosion Model
3. Case Study
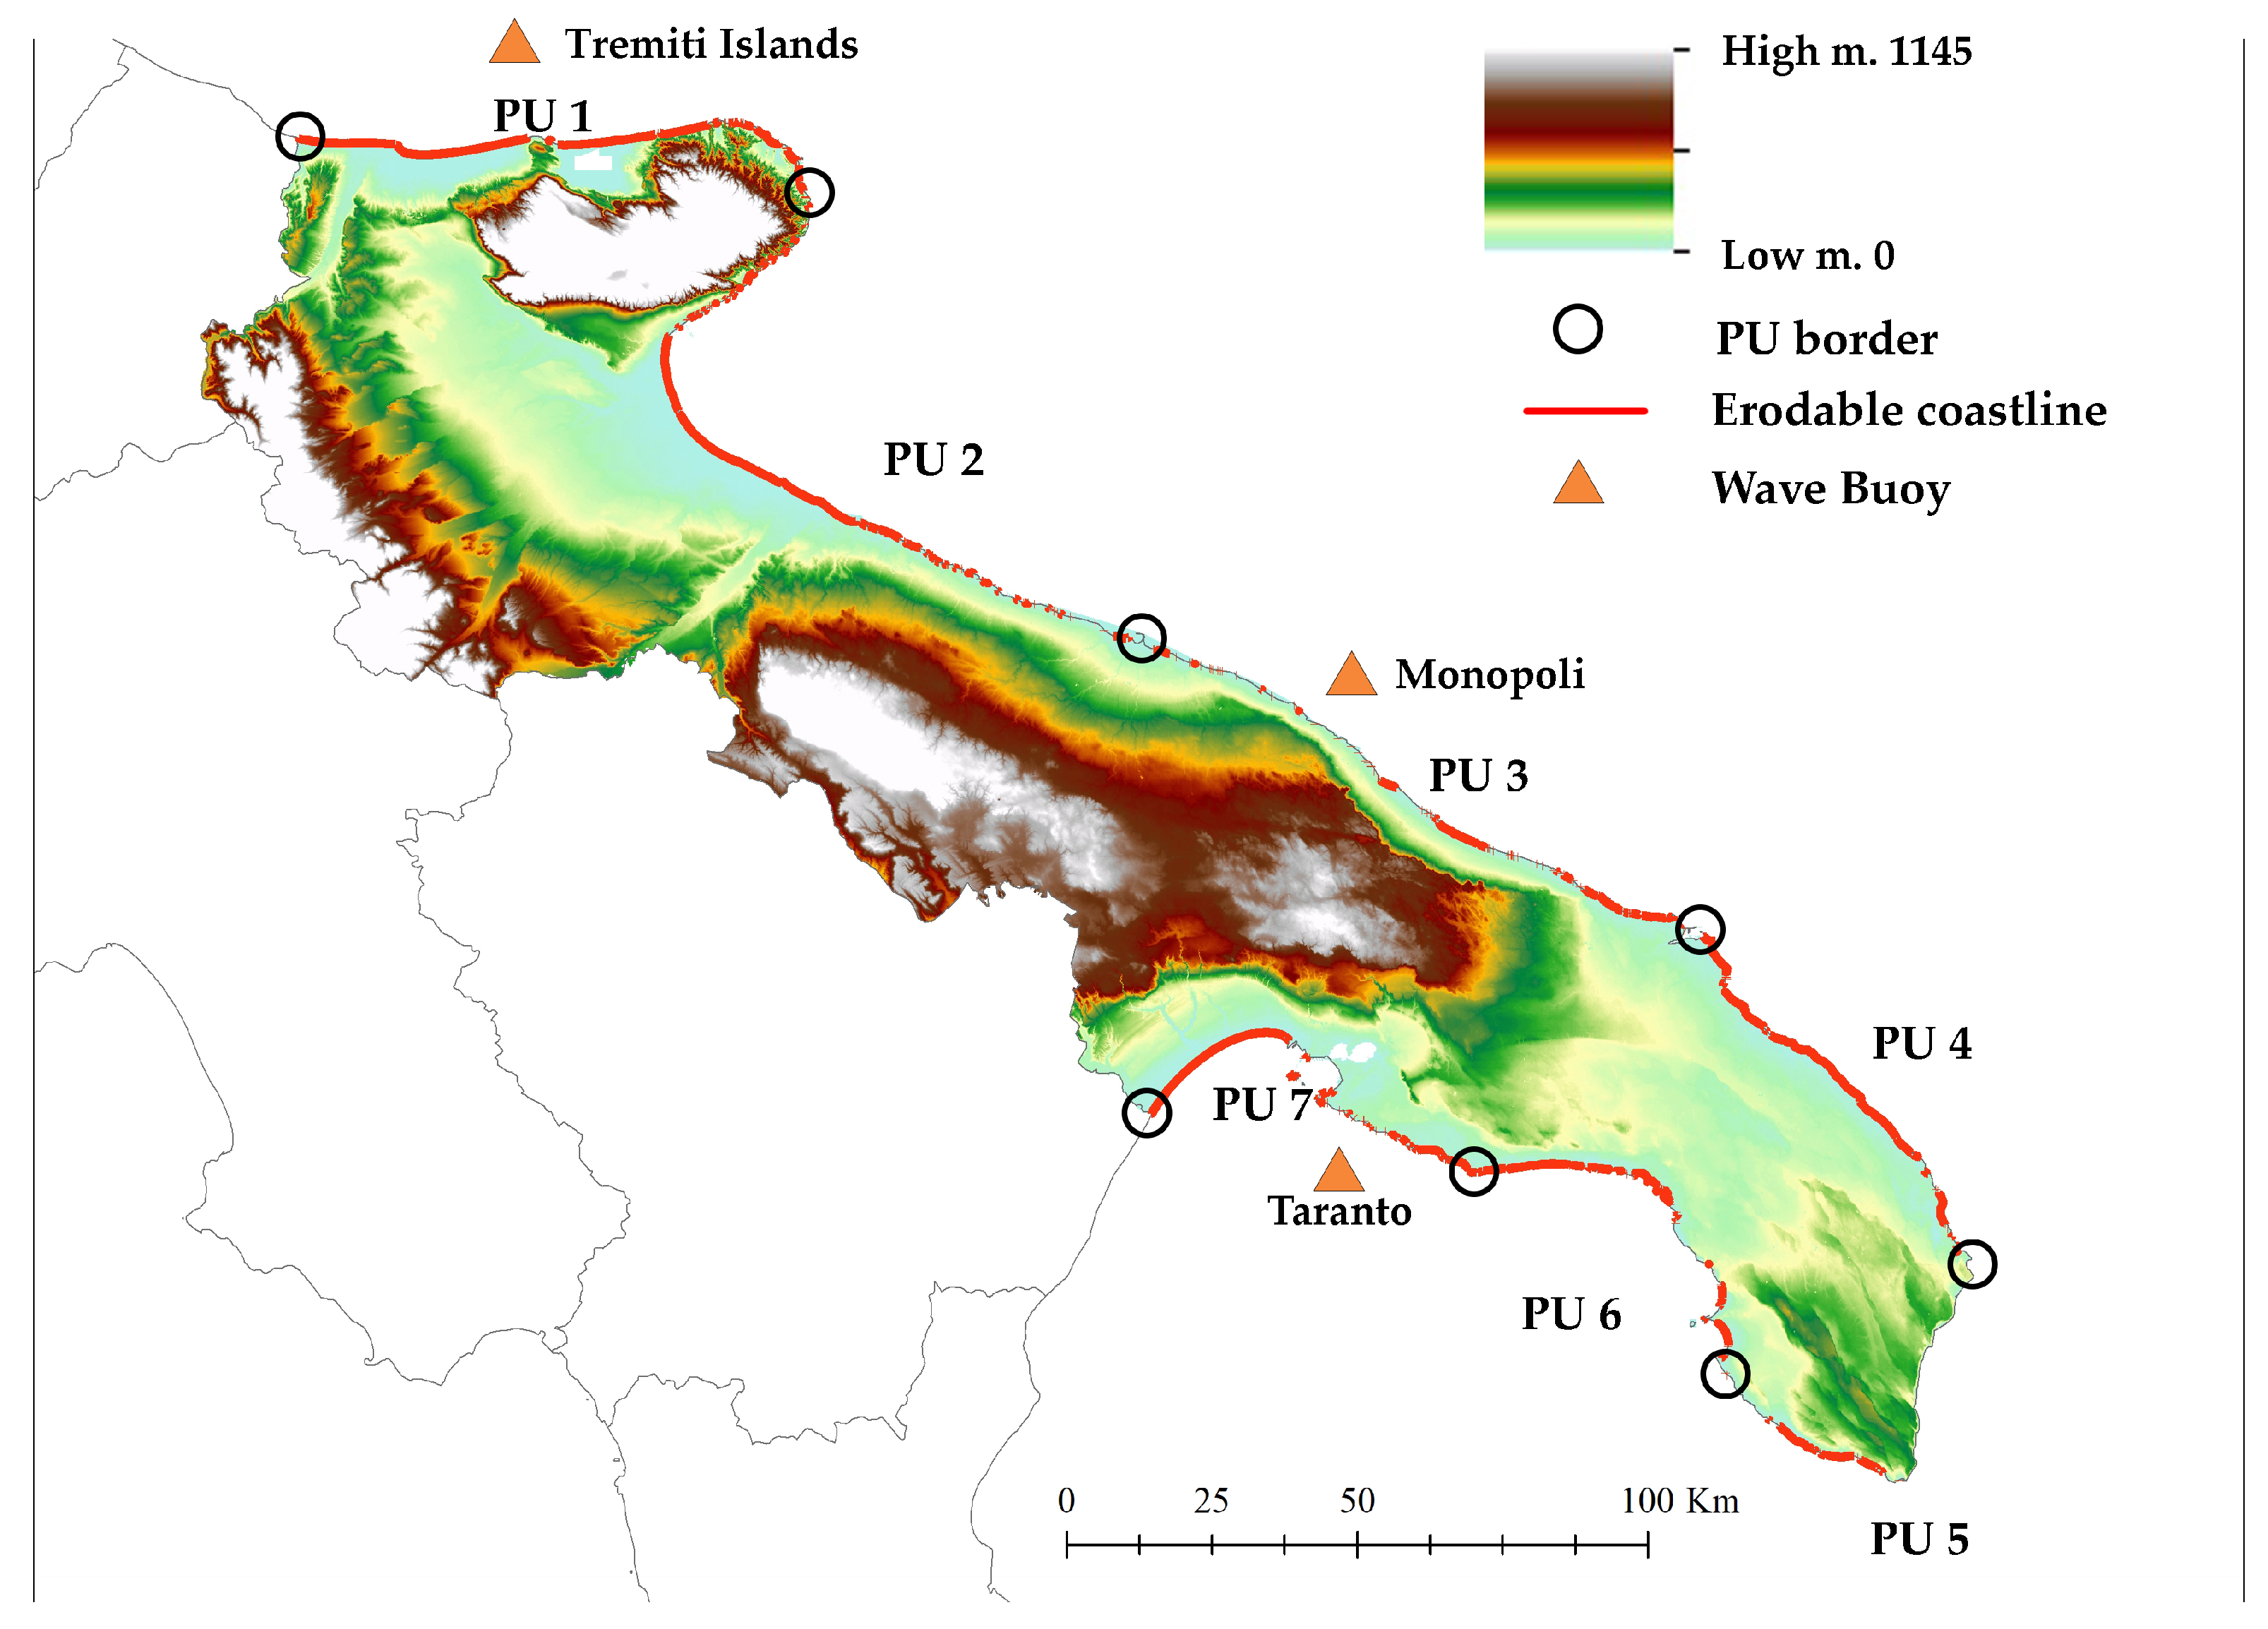
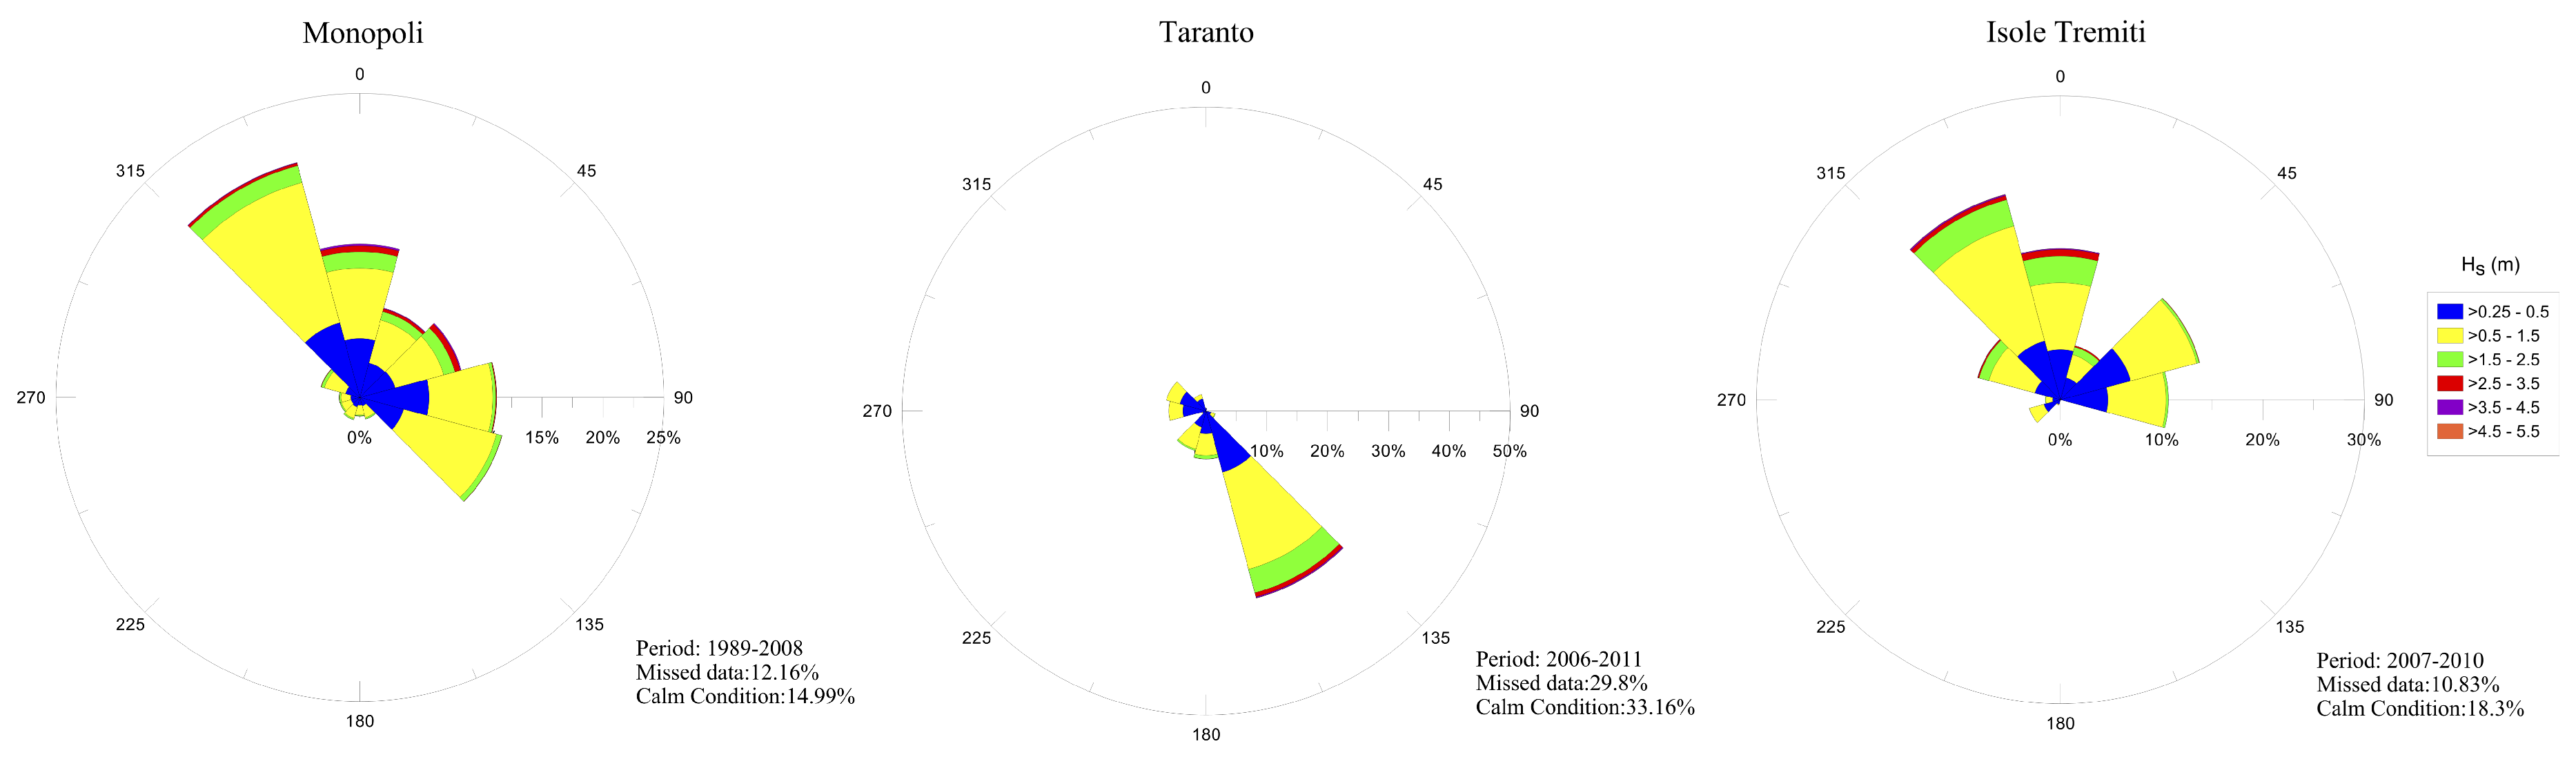
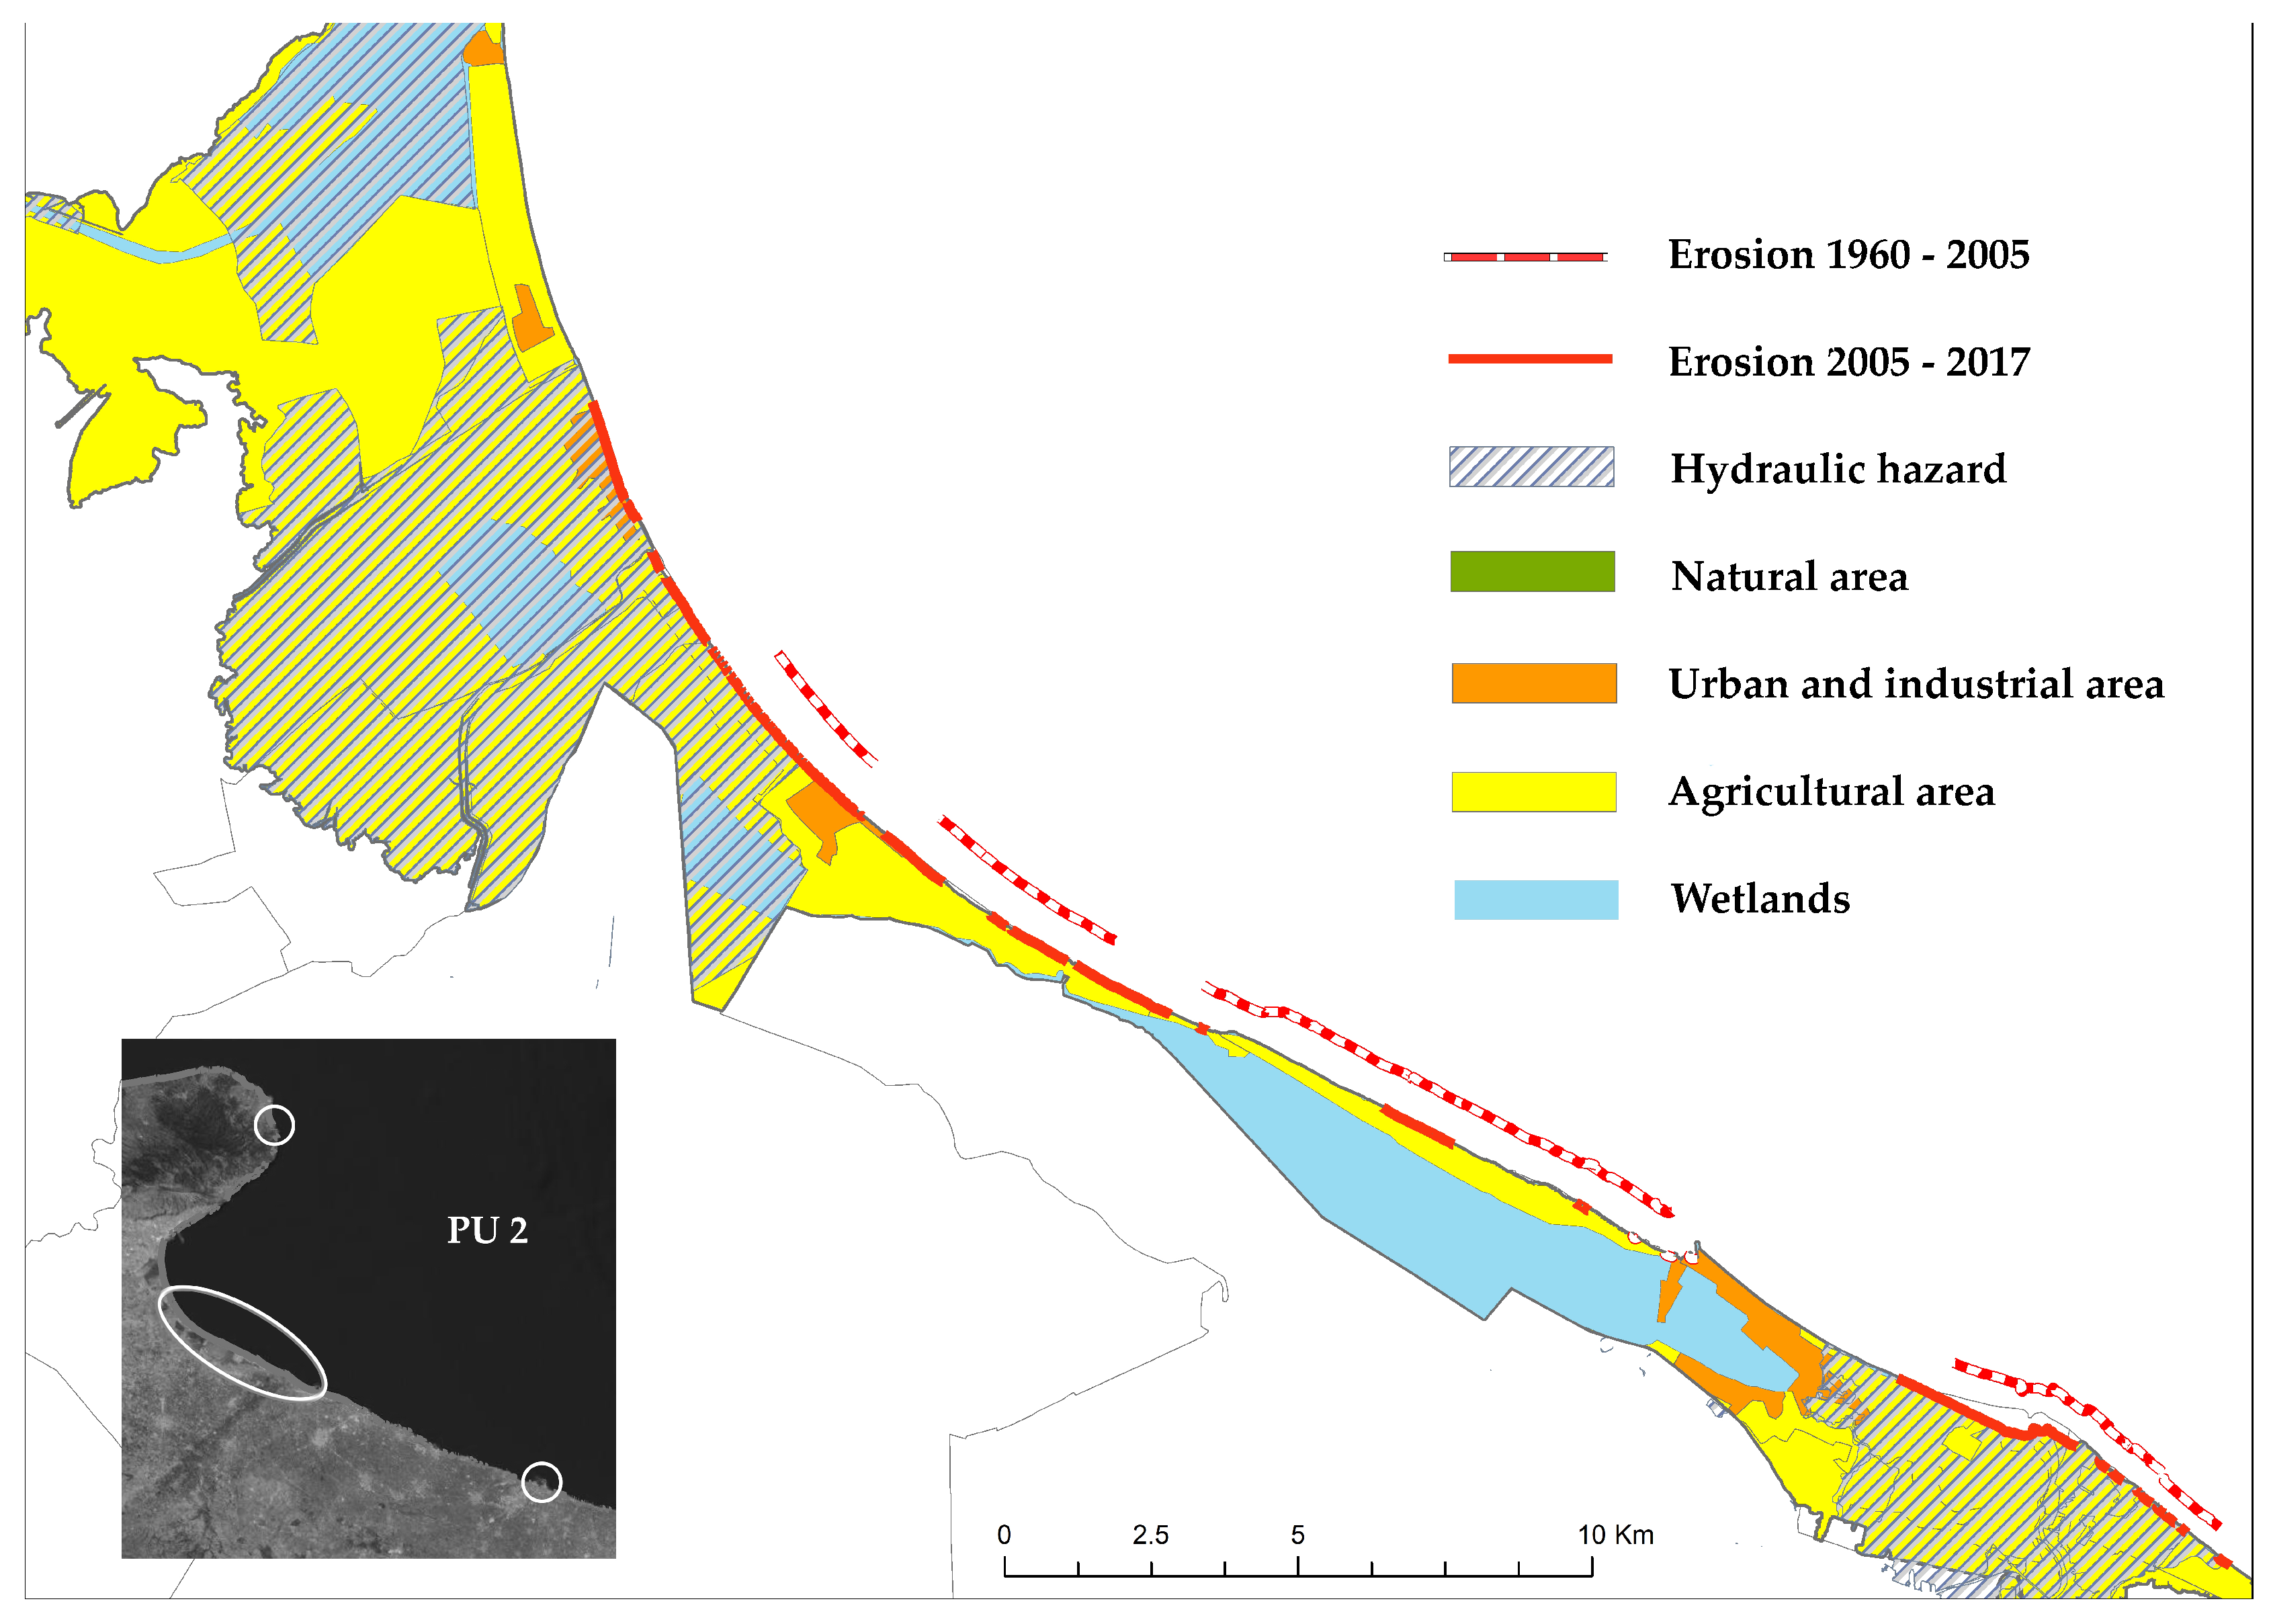
3.1. Description and Analysis of the Study Area
3.2. Risk Profile
3.2.1. CVI indicators
3.2.2. CEI Indicators
4. Results and Discussion
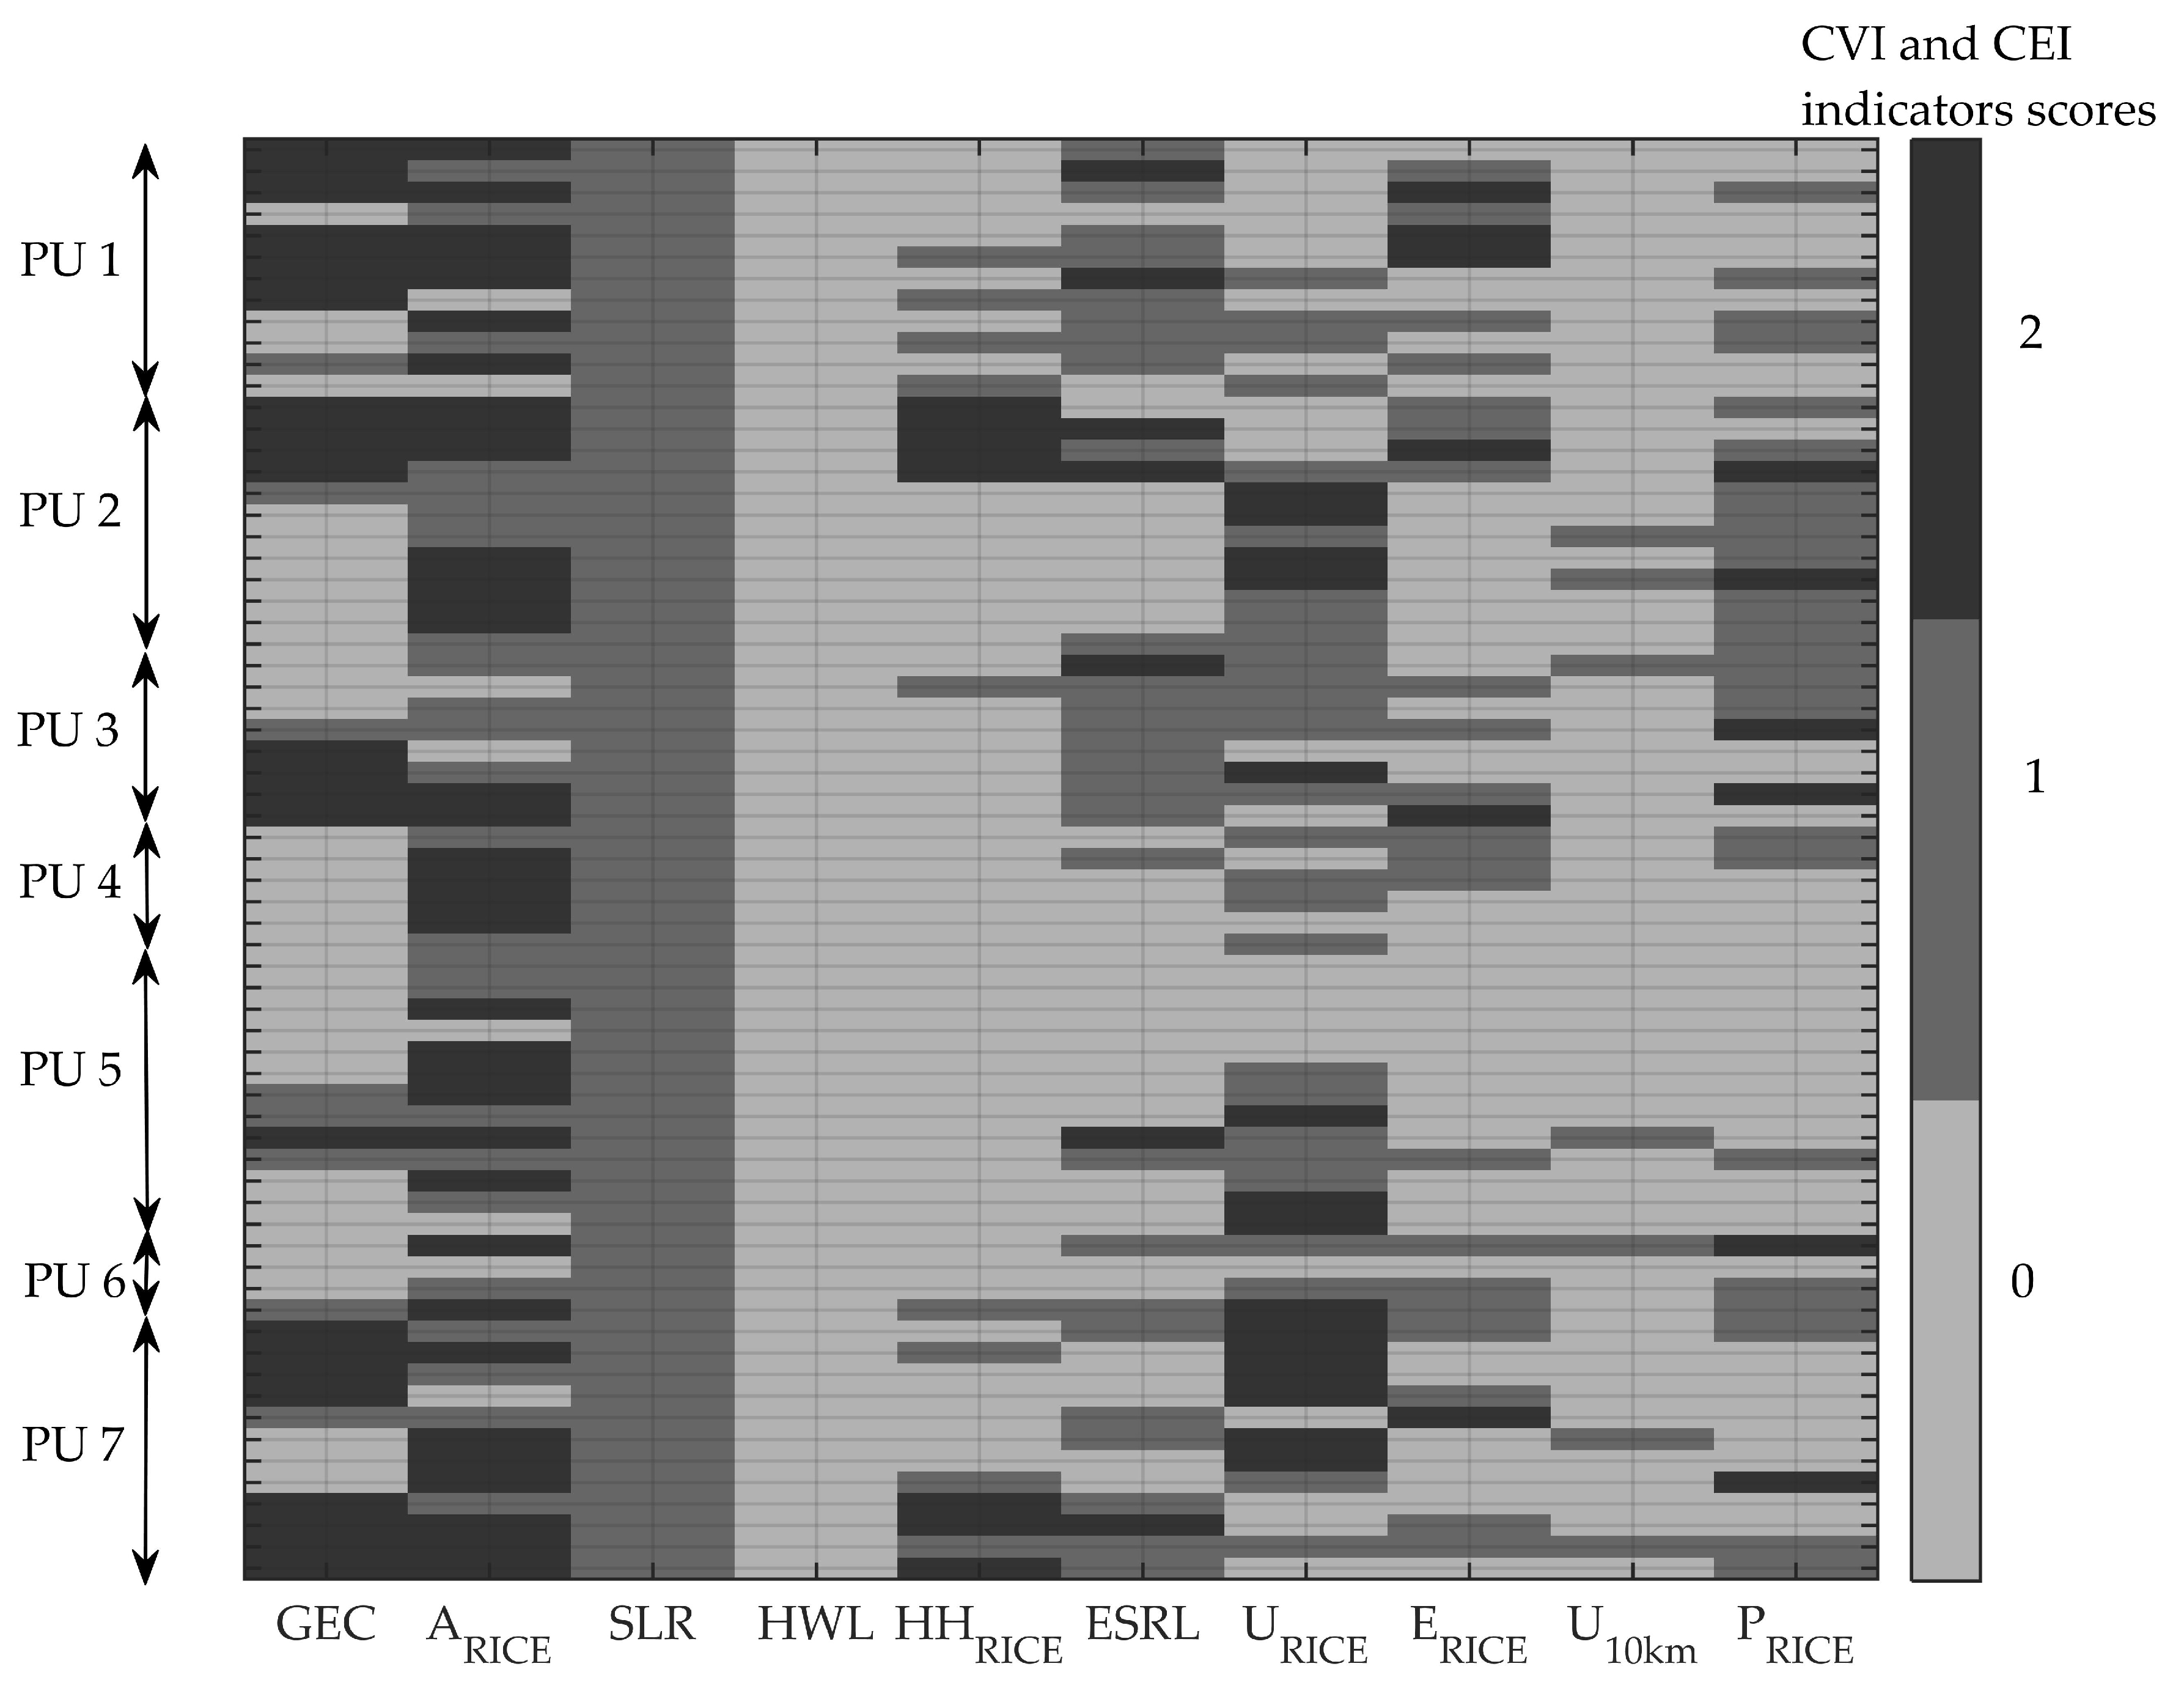
4.1. CVI and CEI Indicators
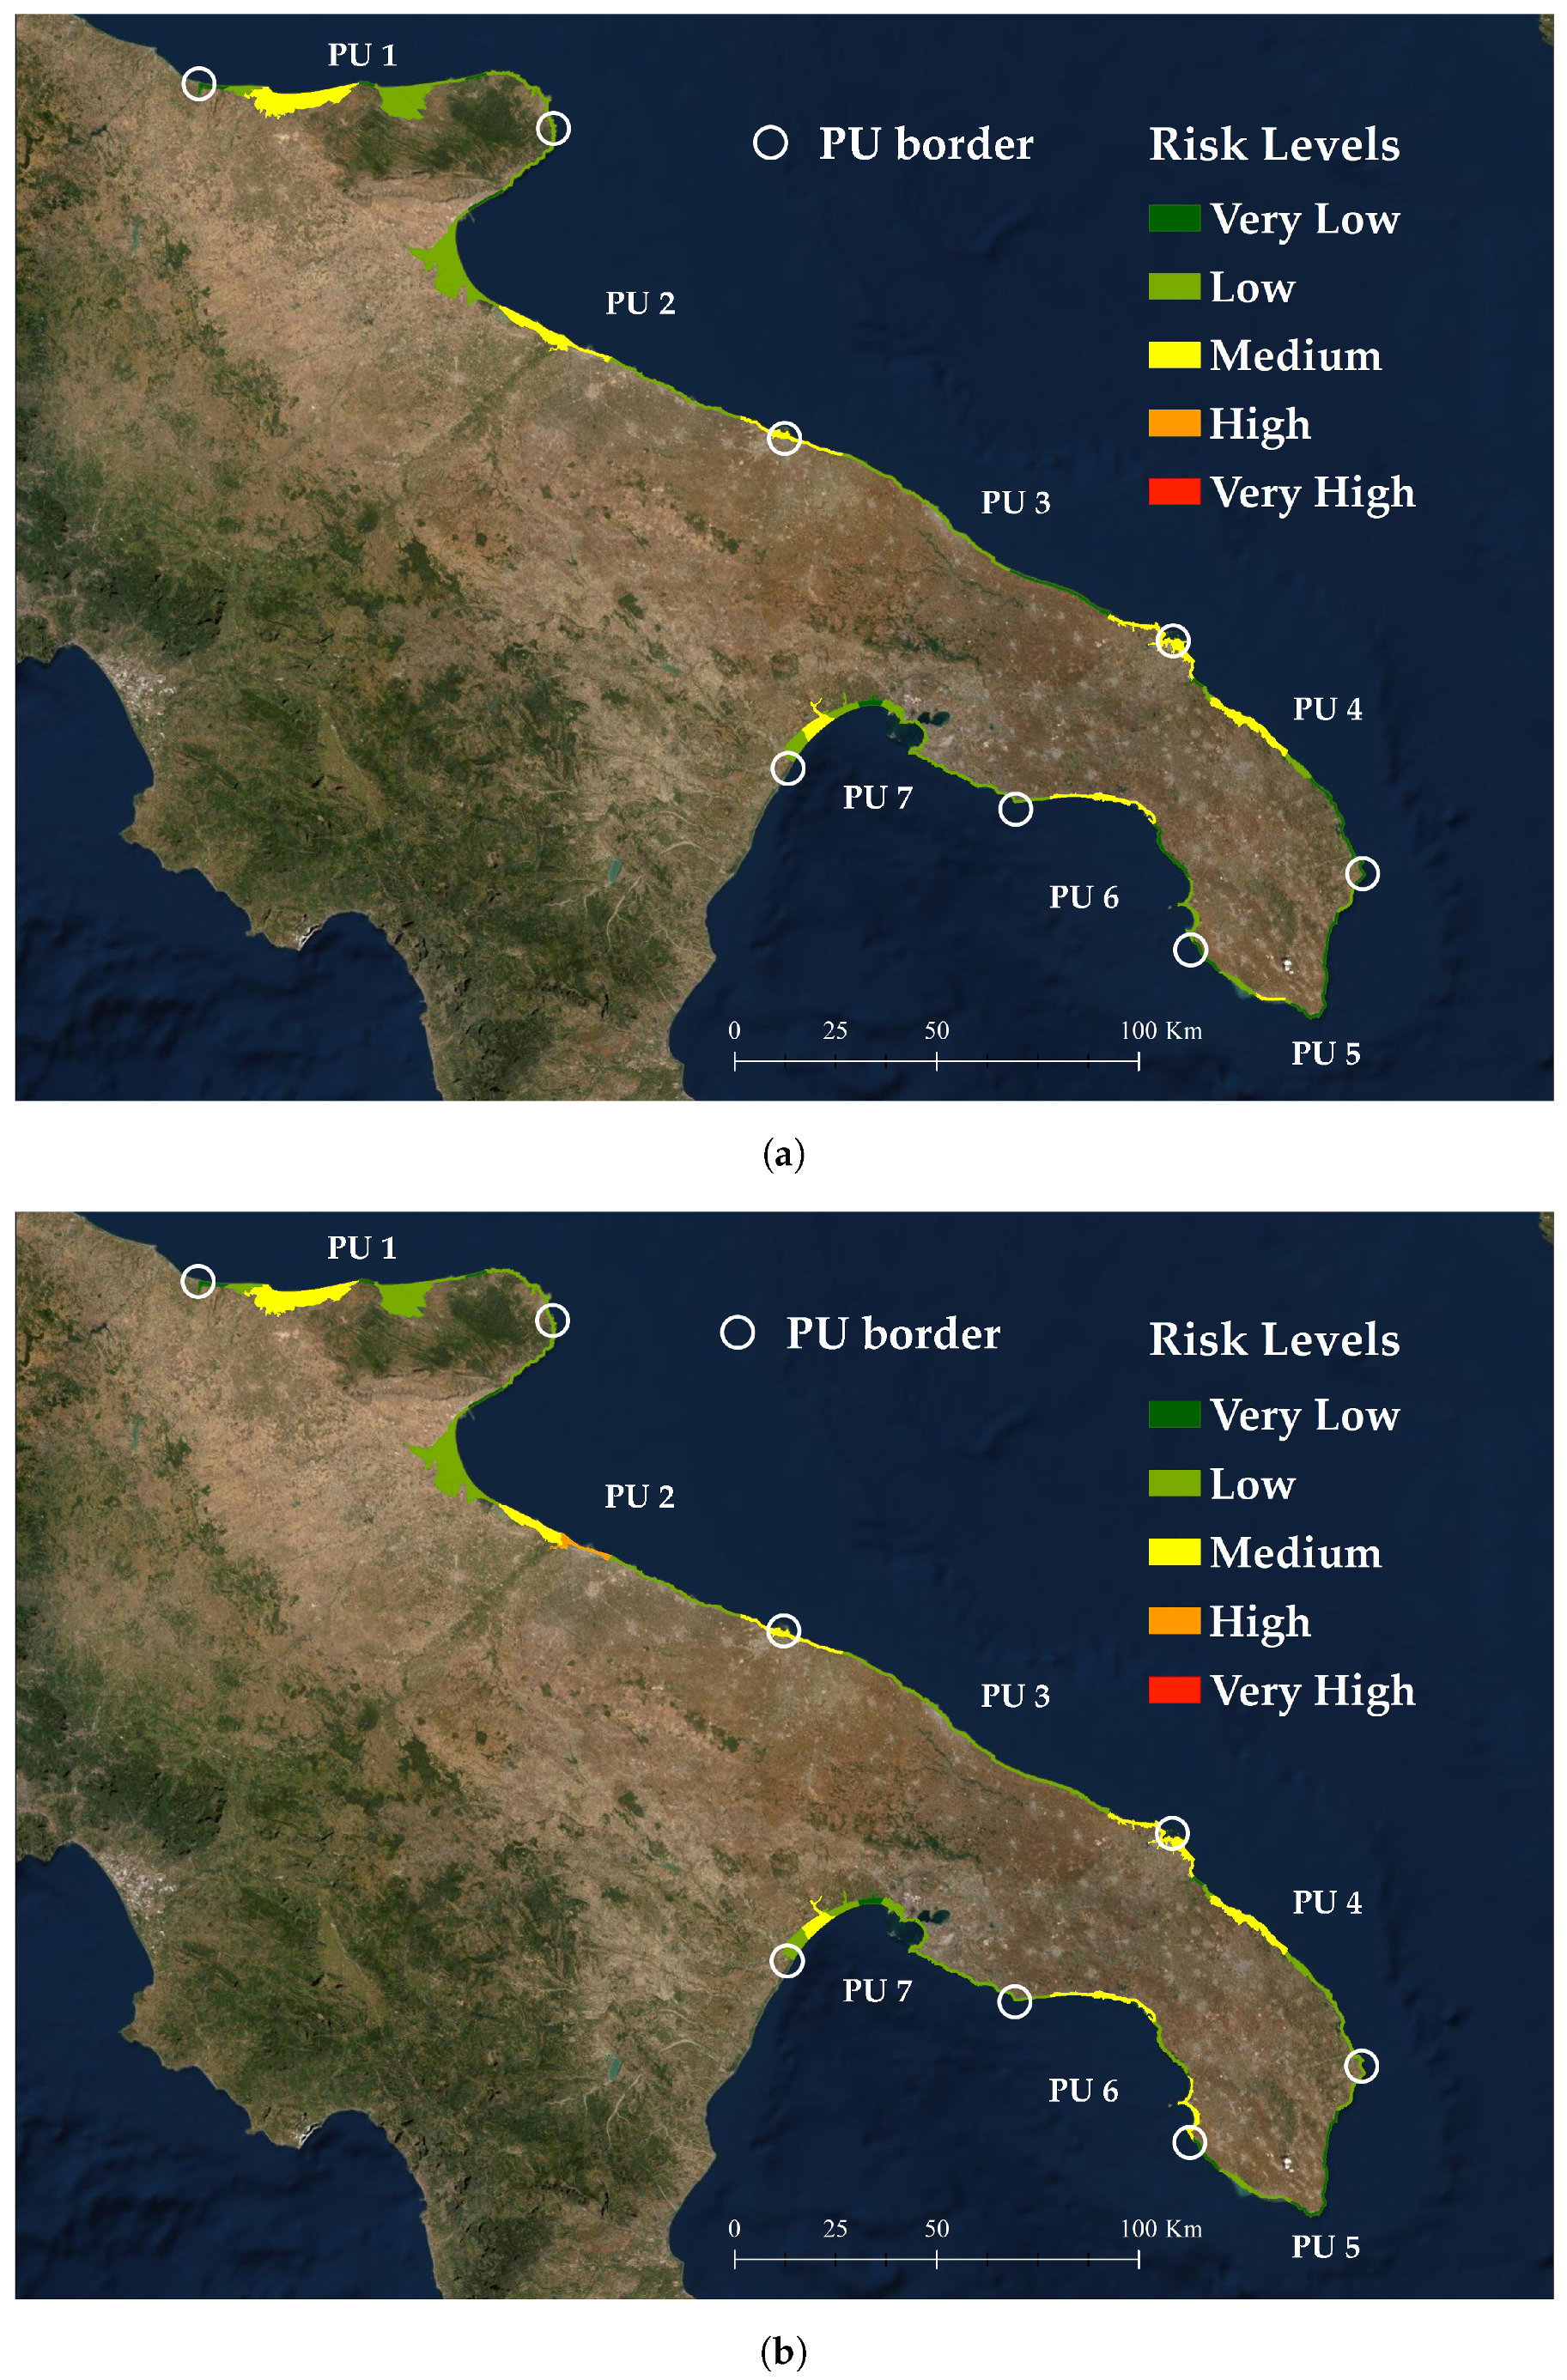
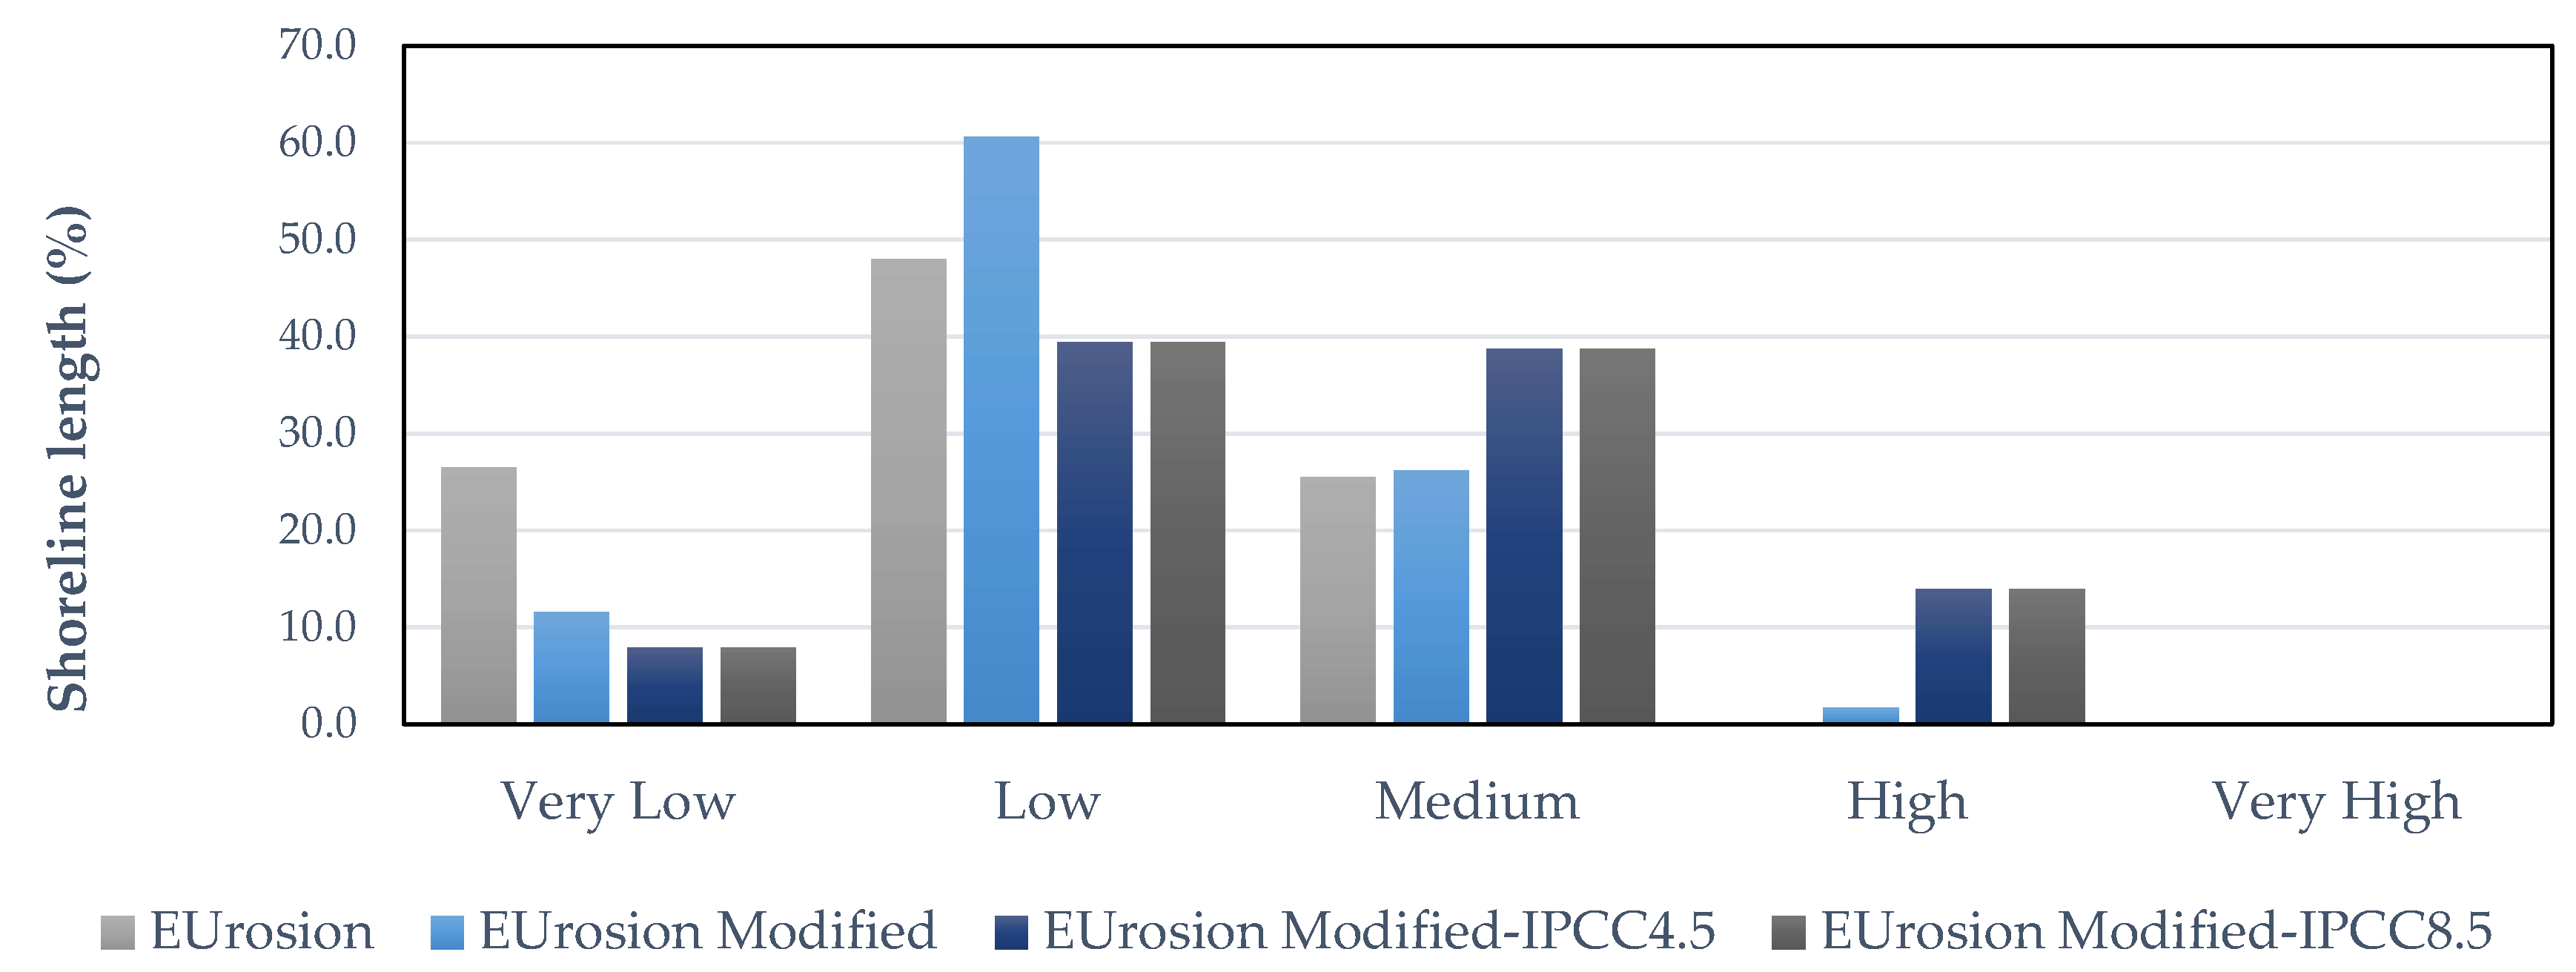
4.2. Risk Levels
5. Conclusions
Author Contributions
Funding
Conflicts of Interest
References
- Nicholls, R.J.; Wong, P.P.; Burkett, V.; Codignotto, J.; Hay, J.; McLean, R.; Ragoonaden, S.; Woodroffe, C.D.; Abuodha, P.; Arblaster, J.; et al. Climate Change 2007: Impacts, Adaptation, and Vulnerability. Part A: Global and Sectoral Aspects. Contribution of Working Group II to the Forth Assessment Report of the Intergovernmental Panel on Climate Change; Cambridge University Press: Cambridge, UK, 2007. [Google Scholar]
- IPCC. Climate Change 2014: Synthesis Report. Contribution of Working Groups I, II and III to the Fifth Assessment Report of the Intergovernmental Panel on Climate Change; Core Writing Team, Pachauri, R.K., Meyer, L.A., Eds.; IPCC: Geneva, Switzerland, 2014. [Google Scholar]
- Nicholls, R.J.; Woodroffe, C.; Burkett, V. Chapter 20—Coastline Degradation as an Indicator of Global Change. In Climate Change, 2nd ed.; Letcher, T.M., Ed.; Elsevier: Boston, MA, USA, 2016; pp. 309–324. [Google Scholar]
- Pranzini, E.; Williams, A.T. Coastal Erosion and Protection in Europe; Routledge: New York, NY, USA, 2013. [Google Scholar]
- Archetti, R.; Damiani, L.; Bianchini, A.; Romagnoli, C.; Abbiati, M.; Addona, F.; Airoldi, L.; Cantelli, L.; Gaeta, M.G.; Guerrero, M.; et al. Innovative strategies, monitoring and analysis of the coastal erosion risk: The STIMARE project. In Proceedings of the 29th International Ocean and Polar Engineering Conference, Honolulu, HI, USA, 16–21 June 2019; International Society of Offshore and Polar Engineers: Mountain View, CA, USA, 2019. [Google Scholar]
- Hinkel, J.; Klein, R.J. Integrating knowledge to assess coastal vulnerability to sea-level rise: The development of the DIVA tool. Glob. Environ. Chang. 2009, 19, 384–395. [Google Scholar] [CrossRef]
- Torresan, S.; Critto, A.; Rizzi, J.; Marcomini, A.; Mendez, F.; Leschka, S.; Fraile-Jurado, P. Assessment of coastal vulnerability to climate change hazards at the regional scale: The case study of the North Adriatic Sea. Nat. Hazards Earth Syst. Sci. 2012, 12, 2347–2368. [Google Scholar] [CrossRef]
- Zanuttigh, B.; Simcic, D.; Bagli, S.; Bozzeda, F.; Pietrantoni, L.; Zagonari, F.; Hoggart, S.; Nicholls, R.J. THESEUS decision support system for coastal risk management. Coast. Eng. 2014, 87, 218–239. [Google Scholar] [CrossRef]
- Van Dongeren, A.; Ciavola, P.; Martinez, G.; Viavattene, C.; Bogaard, T.; Ferreira, O.; Higgins, R.; McCall, R. Introduction to RISC-KIT: Resilience-increasing strategies for coasts. Coast. Eng. 2018, 134, 2–9. [Google Scholar] [CrossRef] [Green Version]
- OCDE. Core Set of Indicators for Environmental Performance Reviews; OCDE: Paris, France, 1993. [Google Scholar]
- EEA. The Changing Faces of Europe’s Coastal Areas; Number No. 6 in EEA Report; European Environment Agency: Copenhagen, Denmark, 2006. [Google Scholar]
- Patrício, J.; Elliott, M.; Mazik, K.; Papadopoulou, K.N.; Smith, C.J. DPSIR—Two Decades of Trying to Develop a Unifying Framework for Marine Environmental Management? Front. Mar. Sci. 2016, 3, 177. [Google Scholar] [CrossRef]
- Cooper, P. Socio-ecological accounting: DPSWR, a modified DPSIR framework, and its application to marine ecosystems. Ecol. Econ. 2013, 94, 106–115. [Google Scholar] [CrossRef] [Green Version]
- Wolanski, E.; Elliott, M. Estuarine Ecohydrology: An Introduction; Elsevier: Amsterdam, The Netherlands, 2015. [Google Scholar]
- Scharin, H.; Ericsdotter, S.; Elliott, M.; Turner, R.K.; Niiranen, S.; Blenckner, T.; Hyytiäinen, K.; Ahlvik, L.; Ahtiainen, H.; Artell, J.; et al. Processes for the sustainable stewardship of marine environments. Ecol. Econ. 2016, 128, 55–67. [Google Scholar] [CrossRef]
- Elliott, M.; Burdon, D.; Atkins, J.; Borja, A.; Cormier, R.; De Jonge, V.; Turner, R. “And DPSIR begat DAPSI (W) R (M)!”—A unifying framework for marine environmental management. Mar. Pollut. Bull. 2017, 118, 27–40. [Google Scholar] [CrossRef] [Green Version]
- Martinelli, L.; Zanuttigh, B.; Corbau, C. Assessment of coastal flooding hazard along the Emilia Romagna littoral, IT. Coast. Eng. 2010, 57, 1042–1058. [Google Scholar] [CrossRef]
- Benassai, G.; Di Paola, G.; Aucelli, P.P.C. Coastal risk assessment of a micro-tidal littoral plain in response to sea level rise. Ocean Coast. Manag. 2015, 104, 22–35. [Google Scholar] [CrossRef]
- Gornitz, V. Vulnerability of the East Coast, USA to future sea level rise. J. Coast. Res. 1990, 9, 201–237. [Google Scholar]
- Gornitz, V.M.; Daniels, R.C.; White, T.W.; Birdwell, K.R. The development of a coastal risk assessment database: Vulnerability to sea-level rise in the US Southeast. J. Coast. Res. 1994, 12, 327–338. [Google Scholar]
- Cogswell, A.; Greenan, B.J.; Greyson, P. Evaluation of two common vulnerability index calculation methods. Ocean Coast. Manag. 2018, 160, 46–51. [Google Scholar] [CrossRef]
- Balica, S.F.; Wright, N.G.; Van der Meulen, F. A flood vulnerability index for coastal cities and its use in assessing climate change impacts. Nat. Hazards 2012, 64, 73–105. [Google Scholar] [CrossRef] [Green Version]
- Lozoya, J.P.; Sardá, R.; Jiménez, J.A. A methodological framework for multi-hazard risk assessment in beaches. Environ. Sci. Policy 2011, 14, 685–696. [Google Scholar] [CrossRef]
- Torresan, S.; Critto, A.; Dalla Valle, M.; Harvey, N.; Marcomini, A. Assessing coastal vulnerability to climate change: Comparing segmentation at global and regional scales. Sustain. Sci. 2008, 3, 45–65. [Google Scholar] [CrossRef]
- Vousdoukas, M.I.; Mentaschi, L.; Voukouvalas, E.; Verlaan, M.; Feyen, L. Extreme sea levels on the rise along Europe’s coasts. Earth’s Future 2017, 5, 304–323. [Google Scholar] [CrossRef]
- Vousdoukas, M.I.; Mentaschi, L.; Voukouvalas, E.; Verlaan, M.; Jevrejeva, S.; Jackson, L.P.; Feyen, L. Global probabilistic projections of extreme sea levels show intensification of coastal flood hazard. Nat. Commun. 2018, 9, 1–12. [Google Scholar] [CrossRef] [Green Version]
- Nicholls, R.; Wilson, T. Integrated impacts on coastal areas and river flooding. In Regional Climate Change Impact and Response Studies in East Anglia and North West England (RegIS); UK Climate Impacts Programme (UKCIP): Oxford, UK, 2001; pp. 54–103. [Google Scholar]
- Archetti, R.; Bolognesi, A.; Casadio, A.; Maglionico, M. Development of flood probability charts for urban drainage network in coastal areas through a simplified joint assessment approach. Hydrol. Earth Syst. Sci. 2011, 15, 3115. [Google Scholar] [CrossRef] [Green Version]
- Apollonio, C.; Bruno, M.F.; Iemmolo, G.; Molfetta, M.G.; Pellicani, R. Flood Risk Evaluation in Ungauged Coastal Areas: The Case Study of Ippocampo (Southern Italy). Water 2020, 12, 1466. [Google Scholar] [CrossRef]
- Damiani, L.; Saponieri, A.; Valentini, N. Validation of swash model for run-up prediction on a natural embayed beach. Ital. J. Eng. Geol. Environ. 2018, 2018, 27–37. [Google Scholar]
- Saponieri, A.; Di Risio, M.; Pasquali, D.; Valentini, N.; Aristodemo, F.; Tripepi, G.; Celli, D.; Streicher, M.; Damiani, L. Beach profile evolution in front of storm seawalls: A physical and numerical study. Coast. Eng. Proc. 2018, 36, 70. [Google Scholar] [CrossRef]
- Malcangio, D.; Melena, A.; Damiani, L.; Mali, M.; Saponieri, A. Numerical study of water quality improvement in a port through a forced mixing system. WIT Trans. Ecol. Environ. 2017, 220, 69–80. [Google Scholar]
- Baldock, D.; Beaufoy, G.; Bennett, G.; Clark, J. Nature Conservation and New Directions in the EC Common Agricultural Policy: The Potential Role of EC Policies in Maintaining Farming and Management Systems of High Nature Value in the Community; Institute for European Environmental Policy: Bruxelles, Belgium, 1993. [Google Scholar]
- Pellicani, R.; Miccoli, D.; Spilotro, G.; Gallipoli, M.R.; Mucciarelli, M.; Bianca, M. Dynamic response of a rocky cliff under the sea wave pulse: A study along the Adriatic coast of Polignano (Apulia, Italy). Environ. Earth Sci. 2015, 73, 6243–6257. [Google Scholar] [CrossRef]
- Piscopia, R.; Inghilesi, R.; Panizzo, A.; Corsini, S.; Franco, L. Analysis of 12-year wave measurements by the Italian Wave Network. In Coastal Engineering 2002: Solving Coastal Conundrums; World Scientific: Singapore, 2003; pp. 121–133. [Google Scholar]
- Damiani, L.; Bruno, M.F.; Molfetta, M.G.; Nobile, B. Coastal zone monitoring in Apulia region: First analysis on meteomarine climate. In Proceedings of the 5th International Symposium on Environmental Hydraulics (ISEH 2007), Tempe, AZ, USA, 4–7 December 2007. [Google Scholar]
- Saponieri, A.; Valentini, N.; Damiani, L.; Amoruso, V. Wave energy potential offshore Apulian coasts (Italy). In Proceedings of the Twenty-fifth International Ocean and Polar Engineering Conference, Kona, HI, USA, 21–26 June 2015; International Society of Offshore and Polar Engineers: Mountain View, CA, USA, 2015. [Google Scholar]
- Damiani, L.; Petrillo, A.; Ranieri, G. Management of coastal area in Apulia Region. Landsc. Water Hist. Innov. Sustain. Des. 2002, 1, 71–80. [Google Scholar]
- Pasquali, D.; Bruno, M.; Celli, D.; Damiani, L.; Di Risio, M. A simplified hindcast method for the estimation of extreme storm surge events in semi-enclosed basins. Appl. Ocean Res. 2019, 85, 45–52. [Google Scholar] [CrossRef]
- Bruno, M.F.; Molfetta, M.G.; Pratola, L.; Mossa, M.; Nutricato, R.; Morea, A.; Nitti, D.O.; Chiaradia, M.T. A combined approach of field data and earth observation for coastal risk assessment. Sensors 2019, 19, 1399. [Google Scholar] [CrossRef] [Green Version]
- Ramieri, E.; Hartley, A.; Barbanti, A.; Santos, F.D.; Gomes, A.; Hilden, M.; Laihonen, P.; Marinova, N.; Santini, M. Methods for assessing coastal vulnerability to climate change. ETC CCA Tech. Pap. 2011, 1, 1–93. [Google Scholar]
- Valentini, N.; Saponieri, A.; Damiani, L. A new video monitoring system in support of Coastal Zone Management at Apulia Region, Italy. Ocean Coast. Manag. 2017, 142, 122–135. [Google Scholar] [CrossRef]
- Valentini, N.; Saponieri, A.; Molfetta, M.G.; Damiani, L. New algorithms for shoreline monitoring from coastal video systems. Earth Sci. Inform. 2017, 10, 495–506. [Google Scholar] [CrossRef]
- Malcangio, D.; Donvito, C.; Ungaro, N. Statistical analysis of bathing water quality in Puglia Region (Italy). Int. J. Environ. Res. Public Health 2018, 15, 1010. [Google Scholar] [CrossRef] [PubMed] [Green Version]
- Mali, M.; Malcangio, D.; Dell’Anna, M.M.; Damiani, L.; Mastrorilli, P. Influence of hydrodynamic features in the transport and fate of hazard contaminants within touristic ports. Case study: Torre a Mare (Italy). Heliyon 2018, 4, e00494. [Google Scholar] [CrossRef] [PubMed] [Green Version]
- Damiani, L.; Petrillo, A.; Ranieri, G. The erosion along the Apulian coast near the Ofanto river. WIT Trans. Built Environ. 2003, 70, 12. [Google Scholar]
- Saponieri, A.; Valentini, N.; Di Risio, M.; Pasquali, D.; Damiani, L. Laboratory Investigation on the Evolution of a Sandy Beach Nourishment Protected by a Mixed Soft–Hard System. Water 2018, 10, 1171. [Google Scholar] [CrossRef] [Green Version]
- Apulia Region. Piano Regionale Delle Coste (PRC). 2008. Available online: http://www.sit.puglia.it (accessed on 4 June 2020).
- Piscitelli, C.; Rotondo, F.; Selicato, F.; Selicato, S. Planning the coastal management. In The Apulia Region Plan. In Proceedings of the 2014 International Conference on Civil Engineering, Santorini Island, Greece, 17–21 July 2014. [Google Scholar]
- Gari, S.R.; Newton, A.; Icely, J.D. A review of the application and evolution of the DPSIR framework with an emphasis on coastal social-ecological systems. Ocean Coast. Manag. 2015, 103, 63–77. [Google Scholar] [CrossRef] [Green Version]
- Bruno, M.; Molfetta, M.; Petrillo, A. The influence of interannual variability of mean sea level in the Adriatic Sea on extreme values. J. Coast. Res. 2014, 70, 241–246. [Google Scholar] [CrossRef]
- Apulian Regional Watershed Authority. Piano Stralcio di Assetto Idrogeologico (PAI). 2005. Available online: http://www.adb.puglia.it (accessed on 4 June 2020).
- Nitti, D.O.; Nutricato, R.; Lorusso, R.; Lombardi, N.; Bovenga, F.; Bruno, M.F.; Chiaradia, M.T.; Milillo, G. On the geolocation accuracy of COSMO-SkyMed products. In SAR Image Analysis, Modeling, and Techniques XV; International Society for Optics and Photonics: Washington, DC, USA, 2015; Volume 9642, pp. 69–80. [Google Scholar]
- Valentini, N.; Damiani, L.; Molfetta, M.G.; Saponieri, A. New coastal video-monitoring system achievement and development. Coast. Eng. Proc. 2017, 1, 11. [Google Scholar] [CrossRef]
- Armaroli, C.; Duo, E. Validation of the coastal storm risk assessment framework along the Emilia-Romagna coast. Coast. Eng. 2018, 134, 159–167. [Google Scholar] [CrossRef] [Green Version]
- Valentini, N.; Saponieri, A.; Danisi, A.; Pratola, L.; Damiani, L. Exploiting remote imagery in an embayed sandy beach for the validation of a runup model framework. Estuar. Coast. Shelf Sci. 2019, 225, 106244. [Google Scholar] [CrossRef] [Green Version]
- Cooper, J.; McLaughlin, S. Contemporary multidisciplinary approaches to coastal classification and environmental risk analysis. J. Coast. Res. 1998, 14, 512–524. [Google Scholar]


| Coastal Vulnerability Indicators | SCORES | ||
|---|---|---|---|
| 0 | 1 | 2 | |
| SLR: Average speed of Sea Level Rise (mm/yr) | <0 | 0 ÷ 4 | >4 |
| HWL: Highest water level (m) | <1.5 | 1.5 ÷3 | >3 |
| TEV: Eroded or accreted shoreline (%) | <20 | 20 ÷ 60 | >60 |
| GEC: Coastal Geology- Rocky shoreline (%) | >70 | 40 ÷ 70 | <40 |
| ODC: Presence of coastal defence works (%) | <5 | 5 ÷ 35 | >35 |
| : Municipal area in RICE (%) | <5 | 5 ÷ 10 | >10 |
| Coastal Exposure Indicators | SCORES | ||
| 0 | 1 | 2 | |
| : Urban and/or industrial area in RICE (%) | <10 | 10 ÷ 40 | >40 |
| : High ecological value areas in RICE (%) | <5 | 5 ÷ 30 | >30 |
| : Resident population in RICE (1000 hab.) | <5 | 5 ÷ 20 | >20 |
| : Increase in urban area in a 10 km wide coastal area (%) | <5 | 5 ÷ 10 | >10 |
| Added Coastal Vulnerability Indicators | SCORES | ||
|---|---|---|---|
| 0 | 1 | 2 | |
| PSE: Past shoreline erosion (%) | <20 | 20 ÷ 60 | >60 |
| RSE: Recent shoreline erosion (%) | <20 | 20 ÷ 60 | >60 |
| : Hydraulic hazard in RICE (%) | <10 | 10 ÷ 20 | >20 |
| Present Day | RCP45 | RCP85 | ||||
|---|---|---|---|---|---|---|
| PU | SRL (m) | (m) | SRL (m) | (m) | SRL (m) | (m) |
| PU1 | 0.35 | 1.0 | 0.44 | 1.1 | 0.72 | 1.1 |
| PU2 | 0.35 | 0.9 | 0.45 | 1.0 | 0.72 | 1.0 |
| PU3 | 0.35 | 1.0 | 0.46 | 1.1 | 0.72 | 1.1 |
| PU4 | 0.35 | 1.0 | 0.46 | 1.1 | 0.72 | 1.1 |
| PU5 | 0.35 | 1.1 | 0.46 | 1.2 | 0.72 | 1.2 |
| PU6 | 0.35 | 1.1 | 0.47 | 1.2 | 0.76 | 1.2 |
| PU7 | 0.35 | 1.0 | 0.47 | 1.1 | 0.75 | 1.1 |
| Sandy Shoreline | Average Width | Erosion 1960–1992 | Erosion 1992–2005 | Erosion 2005–2017 | |
|---|---|---|---|---|---|
| (km) | (m) | (%) | (%) | (%) | |
| PU1 | 81.9 | 30.6 | 21.0 | 22.3 | 39.6 |
| PU2 | 77.9 | 29.9 | 32.5 | 28.0 | 31.9 |
| PU3 | 36.3 | 18.4 | 55.4 | 3.2 | 43.2 |
| PU4 | 62.8 | 19.8 | 64.9 | 23.9 | 31.9 |
| PU5 | 18.7 | 23.3 | 19.2 | 16.1 | 45.3 |
| PU6 | 42.1 | 20.4 | 25.8 | 4.3 | 22.9 |
| PU7 | 46.5 | 29.6 | 26.5 | 2.3 | 25.3 |
| Total | 366.2 | 25.5 | 35.5 | 16.2 | 33.2 |
| Indicator | Data Source |
|---|---|
| SLR | EUrosion (2006); IPCC (2013); LISCoAsT (2018) |
| HWL | EUrosion (2006); Bruno et al. (2014); LISCoAsT (2016) |
| TEV | Aerial photographs (1992, 2005, 2017) |
| PSE | Historic maps, aerial photographs (1960) |
| GEC | RCP (2005); Regional hydro-morphological map (2012) |
| Hydro-morphological map (2012) | |
| PAI Apulian Region Basin Authority (2005) | |
| R.C.P. (2005); Regional hydromorphological map (2012) | |
| ISTAT (1991, 2001, 2011) | |
| CORINE Land Cover CLC (1990, 2000, 2012, 2018) | |
| CLC (1990, 2000, 2012, 2018); Natura 2000 Network, Regional Parks and reserves | |
| CLC (1990, 2000, 2012, 2018) |
© 2020 by the authors. Licensee MDPI, Basel, Switzerland. This article is an open access article distributed under the terms and conditions of the Creative Commons Attribution (CC BY) license (http://creativecommons.org/licenses/by/4.0/).
Share and Cite
Bruno, M.F.; Saponieri, A.; Molfetta, M.G.; Damiani, L. The DPSIR Approach for Coastal Risk Assessment under Climate Change at Regional Scale: The Case of Apulian Coast (Italy). J. Mar. Sci. Eng. 2020, 8, 531. https://doi.org/10.3390/jmse8070531
Bruno MF, Saponieri A, Molfetta MG, Damiani L. The DPSIR Approach for Coastal Risk Assessment under Climate Change at Regional Scale: The Case of Apulian Coast (Italy). Journal of Marine Science and Engineering. 2020; 8(7):531. https://doi.org/10.3390/jmse8070531
Chicago/Turabian StyleBruno, Maria Francesca, Alessandra Saponieri, Matteo Gianluca Molfetta, and Leonardo Damiani. 2020. "The DPSIR Approach for Coastal Risk Assessment under Climate Change at Regional Scale: The Case of Apulian Coast (Italy)" Journal of Marine Science and Engineering 8, no. 7: 531. https://doi.org/10.3390/jmse8070531