1. Introduction
In the past few decades, hurricane and tsunami-induced high storm surge and extreme waves, have caused devastating impacts on coastal structures. Among these, the 2005 Hurricane Katrina hitting the coasts of Alabama, Mississippi and Louisiana was one of the costliest natural disasters in U.S. history, which has caused extensive damages to infrastructures and coastal structures [
1,
2]. The 2004 India Ocean Tsunami, caused by a magnitude 9.0 earthquake, due to its tens of meters tsunami run-up, almost destroyed entire cities during which many coastal bridges got damaged [
3,
4,
5,
6,
7].
Coastal bridges are damageable by these natural disasters. These extreme wave loadings caused by hurricanes and tsunamis can cause huge damage to both bridge superstructures and substructures. The costs of rebuilding the coastal bridges damaged by the hurricanes Katrina and Ivan was more than
$1 billion [
8]. Studies on bridge damage under extreme waves point out that the main mechanism is that the extreme waves-induced buoyancy and lateral force broke the connections between the superstructures and the substructures, which caused the unsetting and displacement of bridge decks. Due to the complex geometries of coastal bridge structures, there is no accurate assessment criteria to the bridge failure so far and the failure mechanisms of coastal bridges under extreme waves are still unclear now [
9]. Both the rebuilding of the damaged bridges and the protection of under-construction or vulnerable existing coastal bridges on the Pacific coast requires the accurate estimation of extreme wave forces on coastal bridge superstructures. Therefore, extreme waves-bridge interactions have been a hot topic for offshore engineers [
10].
During the last several decades, both experimental methods and numerical simulations have been conducted to better understand tsunami or hurricane-induced wave forces on coastal structures. For example, a small-scale laboratory experiment was carried out by EI Ghamry to study wave uplift forces and pressures on a dock, exerted by periodic non-breaking and breaking waves [
11]. Based on the laboratory tests with various types of incident waves, Wang developed simple rules to estimate the maximum uplift pressures on a flat plat [
12]. It was found that there were two components of wave-in-deck forces: short duration impact force and long duration lower intensity force. French confirmed the above conclusions and further developed an empirical equation based on his investigations of the peak uplift forces on the platform [
13]. Iradjpanah developed a finite element model to analyze the effects of wave hydrodynamics on a horizontal platform [
14]. Denson made a 1:24 scale model of the Bay St. Louis Mississippi bridge to investigate lift and drag forces and rolling moment caused by normal incidence waves [
15,
16]. It was found that the bridge was mostly damaged by the wave-induced moments and a strong anchorage system that prevented the bridge failing effectively. Kaplan et al. described the theoretical analysis and experiment dates to predict the large incident waves’ impact forces on offshore platform deck structures and the influences of wave heading angles on different structural elements [
17]. Most of these investigations were based on the Morison’s equation, but the Morison’s equation was applicative when the structure sizes were small in comparison to wave length. These approaches for offshore structures are not suitable for current coastal bridge superstructures. Recently, Douglass et al. provided a review of existing methods related to estimating wave forces on highway bridge superstructures and other coastal and offshore structures, and found that exiting methods were inadequate for estimating wave forces on bridge decks [
18]. A new empirical equation was proposed by Douglass et al. to estimate wave forces on bridge decks based on laboratory experiments [
18]. This empirical equation can be used to estimate the wave forces on bridge decks but the accuracy of the empirical equation was limited because the method is purely hydrostatic and does not require analyzing over a wave length. The main factor in force prediction for this method is the height between the wave crest elevation and the structure. McPherson proposed a new method to calculate the horizontal and vertical forces on typical U.S. bridges based on large scale wave basin experiments and existing theoretical methods [
19]. The bridge model was kept at a constant height while water depth was varied to simulate both elevated and submerged conditions. In that work, the guardrail was placed only at the leading edge of the model (into the page direction) and was partially permeable and thus created three-dimensional effects. More recently, Xu et al. proposed a numerical method for predicting solitary wave force on costal bridge decks [
20]. This method can be expanded to cases where different deck cross sections are considered and to scenarios where different wave parameters are involved. The expanded formula could provide straightforward but advisable results for practicing engineers. Hence, a full scale of bridge superstructures’ numerical simulation is useful for the study of wave forces acting on bridge superstructures, and a laboratory experiment with the same conditions and same geometry is necessary to demonstrate this numerical model.
A literature review of studies on wave forces on coastal highway bridges indicated the importance of the trapped air between the bridge girders on the resultant wave force on bridges. Robertson et al. found that a number of coastal bridges were significantly damaged due to hurricane-induced storm surges and wave loadings [
21,
22]. The submerged bridges were subjected to hydrodynamic uplift forces wave action, buoyancy and enhanced by air trapped below the bridge deck. Cuomo et al. presented a large-scale experimental work to gain insights on the dynamics of wave force on coastal bridges [
23]. They found that air vents can effectively reduce the quasi-static upward loads on bridge decks. The same phenomenon is observed by Xu and Cai et al. [
24]. They proposed a solitary wave model to explore the interaction process between waves and a bridge deck with air venting holes. They found the air vents can reduce the uplift force remarkably, but the air events can also increase the horizontal force, which requires a more sufficient horizontal supporting system. Azadbakht and Yim investigated and quantified the effects of the trapped air on resultant wave forces under various wave field conditions and bridge geometry characteristics [
25]. Xiao et al. proposed a wave-loading model based on the Reynolds Averaged Navier-Stokes (RANS) equations to simulate the wave forces on the Biloxi Bay Bridge during Hurricane Katrina [
26]. The type of bridge girder in these above literature searches were
T or π girder, thus, the trapped air played an important part in these types of girder bridges. Most of the past literature was focused on these girder bridges. But the box girder is the main type of medium span and long span bridge, particularly on the west Pacific coast. Due to the difference of the geometry characteristics between box girders and
T or πgirders, the failure mechanisms of these coastal bridges under extreme wave forces are quite different. Hence, the failure mechanisms and wave force formulas of box girder coastal bridges under extreme wave conditions are useful for the design and protection of the medium span and long span box girder bridge.
In this paper, a 2D numerical model for extreme wave-girder interactions was proposed to investigate the wave forces on the box girder under extreme wave conditions, in which the RANS equations combined with the k-ε turbulence model and the Volume of Fluid (VOF) method were applied for wave simulations. The validation of the present model with experimental data under the same conditions was first presented. Then, a parametric study was conducted to investigate the effects of the wave parameters and submerged coefficients on wave forces under various extreme wave conditions (e.g., wave heights, wave periods and water depths). With the present model, a function of the wave forces and wave conditions for box girder bridge protection against extreme wave conditions was finally proposed to predict the extreme wave forces on the box girder.
3. Model Verification
In this section, the numerical wave profiles and the predicted wave forces are compared with the theoretical wave profile and the experimental wave forces, respectively. These verifications ensure that the results in the following parametric study are reliable.
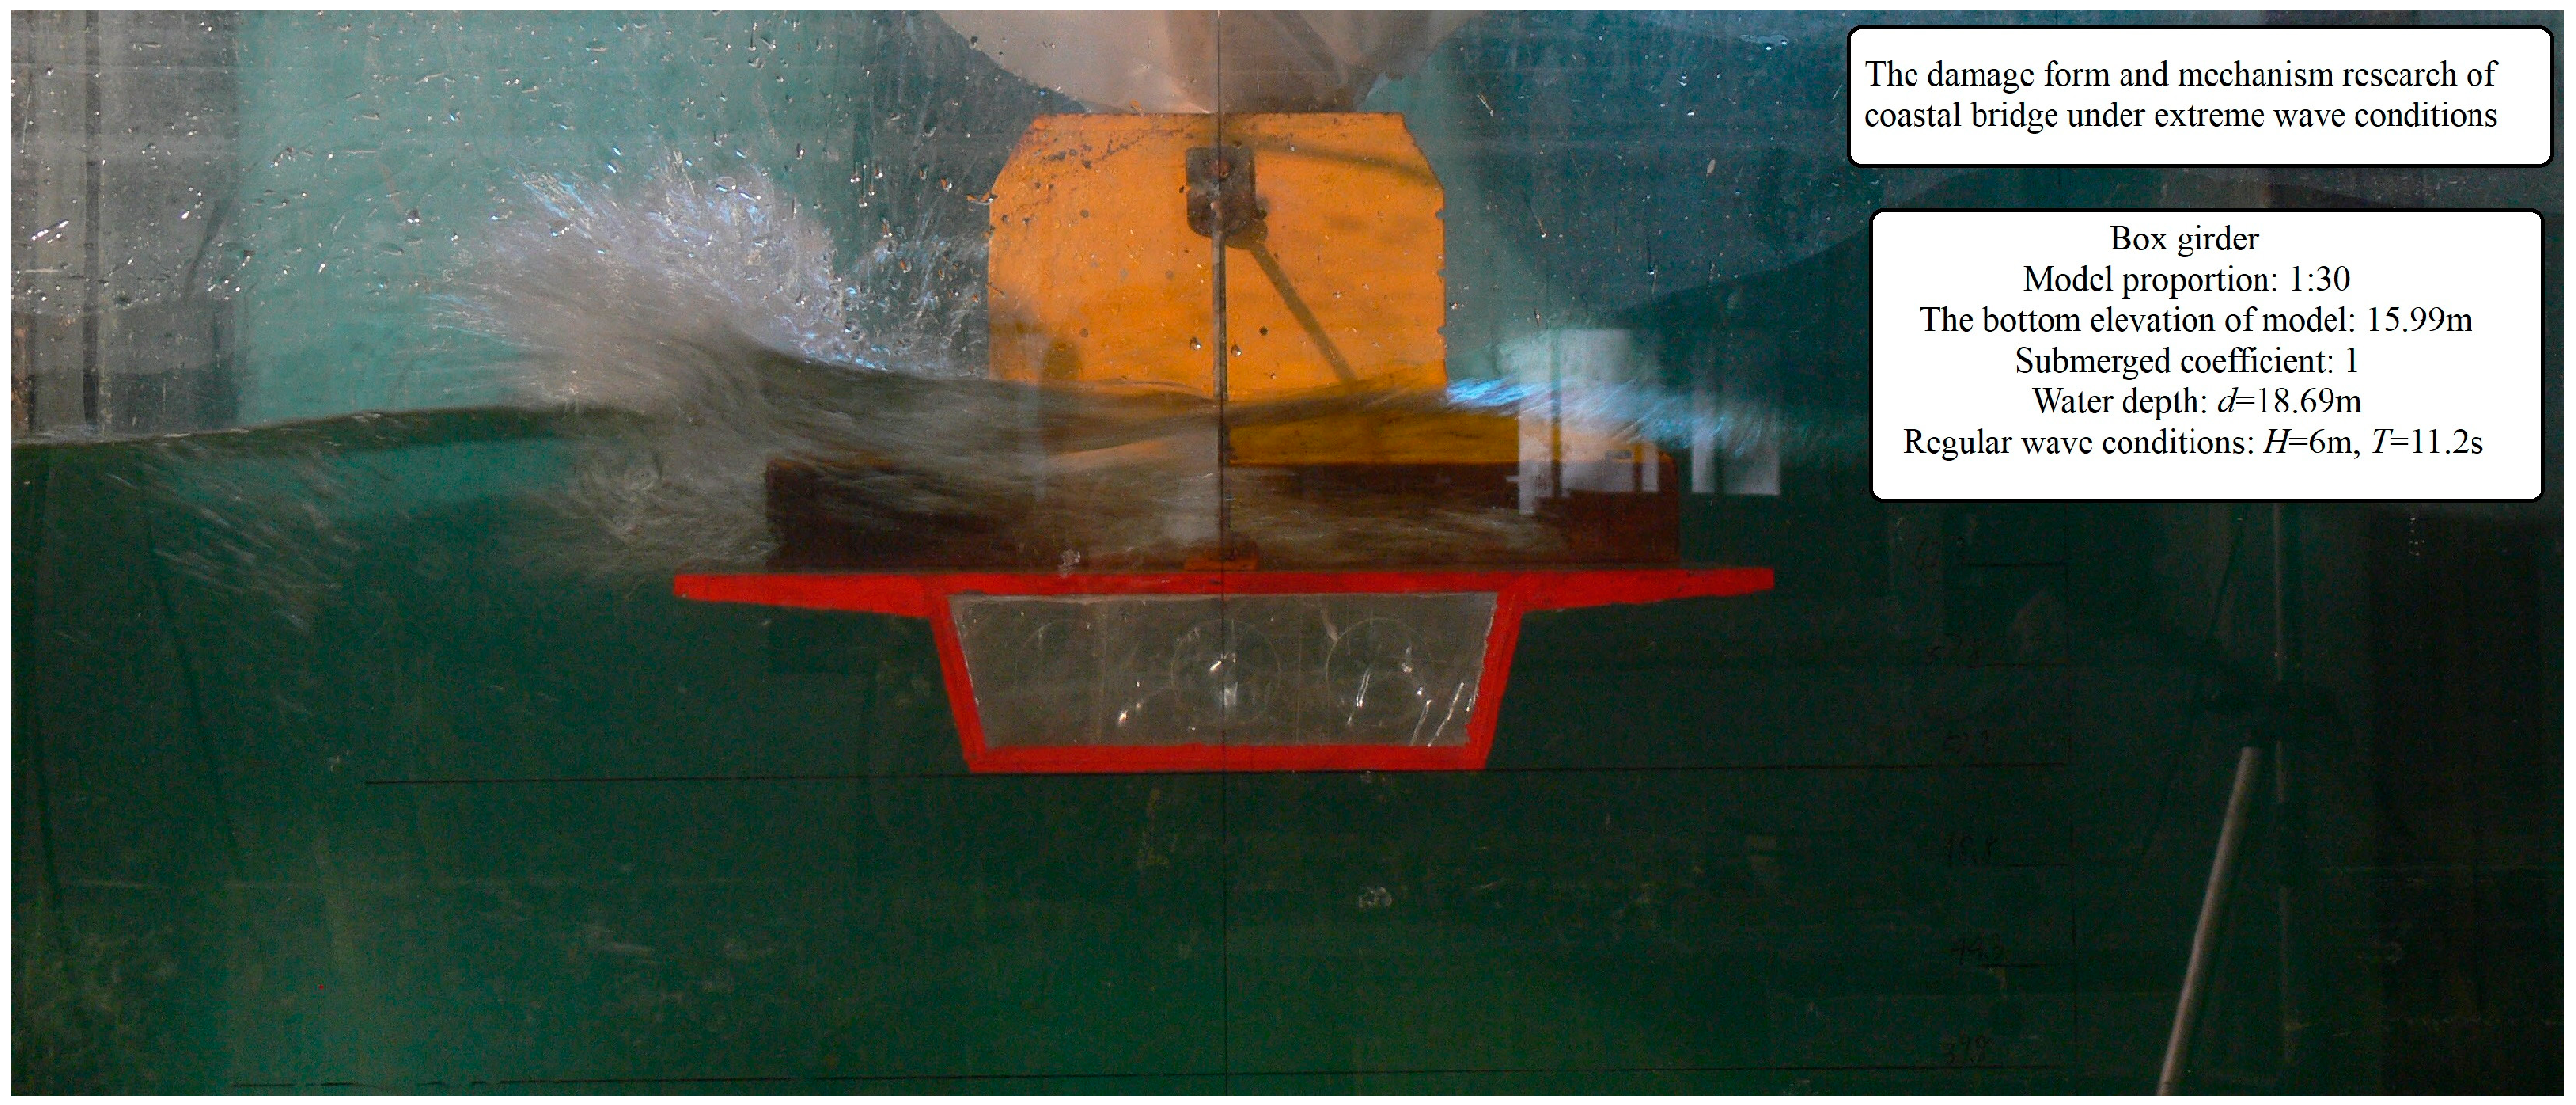
The experiment in the same conditions as the numerical model was conducted in Tianjin Port Engineering Institute Ltd. (Tianjin, China)of China Communications Construction Company First Harbor Engineering Company Ltd. (Tianjin, China).As shown in
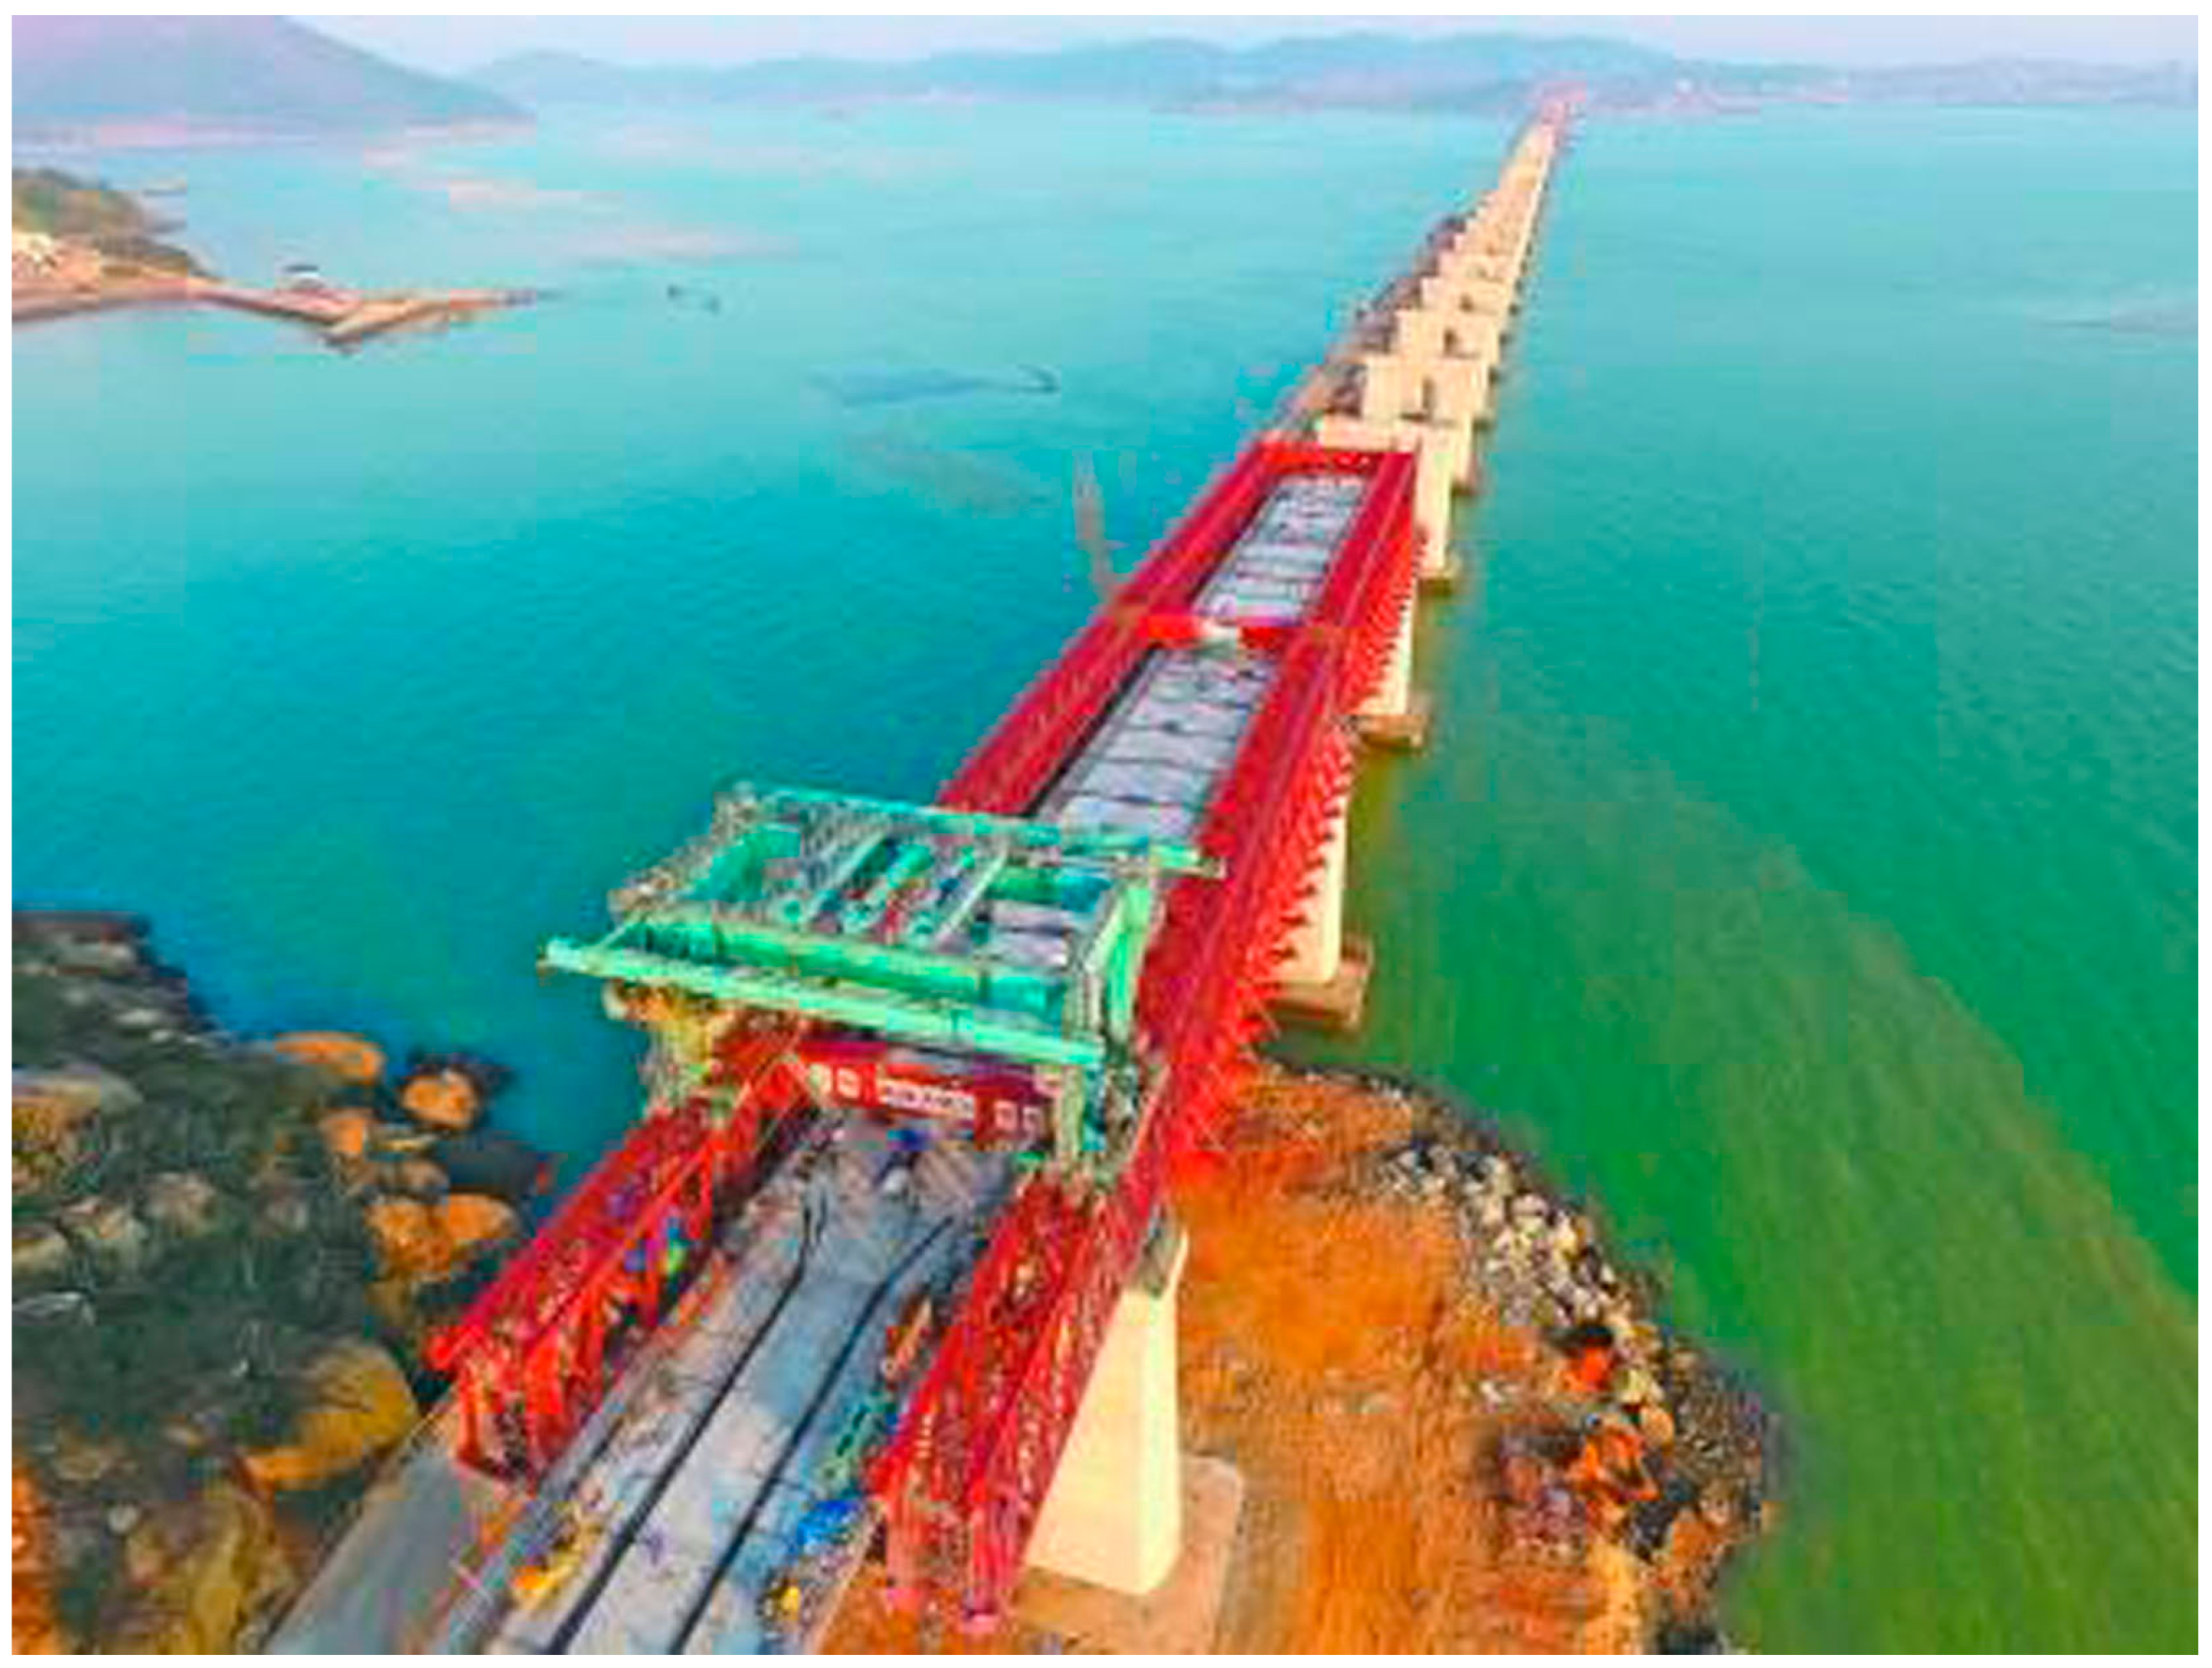
Figure 2, no reflection wave machine or intelligent data acquisition system were used in this experiment. The length, width and height of this wave flume is 68.0 m, 1.0 m, 1.6 m, respectively. The model proportion of this experiment is 1:30. In order to validate the numerical model by comparing numerical results with experimental data, wave forces on the girder bridge are calculated under the same conditions with the same wave heights and wave periods as those in the experiment. The wave parameters have been chosen based on the observed values of an under-construction coastal bridge in Taiwan strait. A picture taken for the bridge under construction is shown in
Figure 3. According to the wave heights and wave periods used in this study, it is found that the Stokes’ fifth order wave theory is adopted for the numerical model. Zhu et al. proposed a range of several wave theories based on the measured data and analysis of these data [
30]. It is suggested that T
≤ 10 for Stokes’ fifth order wave theory and T
≥ 10 for the cnoidal wave theory, this parameter in the current study is 4.6 <T
< 9.9. Therefore, the Stokes’ fifth order wave theory has been chosen forthe current study. T is wave period and g is gravitational acceleration.
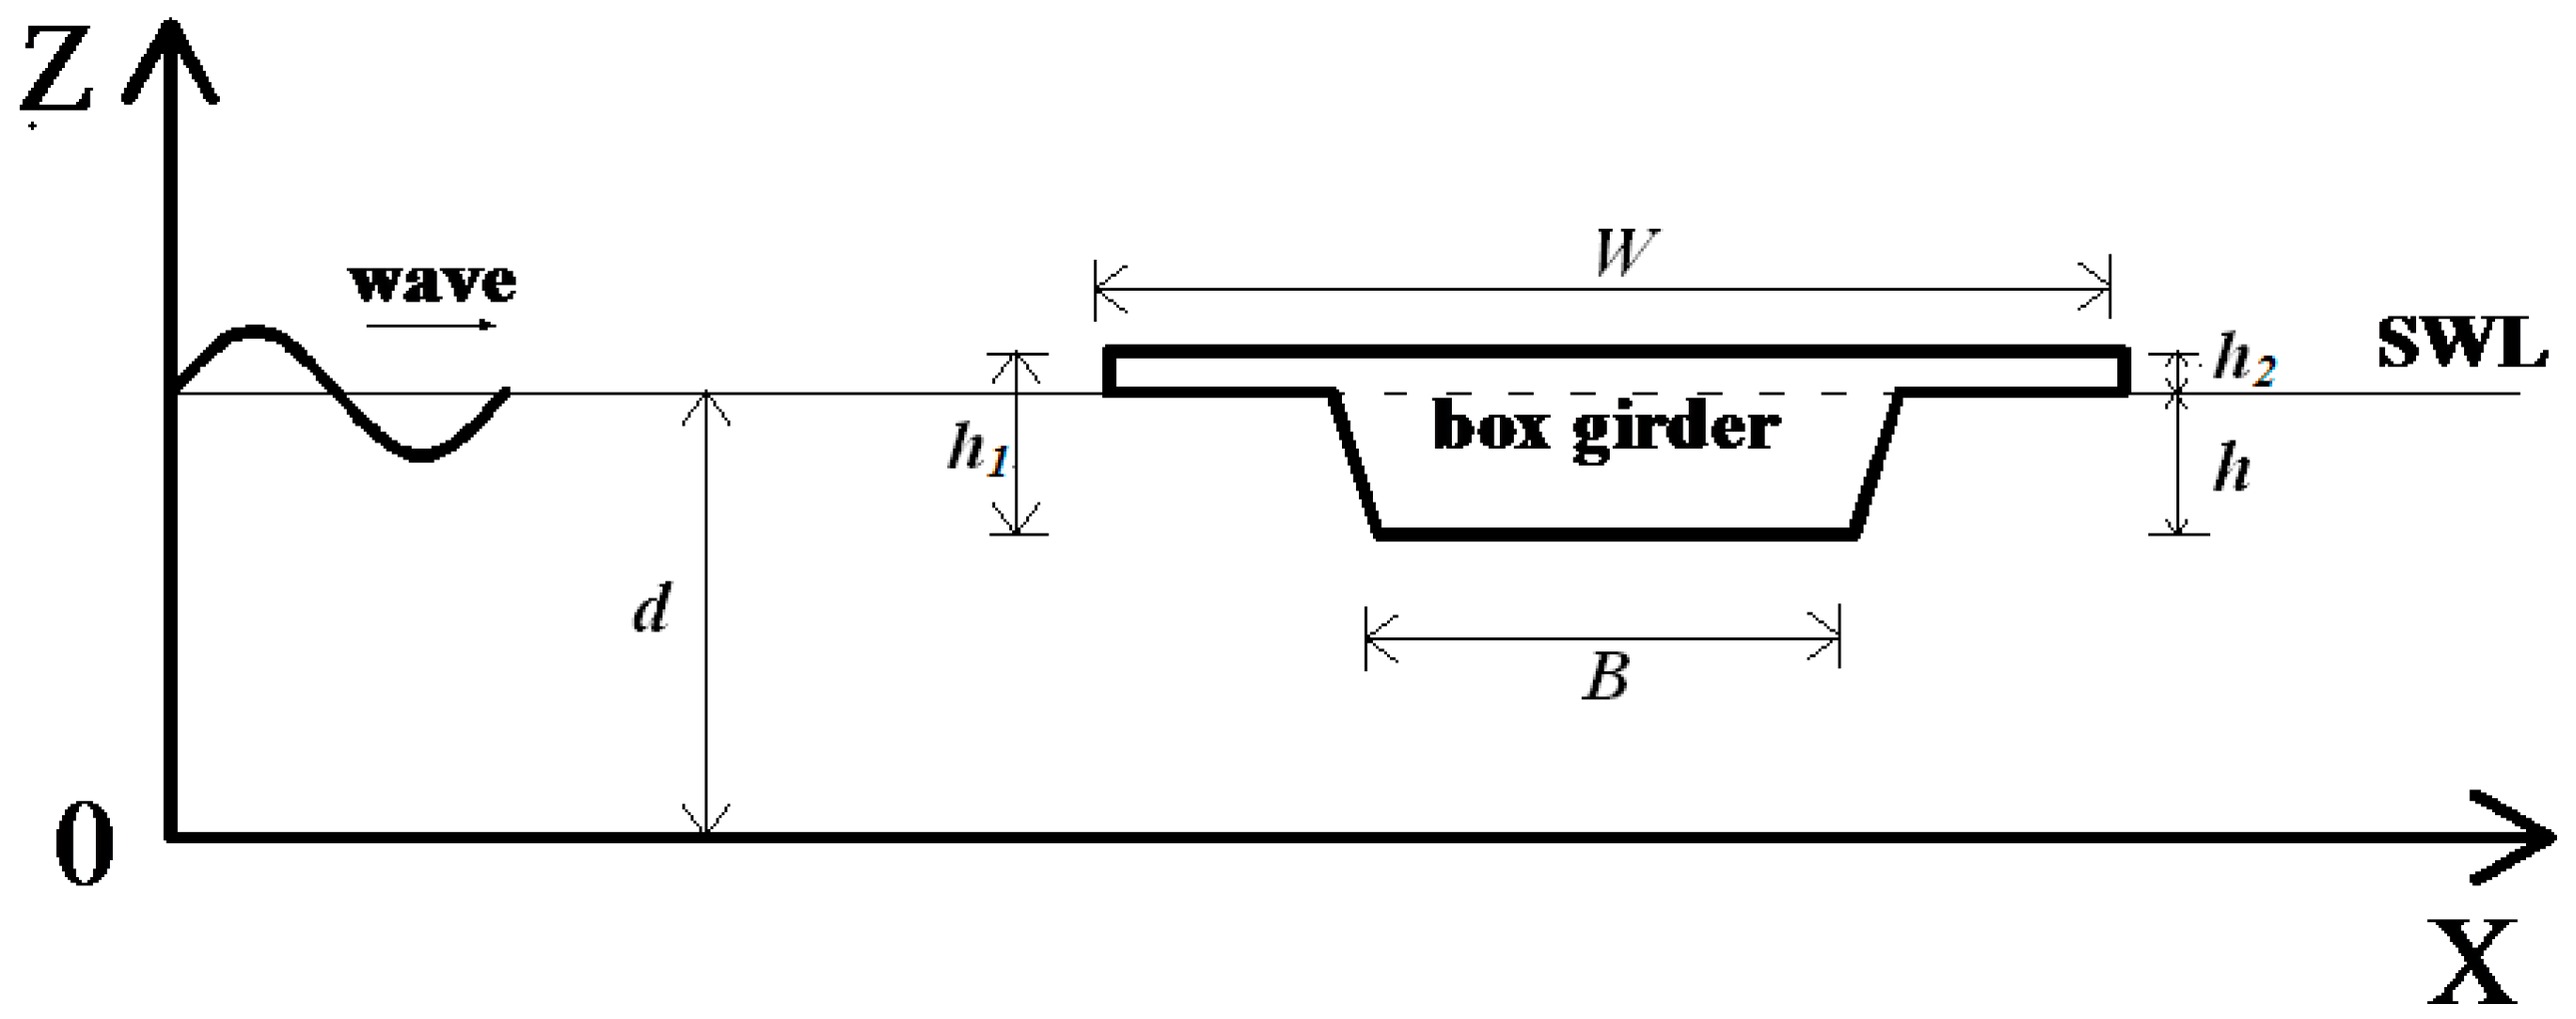
Figure 4 shows the sketch of the geometry model in the computational domain, which is similar to the experiment setups. The dimension of the box girder is as follows: the width of top plate (
W) is 15 m, the width of bottom plate (
B) is 7 m, the height of box girder (
h1) is 2.7 m, the height of flange plate (
h2) is 0.6 m and submerged depths (
h), which is widely used in the design of box girder coastal bridge. The horizontal length and vertical length of the computational domain is 700 m and 30 m, respectively. The water depth
d = 18.69 m, the coordinate of the middle bottom point of the girder is (300, 15.99) in the computation domain. This case was conducted for comparing with the experimental data, the wave height
H = 6 m, the wave period
T = 11.2 s and the submerged coefficient
Cs (
h/
h1) = 1.
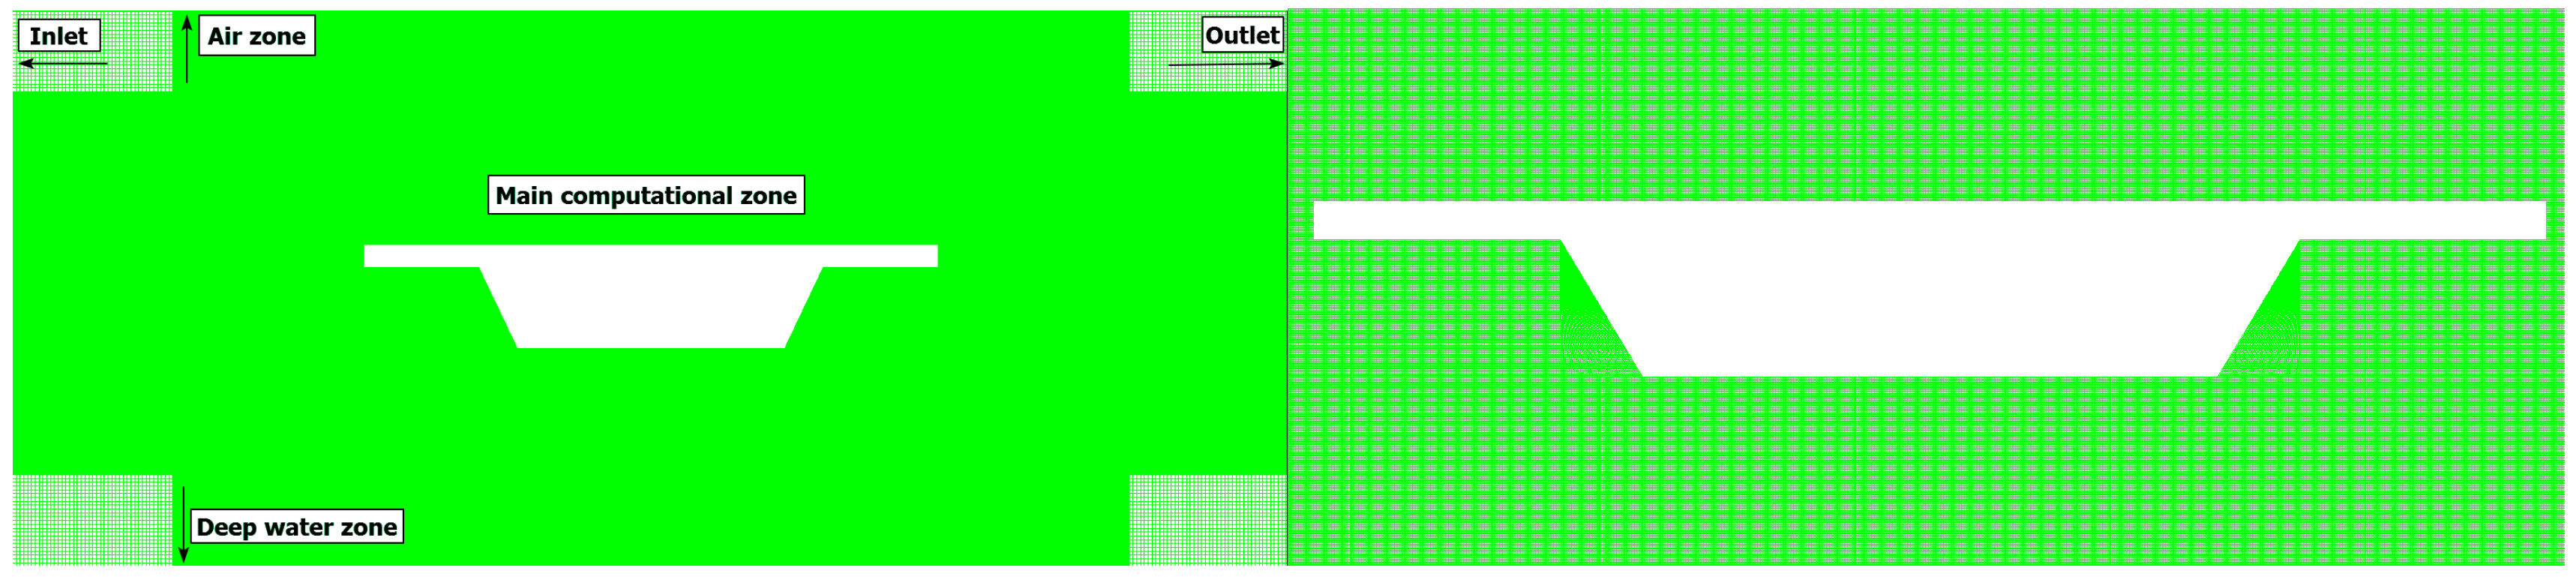
In order to reduce computational time and improve calculation accuracy, the denser grid method is adopted. Nearby the box girder, the grid is refined as shown in
Figure 5. Constant spatial distances of Δ
x = 0.1 m, Δ
z = 0.02 m (Δ
x is horizontal length of grid and Δz is vertical length of grid) was adopted for non-main computational zone. The length and width of the main computational domain is 25 m, 10 m, respectively. For the main computational domain, different grid resolutions were conducted to study the convergence of meshes. There were nine kinds of mesh sizes chosen.
Figure 6 illustrates the maximum uplift force (
Fvmax) versus various mesh sizes (Δ
x·Δ
z) under the wave conditions
T = 11.2 s,
H = 6 m,
d = 18.69 m, and
Cs = 1.5.
Figure 6 shows that the grid size with Δ
x = 0.02 m, Δ
z = 0.02 m is fine enough for simulation. To provide a stable iteration and precise simulation, the time step is 0.01 s in this paper.
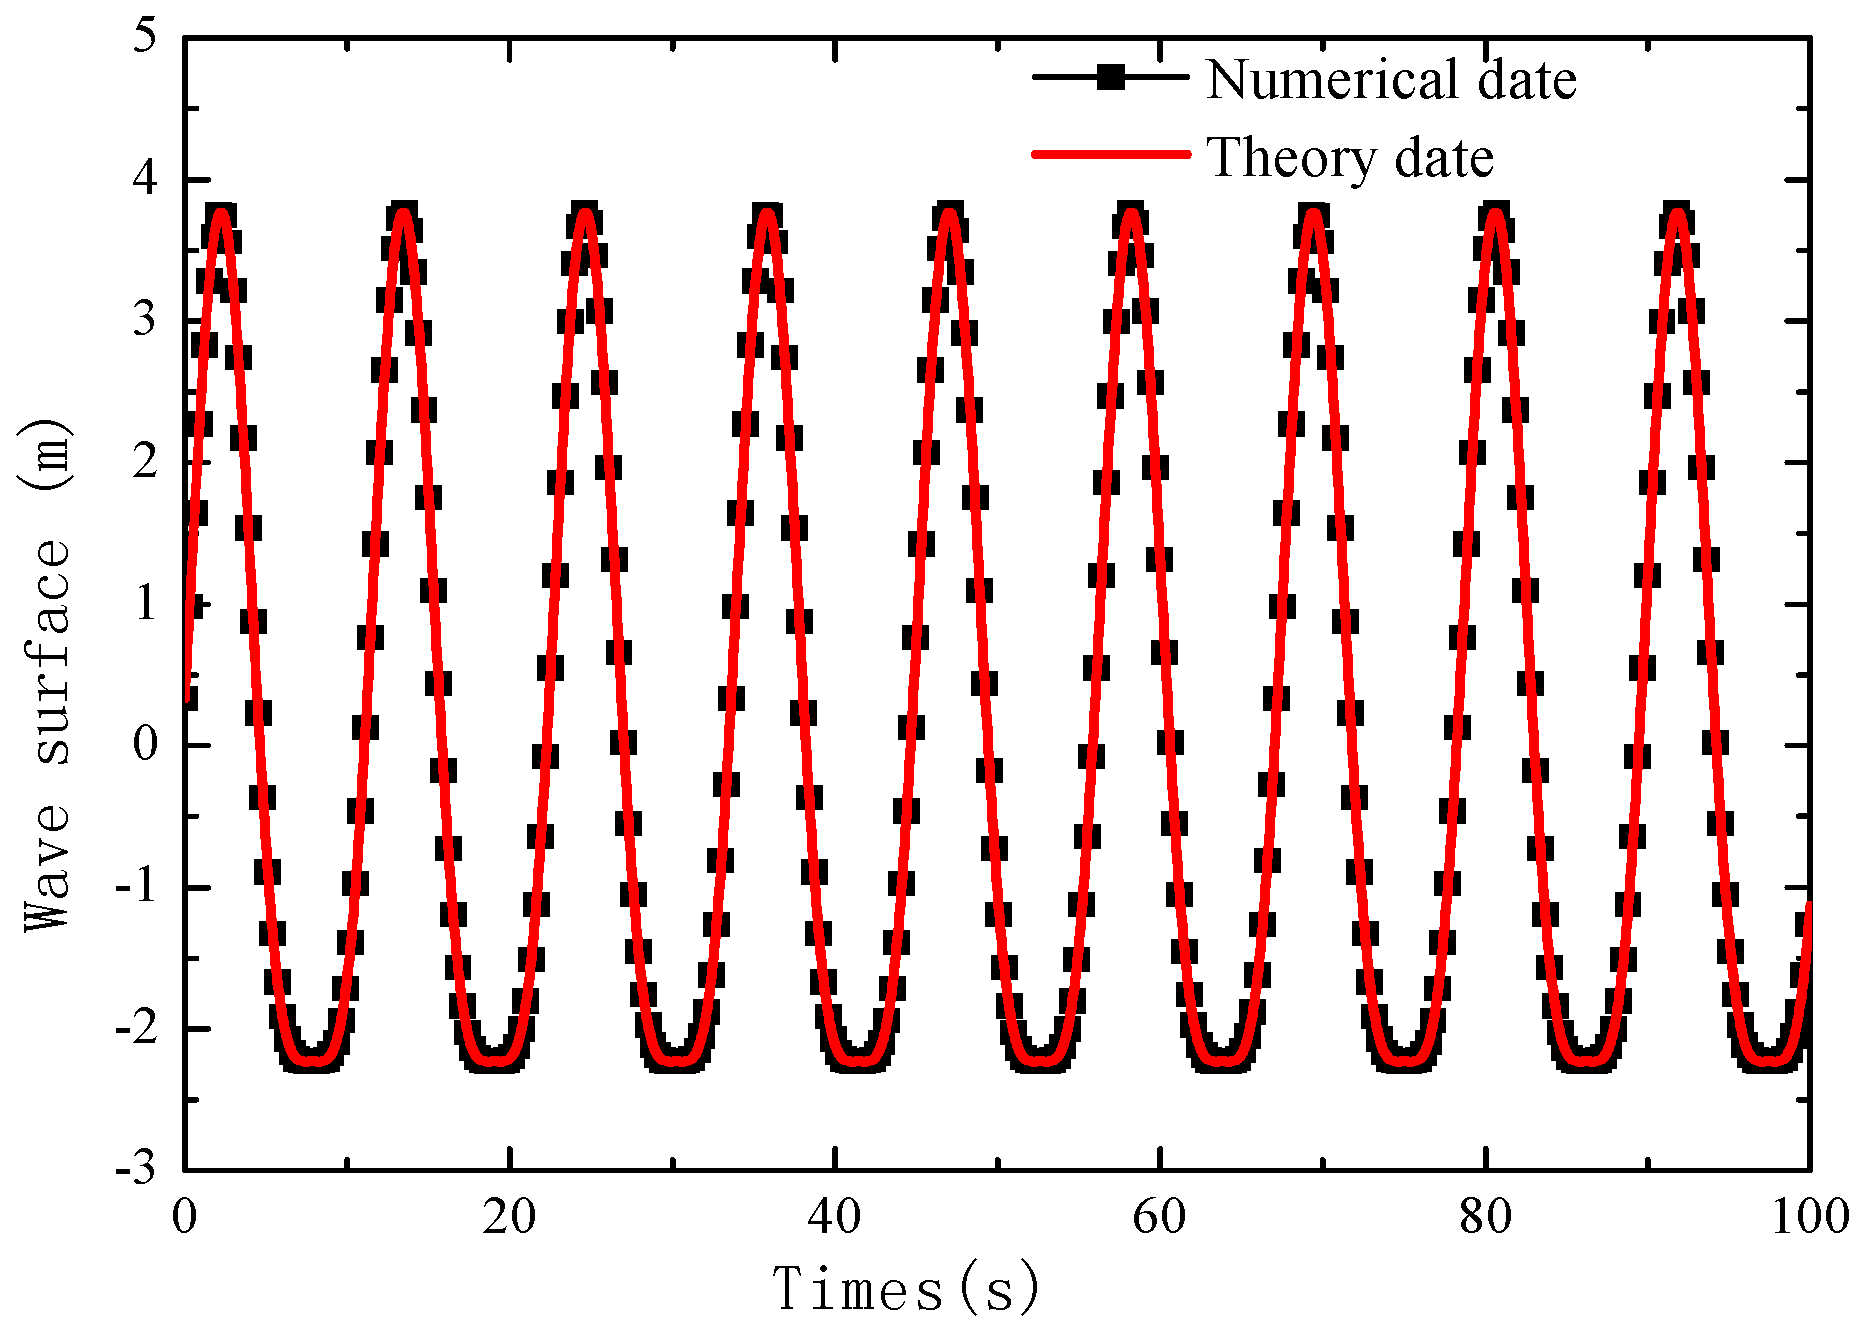
Figure 7 shows the comparison between the wave profile, the numerical date and the theoretical date (
d = 18.69 m,
T = 11.2 s,
H = 6 m, and
Cs = 1). The results showed that the numerical results in the present model agree with the theoretical data well.
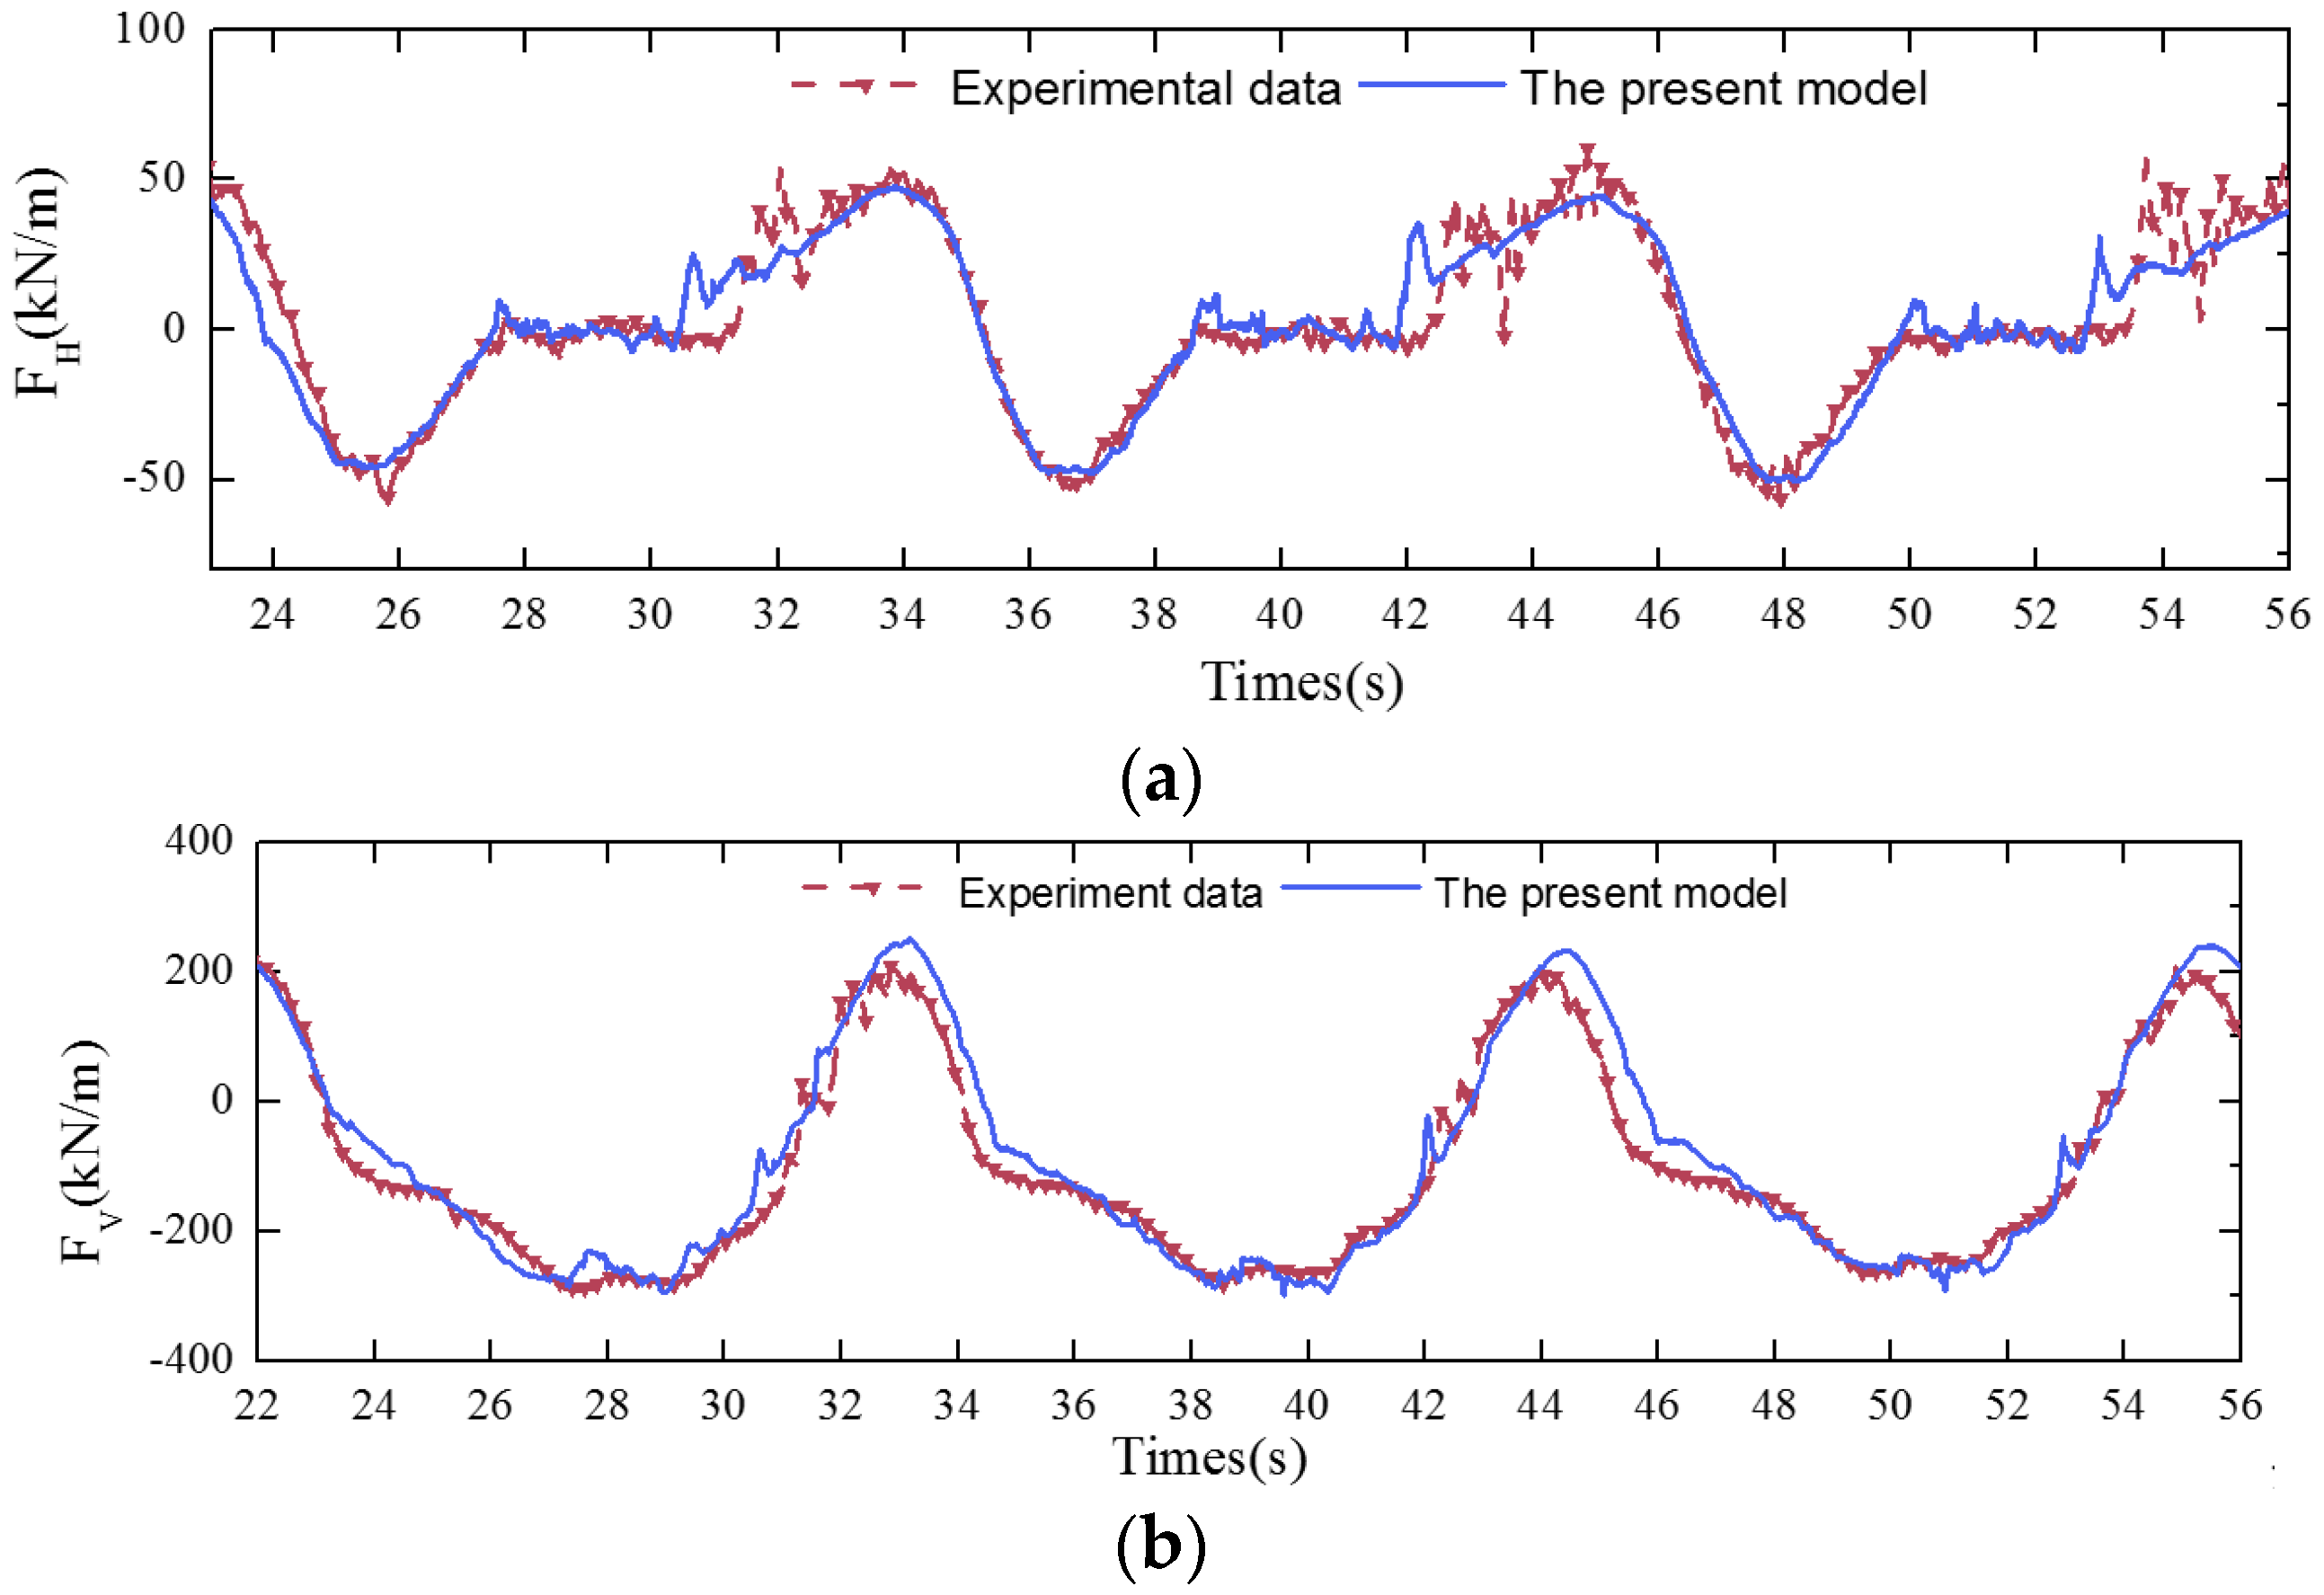
Figure 8 shows the comparisons between horizontal and vertical components of the wave force between the numerical results and the experimental data under the same conditions (
d = 18.69 m,
T = 11.2 s,
H = 6 m, and
Cs = 1). The results showed that the numerical results in the present model agree with the experimental data well. Therefore, the present model can provide sufficient accuracy to predict the wave forces on box girder coastal bridge.
4. Results and Discussion
In this section, to investigate the influences of wave parameters, the water depths and the submerged coefficients on wave forces on coastal bridge box girders, different wave heights, wave periods and water depths were selected based on observed data which referenced the observed values of an under-construction box girder coastal bridge in Taiwan strait.
The computation domain and dimensions of the box girder bridge are shown in
Figure 4. The horizontal length and vertical length of the computation domain is 700 m and 50 m, respectively. The coordinate of the middle bottom point of the girder is placed at
x = 300 m. The grid size with Δ
x = 0.02 m, Δ
z = 0.02 m is selected for the numerical simulations. Waves are generated to the left of the computation domain and propagated to the right in all the numerical models. The effects of the wave parameter, the water depths and the submerged coefficients on the wave force will be investigated in detail in this section in order to explore the relations of wave forces and wave conditions. Variations of wave pressure around the box girder during a wave period are shown in
Figure 6. Here,
Cs = 1,
H = 6 m,
T = 10 s, and
d = 30 m.
Figure 9a,d show the moment when wave crest hitting the middle of the bridge girder. At this time, due to existence of box girder, the front empty part under the deck and in front of the box girder, restricts the propagation of wave upward and forward.
Figure 9b, c show the moment when the wave crest away from box girder, and another wave crest is approaching. At this time, due to the geometry characteristics of box girder, water is climbing up the bridge and wave breakings is occurring at the web of box girder. Variations of wave pressure and wave profile around the box girder are quite different from the pressure contours and wave profile of T girder observed by Jun et al. [
31]. Hence, it is necessary to conduct a parametric study for the variations of wave forces on box girders under different wave parameters, water depths and submerged coefficients.
4.1. Effects of Wave Characteristic
4.1.1. Effects of Wave Height
It is expected that wave heights can affect the wave forces on the box girder. In this section, seven different wave heights (
H = 2, 3, 4, 5, 6, 7 and 8 m) are selected to examine the effects of wave heights under conditions of
T = 10 s,
d = 30 m and
Cs = 0, 1 and 2.
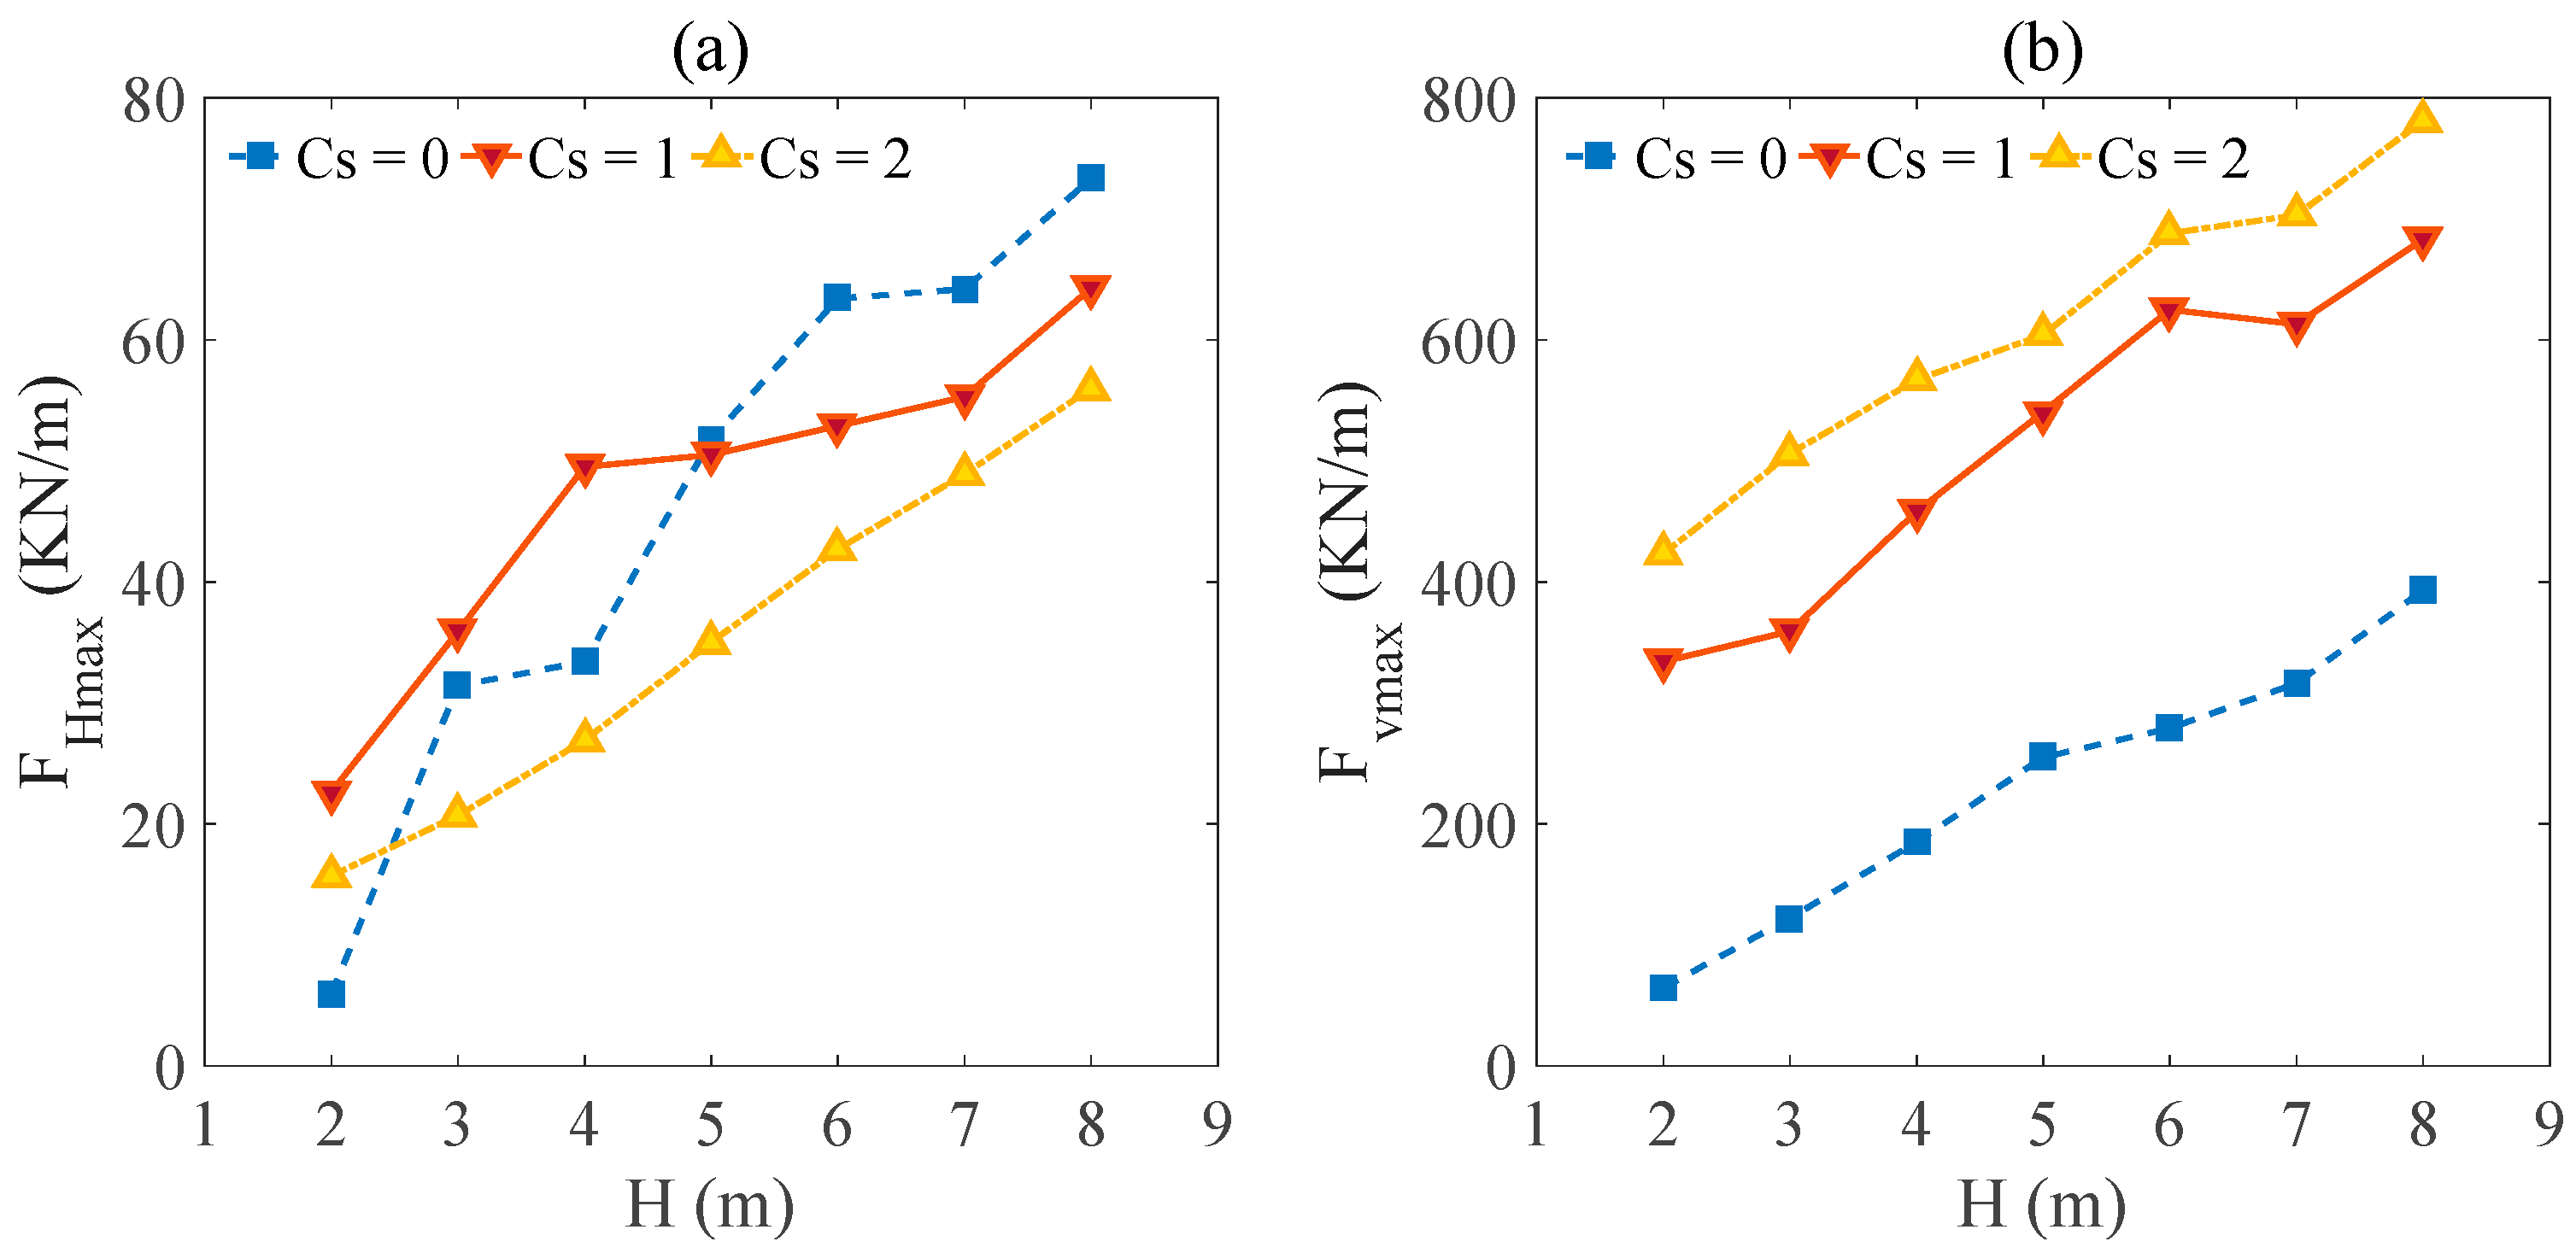
Figure 10a,b illustrate the maximum horizontal force (
FHmax) and maximum uplift force (
Fvmax) versus wave heights (
H) under various
Cs.
Figure 10 shows the computed results of maximum horizontal force (
FHmax) and maximum uplift force (
Fvmax) on the box girder increases with the increase of wave heights under different submerged coefficients (
Cs).
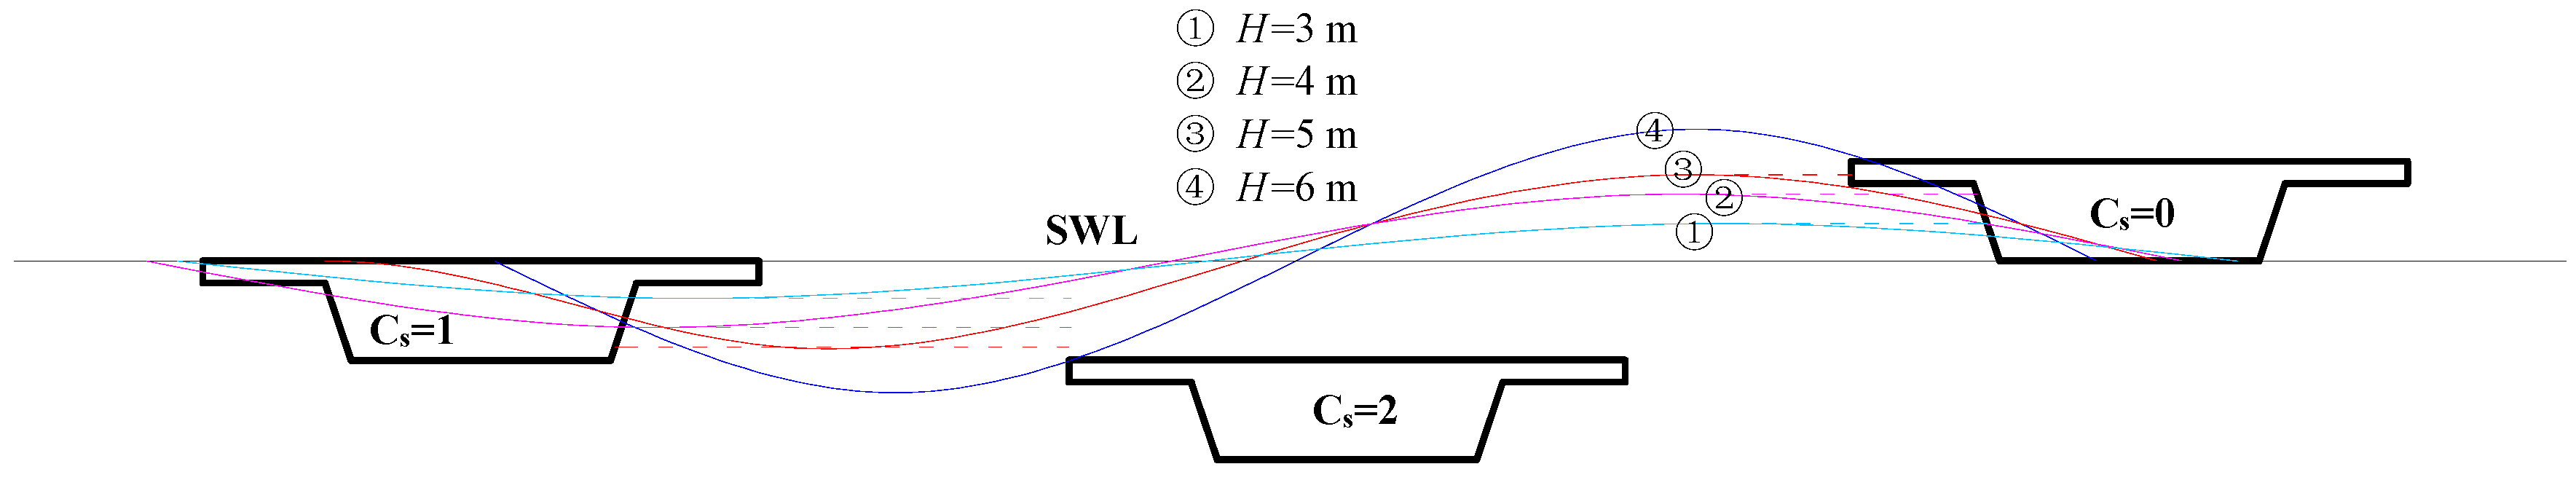
Figure 10 shows the sketch of a wave acting on a box girder under different wave heights for better understanding the variation of horizontal wave force when submerged coefficient
Cs = 0 and 1. A wave height smaller than 5 m (No. 1 and 2 in
Figure 10) makes the wave act entirely on the lateral of the web of the box girder when
Cs = 0. However, the wave acting on the lateral of the flange plate and the web of the box girder when
Cs = 1 and the wave height smaller than 5 m. The mutation in the shape of the joint part of the flange plate and the web of the box girder makes the wave action produce a significant impact on this joint part, and the wave breaking makes the horizontal wave force larger than the conditions of
Cs = 0 when the wave height is smaller than 5 m. The wave acting on the lateral of the flange plate and the web of the box girder produced a similar horizontal wave force when the wave height is around 5 m (No. 3 in
Figure 11) and
Cs = 0 and 1. When the wave height is bigger than 5 m (No. 4 in
Figure 11), due to the box girder being under the still water level when
Cs = 1, the wave height bigger than the height of the box girder has a little contribution to the increment of horizontal wave force. However, the wave height bigger than the height of the box girder has a significant impact on the box girder when
Cs = 0. Hence, the horizontal wave force of
Cs = 1 is smaller than the horizontal wave force of
Cs = 0.
4.1.2. Effects of Wave Period
In this section, six kinds of wave periods (
T = 6, 8, 10, 12, 14 and 16 s) are selected to examine the effects of wave periods under condition of
H = 6 m,
d = 30 m and
Cs = 0, 1, 2.
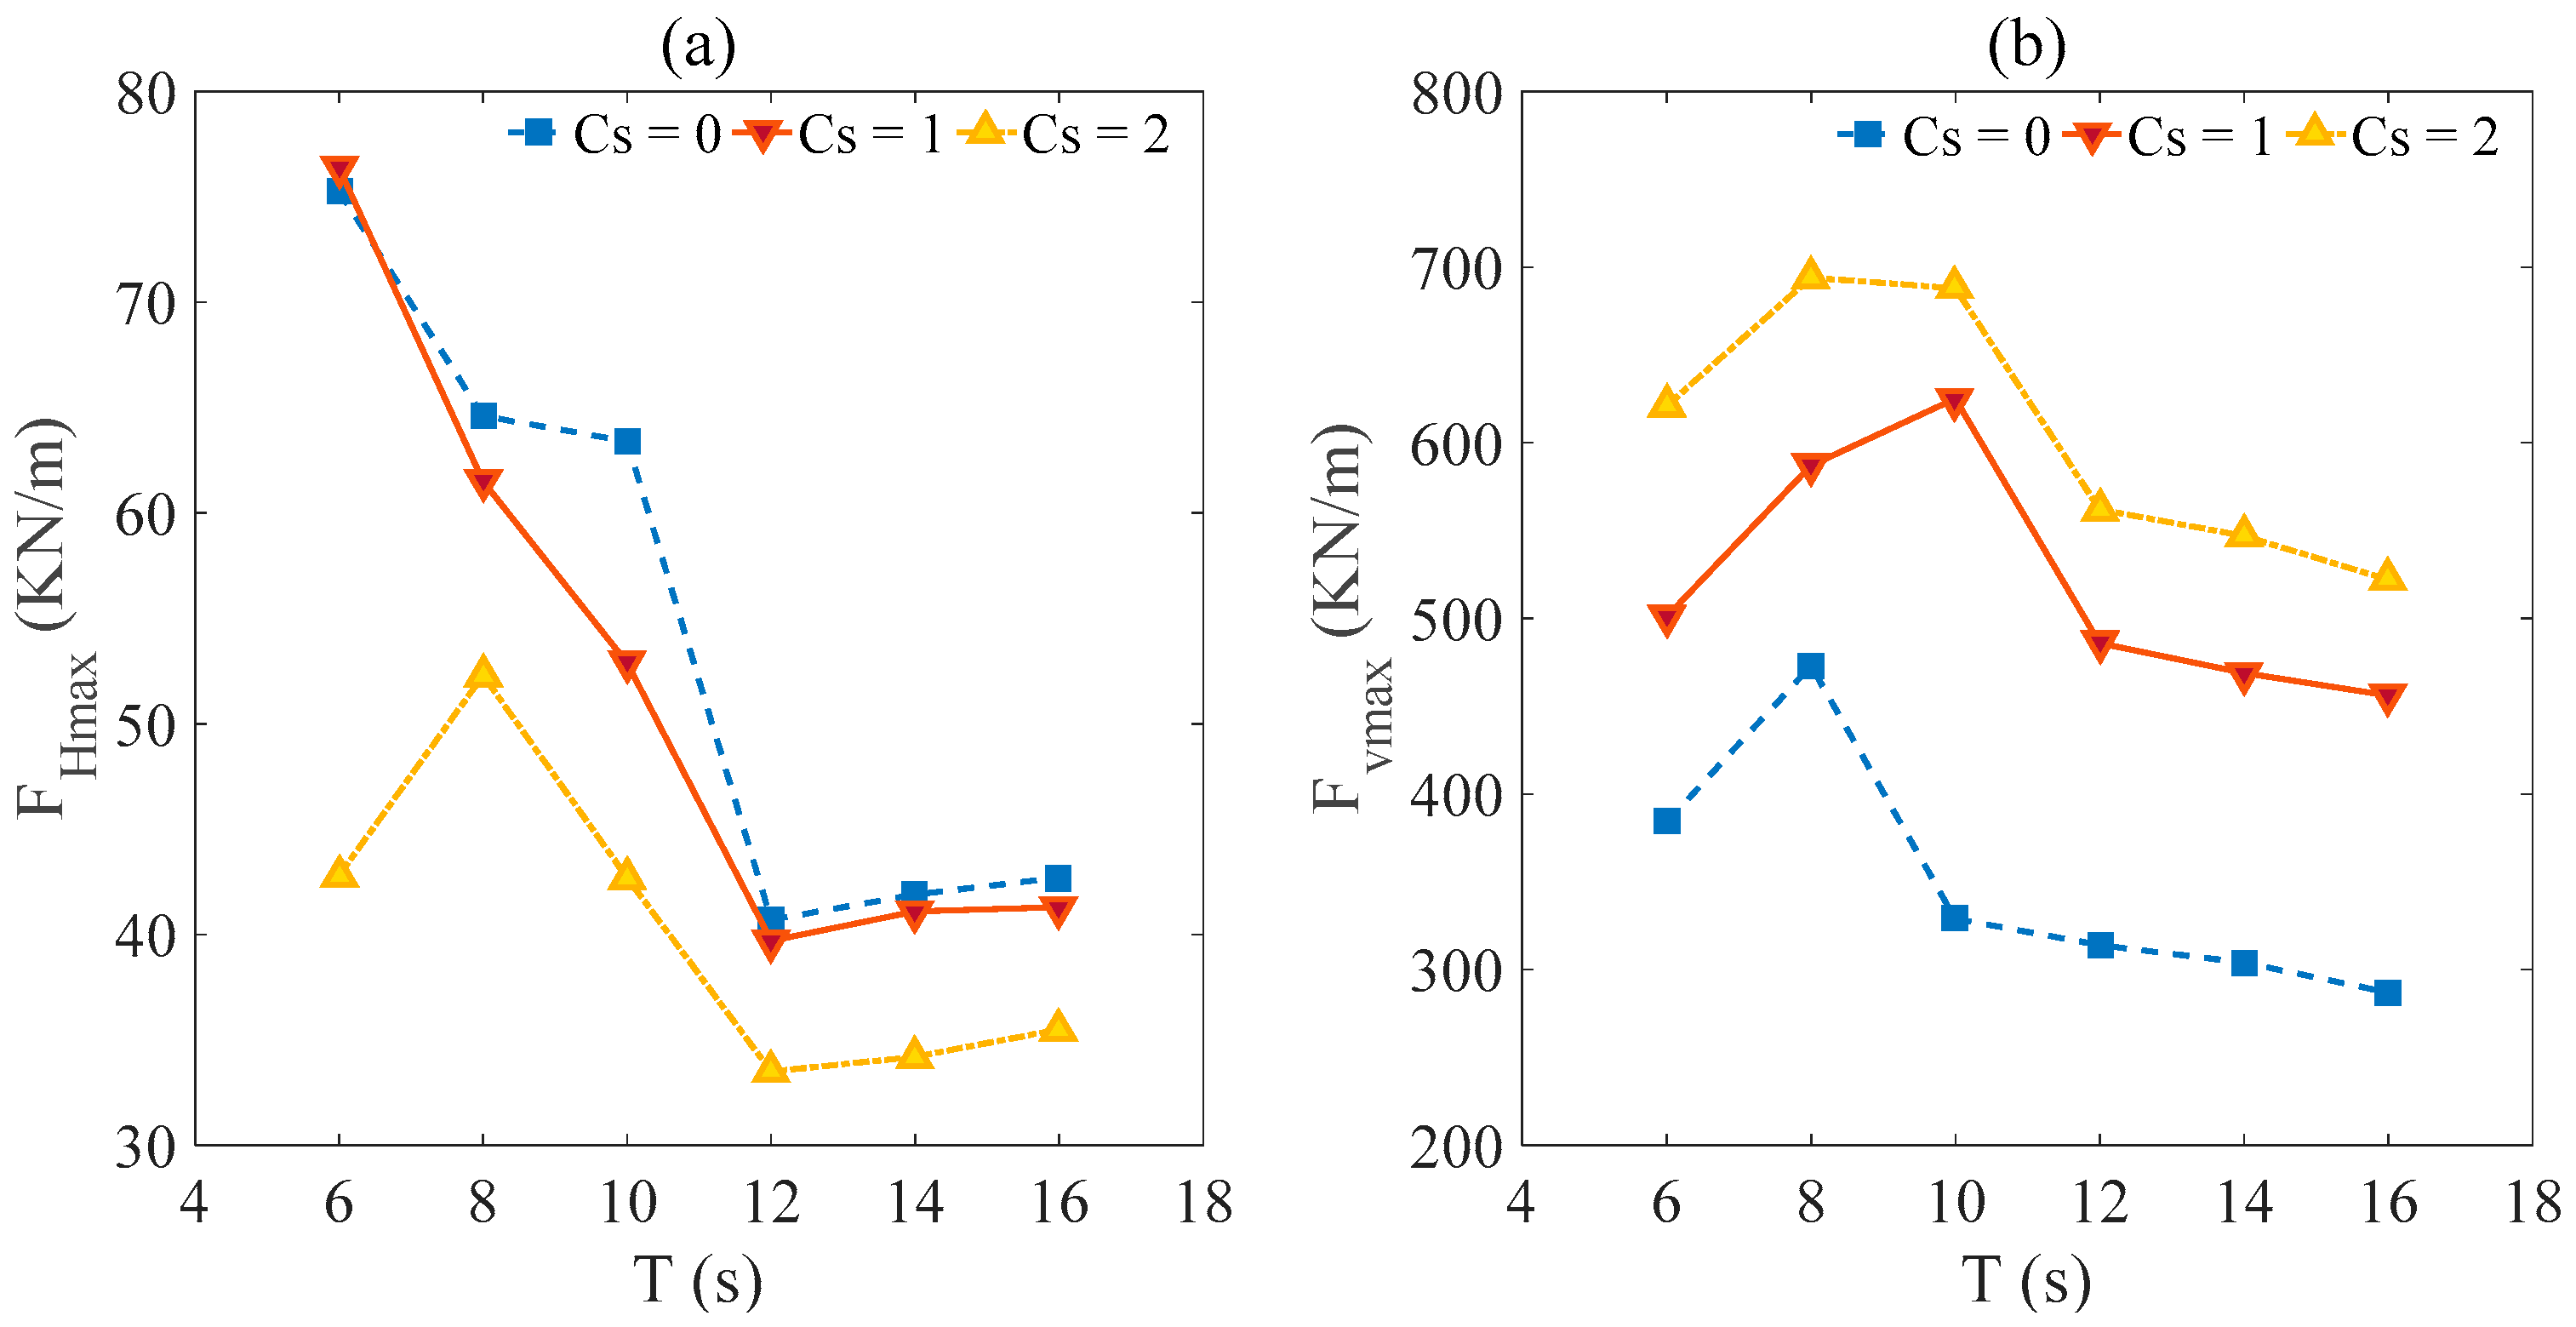
Figure 12a, b illustrate the maximum horizontal force (
FHmax) and maximum uplift force (
Fvmax) of three types
Cs versus various wave periods (
T). It is observed that the maximum horizontal force gradually decreases between the wave periods 6 ≤
T ≤ 12 and thereafter, force gradually tends to stablize between wave periods 12 ≤
T ≤ 16. When submerged coefficient
Cs = 0 and 1, the increasing wave periods lead to the increment of the wave length (
L) and decrement of wave velocity, hence, the maximum horizontal force decreases under the wave period between 6 ≤
T ≤ 12. Thereafter, with the increasing wave periods, the increasing wave energy and decreasing wave velocity keep the maximum horizontal force changes in stably small increases. The effect of wave periods on wave forces is much smaller than the situation of wave period
T ≤ 12 s. When the submerged coefficient
Cs = 2, the influence of the wave on the maximum horizontal force is small due to the submerged depth of the box girder. When
T = 6 s, the low value of wave steepness (
H/
L) may bring a wave breaking that leads to the energy dissipation, the maximum horizontal wave force of
T = 6 s is smaller than the horizontal wave force of
T = 8 s.
Figure 12b shows that the maximum uplift force first increases and then decreases and tends to stably decrease at last. The low value of wave steepness (
H/
L) may bring a wave breaking that leads to the energy dissipation when the wave period is small. With the increment of wave periods, the wave steepness increase reduces the wave breakings and makes the maximum uplift force increase. Thereafter, the increasing wave energy and decreasing wave velocity make the maximum uplift force tend to stably decrease with the increment of wave period at last.
4.2. Effects of Water Depth
In this section, five water depths (
d = 10, 15, 20, 25 and 30 m) are selected to examine the effects of wave depths under conditions of
H = 6 m,
T = 10 s and
Cs = 0, 1, 2.
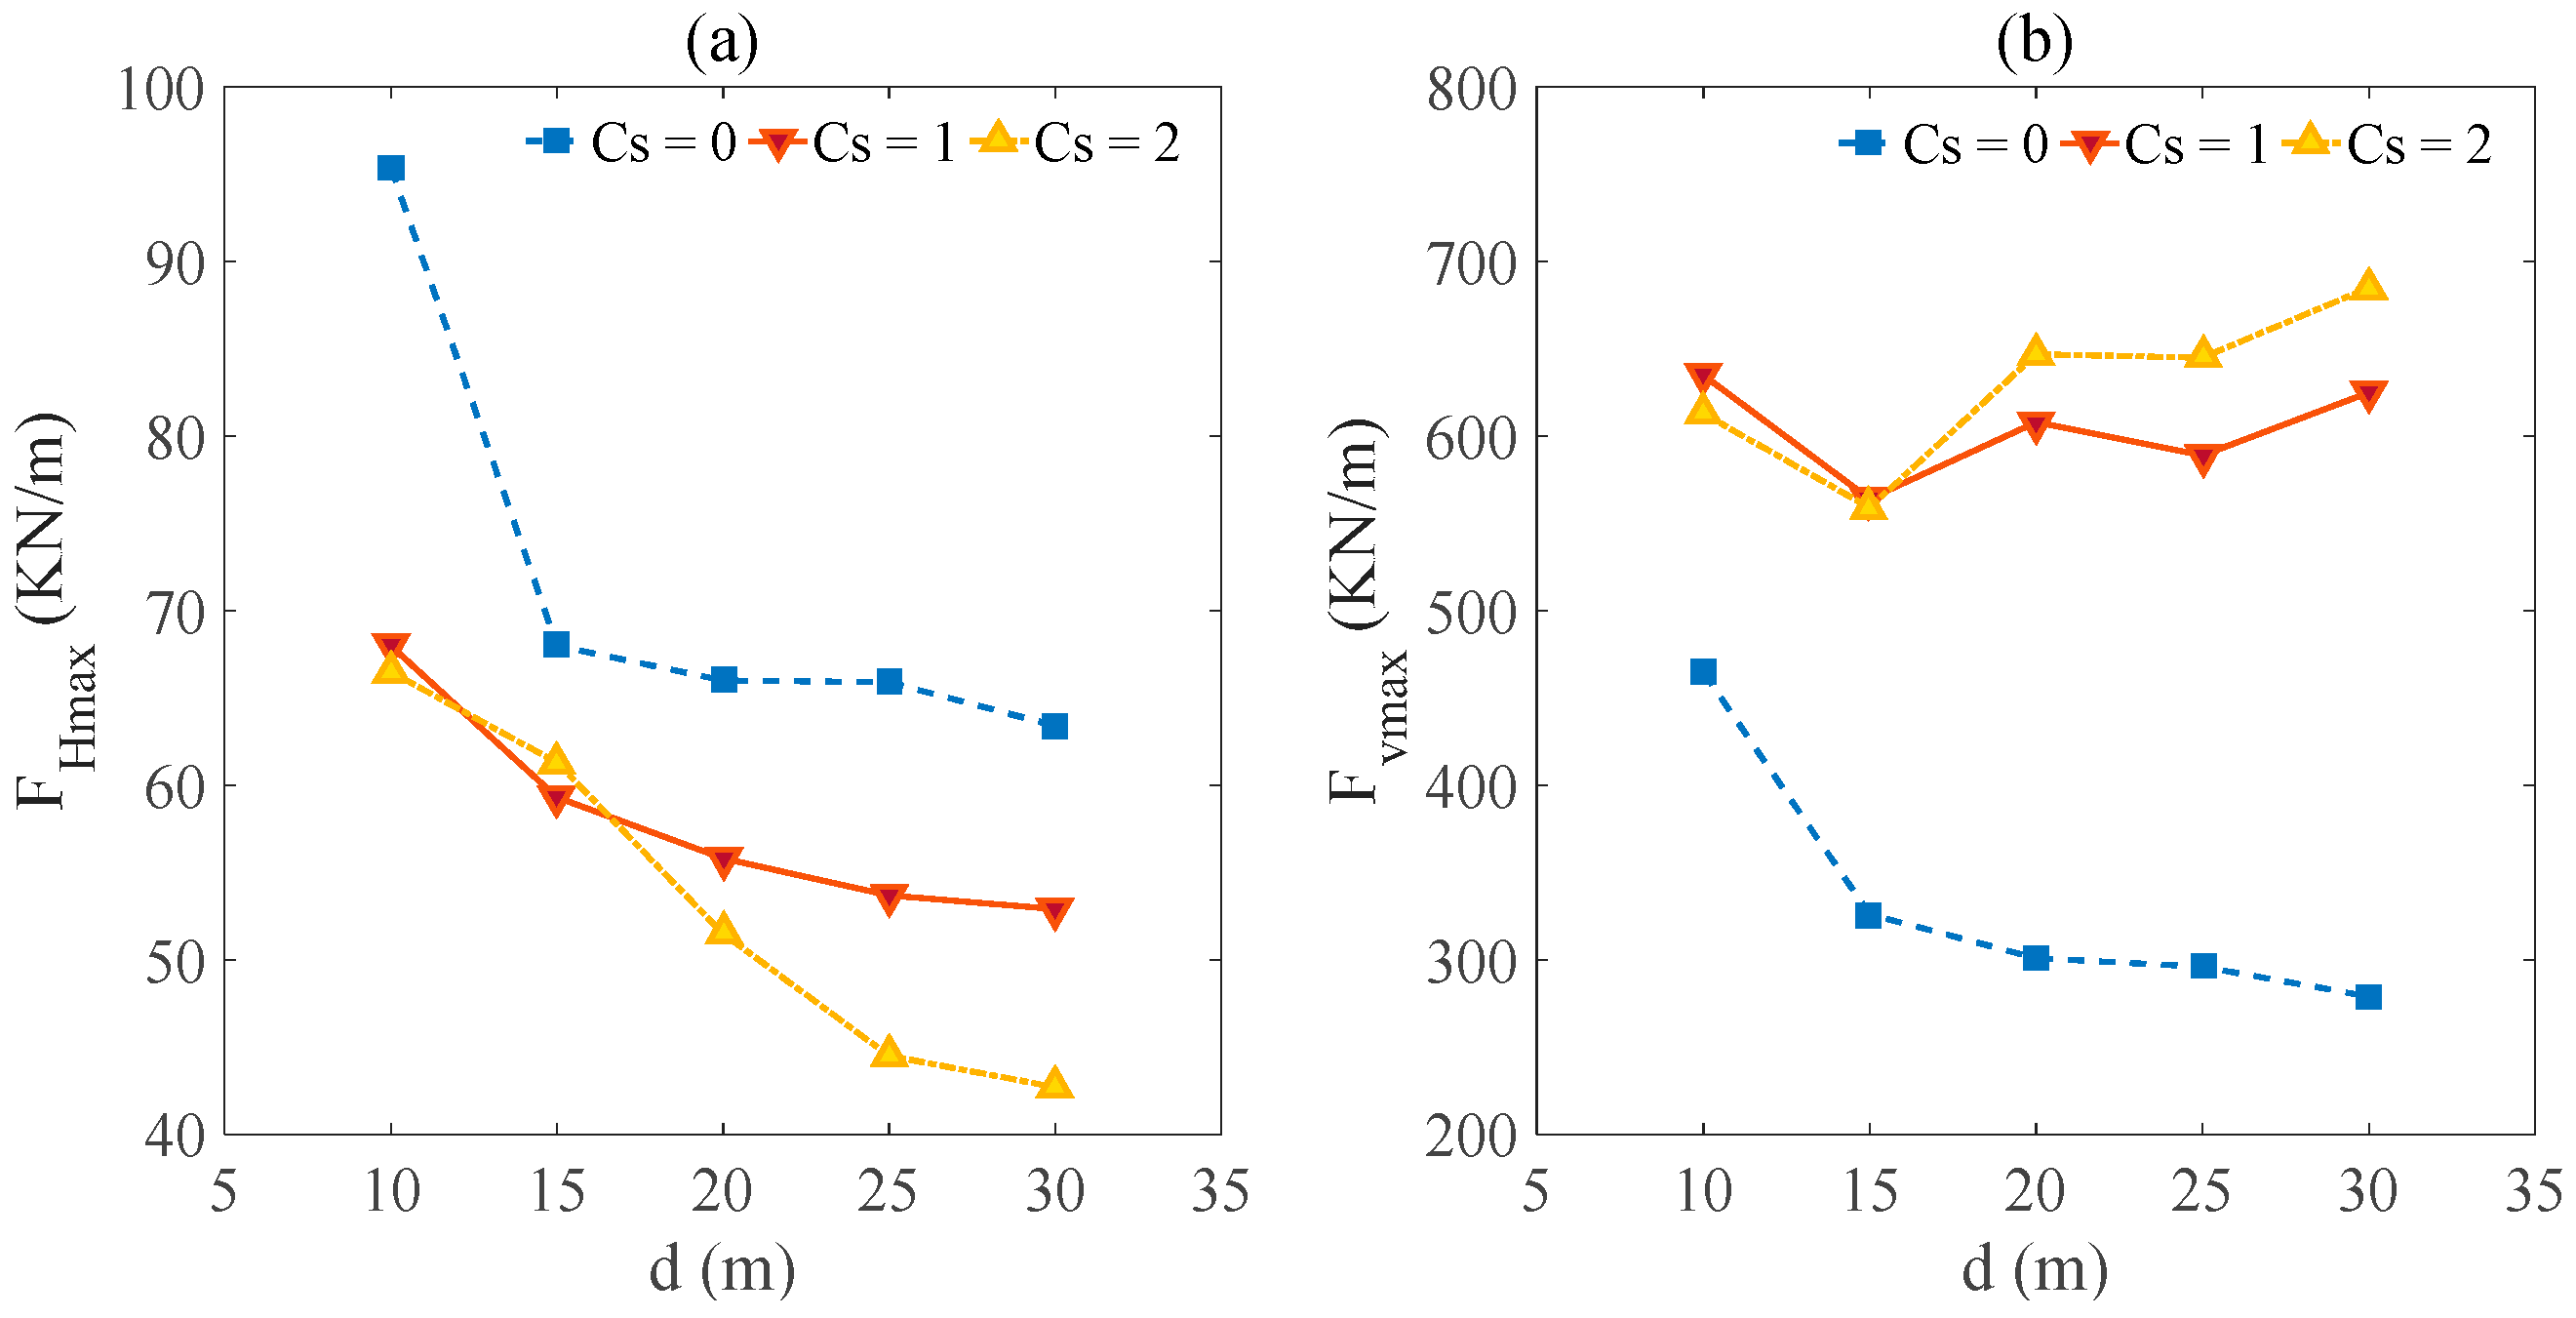
Figure 13a shows that the computed results of maximum horizontal force (
FHmax) on the box girder decrease with the increment of wave depths under different submerged coefficients (
Cs). When submerged coefficient
Cs = 0, a high wave height (
H = 6 m) and low water depth (
d =10 m) may lead to the wave shortly impacting when the wave reaches its maximum crest height, which brings a higher uplift force compared to the uplift force under higher water depths (
d = 15, 20, 25 and 30 m). The increment of water depth has a negative effect on maximum horizontal force (
FHmax). As
Figure 13b shows, with the increment of wave depths when
Cs = 0, the increment of the value
d/
L may reduce the effects of wave fluctuation and make the uplift force decrease. The box girder is almost flooded underwater under the situation of submerged coefficient
Cs = 1 and 2. Hence, the effects of water depth on maximum vertical force are much smaller than the situation of submerged coefficient
Cs = 0.
5. Applications for Engineering Practice
From the parametric study above, it is discovered that both the wave parameters and submerged coefficients have a significant influence on the wave loadings on the box girder under extreme wave conditions. To protect the box girder from being damaged under extreme wave conditions, the quantitative values of maximum wave loads under various wave conditions and submerged coefficients are required for engineering design.
Based on the preliminary study, the maximum wave loads are a function of wave parameters (
T,
H). Among these parameters,
H/(
gT2) is used to determine the
FHmax and
Fvmax. Based on the numerical examples, the relationship of the maximum wave forces divides the gravitational force (
G) of the box girder and
H/(
gT2) for various submerged coefficients (
Cs) under the water depth
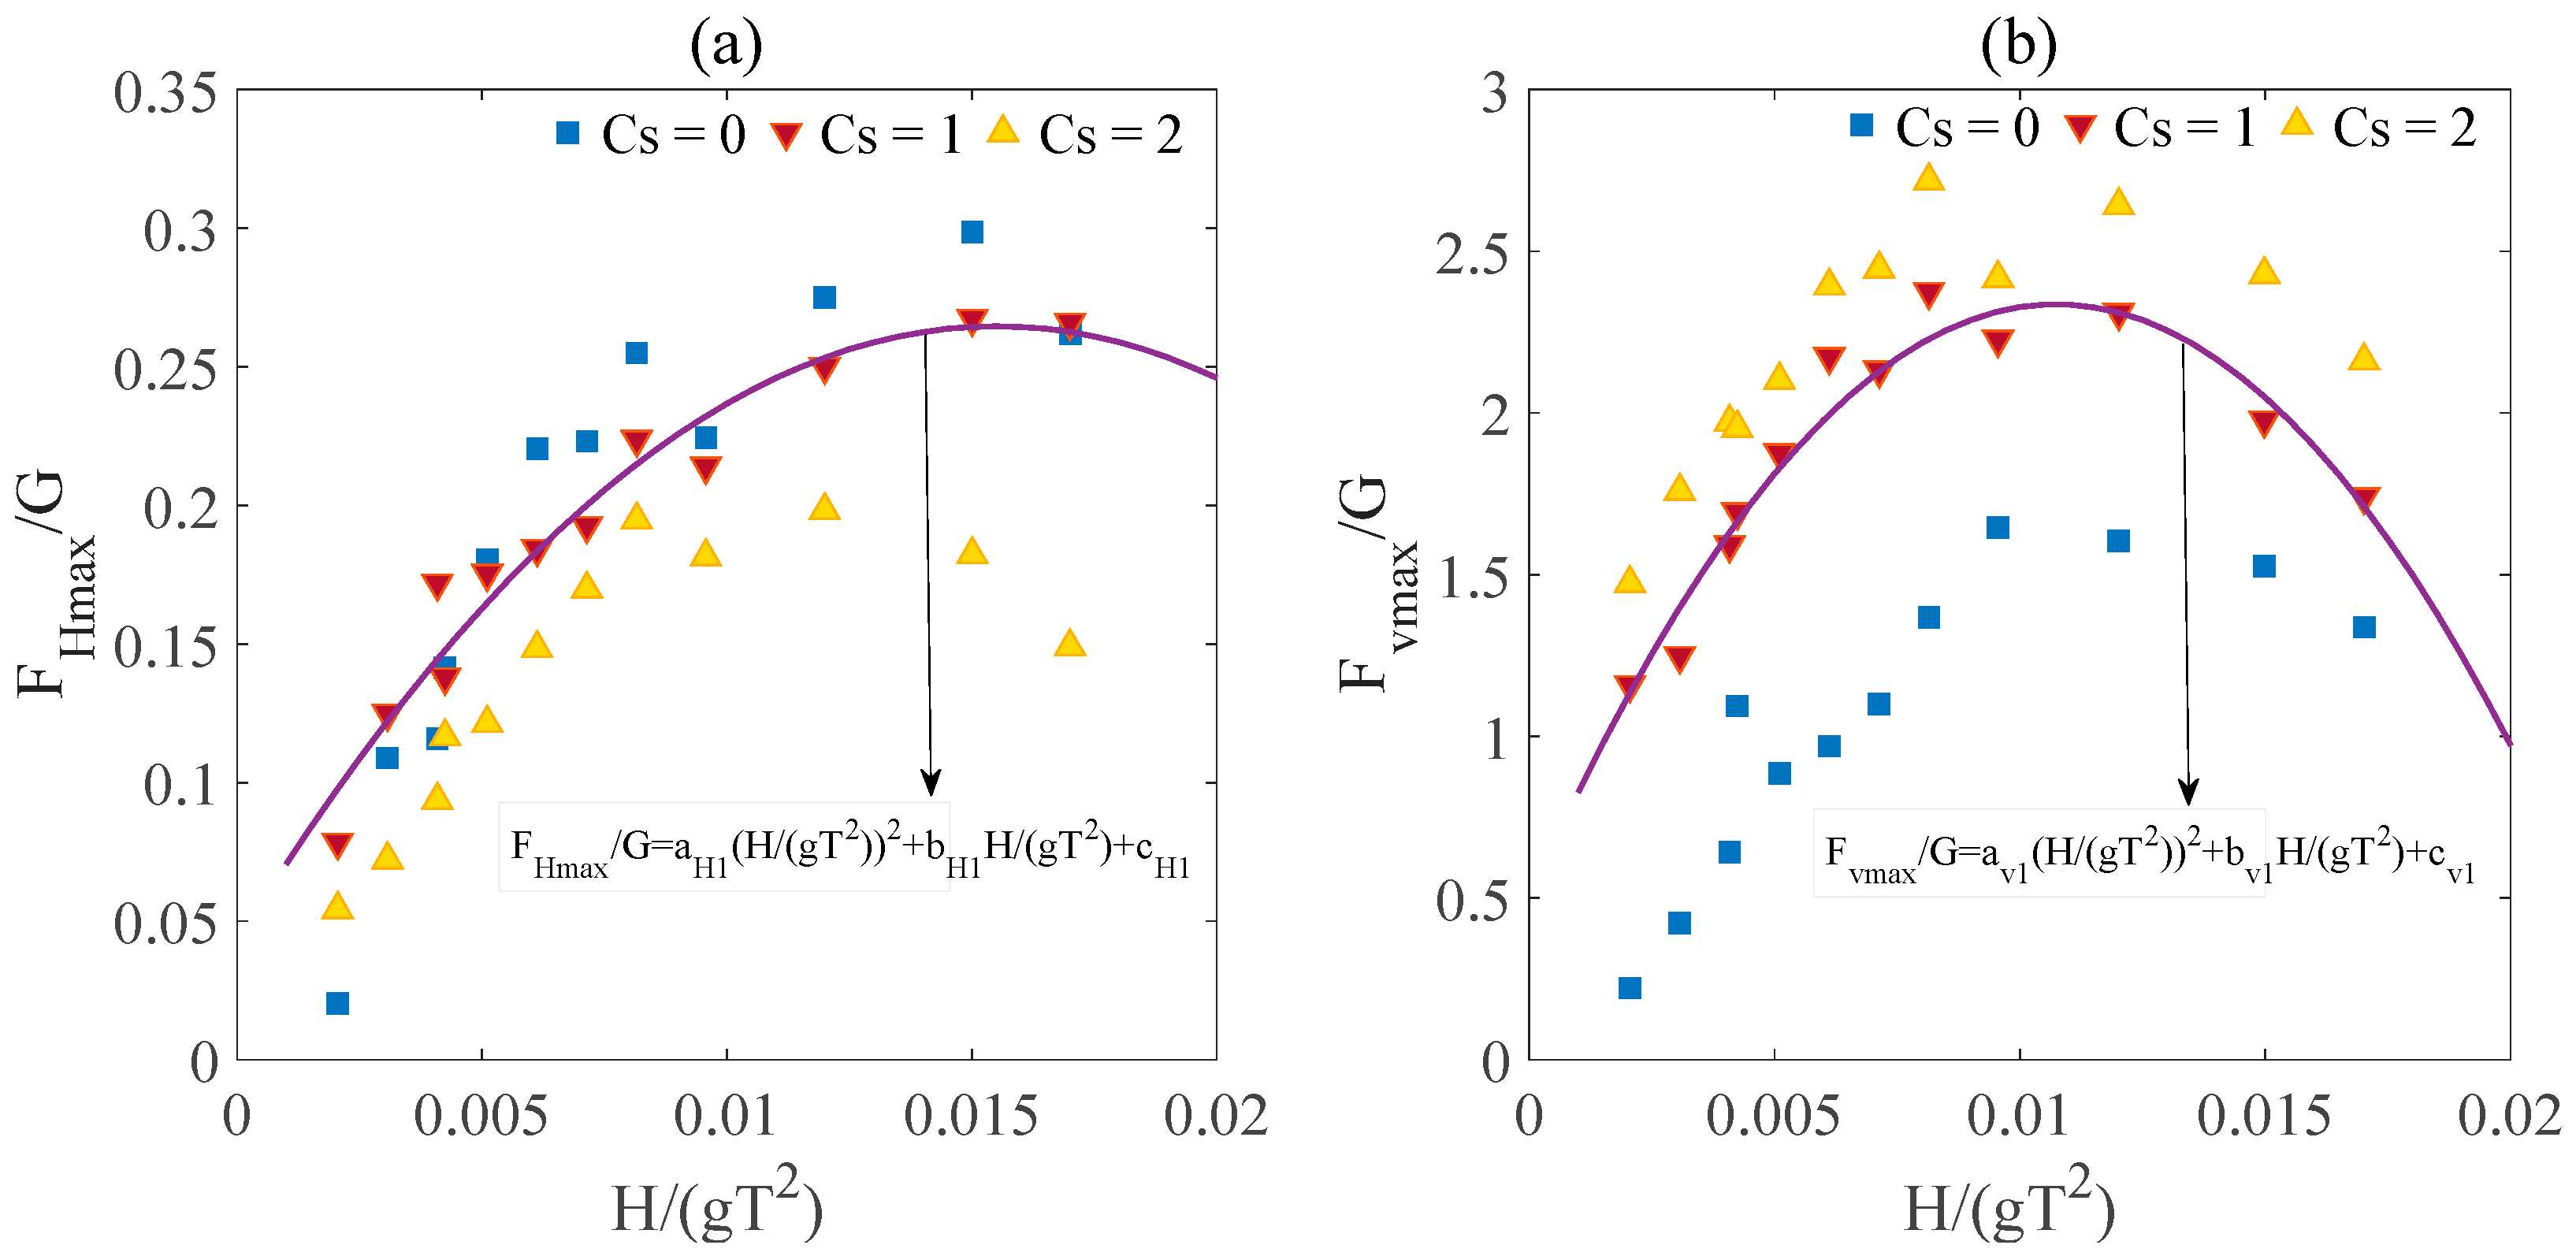
d =30 m is illustrated in
Figure 14. The relations can be expressed as follows:
where the value of
i depends on submerged coefficients (
Cs),
i = 1, 2, 3, and the gravitational force of the box girder
G = 287.5 kN/m,
a,
b,
c are empirical coefficients which can be obtained in
Figure 14. Here,
T ≤ 12 s.
The coefficients (a, b, c) can be worked out based on the curve-fitted under a water depth d = 30 m. Each of the R2 statistics of the curve is satisfied with greater than 0.9 to ensure the accuracy of the results of the curve-fit.
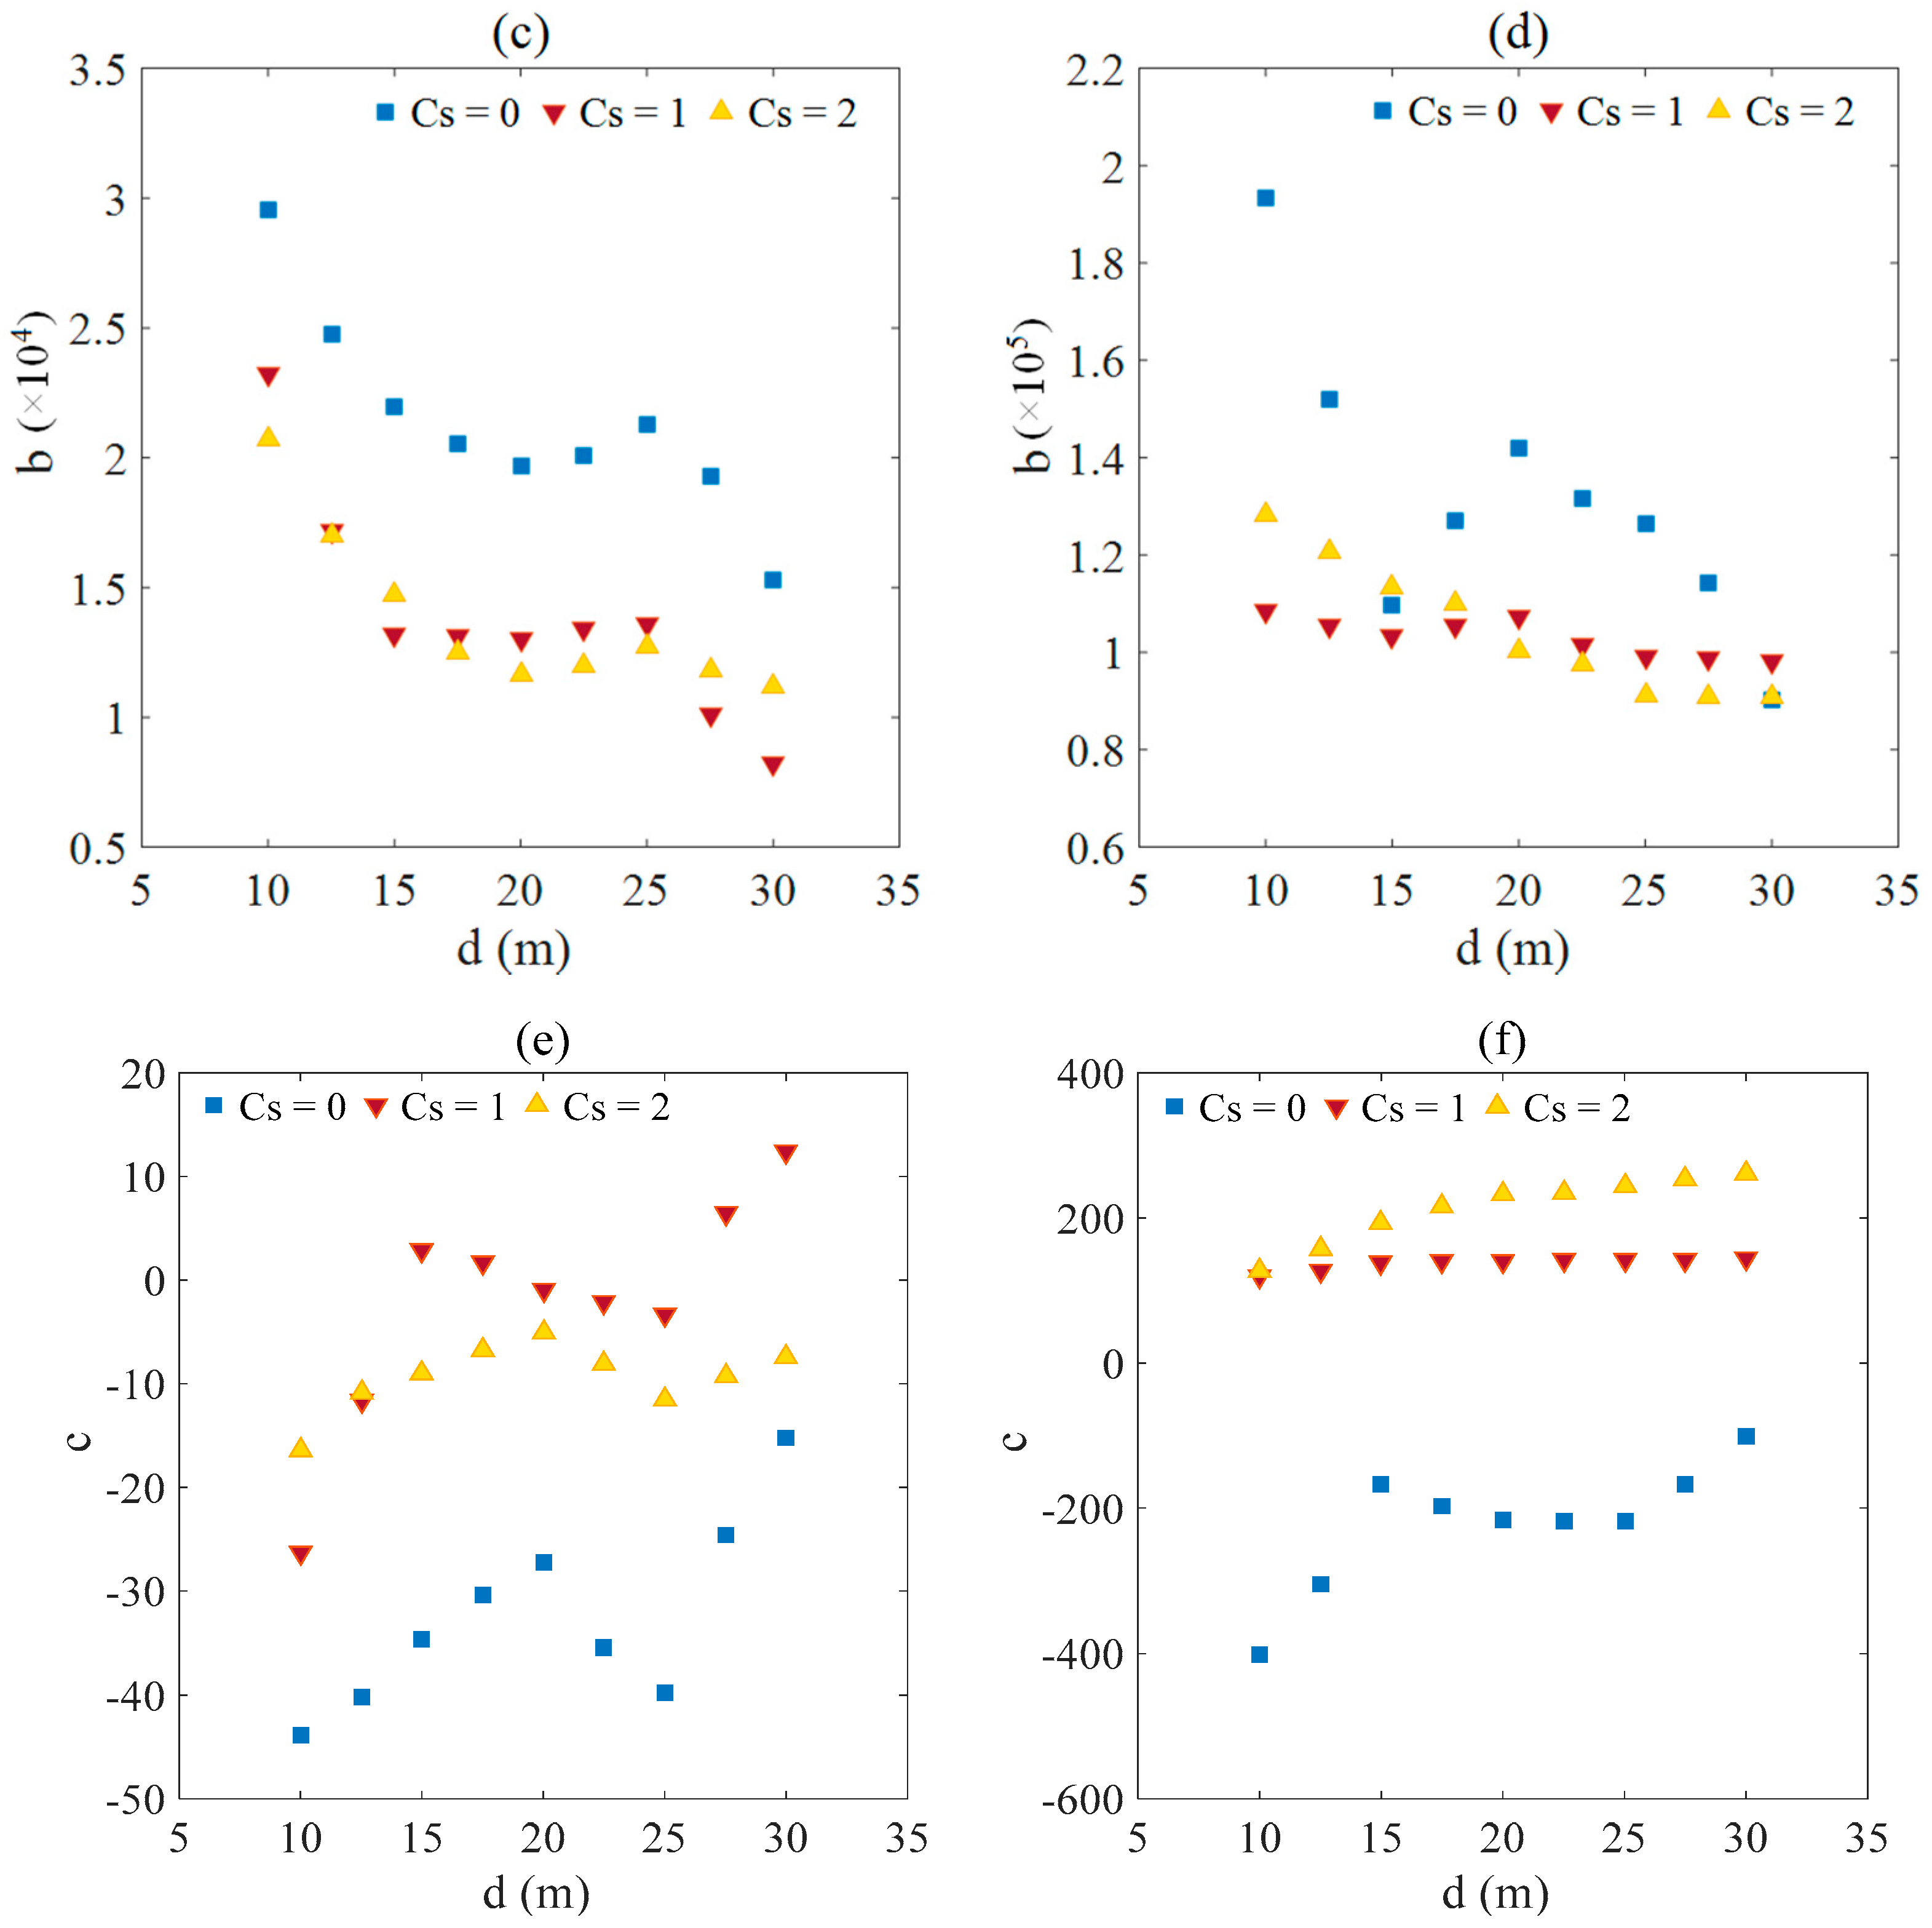
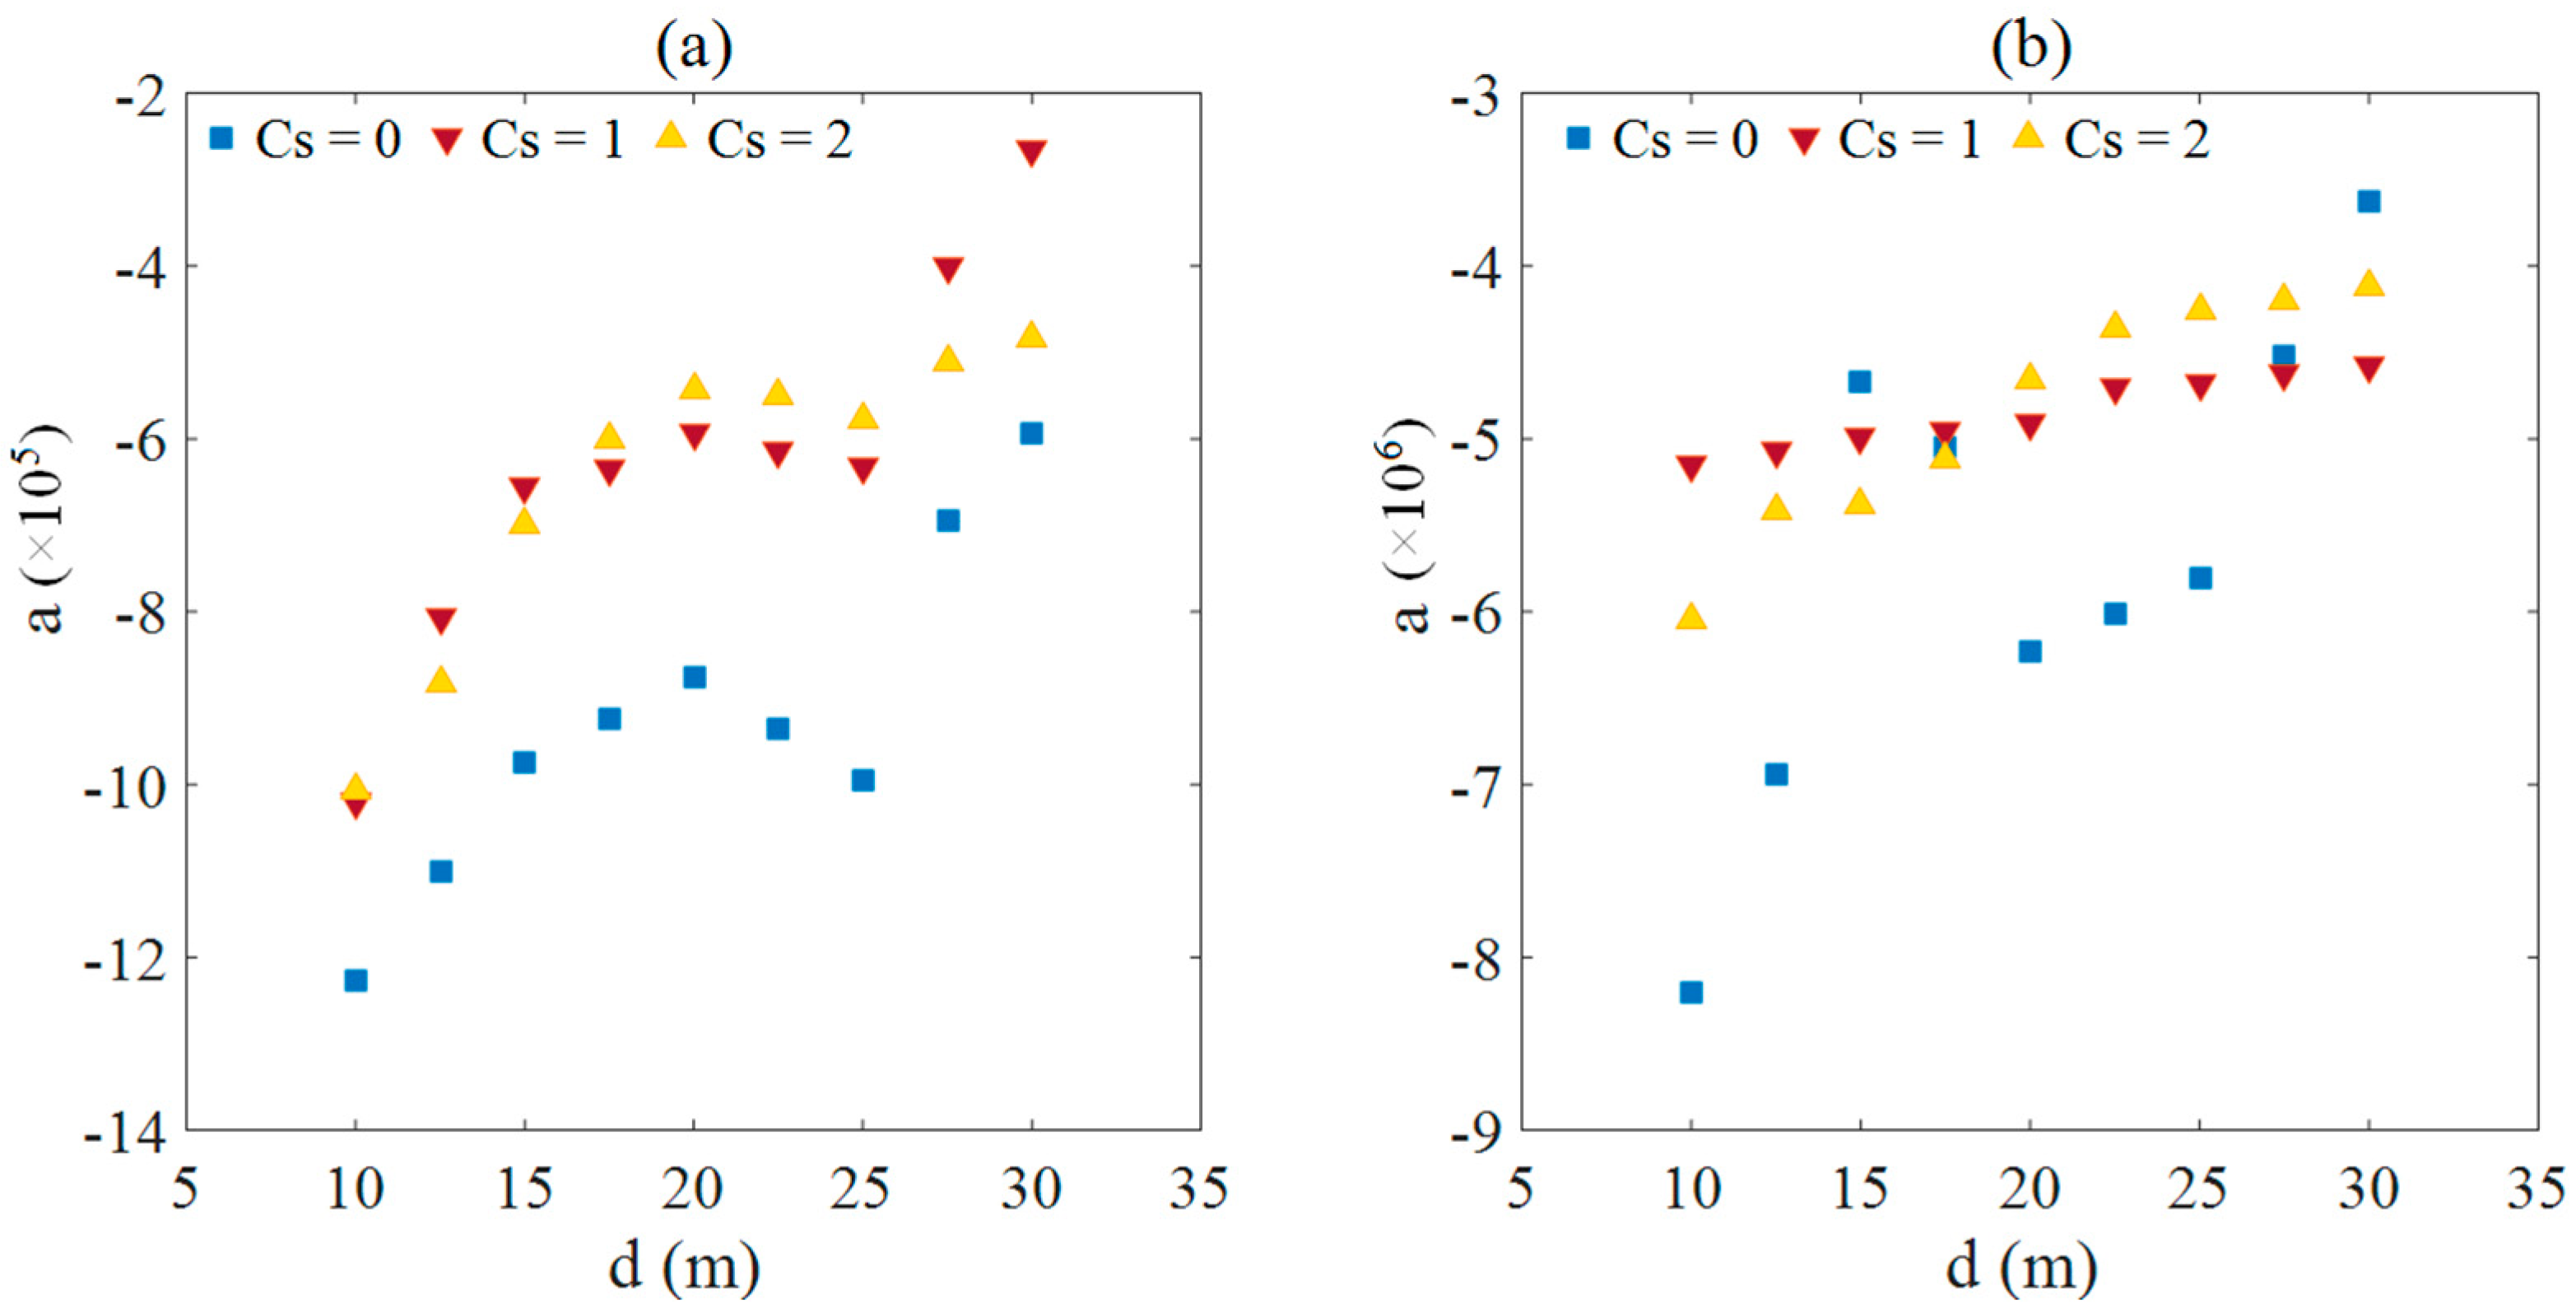
The coefficients (
a,
b,
c) can be further curve-fitted with the water depths (
d) for various submerged coefficients (
Cs). More wave conditions (
H,
T) have been done to investigate the effects of water depth on coefficients (
a,
b,
c), as shown in
Figure 15. Wave parameters, water depth and submerged coefficients are three main factors for determining the wave force on the coastal box girder bridge.
Herein, the authors outline the procedure for how to use Equations (7) and (8) and
Figure 15 to predict the wave force in the design of safety precautions for box girder bridges against extreme wave conditions.
- (1)
Based on the given wave characteristics, we can determine the value of H/(gT2).
- (2)
With the given water depth and by calculating the submerged coefficient from the submerged depth of the bridge, we can determine three coefficients, (
a,
b,
c) from
Figure 14.
- (3)
The
FHma and
Fvmax can be calculated from Equations (7) and (8) with the coefficients, (
a,
b,
c) obtained from
Figure 15.
It is noted that the above procedure is based on the numerical examples presented in this paper and the numerical model is only limited to 2D, which may be extended to a 3D model. These formulations apply to wave period
T ≤ 12 s, water depth 10 ≤
d ≤ 30 m and wave height 2 ≤
H ≤ 8 m. If wave period
T exceeds 12 s, the value of the wave force under these wave conditions can reference the wave force of wave period
T = 12 s. In
Figure 12, with the increment of wave periods between 12 ≤
T≤ 16 s, the effects of the wave period on wave forces are much smaller than when the wave period
T ≤ 12 s. Understanding the effects of other parameters requires further intensive investigations in the future.
Maximum horizontal and vertical wave forces obtained from the experiment and calculated by the proposed procedure under the same conditions, water depth and submerged coefficients were presented in
Table 1 and
Table 2. By comparing with the maximum wave forces obtained from the experiment, the value of the maximum horizontal force derived from the proposed method is slightly lower with an error of approximately 8%. The value of the maximum vertical force derived from the proposed procedure agrees with the experimental data well. Therefore, the proposed procedure can provide some reference by which to estimate of the wave forces on box girder.


