
Metal Bioaccumulation by Estuarine Food Webs in New England, USA

Abstract
:
1. Introduction
2. Materials and Methods
2.1. Field Sites
2.2. Sediment Samples
2.3. SEM-AVS and TOC Analysis of Sediments
2.4. Biota samples
2.5. Metal Analysis of Biota and Sediment Samples
2.6. Stable Isotope Analysis
2.7. Data Analysis
3. Results
3.1. Sediment and Biotic Metals
3.2. Biotic Metal Concentration Predictors
4. Discussion
4.1. Metal Bioavailability
4.2. Ecological Factors and Metal Bioaccumulation
5. Conclusions
Supplementary Materials
Acknowledgments
Author Contributions
Conflicts of Interest
Abbreviations
| SEM-AVS | Simultaneously Extracted Metal-Acid Volatile Sulfides |
| BSAF | Benthic-Sediment Accumulation Factor |
| TOC | Total Organic Carbon |
References
- Agency for Toxic Substances and Disease Registry. Comprehensive Environmental Response, Compensation, and Liability Act Priority List Of Hazardous Substances. Available online: http://www.atsdr.cdc.gov/spl/ (accessed on 27 May 2016).
- Monperrus, M.; Point, D.; Grall, J.; Chauvaud, L.; Amouroux, D.; Bareille, G.; Donard, O. Determination of metal and organometal trophic bioaccumulation in the benthic macrofauna of the Adour estuary coastal zone (SW France, Bay of Biscay). J. Environ. Monit. 2005, 7, 693–700. [Google Scholar] [CrossRef] [PubMed]
- McKinley, A.C.; Dafforn, K.A.; Taylor, M.D.; Johnston, E.L. High levels of sediment contamination have little influence on estuarine beach fish communities. PLoS ONE 2011, 6, e26353. [Google Scholar] [CrossRef] [PubMed]
- Langston, W.J.; O’Hara, S.; Pope, N.D.; Davey, M.; Shortridge, E.; Imamura, M.; Harino, H.; Kim, A.; Vane, C.H. Bioaccumulation surveillance in milford haven waterway. Environ. Monit. Assess. 2012, 184, 289–311. [Google Scholar] [CrossRef] [PubMed] [Green Version]
- Rainbow, P.S.; Kriefman, S.; Smith, B.D.; Luoma, S.N. Have the bioavailabilities of trace metals to a suite of biomonitors changed over three decades in sw england estuaries historically affected by mining? Sci. Total Environ. 2011, 409, 1589–1602. [Google Scholar] [CrossRef] [PubMed]
- National Research Council. Bioavailability of Contaminants in Soils and Sediments: Processes, Tools, and Applications; National Academies Press: Washington, DC, USA, 2003. [Google Scholar]
- Luoma, S.N.; Rainbow, P.S. Metal Contamination in Aquatic Environments: Science and Lateral Management; Cambridge University Press: Cambridge, UK, 2008. [Google Scholar]
- Mathews, T.; Fisher, N.S. Evaluating the trophic transfer of cadmium, polonium, and methylmercury in an estuarine food chain. Environ. Toxicol. Chem. 2008, 27, 1093–1101. [Google Scholar] [CrossRef] [PubMed]
- Langston, W.J. The distribution of mercury in british estuarine sediments and its availability to deposit-feeding bivalves. J. Mar. Biol. Assoc. UK 1982, 62, 667–684. [Google Scholar] [CrossRef]
- Chapman, P.M.; Wang, F.Y.; Janssen, C.R.; Goulet, R.R.; Kamunde, C.N. Conducting ecological risk assessments of inorganic metals and metalloids: Current status. Hum. Ecol. Risk Assess. 2003, 9, 641–697. [Google Scholar] [CrossRef]
- Langston, W.J.; Zhou, M.J. Cadmium accumulation, distribution and metabolism in the gastropod littorina-littorea—The role of metal-binding proteins. J. Mar. Biol. Assoc. UK 1987, 67, 585–601. [Google Scholar] [CrossRef]
- Bryan, G.W.; Langston, W.J. Bioavailability, accumulation and effects of heavy-metals in sediments with special reference to united-kingdom estuaries—A review. Environ. Pollut. 1992, 76, 89–131. [Google Scholar] [CrossRef]
- Wang, W.X. Interactions of trace metals and different marine food chains. Mar. Ecol. Prog. Ser. 2002, 243, 295–309. [Google Scholar] [CrossRef]
- Wang, W.X.; Rainbow, P.S. Influence of metal exposure history on trace metal uptake and accumulation by marine invertebrates. Ecotoxicol. Environ. Saf. 2005, 61, 145–159. [Google Scholar] [CrossRef] [PubMed]
- Ankley, G.T. Evaluation of metal/acid-volatile sulfide relationships in the prediction of metal bioaccumulation by benthic macroinvertebrates. Environ. Toxicol. Chem. 1996, 15, 2138–2146. [Google Scholar] [CrossRef]
- Borgmann, U.; Norwood, W.P. Metal bioavailability and toxicity through a sediment core. Environ. Pollut. 2002, 116, 159–168. [Google Scholar] [CrossRef]
- Borgmann, U.; Norwood, W.P.; Dixon, D.G. Re-evaluation of metal bioaccumulation and chronic toxicity in hyalella azteca using saturation curves and the biotic ligand model. Environ. Pollut. 2004, 131, 469–484. [Google Scholar] [CrossRef] [PubMed]
- Marsden, I.D.; Rainbow, P.S. Does the accumulation of trace metals in crustaceans affect their ecology—The amphipod example? J. Exp. Mar. Biol. Ecol. 2004, 300, 373–408. [Google Scholar] [CrossRef]
- Lee, J.S.; Lee, J.H. Influence of acid volatile sulfides and simultaneously extracted metals on the bioavailability and toxicity of a mixture of sediment-associated Cd, Ni, and Zn to polychaetes neanthes arenaceodentata. Sci. Total Environ. 2005, 338, 229–241. [Google Scholar] [CrossRef] [PubMed]
- Taylor, D.L.; Linehan, J.C.; Murray, D.W.; Prell, W.L. Indicators of sediment and biotic mercury contamination in a southern new england estuary. Mar. Pollut. Bull. 2012, 64, 807–819. [Google Scholar] [CrossRef] [PubMed]
- Kim, E.; Kim, H.; Shin, K.H.; Kim, M.S.; Kundu, S.R.; Lee, B.G.; Han, S. Biomagnification of mercury through the benthic food webs of a temperate estuary: Masan bay, korea. Environ. Toxicol. Chem. 2012, 31, 1254–1263. [Google Scholar] [CrossRef] [PubMed]
- Jones, H.J.; Swadling, K.M.; Bulter, E.C.V.; Macleod, C.K. Complex patterns in fish e sediment mercury concentrations in a contaminated estuary: The influence of selenium co-contamination? Estuar. Coast. Shelf Sci. 2014, 137, 14–22. [Google Scholar] [CrossRef]
- Michiels, C.; Raes, M.; Toussaint, O.; Remacle, J. Importance of se-glutathione peroxidase, catalase, and Cu/Zn-sod for cell-survival against oxidative stress. Free Radic. Biol. Med. 1994, 17, 235–248. [Google Scholar] [CrossRef]
- Hamilton, S.J. Review of selenium toxicity in the aquatic food chain. Sci. Total Environ. 2004, 326, 1–31. [Google Scholar] [CrossRef] [PubMed]
- Rainbow, P.S. Trace metal concentrations in aquatic invertebrates: Why and so what? Environ. Pollut. 2002, 120, 497–507. [Google Scholar] [CrossRef]
- Greenwood, N.N.; Earnshaw, A. Chemistry of the Elements; Pergmaon Press: Oxford, UK, 1984. [Google Scholar]
- Benjamin, M.M.; Leckie, J.O. Effects of complexation by chloride, sulfate, and thiosulfate on adsorption behavior of cadmium on oxide surfaces. Environ. Sci. Technol. 1982, 16, 162–170. [Google Scholar] [CrossRef]
- Mathews, T.; Fisher, N.S. Trophic transfer of seven trace metals in a four-step marine food chain. Mar. Ecol. Prog. Ser. 2008, 367, 23–33. [Google Scholar] [CrossRef]
- Yang, D.-Y.; Chen, Y.-W.; Gunn, J.M.; Belzile, N. Selenium and mercury in organisms: Interactions and mechanisms. Environ. Rev. 2008, 16, 71–92. [Google Scholar] [CrossRef]
- Chen, C.Y.; Folt, C.L. Bioaccumulation and diminution of arsenic and lead in a freshwater food web. Environ. Sci. Technol. 2000, 34, 3878–3884. [Google Scholar] [CrossRef]
- Chen, C.Y.; Folt, C.L.; Stemberger, R.S.; Blum, J.D.; Klaue, B.; Pickhardt, P.C. Accumulation of heavy metals in food web components across a gradient of lakes. Limnol. Oceanogr. 2000, 45, 1525–1536. [Google Scholar] [CrossRef]
- Dutton, J.; Fisher, N.S. Bioaccumulation of As, Cd, Cr, Hg(II), and mehg in killifish (Fundulus heteroclitus) from amphipod and worm prey. Sci. Total Environ. 2011, 409, 3438–3447. [Google Scholar] [CrossRef] [PubMed]
- Deegan, L.A.; Garritt, R.H. Evidence for spatial variability in estuarine food webs. Mar. Ecol. Prog. Ser. 1997, 147, 31–47. [Google Scholar] [CrossRef]
- Young, T.; Komarow, S.; Deegan, L.; Garritt, R. Population size and summer home range of the green crab, carcinus maenas, in salt marsh tidal creeks. Biol. Bull. 1999, 197, 297–299. [Google Scholar] [CrossRef]
- Fry, B.; Cieri, M.; Hughes, J.; Tobias, C.; Deegan, L.A.; Peterson, B. Stable isotope monitoring of benthic-planktonic coupling using salt marsh fish. Mar. Ecol. Prog. Ser. 2008, 369, 193–204. [Google Scholar] [CrossRef]
- Jones, S.H. A Technical Characterization of Estuarine and Coastal New Hampshire; New Hampshire Estuaries Project: Portsmouth, NH, USA, 2000; p. 274. [Google Scholar]
- Kahl, J.S.; Nelson, S.J.; Fernandez, I.; Haines, T.; Norton, S.; Wiersma, G.B.; Jacobson, G.; Amirbahman, A.; Johnson, K.; Schauffler, M.; et al. Watershed nitrogen and mercury geochemical fluxes integrate landscape factors in long-term research watersheds at Acadia national park, Maine, USA. Environ. Monit. Assess. 2007, 126, 9–25. [Google Scholar] [CrossRef] [PubMed]
- Sunderland, E.M.; Amirbahman, A.; Burgess, N.M.; Dalziel, J.; Harding, G.; Jones, S.H.; Kamai, E.; Karagas, M.R.; Shi, X.; Chen, C.Y. Mercury sources and fate in the gulf of maine. Environ. Res. 2012, 119, 27–41. [Google Scholar] [CrossRef] [PubMed]
- Chen, C.Y.; Dionne, M.; Mayes, B.M.; Ward, D.M.; Sturup, S.; Jackson, B.P. Mercury bioavailability and bioaccumulation in estuarine food webs in the gulf of maine. Environ. Sci. Technol. 2009, 43, 1804–1810. [Google Scholar] [CrossRef] [PubMed]
- Perna, L.; LaCroix-Fralish, A.; Sturup, S. Determination of inorganic mercury and methylmercury in zooplankton and fish samples by speciated isotopic dilution GC-ICP-MS after alkaline digestion. J. Anal. At. Spectrom. 2005, 20, 236–238. [Google Scholar] [CrossRef]
- Peterson, B.J.; Fry, B. Stable isotopes in ecosystem studies. Ann. Rev. Ecol. Syst. 1987, 18, 293–320. [Google Scholar] [CrossRef]
- Sullivan, M.J.; Moncreiff, C.A. Edaphic algae are an important component of salt-marsh food-webs—Evidence from multiple stable isotope analyses. Mar. Ecol. Prog. Ser. 1990, 62, 149–159. [Google Scholar] [CrossRef]
- Fisher, N.S.; Teyssie, J.L.; Fowler, S.W.; Wang, W.X. Accumulation and retention of metals in mussels from food and water: A comparison under field and laboratory conditions. Environ. Sci. Technol. 1996, 30, 3232–3242. [Google Scholar] [CrossRef]
- Stribling, J.M.; Cornwell, J.C. Identification of important primary producers in a chesapeake bay tidal creek system using stable isotopes of carbon and sulfur. Estuaries 1997, 20, 77–85. [Google Scholar] [CrossRef]
- Monikh, F.A.; Safahieh, A.; Savari, A.; Doraghi, A. Heavy metal concentration in sediment, benthic, benthopelagic, and pelagic fish species from Musa Estuary (Persian Gulf). Environ. Monit. Assess. 2013, 185, 215–222. [Google Scholar] [CrossRef] [PubMed]
- Chen, C.Y.; Borsuk, M.E.; Bugge, D.M.; Hollweg, T.; Balcom, P.H.; Ward, D.M.; Williams, J.; Mason, R.P. Benthic and pelagic pathways of methylmercury bioaccumulation in estuarine food webs of the northeast United States. PLoS ONE 2014, 9, e89305. [Google Scholar] [CrossRef] [PubMed]
- Amiard, J.C.; Geffard, A.; Amiard-Triquet, C.; Crouzet, C. Relationship between the lability of sediment-bound metals (Cd, Cu, Zn) and their bioaccumulation in benthic invertebrates. Estuar. Coast. Shelf Sci. 2007, 72, 511–521. [Google Scholar] [CrossRef]
- Baumann, Z.; Fisher, N.S. Relating the sediment phase speciation of arsenic, cadmium, and chromium with their bioavailability for the deposit-feeding polychaete nereis succinea. Environ. Toxicol. Chem. 2011, 30, 747–756. [Google Scholar] [CrossRef] [PubMed]
- Sotos-Jiménez, M.F.; Arellano-Fiore, C.; Rocha-Velarde, R.; Jara-Marini, M.E.; Ruelas-Inzunza, J.; Páez-Osuna, F. Trophic transfer of lead through a model marine four-level food chain: Tetraselmis suecica, Artemia franscscana, Litopenaeus vannamei, and Haemulon scudderi. Arch. Environ. Contam. Toxicol. 2011, 61, 280–291. [Google Scholar] [CrossRef] [PubMed]
- Ray, S.; McLeese, D.; Pezzack, D. Accumulation of cadmium by nereis-virens. Arch. Environ. Contam. Toxicol. 1980, 9, 1–8. [Google Scholar] [CrossRef] [PubMed]
- Metian, M.; Warnau, M.; Oberhansli, F.; Bustamante, P. Delineation of Pb contamination pathways in two pectinidae: The variegated scallop Chlamys varia and the king scallop Pecten maximus. Sci. Total Environ. 2009, 407, 3503–3509. [Google Scholar] [CrossRef] [PubMed]
- Bryan, G.W. The use of multi-estuary comparisons to elucidate factors governing the bioaccumulation and effects of heavy-metals in benthic organisms. Estuaries 1985, 8, A99. [Google Scholar]
- Fisher, N.S.; Reinfelder, J.R. The trophic transfer of metals in marine systems. In Metal Speciation and Bioavailability in Aquatic Systems; Tessier, A., Turner, D.R., Eds.; John Wiley & Sons Ltd.: Hoboken, NJ, USA, 1995; pp. 363–406. [Google Scholar]
- Harris, R.C.; Bodaly, R.A. Temperature, growth and dietary effects on fish mercury dynamics in two Ontario lakes. Biogeochemistry 1998, 40, 175–187. [Google Scholar] [CrossRef]
- Mason, R.P.; Laporte, J.M.; Andres, S. Factors controlling the bioaccumulation of mercury, methylmercury, arsenic, selenium, and cadmium by freshwater invertebrates and fish. Arch. Environ. Contam. Toxicol. 2000, 38, 283–297. [Google Scholar] [CrossRef] [PubMed]
- Chen, C.; Amirbahman, A.; Fisher, N.; Harding, G.; Lamborg, C.; Nacci, D.; Taylor, D. Methylmercury in marine ecosystems: Spatial patterns and processes of production, bioaccumulation, and biomagnification. EcoHealth 2008, 5, 399–408. [Google Scholar] [CrossRef] [PubMed]
- Adams, W.J.; Blust, R.; Borgmann, U.; Brix, K.V.; DeForest, D.K.; Green, A.S.; Meyer, J.S.; McGeer, J.C.; Paquin, P.R.; Rainbow, P.S.; et al. Utility of tissue residues for predicting effects of metals on aquatic organisms. Integr. Environ. Assess. Manag. 2010, 7, 75–98. [Google Scholar] [CrossRef] [PubMed]
- Berry, W.J.; Hansen, D.J.; Mahony, J.D.; Robson, D.L.; DiToro, D.M.; Shipley, B.P.; Rogers, B.; Corbin, J.M.; Boothman, W.S. Predicting the toxicity of metal-spiked laboratory sediments using acid-volatile sulfide and interstitial water normalizations. Environ. Toxicol. Chem. 1996, 15, 2067–2079. [Google Scholar] [CrossRef]
- US Environmental Protection Agency. Procedures for the Derivation of Equilibrium Partitioning Sediment Benchmarks (ESBX) for the Protection of Benthic Organisms: Metal Mixtures (Cadmium, Copper, Lead, Nickel, Silver and Zinc); Office of Research and Development: Washington, DC, USA, 2005. [Google Scholar]
- Lee, B.G.; Griscom, S.B.; Lee, J.S.; Choi, H.J.; Koh, C.H.; Luoma, S.N.; Fisher, N.S. Influences of dietary uptake and reactive sulfides on metal bioavailability from aquatic sediments. Science 2000, 287, 282–284. [Google Scholar] [CrossRef] [PubMed]
- De Jonge, M.; Dreesen, F.; de Paepe, J.; Blust, R.; Bervoets, L. Do acid volatile sulfides (AVS) influence the accumulation of sediment-bound metals to benthic invertebrates under natural field conditions? Environ. Sci. Technol. 2009, 43, 4510–4516. [Google Scholar] [CrossRef] [PubMed]
- Wang, W.X.; Fisher, N.S. Assimilation efficiencies of chemical contaminants in aquatic invertebrates: A synthesis. Environ. Toxicol. Chem. 1999, 18, 2034–2045. [Google Scholar] [CrossRef]
- Hare, L.; Tessier, A.; Borgmann, U. Metal sources for freshwater invertebrates: Pertinence for risk assessment. Hum. Ecol. Risk Assess. 2003, 9, 779–793. [Google Scholar] [CrossRef]
- Balcom, P.H.; Schartup, A.T.; Mason, R.P.; Chen, C.Y. Sources of water column methylmercury across multiple estuaries in the Northeast U.S. Mar. Chem. 2015, 177, 721–730. [Google Scholar] [CrossRef] [PubMed]
- Power, M.; Klein, G.M.; Guiguer, K.; Kwan, M.K.H. Mercury accumulation in the fish community of a sub-Arctic lake in relation to trophic position and carbon sources. J. Appl. Ecol. 2002, 39, 819–830. [Google Scholar] [CrossRef]
- Campbell, L.M.; Norstrom, R.J.; Hobson, K.A.; Muir, D.C.G.; Backus, S.; Fisk, A.T. Mercury and other trace elements in a pelagic Arctic marine food web (Northwater Polynya, Baffin Bay). Sci. Total Environ. 2005, 351, 247–263. [Google Scholar] [CrossRef] [PubMed]
- Hammerschmidt, C.R.; Fitzgerald, W.F. Bioaccumulation and trophic transfer of methylmercury in long island sound. Arch. Environ. Contam. Toxicol. 2006, 51, 416–424. [Google Scholar] [CrossRef] [PubMed]
- Driscoll, C.T.; Han, Y.J.; Chen, C.Y.; Evers, D.C.; Lambert, K.F.; Holsen, T.M.; Kamman, N.C.; Munson, R.K. Mercury Contamination in Forest and Freshwater Ecosystems in the Northeastern United States. Bioscience 2007, 57, 17–28. [Google Scholar] [CrossRef]
- Kidd, K.A.; Muir, D.C.G.; Evans, M.S.; Wang, X.; Whittle, M.; Swanson, H.K.; Johnston, T.; Guildford, S. Biomagnification of mercury through lake trout (Salvelinus namaycush) food webs of lakes with different physical, chemical and biological characteristics. Sci. Total Environ. 2012, 438, 135–143. [Google Scholar] [CrossRef] [PubMed]
- Lavoie, R.A.; Jardine, T.D.; Chumchal, M.M.; Kidd, K.A.; Campbell, L.M. Biomagnification of mercury in aquatic food webs: A worldwide meta-analysis. Environ. Sci. Technol. 2013, 47, 13385–13394. [Google Scholar] [CrossRef] [PubMed]


| Site | As (μg·g−1) | Cd (μg·g−1) | Hg (μg·g−1) | MeHg (μg·g−1) | Pb (μg·g−1) | Se (μg·g−1) | TOC (%) | SEM-AVS |
|---|---|---|---|---|---|---|---|---|
| Adams Pt. NH | 11.2 | 0.4 | 0.2 | 0.002 | 37.3 | 1.1 | 2.1 | −11.7 |
| Bold Point RI | 8.8 | 0.5 | 0.08 | 0.0006 | 75.9 | 0.6 | 3.2 | −28.6 |
| Greenwich RI | 1.2 | 0.08 | 0.05 | 0.0001 | 17.4 | 0.3 | 0.8 | −1 |
| MDI ME | 3.6 | 0.2 | 0.04 | 0.0004 | 11.1 | 0.5 | 1.6 | −14.1 |
| Portsmouth Harbor NH | 12.1 | 0.6 | 0.3 | 0.003 | 79.6 | 1.3 | 2.8 | −28 |
| Wells ME | 2.2 | 0.1 | 0.03 | 0.0003 | 4.7 | 0.3 | 0.5 | −15.2 |
| Sample Type | As | Cd | Hg | MeHg | Pb | Se |
|---|---|---|---|---|---|---|
| Sediment | 73.4 | 63.7 | 93.9 | 115.2 | 87.5 | 61.8 |
| Amphipod | 153.1 | 56.9 | 54.9 | 67.4 | 38.7 | 40.1 |
| Crab | 119.8 | 63.1 | 55.2 | 42.7 | 125.0 | 42.3 |
| Fundulus | 23.3 | 114.8 | 44.2 | 48.7 | 85.8 | 35.6 |
| Mussel | 60.7 | 71.1 | 64.1 | 42.3 | 59.2 | 19.5 |
| Shrimp | 43.5 | 65.1 | 37.3 | 51.1 | 92.2 | 39.6 |
| Response Variable (Metal in Biota) | Sediment Characteristic | R2 | Full Model p-Value | p-Value for Difference across Species | Test for Relationship between Metal Concentration in Biota and Sediment Characteristic | |
|---|---|---|---|---|---|---|
| Slope ± SE | p-Value | |||||
| As | Sed. Conc | 40% | 0.02 | 0.01 | −0.01 ± 0.17 | 0.96 |
| Cd | Sed. Conc | 60% | <0.001 | <0.001 | 0.16 ± 0.22 | 0.49 |
| Hg | Sed. Conc | 56% | 0.001 | 0.001 | 0.24 ± 0.12 | 0.08 |
| MeHg | Sed. Conc | 29% | 0.11 | 0.07 | 0.04 ± 0.1 | 0.72 |
| Pb | Sed. Conc | 42% | 0.02 | 0.02 | 0.22 ± 0.14 | 0.17 |
| Se | Sed. Conc | 55% | 0.001 | 0.001 | −0.07 ± 0.13 | 0.62 |
| As | TOC-corrected Sed. Conc. | 43% | 0.01 | 0.01 | −0.36 ± 0.32 | 0.3 |
| Cd | TOC-corrected Sed. Conc. | 61% | <0.001 | <0.001 | 0.69 ± 0.59 | 0.28 |
| Hg ** | TOC-corrected Sed. Conc. | 64% | <0.001 | <0.001 | 0.52 ± 0.16 | 0.02 |
| MeHg | TOC-corrected Sed. Conc. | 30% | 0.11 | 0.07 | 0.07 ± 0.14 | 0.64 |
| Pb | TOC-corrected Sed. Conc. | 37% | 0.04 | 0.02 | 0.2 ± 0.3 | 0.54 |
| Se | TOC-corrected Sed. Conc. | 55% | 0.001 | 0.001 | −0.04 ± 0.18 | 0.84 |
| Cd | SEM Cd | 62% | <0.001 | <0.001 | 0.26 ± 0.18 | 0.21 |
| Hg | SEM Hg | 49% | 0.004 | 0.002 | 0.05 ± 0.08 | 0.53 |
| Pb ** | SEM Pb | 47% | 0.006 | 0.01 | 0.5 ± 0.22 | 0.06 |
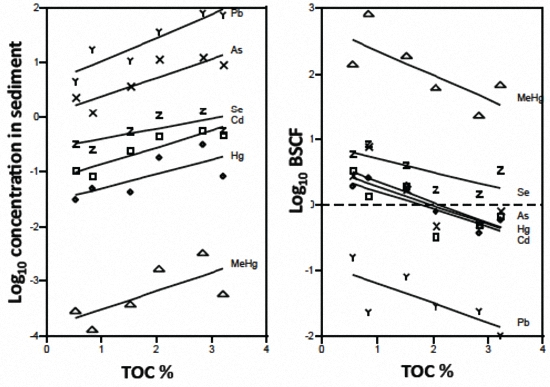
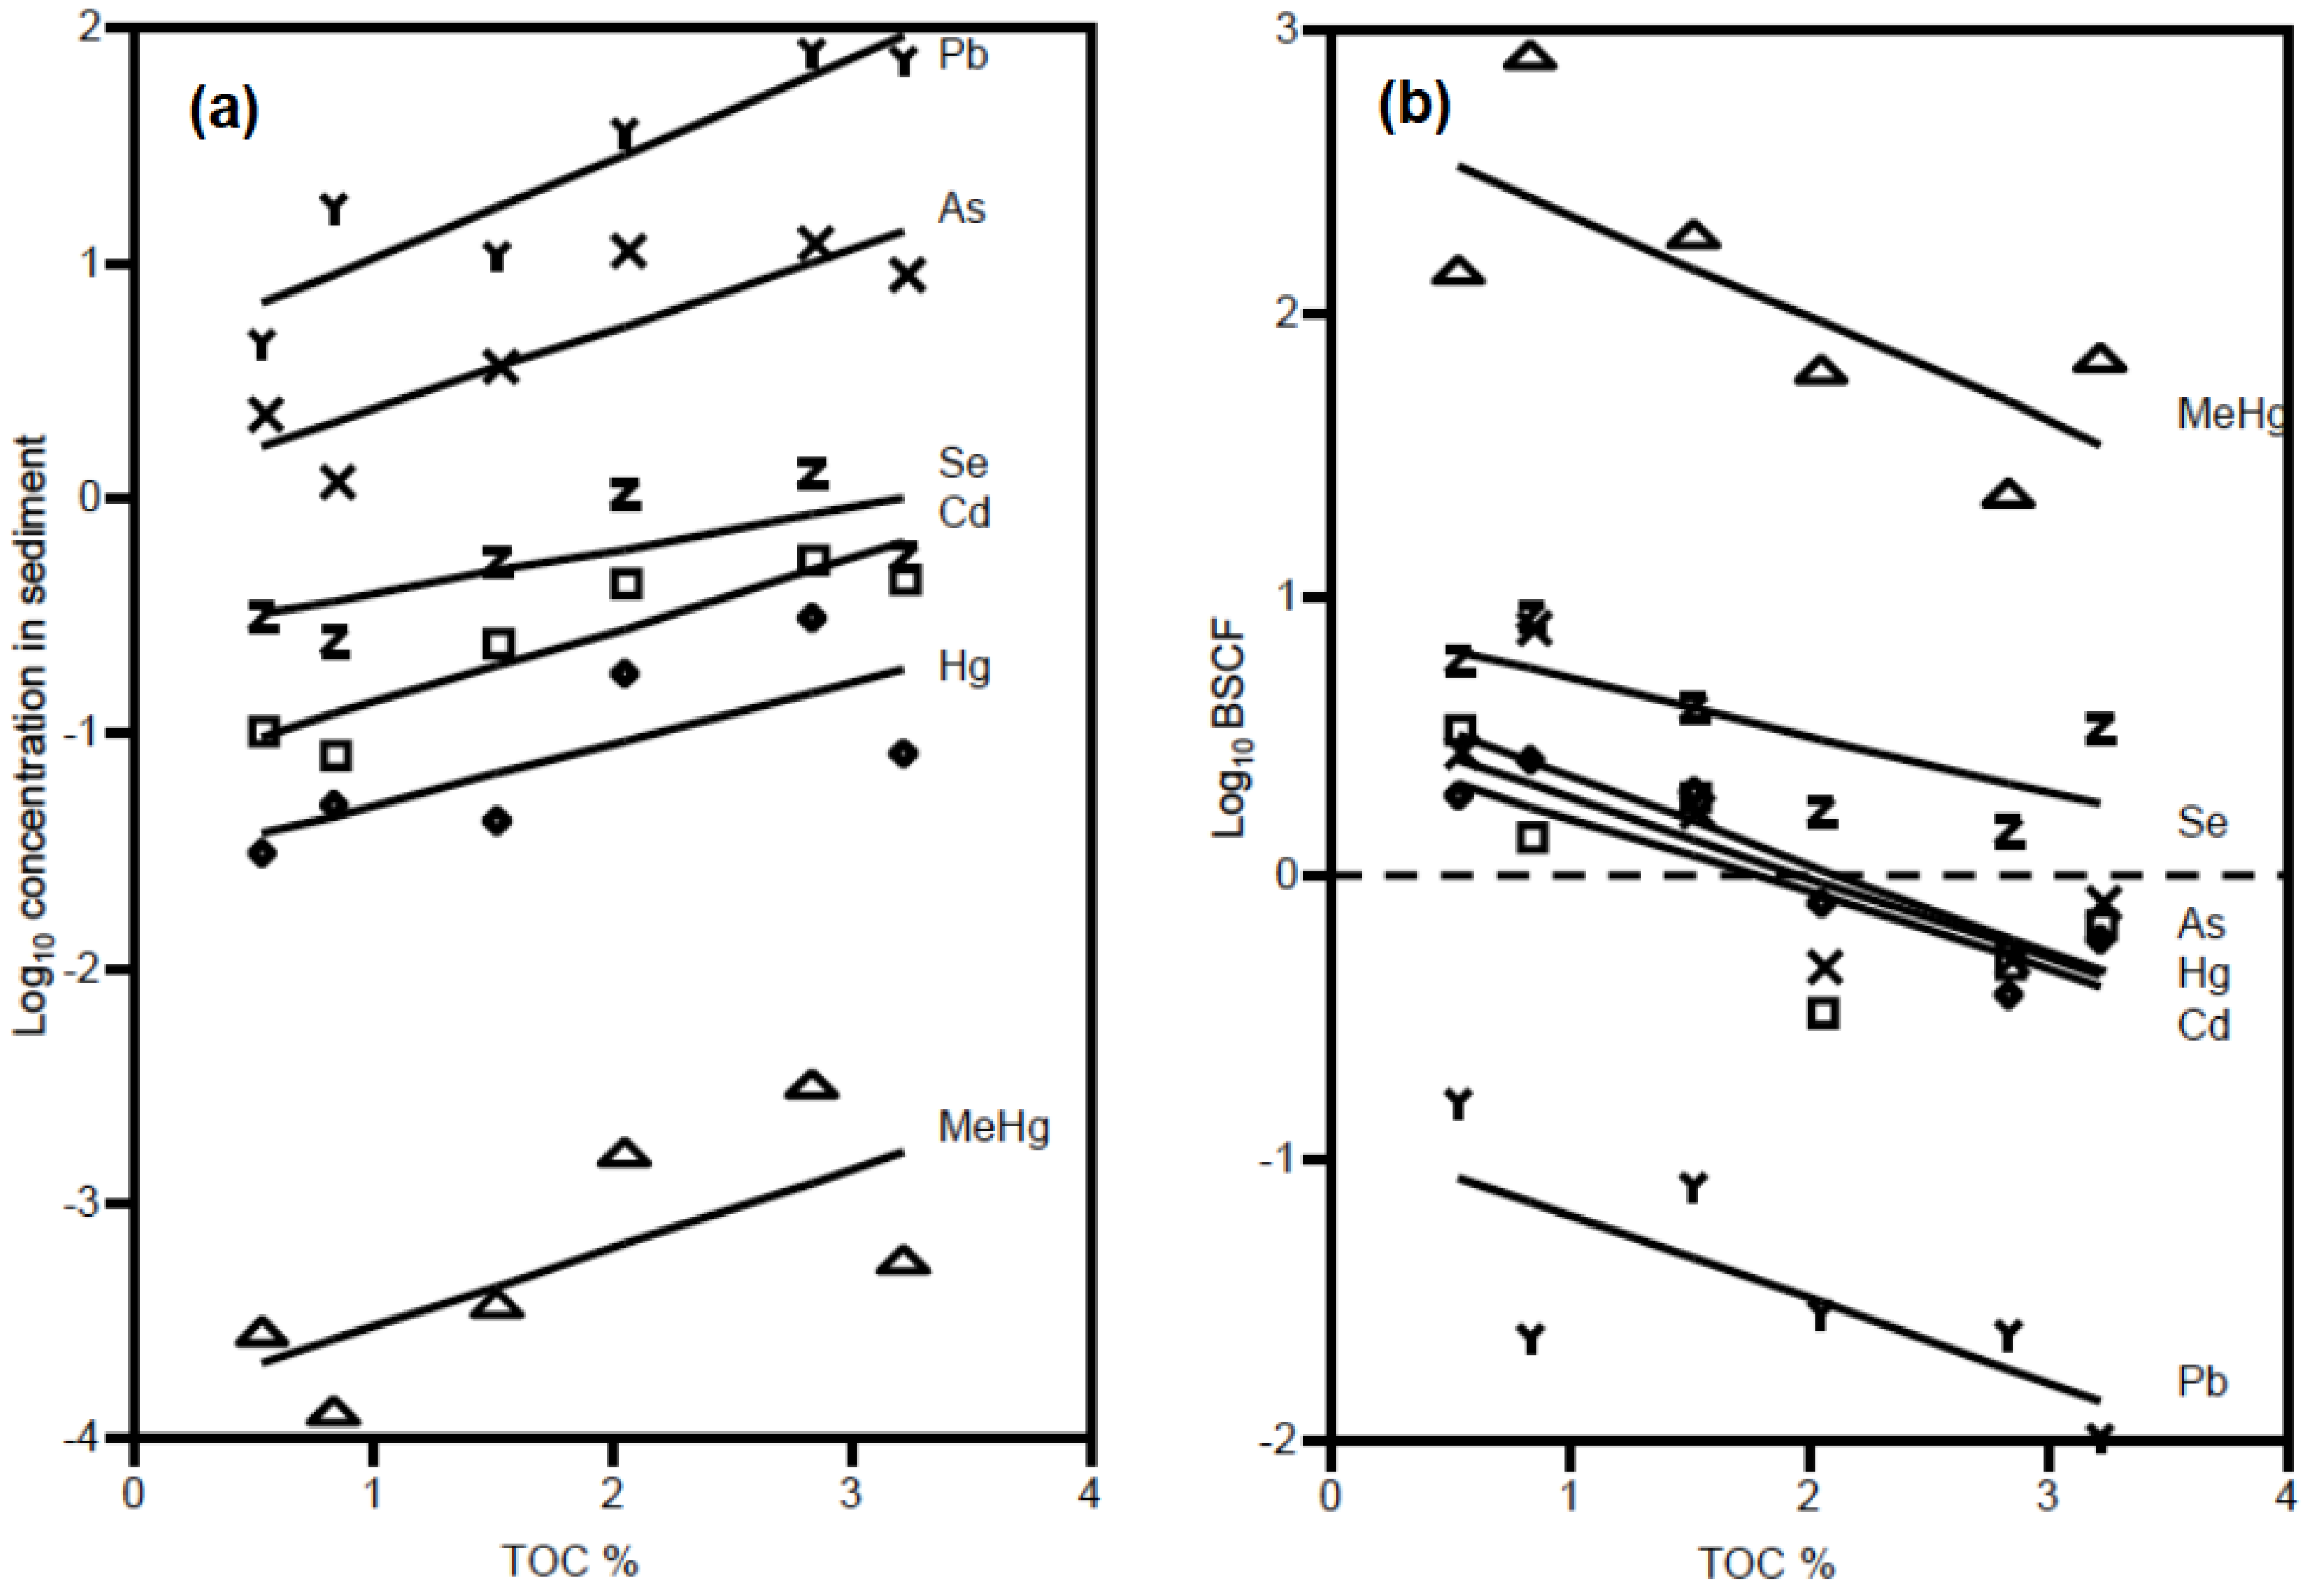
| AsBSAF ** | TOC | 44% | 0.01 | 0.09 | −0.27 ± 0.09 | 0.02 |
| CdBSAF ** | TOC | 66% | <0.001 | <0.001 | −0.27 ± 0.07 | 0.01 |
| HgBSAF ** | TOC | 77% | <0.001 | 0.001 | −0.28 ± 0.04 | <0.001 |
| MeHgBSAF ** | TOC | 54% | 0.001 | 0.42 | −0.36 ± 0.07 | 0.003 |
| PbBSAF ** | TOC | 52% | 0.002 | 0.06 | −0.3 ± 0.08 | 0.01 |
| SeBSAF ** | TOC | 54% | 0.002 | 0.04 | −0.2 ± 0.05 | 0.01 |
| AsBSAF ** | SEM-AVS | 39% | 0.03 | 0.11 | 0.02 ± 0.01 | 0.04 |
| CdBSAF | SEM-AVS | 51% | 0.003 | 0.002 | 0.01 ± 0.01 | 0.23 |
| HgBSAF ** | SEM-AVS | 70% | <0.001 | 0.002 | 0.03 ± 0.005 | 0.001 |
| MeHgBSAF ** | SEM-AVS | 68% | <0.001 | 0.24 | 0.04 ± 0.01 | 0.001 |
| PbBSAF | SEM-AVS | 26% | 0.17 | 0.17 | 0.01 ± 0.01 | 0.25 |
| SeBSAF ** | SEM-AVS | 44% | 0.01 | 0.07 | 0.02 ± 0.01 | 0.03 |
| Response Variable (Metal in Biota) | R2 | Full Model p-Value | p-Value for Difference across Sites | Test for Relationship between Metal Concentration and Pelagic Feeding (13C) | Test for Relationship between Metal Concentration and Trophic Level (15N) | ||
|---|---|---|---|---|---|---|---|
| 13C p-Value | 13C Slope ± SE | 15N p-Value | 15N Slope ± SE | ||||
| As | 31% | 0.24 | 0.14 | 0.09 | 0.08 ± 0.04 | 0.03 | −0.11 ± 0.05 |
| Cd | 35% | 0.16 | 0.37 | 0.18 | −0.08 ± 0.06 | 0.29 | −0.07 ± 0.06 |
| Hg ** | 58% | <0.001 | 0.03 | <0.001 | −0.09 ± 0.02 | 0.24 | 0.03 ± 0.03 |
| MeHg ** | 66% | <0.001 | <0.001 | <0.001 | −0.08 ± 0.02 | 0.02 | 0.06 ± 0.02 |
| Pb | 43% | 0.05 | 0.15 | 0.32 | −0.04 ± 0.04 | 0.13 | −0.07 ± 0.04 |
| Se | 15% | 0.77 | 0.99 | 0.14 | −0.04 ± 0.03 | 0.88 | 0 ± 0.03 |
| %MeHg ** | 41% | 0.07 | 0.41 | 0.95 | −0.08 ± 1.46 | 0.01 | 4.39 ± 1.66 |
© 2016 by the authors; licensee MDPI, Basel, Switzerland. This article is an open access article distributed under the terms and conditions of the Creative Commons Attribution license ( http://creativecommons.org/licenses/by/4.0/).
Share and Cite
Chen, C.Y.; Ward, D.M.; Williams, J.J.; Fisher, N.S. Metal Bioaccumulation by Estuarine Food Webs in New England, USA. J. Mar. Sci. Eng. 2016, 4, 41. https://doi.org/10.3390/jmse4020041
Chen CY, Ward DM, Williams JJ, Fisher NS. Metal Bioaccumulation by Estuarine Food Webs in New England, USA. Journal of Marine Science and Engineering. 2016; 4(2):41. https://doi.org/10.3390/jmse4020041
Chicago/Turabian StyleChen, Celia Y., Darren M. Ward, Jason J. Williams, and Nicholas S. Fisher. 2016. "Metal Bioaccumulation by Estuarine Food Webs in New England, USA" Journal of Marine Science and Engineering 4, no. 2: 41. https://doi.org/10.3390/jmse4020041