1. Introduction
Tidal energy is nowadays one of the fastest growing types of marine renewable energy. In particular, Horizontal Axis Tidal Turbines (HATTs) are the most advanced designs and the most appropriate for standardization. Unlike wave energy converters, extreme loading checked during design in tidal turbine is easier to predict and model because it does not involve large amplitude motions and non-linearities, slamming or other difficult to simulate phenomena [
1]. Tidal turbines that can pitch their blades out of the current in extreme wave and current conditions present an attractive opportunity to drive down the costs of these devices. On the other hand, tidal turbines are in most cases not very easy to access/retrieve in the case of a failure, having a similar or even worse picture than offshore wind turbines. It is therefore of paramount importance to increase the reliability in an effort to drive down the costs.
It is, however, in the interest of the industry to provide a set of standard practices in order to help in the process of designing this type of marine converters. Det Norske Veritas Germanischer Lloyds (DNV GL) has produced the standard DNVGL-ST-0164 Tidal turbines with the support of Alstom and as part of the Reliable Data Acquisition Platform for Tidal (ReDAPT) project commissioned and co-funded by the Energy Technologies Institute.
During the design of a tidal turbine, phases like site characterization or loads simulation have a high degree of uncertainty and yet they are fundamental. The safety and reliability of these machines and the structures that support them depends on our understanding and quantification of the uncertainties related to their design and fabrication.
This paper focuses on the uncertainties during the design phase and especially in those related to site conditions.
Types of Uncertainty
The uncertainty can be accounted for in the design standards in the form of partial safety factors. In the calibration stage of these partial safety factors, parameters subject to uncertainty are assumed to be modelled by stochastic variables and/or stochastic processes/stochastic fields [
2]. Uncertainties modelled by stochastic variables
X = (
X1, …,
Xn) are divided in the following groups:
- (a)
Physical uncertainty, also denoted inherent uncertainty, is related to the natural randomness of a quantity, for example the annual maximum significant wave height or the uncertainty in the yield stress due to production variability.
- (b)
Measurement uncertainty is related to imperfect measurements of for example a geometrical quantity.
- (c)
Statistical uncertainty is due to limited sample sizes of observed quantities. Data of observations are in many cases scarce and limited. Therefore, the parameters of the considered random variables cannot be determined exactly. They are uncertain themselves and may therefore also be modelled as random variables. As additional observations are provided, the statistical uncertainty may be reduced.
- (d)
Model uncertainty is the uncertainty related to imperfect knowledge or idealizations of the mathematical models used or uncertainty related to the choice of probability distribution types for the stochastic variables.
Model, statistical and measurement uncertainties are denoted epistemic uncertainties. Another “type” of uncertainty that is not covered by these methods is gross errors or human errors. These types of errors can be defined as deviation of an event or process from acceptable engineering practice and is generally handled by quality control measures.
2. Site Conditions
Site conditions consist of all natural phenomena which may influence the design of a HATT by governing its loading, its capacity or both. They cover virtually all environmental conditions at the site, including but not limited to meteorological conditions, oceanographic conditions, water depth, geotechnical conditions, seismicity, biology, and various human activities.
This paper will focus on the uncertainties related to the oceanographic conditions. The oceanographic conditions, current and waves, are very important in the determination of the loading of the HATT. In order to determine the extreme and fatigue loads for design, in most cases a measurement campaign is done at the site where it is intended to install the HATT. These measurements are used to determine the “normal” conditions or the annual distribution to calculate the fatigue loads and they are also used to determine through extrapolation what would be the “extreme” conditions to calculate the extreme/survival loads. The limitations of these measurements are discussed below.
2.1. Measurements
Measurements of the current are usually done using Acoustic Doppler Profilers (ADP) and often in combination with the more sensitive acoustic Doppler velocimeters. For the case of ReDAPT, a range of Doppler sensors were used to allow a full characterization of the current climate: the 10-min mean speed, the turbulence intensity and the integral length scales. A description of the current speed measurement instrumentation is given in [
3].
The 10-min mean current speed is probably the single most important parameter in the determination of the loading of the turbine, for which ADPs are normally used by the industry. On the other hand, these measurements are rather short (usually one month) to build a long-term distribution and hence the need to use other methods to predict the long-term behaviour. One method can be the harmonic analysis, which is well known in tide prediction. However, little or no data exist for its validation in current speed prediction.
The Turbulence Intensity (TI), defined as
where
is the standard deviation of
, gives information on the fluctuation of the speed. Usually, ADPs in Janus configuration are used to determine the
TI but are known to have flaws due to its working physics. As a result of its diverging beams and its volume averaging, readings are less and less accurate along the water column. ADPs are also known for the Doppler noise in the readings, the higher the sampling frequency the better to capture higher speed fluctuations but the higher the noise. As a result, the sampling frequency is also a trade-off between measurement accuracy and noise tolerance. The removal of this Doppler noise is normally done in the post processing with the method described in [
4]. It is, however, far from being a definitive technique and it is still under investigation [
5].
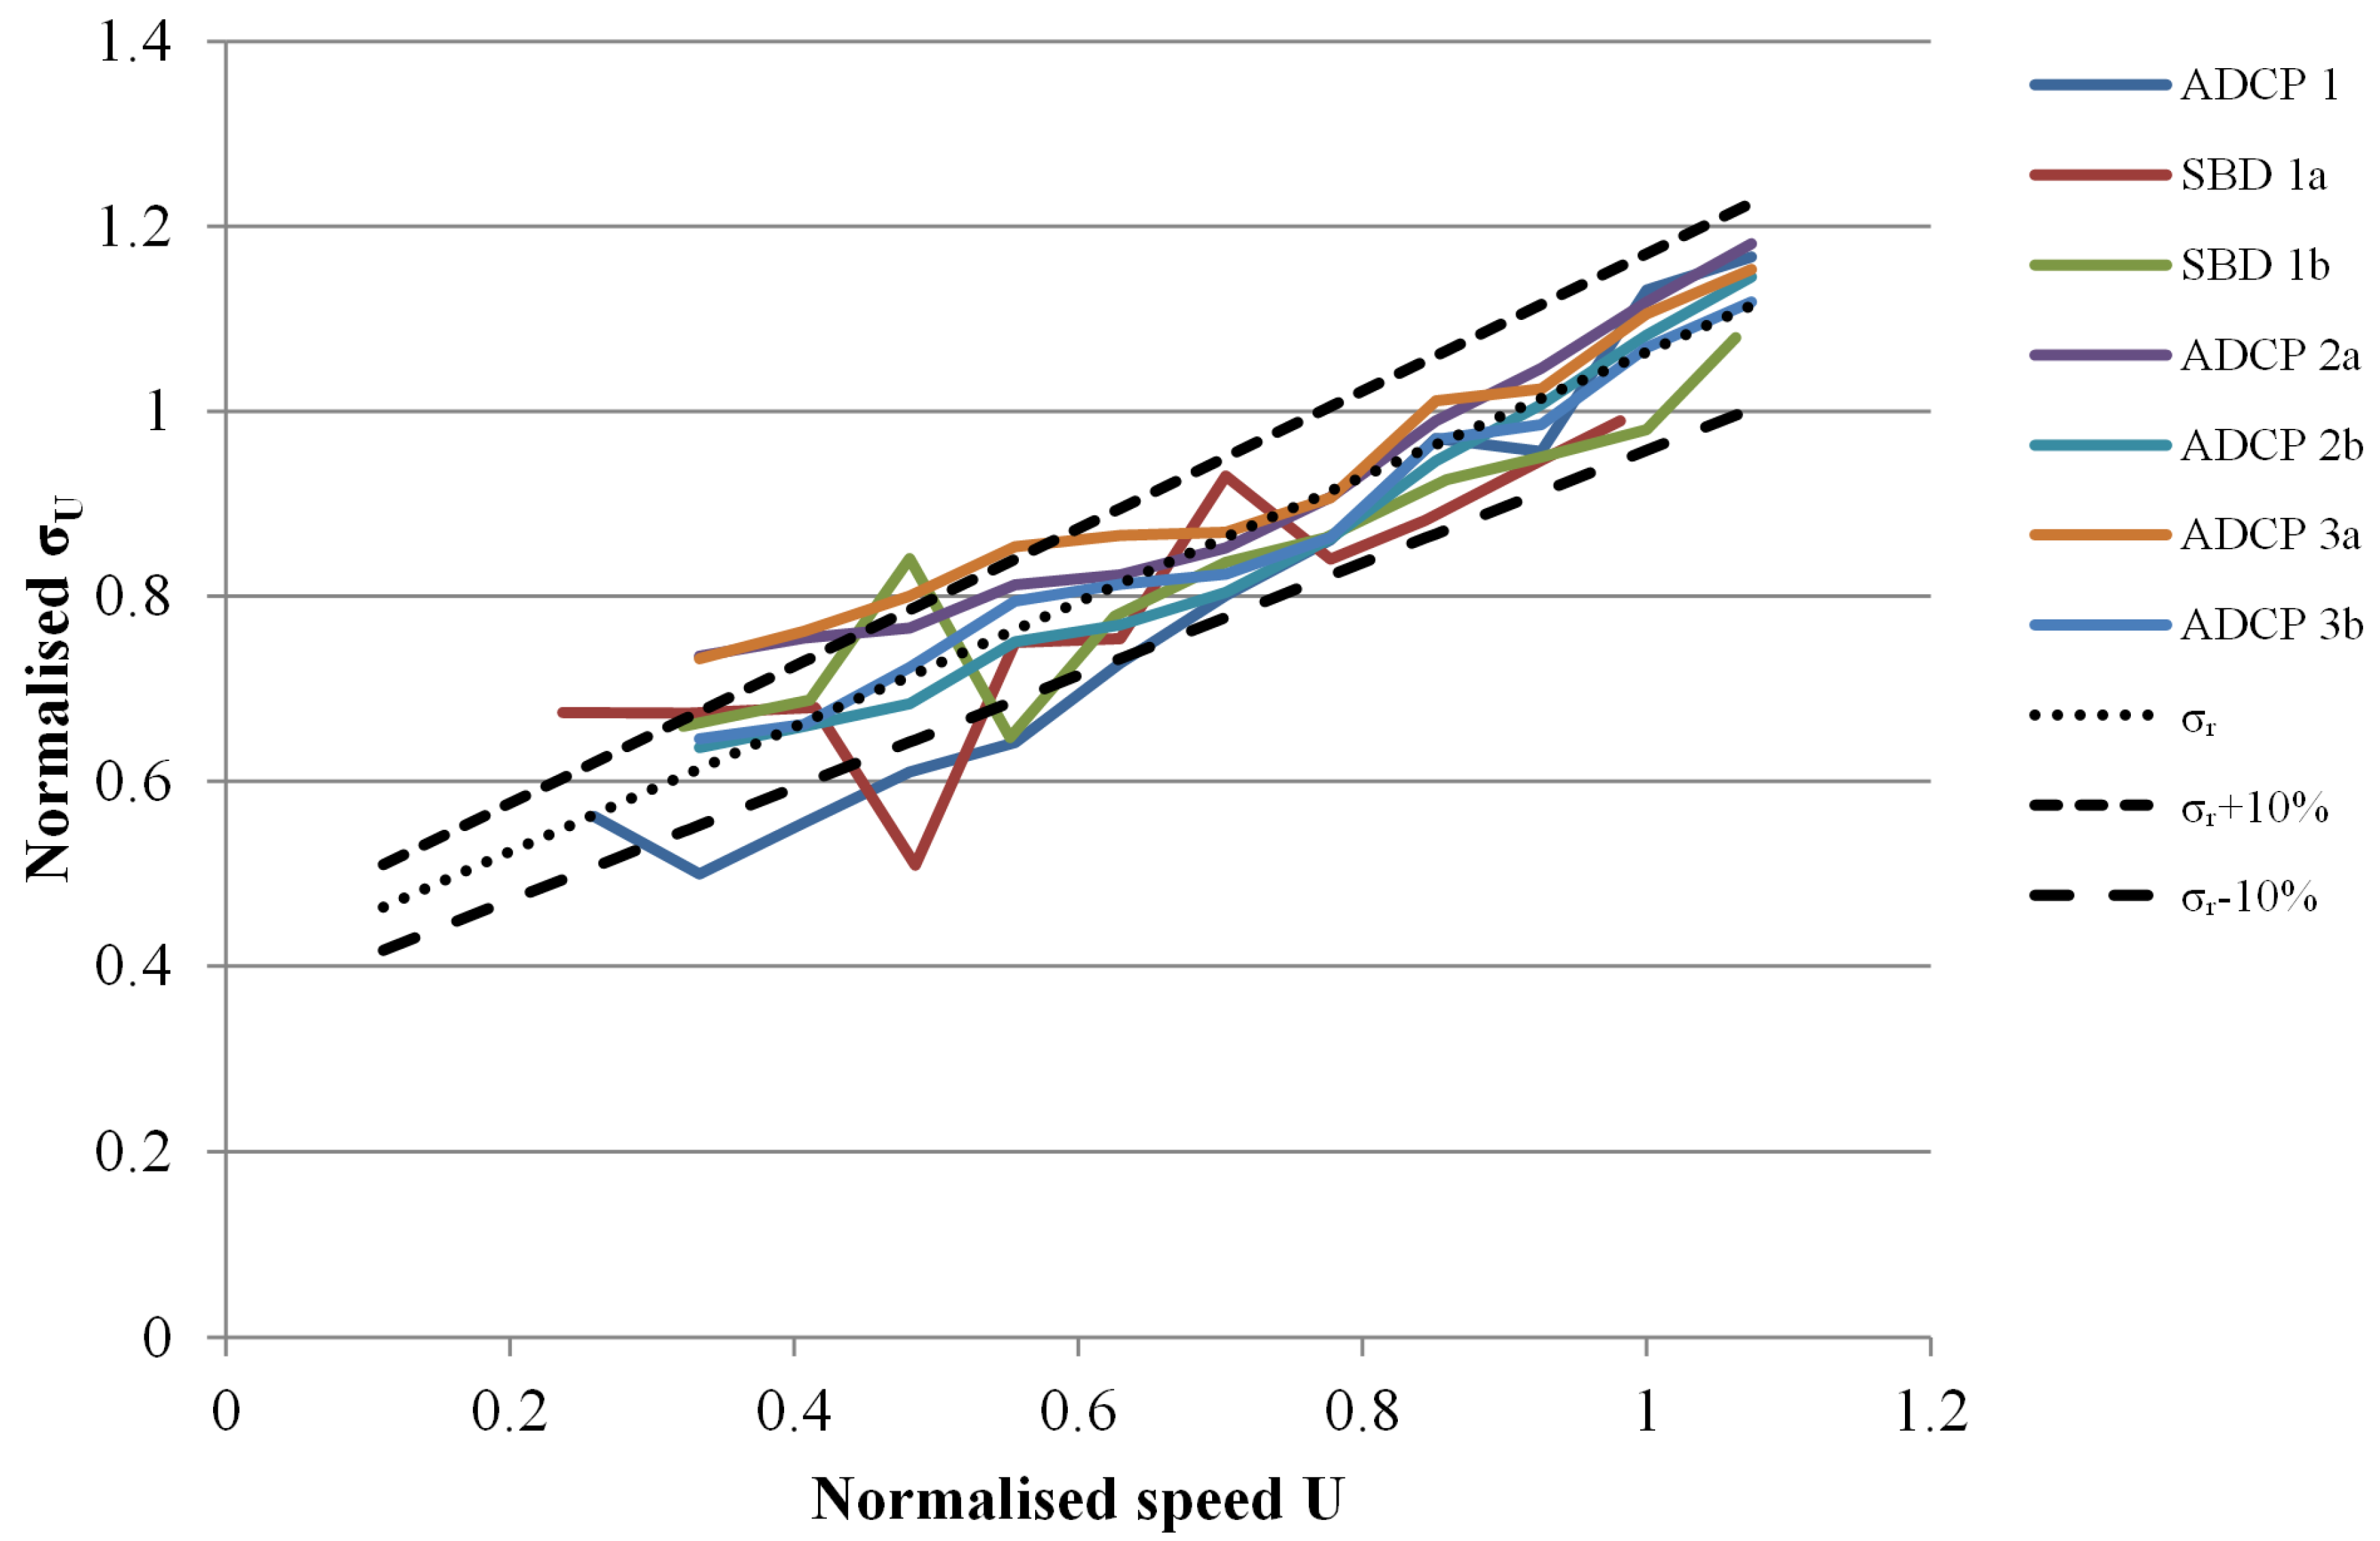
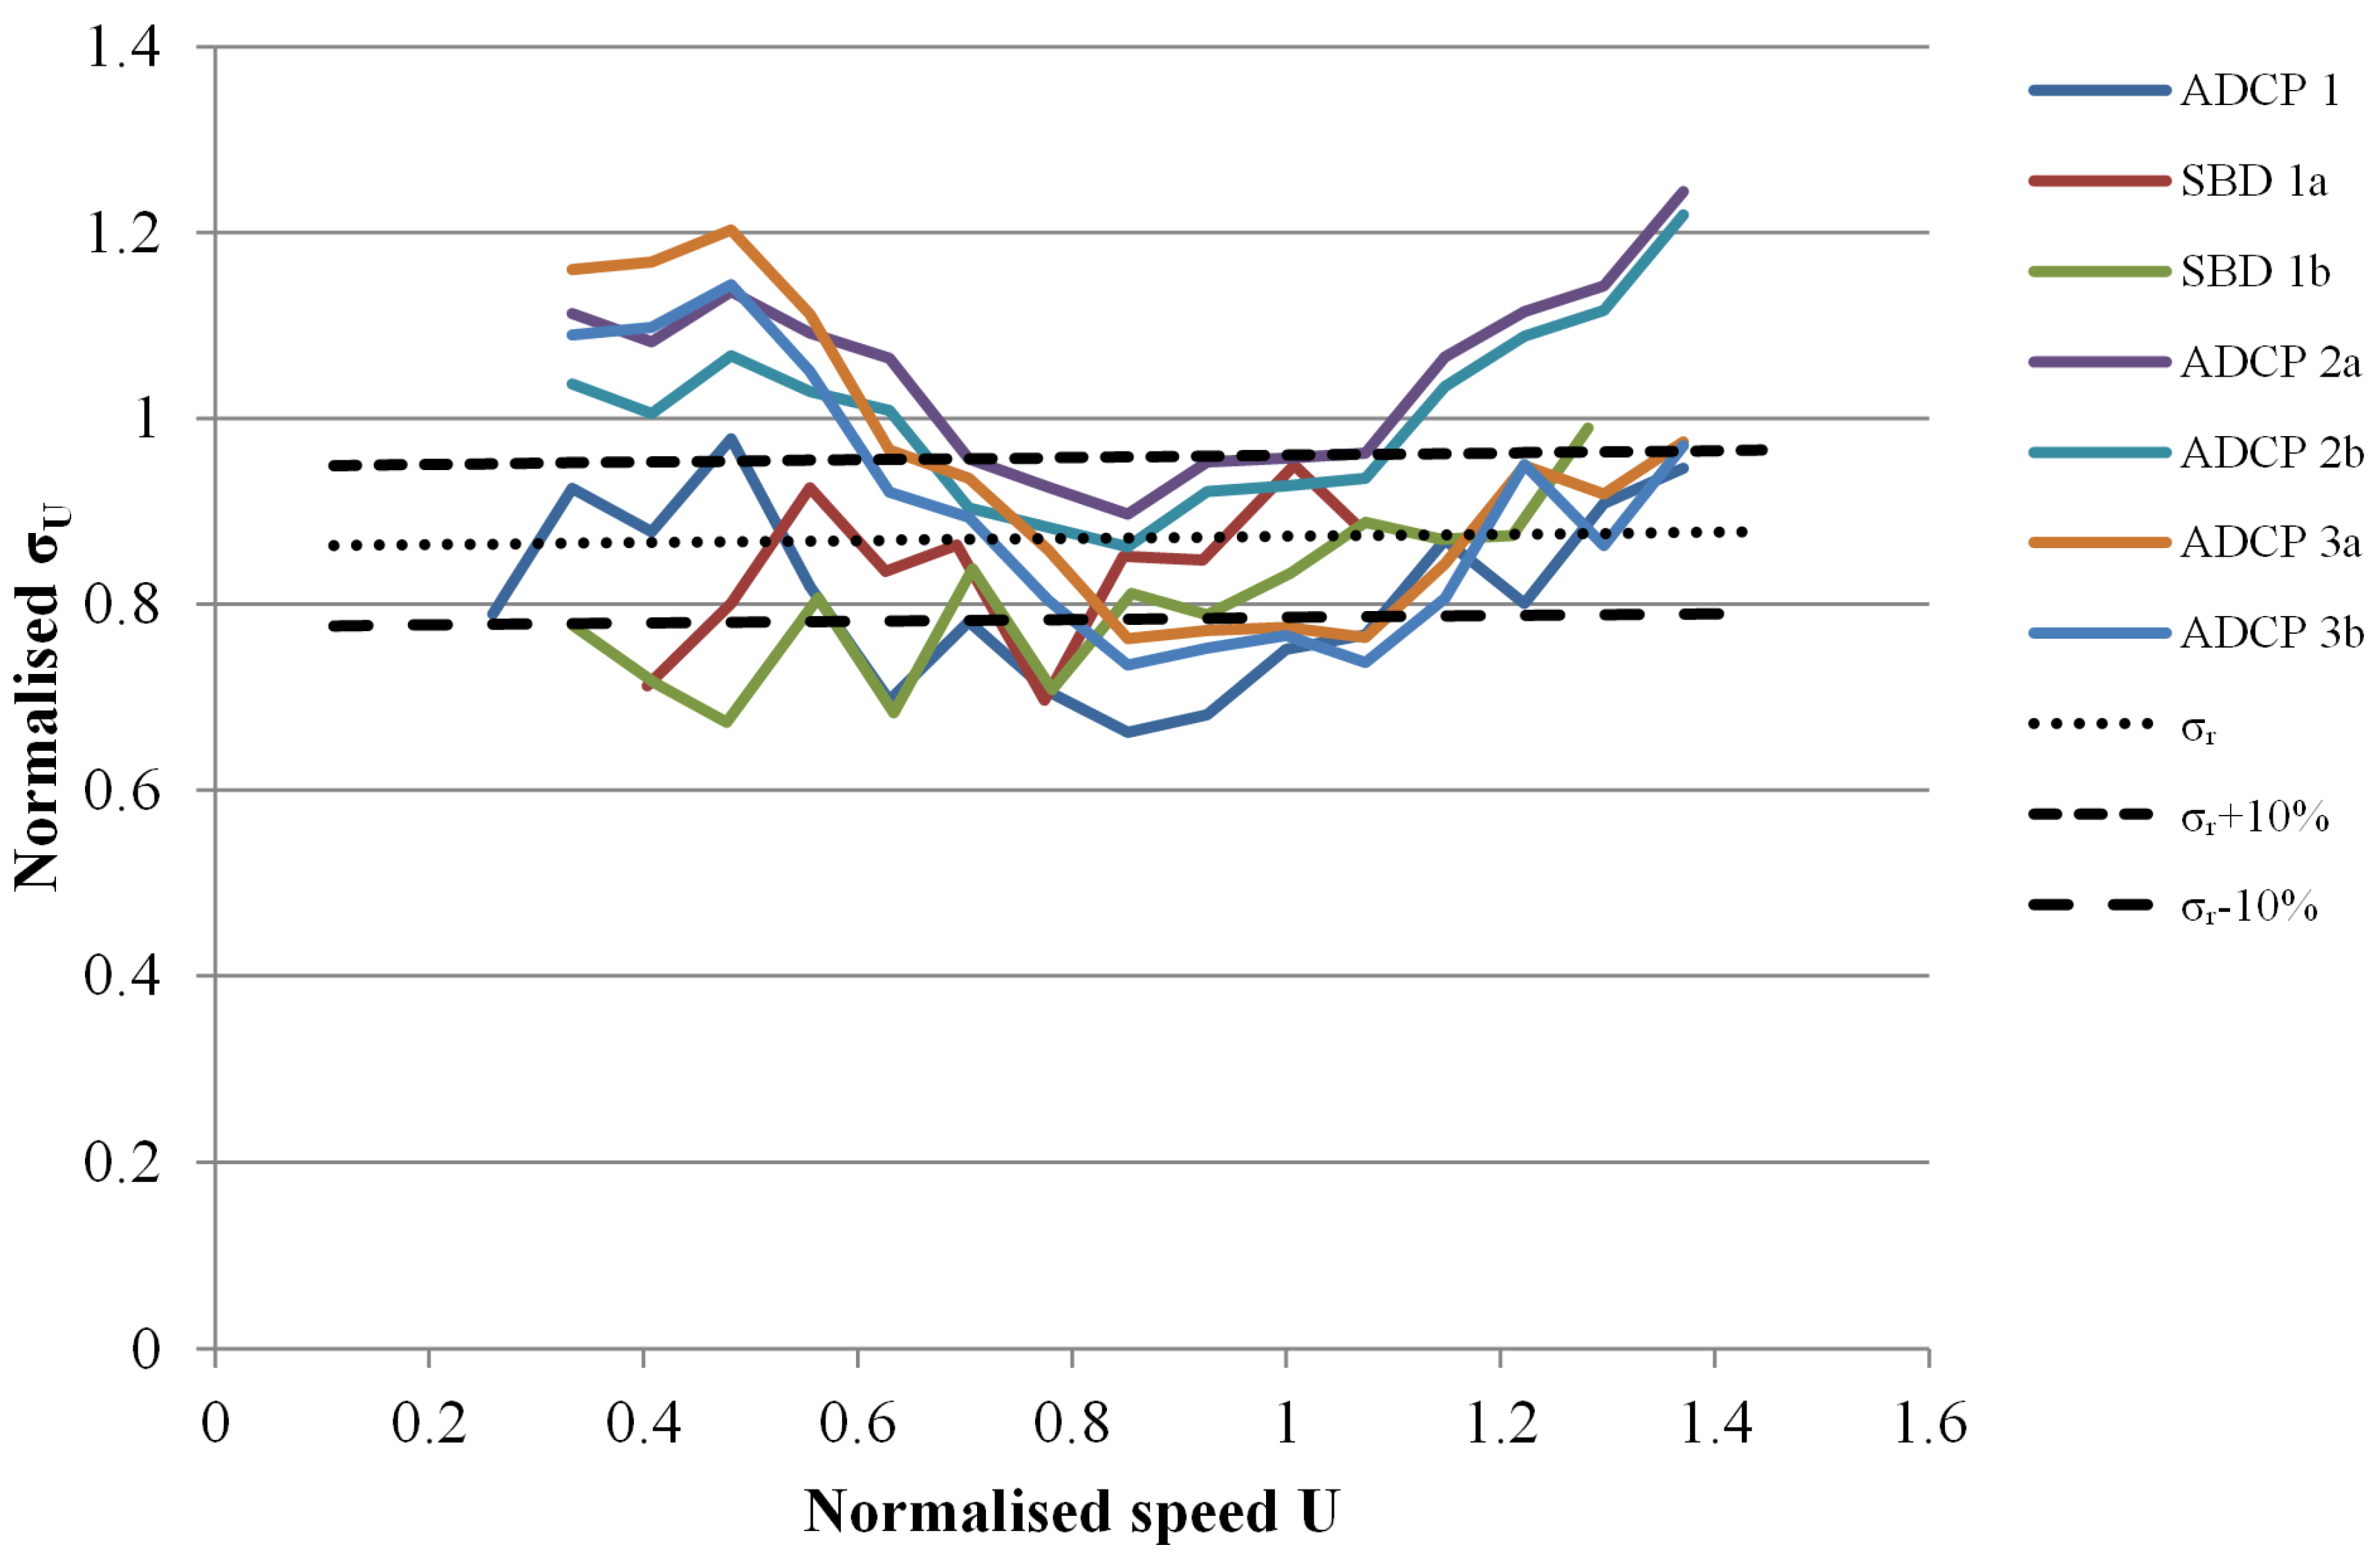
In
Figure 1 and
Figure 2, it can be seen the variation of characteristic turbulence
. The data presented were obtained from various instruments, deployments and post processing methods as part of the ReDAPT project. The characteristic turbulence was calculated as the 90% quantile assuming a normal distribution of the turbulence:
where
is the expected value and
is the standard deviation of the turbulence intensity.
The series in the figures correspond to measurements with the different instruments, Acoustic Doppler Current Profiler (ADCP) and Single Beam Doppler (SBD), available in ReDAPT from [
6,
7] and refer to bottom and turbine mounted instruments and surveys made at different dates. Reference turbulence
has been introduced in the figures to help in the comparison; defined in Equation (2),
has the shape of the normal turbulence model in [
8] (used for definition of wind turbulence in power production conditions) and was fitted to the average of the readings by calibrating the values of
and
. Values have been normalized to
at a usual rated speed value.
where
= reference turbulence in m/s,
= expected value of hub-height turbulence intensity at a 10 min average current of the reference rated speed
, and
= offset in m/s. Calibrated values of
and
can be seen in
Table 1.
As can be seen in
Figure 1, the function has an acceptable fit to flood turbulence. The ebb flow on the other hand, as shown in
Figure 2, does not quite follow the same shape. This difference in the shape of turbulence intensity was firstly reported in [
9].
Nevertheless, for the less unique case of flood direction in
Figure 2, measurements seem to be within ± 10% of
.
Integral length scales are used to define the turbulence structure through the so-called turbulence spectra function. The turbulence spectra functions like von Karman or Kaimal used for tidal turbines have been inherited from wind turbines; their adequacy, however, is still under discussion. It has been proposed to use a tidal specific model in the hydroelastic codes [
10] based on the measurements from [
4]. Nevertheless, a von Karman model is assumed for load calculations in ReDAPT [
11].
Length of Measurements and Instrumentation
It is in most cases necessary to have a long enough measurement period to calculate accurately the characteristic environmental parameters.
For the case of extreme wave height characterization, many years of data measurements may be necessary. For the 10-min mean current speed, a month of ADP readings and a harmonic analysis may suffice if the assumptions are correct. This analysis method does not take into account the effect of both positive and negative storm surges and the effect that they may have on the extreme current speed.
Unlike waves and mean current, quality in characterization of turbulence in current is limited by the measuring instrument rather than the length of the measurements.
2.2. Numerical Modelling
Numerical metocean models can be used to characterize a potential tidal energy site for resource assessment. These models are validated at a limited number of points in the domain for a limited period of time. The question is then if homogenous conditions could be assumed for the areas in between the validation points.
The European Marine Energy Centre (EMEC) test site, Fall of Warness, has been extensively modelled. Some results of these numerical metocean models have been published (see [
12,
13]). Both models show agreement in the general trends of the flow features, which gives confidence in the tool for the resource assessment phase. The model done under ReDAPT [
13] was validated in more flow features (like shear profiles, flow twist,
etc.) than [
12]. The extreme features of the flow and the full variation of the parameters modelled are, however, more difficult to reproduce as can be seen from the event reported in [
12].
3. Load Simulations
Load time series are usually simulated in Blade Element Momentum (BEM) theory hydroelastic codes like Tidal Bladed [
14] for the more usual turbine designs. These codes are inherited from the wind turbines, where they have been used for many years. One of the objectives of ReDAPT was the validation of this software using data from the tested HATT prototypes at EMEC. Initial results of the validation against the 500 kW machine can be seen in [
11] and results of the validation against the 1 MW machine in [
15]. This experience proves that simulating the loading (current and wave) on a tidal turbine using the Veers method and assuming linear superposition of the current turbulence, assuming Taylor’s “frozen” turbulence hypothesis, von Karman spectral shape with site specific derived length scales via various ADCP and ADV measurements, and the wave orbital speeds, assuming linear theory of gravity waves, yields acceptable results when compared to actual strain gauge measurements on the prototype tidal turbine.
Site conditions and therefore environmental parameters are very important for the load calculations and ultimately the design. Some parameters are, however, more important than others depending on the type of load. In an exercise to define the relative relevance of each parameter in the design of the HATT, loads have been divided in extreme and fatigue, and further subdivided into power production and parked conditions. For simplicity, only the two specified operational conditions have been considered, disregarding all transient or transport conditions.
3.1. Extreme
Extreme loads are defined as the 50-year return period load to be considered in the Ultimate Limit State (ULS) in the design. Depending on the component and the control strategy of the HATT, extreme loads can occur together with extreme environmental conditions or near the turbine rated conditions.
3.1.1. Power Production
If a pitch controlled turbine with cut-in and cut-out current speed and wave-out is considered, then the remaining major contribution to loading uncertainty comes from the turbulence. On the other hand, attention must be paid to the control and safety system and its detection system of the turbine cut-in, cut-out and wave-out conditions and the uncertainty that the turbine might be in power production outside these set boundaries.
Two cases representative of the major loads of the turbine are taken: the blade root flapwise (out-of-plane) bending moment, proportional to the thrust, and the blade root edgewise (in-plane) bending moment, proportional to the torque. It can be seen in [
11] and [
16] how, for a pitch controlled turbine, these loads are capped by the control system stabilizing or decreasing after rated speed.
Milne
et al. found in [
17] that the maximum blade root flapwise moment increased linearly to TI and that it was somewhat insensitive to the turbulence spectra formulation as well as to the integral length scales.
3.1.2. Parked
For the case of a HATT capable of idling or standing still by means of pitching the blades or applying the rotor brake, then it becomes somewhat similar to a static structure subject to the same loading uncertainties as regular offshore structures. In this case, the most important environmental parameters are likely to be the extreme 10-min mean current speed and waves.
3.2. Fatigue
Fatigue loads are defined as the most likely loads that the turbine will encounter through its design lifetime. These loads are considered in the Fatigue Limit State (FLS) during the design.
In the authors’ experience, fatigue loads represent a bigger problem than extreme loads for HATTs. An example of this is the steel tripod support structure and foundation designed for the TGL tidal turbine. A reason for this can be the limited knowledge in the characterization of turbulence and its relevance for fatigue loading.
3.2.1. Power Production
Collier
et al. found in [
11] that when dividing the load time series of a blade into stochastic and periodic components, the stochastic component contributed to 93% of the Damage Equivalent Load (DEL), compared to 77% in the simulated results. The stochastic loading is likely to come in its majority from the turbulence and this is not yet captured by the simulation tools. Furthermore, Milne
et al. found in [
17] that the DEL increases linearly with the TI and that the influence of the turbulence spectra is not as influential in the DEL as the turbulence length scales.
Array and blockage effects in tidal farms are likely to result in an increased TI due to the ambience turbulence generated by the turbines themselves.
3.2.2. Parked
Similarly to the extreme conditions, the structure is likely to be mostly subject to wave loading and current turbulence in the form of Vortex Induced Vibration (VIV).
Effects like wave-current interaction may have relevance, at the moment these are considered in terms of a Doppler shift in the wave period making the waves steeper and more frequent for the case of current opposed to the waves and vice versa for the case of waves following the current.
4. Uncertainties in the Calibration of the Partial Safety Factors
As described in
Section 1.1, the parameters subject to uncertainty in the calibration of the partial safety factors are modelled as stochastic variables.
For the general case of the load
vs. resistance limit, state equation for ultimate limit state
a minimum of four variables can be identified representing:
- (a)
R, Resistance: physical uncertainty of the resistance part of the equation.
- (b)
XR, Resistance model: epistemic uncertainty of the resistance part of the equation.
- (c)
L, Load: physical uncertainty of the load part of the equation.
- (d)
XL, Load model: epistemic uncertainty of the load part of the equation.
Examples of stochastic variables in a calibration exercise can be found in [
16,
18,
19,
20]. Because loading on tidal turbines consists of: (a) rotational sampling, consisting of the combination of current and waves experienced by a rotating point on the rotor and resulting from spatial variation of the turbulence and wave particle velocity over the swept area of the rotating turbine, will influence the cyclic loading and (b) hydrodynamic loads in the support structure consisting of the viscous drag and inertia due to current and waves. It is unpractical to separate turbine from support structure for simulation to assess loads separately and hence, it is difficult to assess accurately the values of these stochastic variables.
This paper will focus on the parameters on the loading side of the limit state equation. It is not foreseen that HATTs will use different materials with different failure mechanisms that the wind industry or the offshore oil and gas industry has not examined before. The resistance part of the equation therefore uses the same stochastic variables normally used in the calibration of partial safety factors for the industries mentioned above.
From the relative importance that the turbulence has on both extreme and fatigue loads and the limited understating that exists on the estimation of this parameter it seems necessary to pay extra attention to this parameter in the limit state formulation. This is usually done with the use of a stochastic variable.
The following tables summarize the stochastic variables representing the epistemic uncertainties in the form of a distribution, e.g., normal (N), log-normal (LN) or Gumbel (G), with a Coefficient of Variation (COV) and a characteristic value on the load side of the limit state equation. There is not much literature addressing stochastic variables (except [
16]) relevant to tidal turbines and therefore the authors have chosen to look at the wind industry for inspiration. However, the authors acknowledge that current, especially tidal, does not follow the same process as wind and therefore expect that its COV is lower than that for wind. Tidal currents are mainly formed by astronomical forcing, which is, at the same time, limited in extremes and predictable.
It is worth noting that the first four rows of
Table 2 are inherited from civil engineering where the uncertainties due to wind loads on structures have been extensively investigated over the years.
Val
et al. [
16] use a simplified epistemic uncertainty, as it can be seen from
Table 3.
Tarp-Johansen [
19] uses various model uncertainties, see
Table 4.
As it can be seen, there is a wide range of variables to choose from. Nevertheless, a minimum of (a) model uncertainty; (b) site characterization uncertainty and (c) statistical uncertainty seems to be a reasonable option.
The following
Table 5 and
Table 6 summarize the stochastic variables representing the physical uncertainties on the load side of the limit state equation.
Johansen
et al. consider in [
18] a small stochastic variable representing the self-weight (permanent load) together with other stochastic variables representing the environmental loads.
The problem that is faced here is that the underlying distribution function of the load is not known. One can try to determine empirically the “tail” of the distribution by means of order statistics, as in [
21]. In general, the observed “tails” can be defined by extreme-value distributions. There are three types of extreme value distributions (see [
22]): type 1 and type 3 are of interest here as they represent upwards unbounded and bounded stochastic variables, respectively.
Extreme value analysis in metocean analysis commonly makes use of GEV, Generalized Pareto, Weibull, Gamma/Pearson, Log Pearson, Exponential and Gumbel distribution, as well as others. These are, in most cases, special cases of the three types of extreme-value distributions as a result of different linear functions of the stochastic variables that represent. As can be seen in the tables above, a Gumbel distribution is often used to model the extreme response from both aerodynamic and hydrodynamic loads with a COV in the range of 20%–32%.
The main load process in tidal turbines, rotor loading, comes from two different sources: the wave and current processes. Although the water particle velocities of these two processes are combined linearly, the loading process is non-linear. Additionally, the actuation loads due to the controller are very difficult to de-couple from the environmental/hydrodynamic loads. Load simulations therefore need to be done in an integrated approach.
The response of the structure will therefore be a combination of all the processes that contribute to the loading. The reliability of the structure, however, cannot be characterized by the extreme value distribution of each contributing process alone.
The authors have performed extreme value analysis of blade root bending moment of a tidal turbine and have found good agreement with both Gumbel and Weibull and COVs in the range of that observed for wind turbines. Both distributions can be easily used in probabilistic analyses for calibration of safety factors and are quite versatile. The authors may consider analysing other distributions in future investigations.
Another objective of ReDAPT was the preparation of a standard for certification of HATTs, which overall background philosophy for risk can be seen in [
23]. A type classification similar to the International Electrotechnical Commission wind turbine classes is proposed in [
24] that are in accordance with what has been discussed in the sections above. Finally, the partial safety factors in the standard are calibrated for HATTs. The calibration work can be seen in [
21,
25].
5. Conclusions
This paper presents the principal sources of uncertainty for the design of tidal turbines and hence, the uncertainties to be accounted for in the calibration of partial safety factors. The influence of measurements of environmental parameters in the design of HATTs is described.
A list of the most important environmental parameters influencing the design of HATTs and its relative relevance in the load types and operational conditions is given. An overview of the actual treatment from the measurement of those parameters to the actual load values to be taken into account in the design is given.
A practical example of the variability in measurements is given with turbulence values from the EMEC tidal test site. A turbine classification method similar to wind may be possible, but more data from different sites is necessary to prove that such model can be representative of different sites. In addition, the different classification types should be compatible with relevant economic parameters and, considering the early stage and diversity of technology, this will require sometime to mature. The importance of TI in DEL and extreme loads is given through examples from reference literature.
Finally, examples of values of the stochastic variables considered to represent the different uncertainties in partial safety factor calibration exercises from other standards and literature are shown.


