Article

Marine Microphytobenthic Assemblage Shift along a Natural Shallow-Water CO2 Gradient Subjected to Multiple Environmental Stressors

by
Vivienne R. Johnson
1,
Colin Brownlee
2,
Marco Milazzo
3 and
Jason M. Hall-Spencer
1,*
1
Marine Biology and Ecology Research Centre, School of Marine Science and Engineering, Plymouth University, Plymouth PL4 8AA, UK
2
The Marine Biological Association of the United Kingdom, Citadel Hill, Plymouth PL1 2PB, UK
3
Department of Earth and Marine Sciences, University of Palermo, I-90123 Palermo, Italy
*
Author to whom correspondence should be addressed.
J. Mar. Sci. Eng. 2015, 3(4), 1425-1447; https://doi.org/10.3390/jmse3041425
Submission received: 18 August 2015 / Revised: 14 October 2015 / Accepted: 18 November 2015 / Published: 1 December 2015
(This article belongs to the Special Issue Ocean Acidification and Marine Biodiversity)

Abstract

:
Predicting the effects of anthropogenic CO2 emissions on coastal ecosystems requires an understanding of the responses of algae, since these are a vital functional component of shallow-water habitats. We investigated microphytobenthic assemblages on rock and sandy habitats along a shallow subtidal pCO2 gradient near volcanic seeps in the Mediterranean Sea. Field studies of natural pCO2 gradients help us understand the likely effects of ocean acidification because entire communities are subjected to a realistic suite of environmental stressors such as over-fishing and coastal pollution. Temperature, total alkalinity, salinity, light levels and sediment properties were similar at our study sites. On sand and on rock, benthic diatom abundance and the photosynthetic standing crop of biofilms increased significantly with increasing pCO2. There were also marked shifts in diatom community composition as pCO2 levels increased. Cyanobacterial abundance was only elevated at extremely high levels of pCO2 (>1400 μatm). This is the first demonstration of the tolerance of natural marine benthic microalgae assemblages to elevated CO2 in an ecosystem subjected to multiple environmental stressors. Our observations indicate that Mediterranean coastal systems will alter as pCO2 levels continue to rise, with increased photosynthetic standing crop and taxonomic shifts in microalgal assemblages.

1. Introduction

The current rate of CO2 release into the atmosphere is driving geochemical changes in the ocean that are thought to be unparalleled in the last 300 million years [1]. Researchers around the world are now striving to find out how ongoing increases in surface seawater pCO2 and bicarbonate (HCO3) will affect photoautotrophs [2]. Most microalgae have evolved a carbon concentration mechanism (CCM) which increases the CO2 concentration at the active site of ribulose-1,5-bisphosphate carboxylase/oxygenase (RUBSICO) [3]. Down-regulation of CCM activity has been observed when microalgae have been grown in high CO2 conditions [4,5]. Due to the high metabolic costs of CCMs, it is thought that microalgae could benefit from CO2 enrichment since down regulation of the CCM may allow for optimized energy and resource allocation [4,5,6,7]. The responses of microalgae to ocean acidification caused by rising pCO2 levels could have wide-ranging ramifications for ocean health globally since they drive biogeochemical cycles and contribute significantly to global primary production [8]. However, ocean acidification is not proceeding in isolation; interactive effects of elevated CO2 with other changing environmental conditions such as temperature [9,10], light [11], nutrients [12], metal toxicity [13] and pollution (e.g., sewage, petroleum wastes, pesticides, agricultural run-off) [14] may occur, complicating the prediction of ecosystem responses to rising CO2 levels.
“Microphytobenthos” are assemblages of microalgae and photosynthetic bacteria that colonise benthic substrata. We decided to investigate assemblages living on rock and on sandy sediments at increasing levels of pCO2 since microphytobenthic assemblages contribute significantly to primary production in shallow coastal ecosystems, providing a key source of food and playing important roles in biogeochemical processes, as well as in invertebrate and macroalgal settlement [15,16]. Benthic microalgal biomass may be much higher in sediments than in the water column (particularly in muddy sediments) and provide a primary source of fixed carbon to marine food webs; at the sediment-water interface these assemblages also stabilise sediment and modify nutrient and oxygen flux [17].
Laboratory and field studies have indicated that macroalgal assemblages are likely to show profound shifts in taxonomic composition as CO2 levels rise this century due to alterations in the competitive outcomes between calcified and non-calcified species, and between those with and without-CCMs [18,19]. However no previous studies have addressed the effects of high CO2 on natural microphytobenthic assemblages; trials using artificial settlement substrata revealed dramatic alterations in the composition of bacterial and microalgal biofilm communities [20,21,22]. Despite the advantage of being highly standardised, the use of artificial substrata does not accurately represent natural communities [23]. Sampling communities that have colonised natural surfaces along CO2 gradients may provide more realistic insights into the effects of ocean acidification than studies that used artificial substrata [24]. A recent investigation of natural marine sediment bacterial communities documented increased bacterial diversity and a shift in community composition with increasing levels of pCO2 [25].
Here, sub-tidal epilithic biofilms and the microphytobenthos associated with sandy sediments (both epipelic and epipsammic components) were investigated along a coastal CO2 gradient in the Mediterranean Sea. Certain carbon dioxide seeps provide useful proxies for ocean acidification, revealing the structure of marine communities that are resilient to the long-term effects of elevated pCO2 [26,27]. In situ assessments of these communities provide an opportunity for investigating the effects of multiple environmental stressors on ecosystems because, in addition to CO2-enrichment, the ecological communities found here are subjected to the typical stressors of a coastal habitat in the Anthropocene, such as coastal pollution [28] and overfishing [29]. Elevated levels of metals mercury, cadmium and zinc have been located at many seep systems and although such areas are normally avoided in field studies of the effects of ocean acidification, they could be used to investigate the interactive effects of acidification and metal toxicity [30].
Since biofilm formation on hard substrata is a ubiquitous process in the marine environment, and much of the surface layer of sediments on continental shelves receive sufficient light to sustain primary production, these microbial habitats are important components of coastal and global carbon cycles. Benthic net community production has been estimated to occur over 33% of the global shelf area (based on the compensation irradiance for microphytobenthic community metabolism) and theupper limits of the global net and gross primary production of microphytobenthos have been reported at 2.7 × 10¹³ and 3.5 × 10¹⁴ moL C year−1, respectively [31]. The aim of this study was to investigate changes in microphytobenthic biomass and composition along a natural pCO2 gradient, subject to multiple coastal stressors (e.g., fishing, coastal pollution, heat waves), to better inform predictions of coastal ecosystem resilience to ocean acidification. We hypothesise that microphytobenthic photosynthetic standing crop will be enhanced in acidified areas due to an increase in inorganic carbon availability for photosynthesis.

2. Material and Methods

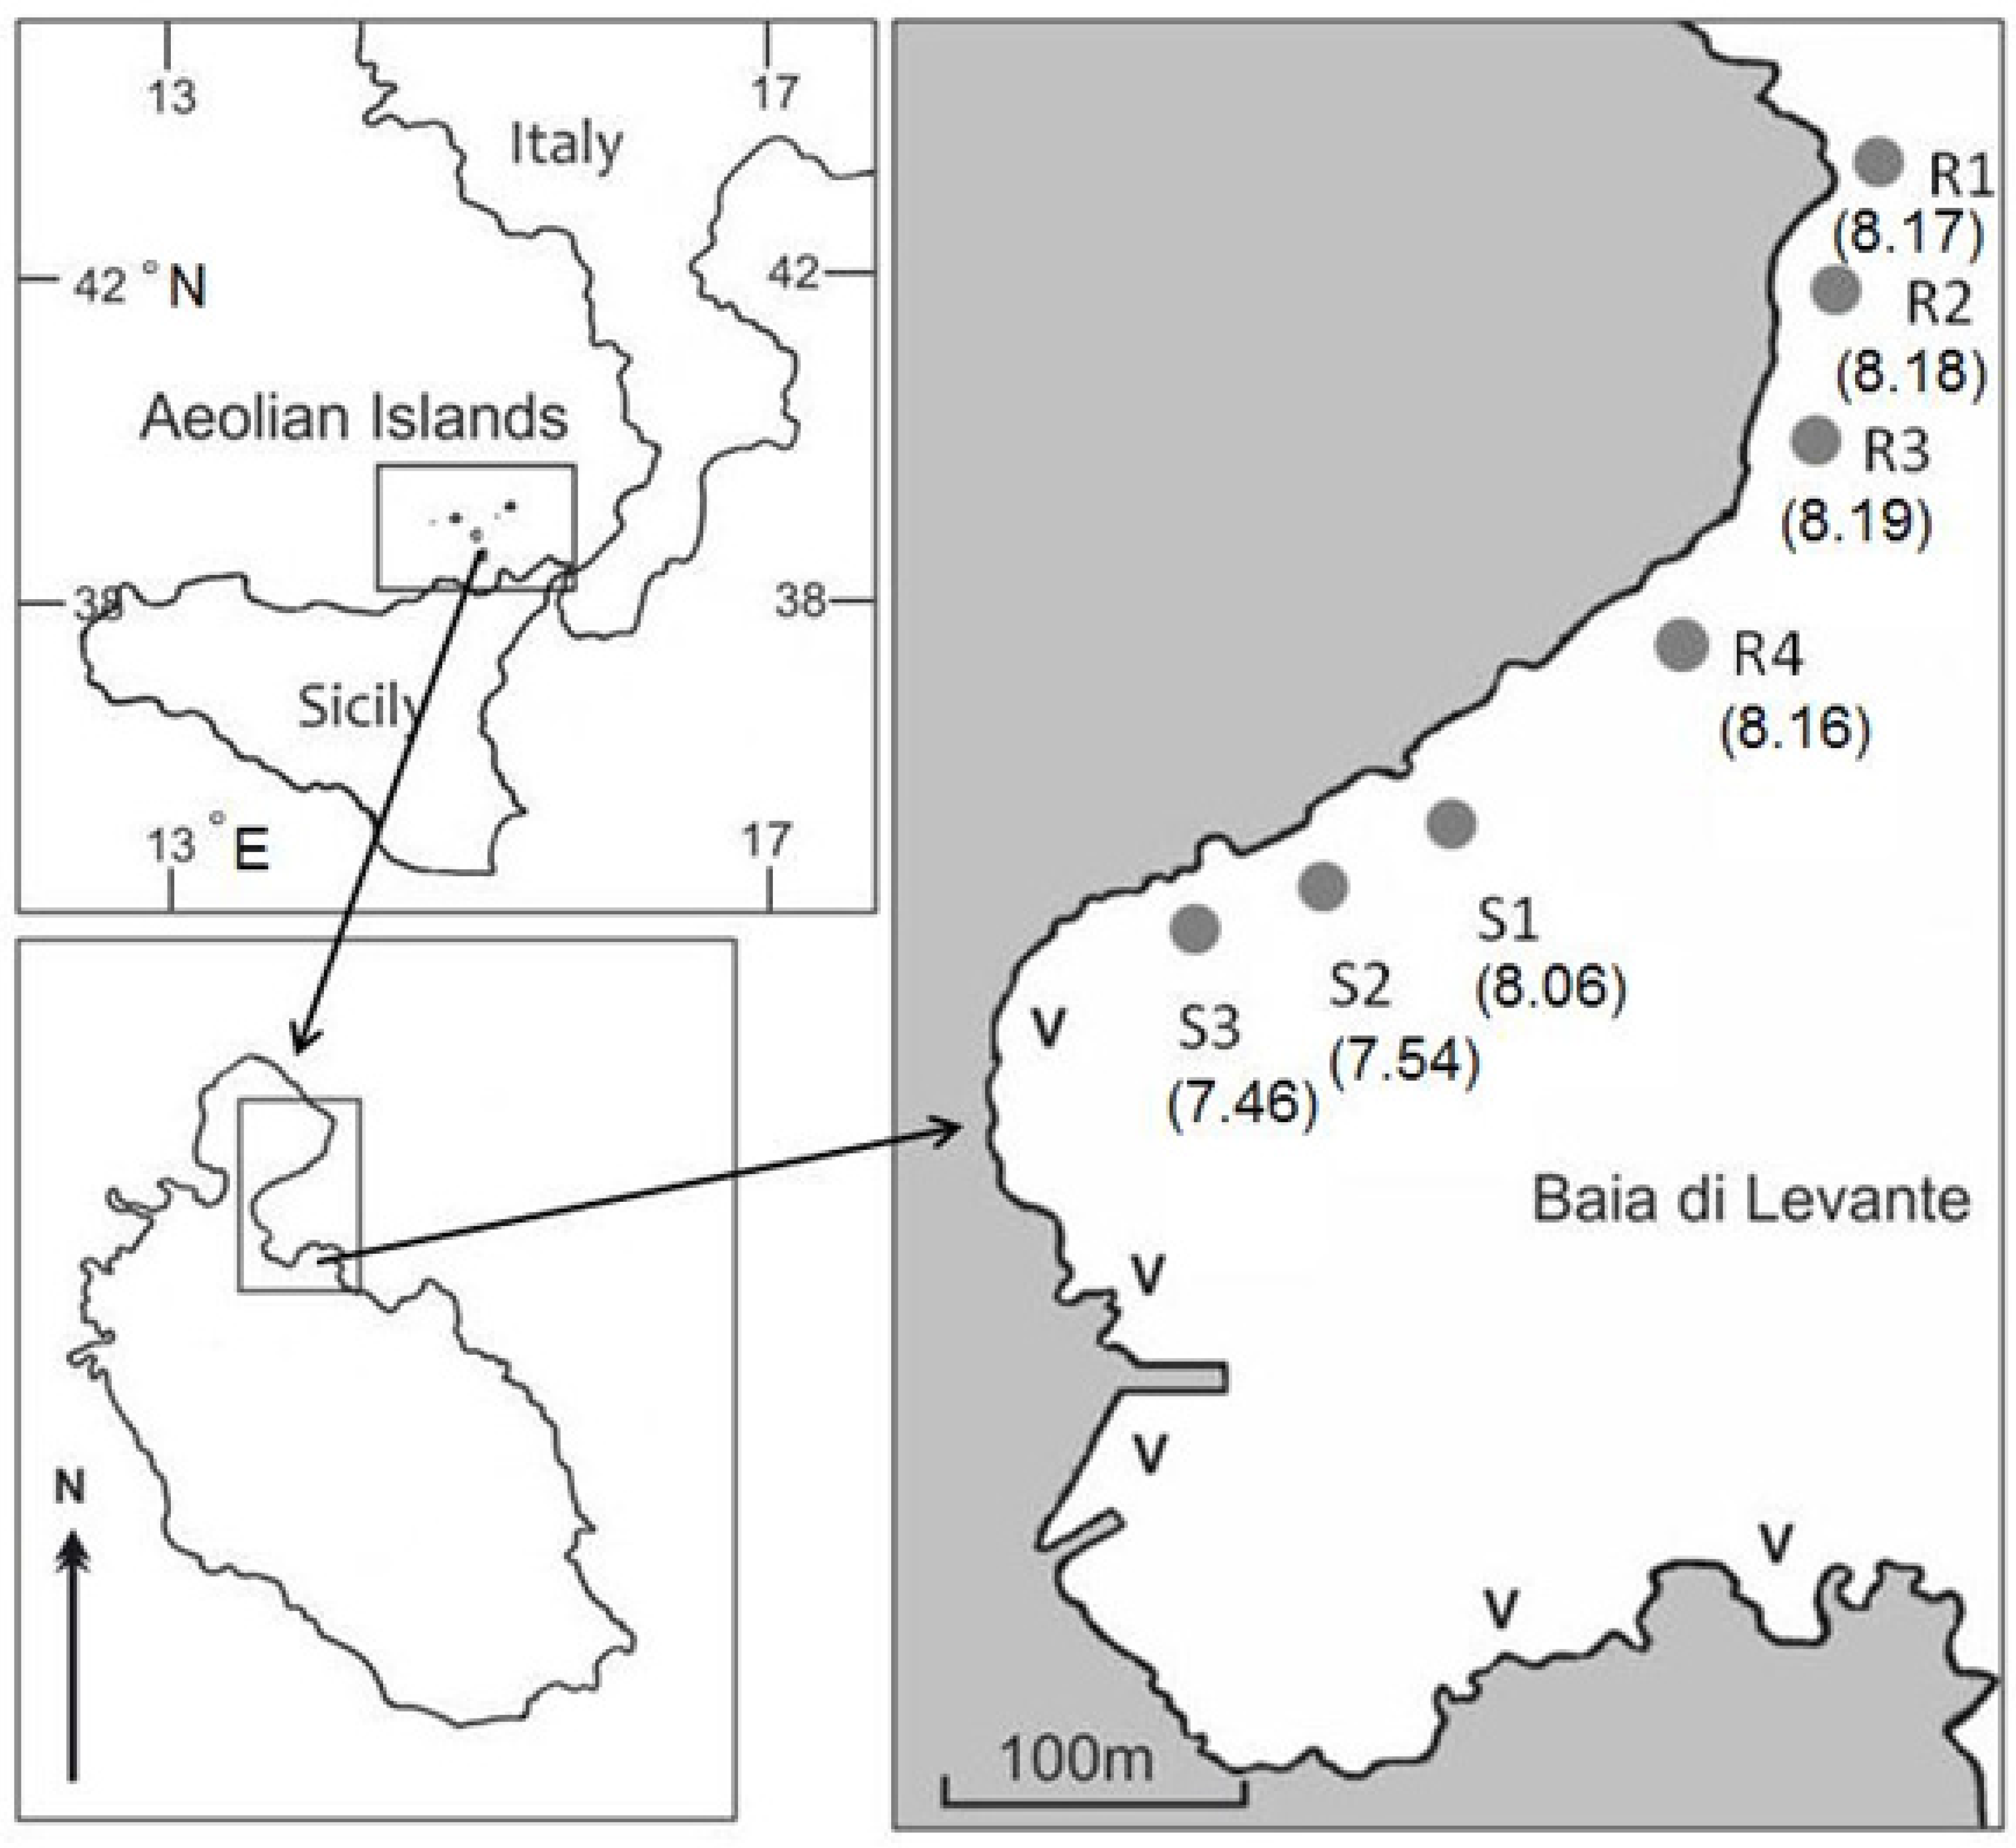
2.1. Study Site and Sampling Stations

Microphytobenthic assemblages were sampled along a rocky coast off Vulcano (38°25′ N, 14°57′ E, part of the Aeolian Island chain, NE Sicily, Figure 1). This is a microtidal region where volcanic CO2 seeps acidify the seawater producing a gradient ranging from ~pH 8.2 to ~pH 6.8, running parallel to the coast.
The carbonate chemistry of the gradient (at a depth of ~0.5 m) was monitored over a two year period (September–October 2009, April 2010, September–October 2010, May 2011 and September 2011–October, n = 22–27) using methods previously published [21,32]. In brief, a calibrated YSI (556 MPS) pH (NBS scale) meter was used to measure temperature, pH and salinity. Total Alkalinity was measured at each station, from a water sample that had been passed through a 0.2-μm pore size filter (stored in the dark at 4 °C), using an AS-Alk 2 Total Alkalinity Titrator (Apollo SciTech Inc., Newark, GA, USA). The remaining parameters of the carbonate system were then calculated using CO2 SYS software [33].
Figure 1. Location of Baia di Levante (Vulcano Island, NE Sicily), showing sampling stations S1–S3 and R1–R4, V = CO2 seeps. Data in brackets show mean pH of each station (n = 22–27).
Jmse 03 01425 g001
Three reference stations were located outside the CO2 seep area with normal, relatively stable pH (R1 mean pH 8.17, 95% confidence intervals (CI) as percentage of the mean pH = 0.42%; R2 pH 8.18, CI = 0.32%; R3 pH 8.19, CI = 0.28%, n = 22–24) representative of present-day pCO2 conditions. Three stations with increasing proximity to the seeps were characterised by intermediate to low mean pH (S1 mean pH 8.06, CI = 0.59%; S2 pH 7.54, CI = 1.59%; S3 pH 7.46, CI = 2.03%, n = 24–27). An additional reference station was used to investigate sediment assemblages; this station also had normal, stable pH (R4 mean pH 8.16, CI = 0.32%, n = 22) with the same black volcanic sand as found throughout the bay, deposited by the last volcanic explosion on the island in 1888. The seven stations provided a gradient of increasing pCO2 (Table 1). Due to dynamic seep activity and advection of high CO2 water, the stations close to the CO2 seeps were characterised by high pH variability as similarly reported in other seep studies [34,35,36].
Table 1. Seawater pH, Total Alkalinity (±SE, n = 3) measurements and calculated pCO2 off Vulcano. Temperature (range 18.6–27.7 °C; April–October), pH (NBS scale) and salinity (n = 38) were measured on several occasions between September 2009 and September 2011.
StationpH (NBS Scale)TA mmol kg−1pCO2 (μatm)HCO3 mmol kg−1
max8.35 2412.206
R1med8.172.6823882.341
min8.06(±0.12)5132.405
max8.29 2742.177
R2med8.182.5913652.251
min8.08(±0.03)4712.311
max8.29 2722.165
R3med8.182.5793642.247
min8.10(±0.04)4462.288
max8.26 2952.189
R4med8.122.5824242.28
min8.08(±0.05)4702.307
max8.22 3552.401
S1med8.082.795102.499
min7.76(±0.08)11192.627
max8.10 4742.436
S2med7.712.74212442.601
min7.07(±0.07)56282.697
max8.24 3372.392
S3med7.662.79614282.662
min6.80(±0.12)10,7302.762
Temperature, total alkalinity, and salinity were relatively constant in the shallow subtidal region along this gradient [21] and geochemical monitoring of the bay has confirmed the suitability of the chosen stretch of coastline for ocean acidification studies, since H2S and other toxic volcanic compounds are undetectable in the water column [36]. There was no significant difference in midday light intensities between stations R2 (mean lux = 36,935 ± 3641, n = 13) and S3 (mean lux = 38,895 ± 4234, n = 13) [21]. Water samples for dissolved nutrient analysis (nitrite, nitrate, silicate and phosphate) were collected from stations S1–S3 and R1 (as a representative of all reference stations) at <1 m depth. Samples were collected in 60 mL Nalgene bottles which had been pre-rinsed three times with the sample whilst wearing nitrile-free gloves. Between 5 and 6 replicate samples were taken between May 25–26 2011 and frozen prior to colorimetric analysis on a multi-channel AutoAnalyser (Bran + Luebbe GmbH SPX Process Equipment, Norderstedt, Germany). At stations S1–S3 and R4, three replicate 100 g sediment samples were collected at a depth of ~1 m and air dried in May 2011. The sediment was analysed to determine grain size distribution, sediment sorting and skewness, sediment type and texture as described by Johnson [32].

2.2. In Situ Microphytobenthic Sampling

See Figure S1 for an overview of the experimental approach. Epilithic biofilms were sampled from large boulders at 0.5 m depth within 5 m × 3 m plots at stations R1–R3 and S1–S3 between September and October 2010. Samples were separated by a gap of least 30 cm and to reduce potentially confounding biological and physical effects, the samples were removed from central surfaces of relatively flat-topped rocks where macroflora and fauna were absent at the time of sampling.
For the majority of the analyses (except for chla and SEM analysis which were sampled from rock chippings), biofilm was sampled using a brush mounted in an acrylic cylinder. Once an adequate seal was created between the open end of the cylinder and a flat rock surface, the brush was twisted continuously for 2 min to dislodge biofilm material from a 7 cm2 area. The suspended material was then collected through an attached 60 mL syringe. To avoid cross sample contamination, the device was thoroughly rinsed between each use and a new brush head attached at each station.
Sediment cores (area = 56.7 cm2, depth = 3 cm) were taken at 0.5–1.5 m depth from 5 × 3 m plots at R4, S1 S2 and S3 in May 2011 (it was not possible to sample epipsammic and epipelic communities at sites R1–R3 due to the lack of sandy sediment at shallow depth (<1.5 m) comparable to S1–S3). For each set of analyses, ten cores were taken haphazardly with a gap of at least 30 cm between samples. To account for patchy distributions of the microphytobenthos, and to ensure sufficient material for each analysis, five sub-samples (area = 0.64 cm2, depth = 5 mm) from the surface of each core were pooled and treated as one sample.

2.3. Chlorophyll-a Extraction

The photosynthetic standing stock of epilithic biofilms was assessed by removing (by hammer and chisel) 30 rock chips (~2 cm × 2 cm) from the sampling plots. The photosynthetic standing stock of sand microphytobenthos was assessed from sediment cores (n = 10 per station). Rock chips and sediment samples were immediately frozen (–20 °C) on collection then stored at –80 °C until analysis (<2 weeks) to prevent chlorophyll degradation.
The surface area of the rock chips were measured from photographs using Image J software (v 1.43, National Institutes of Health, Bethesda, MD, USA) and the biofilm material was removed from the surface. Sediment samples were first lyophilised to remove water content (which can affect absorbance readings) and to improve the extraction efficiency [37]. Chlorophyll was extracted from the rock chip biofilm material and sediment samples using 100% hot ethanol, and the absorbance of each sample at 632, 649, 665, 969 and 750 nm was measured in a spectrophotometer (Cecil CE2011, Cecil Instruments Ltd., Cambridge, UK). Three replicate readings were taken at each absorbance to calculate an average value of chla for each sample. The total amount of chla was calculated using the quadrichroic equation of Ritchie [38] and expressed per unit surface area (μg cm−2) for the rock chips and per unit dry weight for the sediment (μg g−1).

2.4. Diatom Abundance

To determine diatom abundance within the biofilm samples (dislodged biofilm material suspended in 60 mL seawater) and sediment (pooled sediment samples in 20 mL seawater), the samples (n = 10) were first preserved with Lugol’s Iodine solution and stored in a cool, dark place until counting. Bottles containing the biofilm were shaken vigorously to break up clumps and re-suspend diatoms. The epipelic and epipsammic diatom components of the sediment samples were separated following the methods of Hickman and Round [39]. The non-attached epipelon were isolated by shaking the sample in filtered seawater and removing the supernatant, a process repeated five times. The epipsammic diatoms were removed from the sand grains by sonication, an optimum sonication period of 10 min was set to ensure sufficient diatom removal (~90%) with minimum cell damage [40]. After sonication the sample was gently shaken to re-suspend the diatoms which were then removed in the supernatant.
Diatom abundances were determined using a Sedgewick-Rafter plankton counting chamber [41]. A 1 mL aliquot from each sample was put into the counting chamber and were observed under 400× magnification using an inverted light microscope (Diaphot, Nikon, Japan). Diatoms were counted in grids across randomly selected columns in the chamber until approximately 100–200 diatoms had been counted. The number of diatoms per unit surface area (cm−2) was then calculated as follows:
Diatom cells/mL = diatoms counted × 1000 no. of observed grids
Diatom cell density (diatoms/c m −2 ) = diatoms/mL × storage volume surface area of benthos sampled
Three replicate counts were conducted to give an average diatom density for each sample.

2.5. Epi-Fluorescence Microscopy

A Biorad Radiance 2000 confocal laser scanning microscope (CLSM) was used to determine the abundance of cyanobacteria within epilithic biofilms. Cyanobacteria disperse their pigments throughout their cytoplasm (as opposed to diatoms where they are enclosed in plastids) thereby making epi-fluorescence a suitable technique for quantifying coverage of these microorganisms within a biofilm. In was not possible to use CLSM on the rock chips because the rugose microtopography made focusing difficult, limiting the accuracy of the technique. Instead, 60 mL samples of biofilm suspension (n = 10 per station) were filtered on to 0.2 μm cyclopore polycarbonate membranes (Whatman, GE Healthcare Life Sciences, Buckinghamshire, UK).
A CLSM was also used to determine the abundance of cyanobacteria within the sediment samples. Dead cells and empty diatom valves in the sediment (often the remains of previous epipelic and epipsammic assemblages and those of surrounding epiphytic and planktonic populations which settle on the bottom sediment after death) can lead to a significant source of error when estimating microphytobenthic populations under bright field light microscopy [42]. Therefore, as epifluorescence measurements discriminate against dead cells, diatom epifluorescence was also measured as a proxy for diatom abundance. This technique was not useful for examining the epipsammon, as the uneven microtopography of the sand grains made focusing difficult; therefore, only the epipelic component was analysed with this technique.
The filtered biofilm samples and pooled sediment samples were fixed in 2.5% glutaraldehyde (diluted with filtered seawater) for approximately 1 h in the dark. The filter papers containing the biofilm were then rinsed in distilled water and mounted on microscope slides. The epipelon was separated from the sediment by the process described above. The supernatant was filtered through 0.2 μm filter papers which were then mounted on microscope slides. All slides were stored at −20 °C (in the field <48 h) to ensure the chloroplasts retained their autofluorescence for examination at a later date [43]. When longer storage periods (<3 weeks) were required i.e., between processing of samples in the UK, storage took place at −80 °C [44]. The slides were viewed using a CLSM; excitation 488 nm; emission 570–590/70 and 660–700 nm. A total of 30 images were taken (×10 magnification) at random locations across the filter papers and the percentage cover of cyanobacteria fluorescence (and epipelic diatoms) was digitally quantified per image using Image J software. The mean percentage cover was then calculated for each sample from the 30 images.

2.6. SEM Analysis

The composition of the epilithic and epipelic diatom community was analysed by a scanning electron microscope (SEM). Five replicate rock chips (~2 cm × ~2 cm) were removed from stations R2, S1–S3 and six sediment samples were taken from R4, S1–S3. Only one reference station was sampled in this component of the study; however, since all reference stations exhibited similar physical and chemical seawater properties, selecting one representative reference station was sufficient for comparative purposes. All samples (the epipelic component was isolated as above, filtered onto filter papers and stored in a phosphate buffer solution) were fixed (2.5% glutaraldehyde, one hour), air dried and coated with gold prior to SEM observation. Between 200 and 400 cells were counted and identified to genus from randomly positioned images on the colonised areas of rock chips/filter papers. The relative composition of diatom genera was then averaged for each station. Diatoms that could not be accurately identified were assigned to numbered groups (e.g., unidentified pennate 1, 2, etc.).

2.7. Statistical Analysis

Differences in microphytobenthic assemblages between stations were tested using one-way ANOVA and multiple pairwise comparison post hoc tests (Tukey’s Test) were performed where differences were significant. Data that failed tests for normality (Shapiro-Wilk) and homogeneity (Levene Median test) were transformed (arc sin and ln) until assumptions were met. When transformations were unsuccessful, data were analysed by Kruskal-Wallis one way analysis of variance on ranks and multiple pairwise comparison post hoc tests (Dunn’s method). These statistical analyses were performed using SigmaPlot 11.0 (Systat Software, Inc., San Jose, CA, USA).
The abundances of diatom genera were used to calculate Shannon diversity (H′), Pielou’s evenness (E) and Simpsons index of dominance (D) for each rock chip/sediment sample from each station. The similarity of community assemblages across the epilithic biofilms (total n = 20) and sediment samples (total n = 24) was examined by hierarchical cluster analysis using IBM SPSS Statistics 18 (IBM Corp, NY, USA). Only genera representing over 1% abundance were included in this analysis including any of the numbered unidentified diatoms groups. Assemblages were clustered using a dissimilarity coefficient (squared Euclidian distance) and Ward’s method (minimum variance clustering).

3. Results

3.1. Dissolved Nutrient Concentrations and Sediment Properties

Phosphate concentrations remained at low, undetectable levels (<10 nmol L–1) and there were no significant differences in nitrate concentrations (ANOVA: F(3,20) = 1.827, p = 0.175). There were significant differences in nitrite (Kruskal-Wallis: H(3) = 8.327, p < 0.05) and silicate (Kruskal-Wallis: H(3) = 12.780, p < 0.05) concentrations along the CO2 gradient (Table 2); S3 had significantly higher nitrite and silicate concentrations than R1 (Dunn, p < 0.05), but there were no significant differences in these nutrients between the remaining stations (Dunn, p > 0.05). The sedimentary stations all comprised well-sorted coarse black volcanic sand.
Table 2. Mean (± SE; n = 5–6) dissolved nutrient concentrations along a CO2 gradient off Vulcano. Phosphate was below the detection limit of the AutoAnalyser (~10 nmol/L) at all stations.
StationNitrite (μM)Nitrate (μM)Silicate (μM)
R10.01 ± 0.0010.24 ± 0.053.43 ± 0.05
S10.01 ± 0.0050.13 ± 0.038.34 ± 2.73
S20.02 ± 0.0030.16 ± 0.0615.12 ± 2.45
S30.02 ± 0.0010.33 ± 0.119.39 ± 1.24
Figure 2. Chla concentration of epilithic biofilms and chla content of the microphytobenthos (MPB) in surface sediment sampled along a CO2 gradient off Vulcano, Italy (median = horizontal line, 25th and 75th percentiles = vertical boxes, 10th and 90th percentiles = whiskers and dots = min/max values, epilithic; n = 30 per station, sediment; n = 10 per station).
Jmse 03 01425 g002

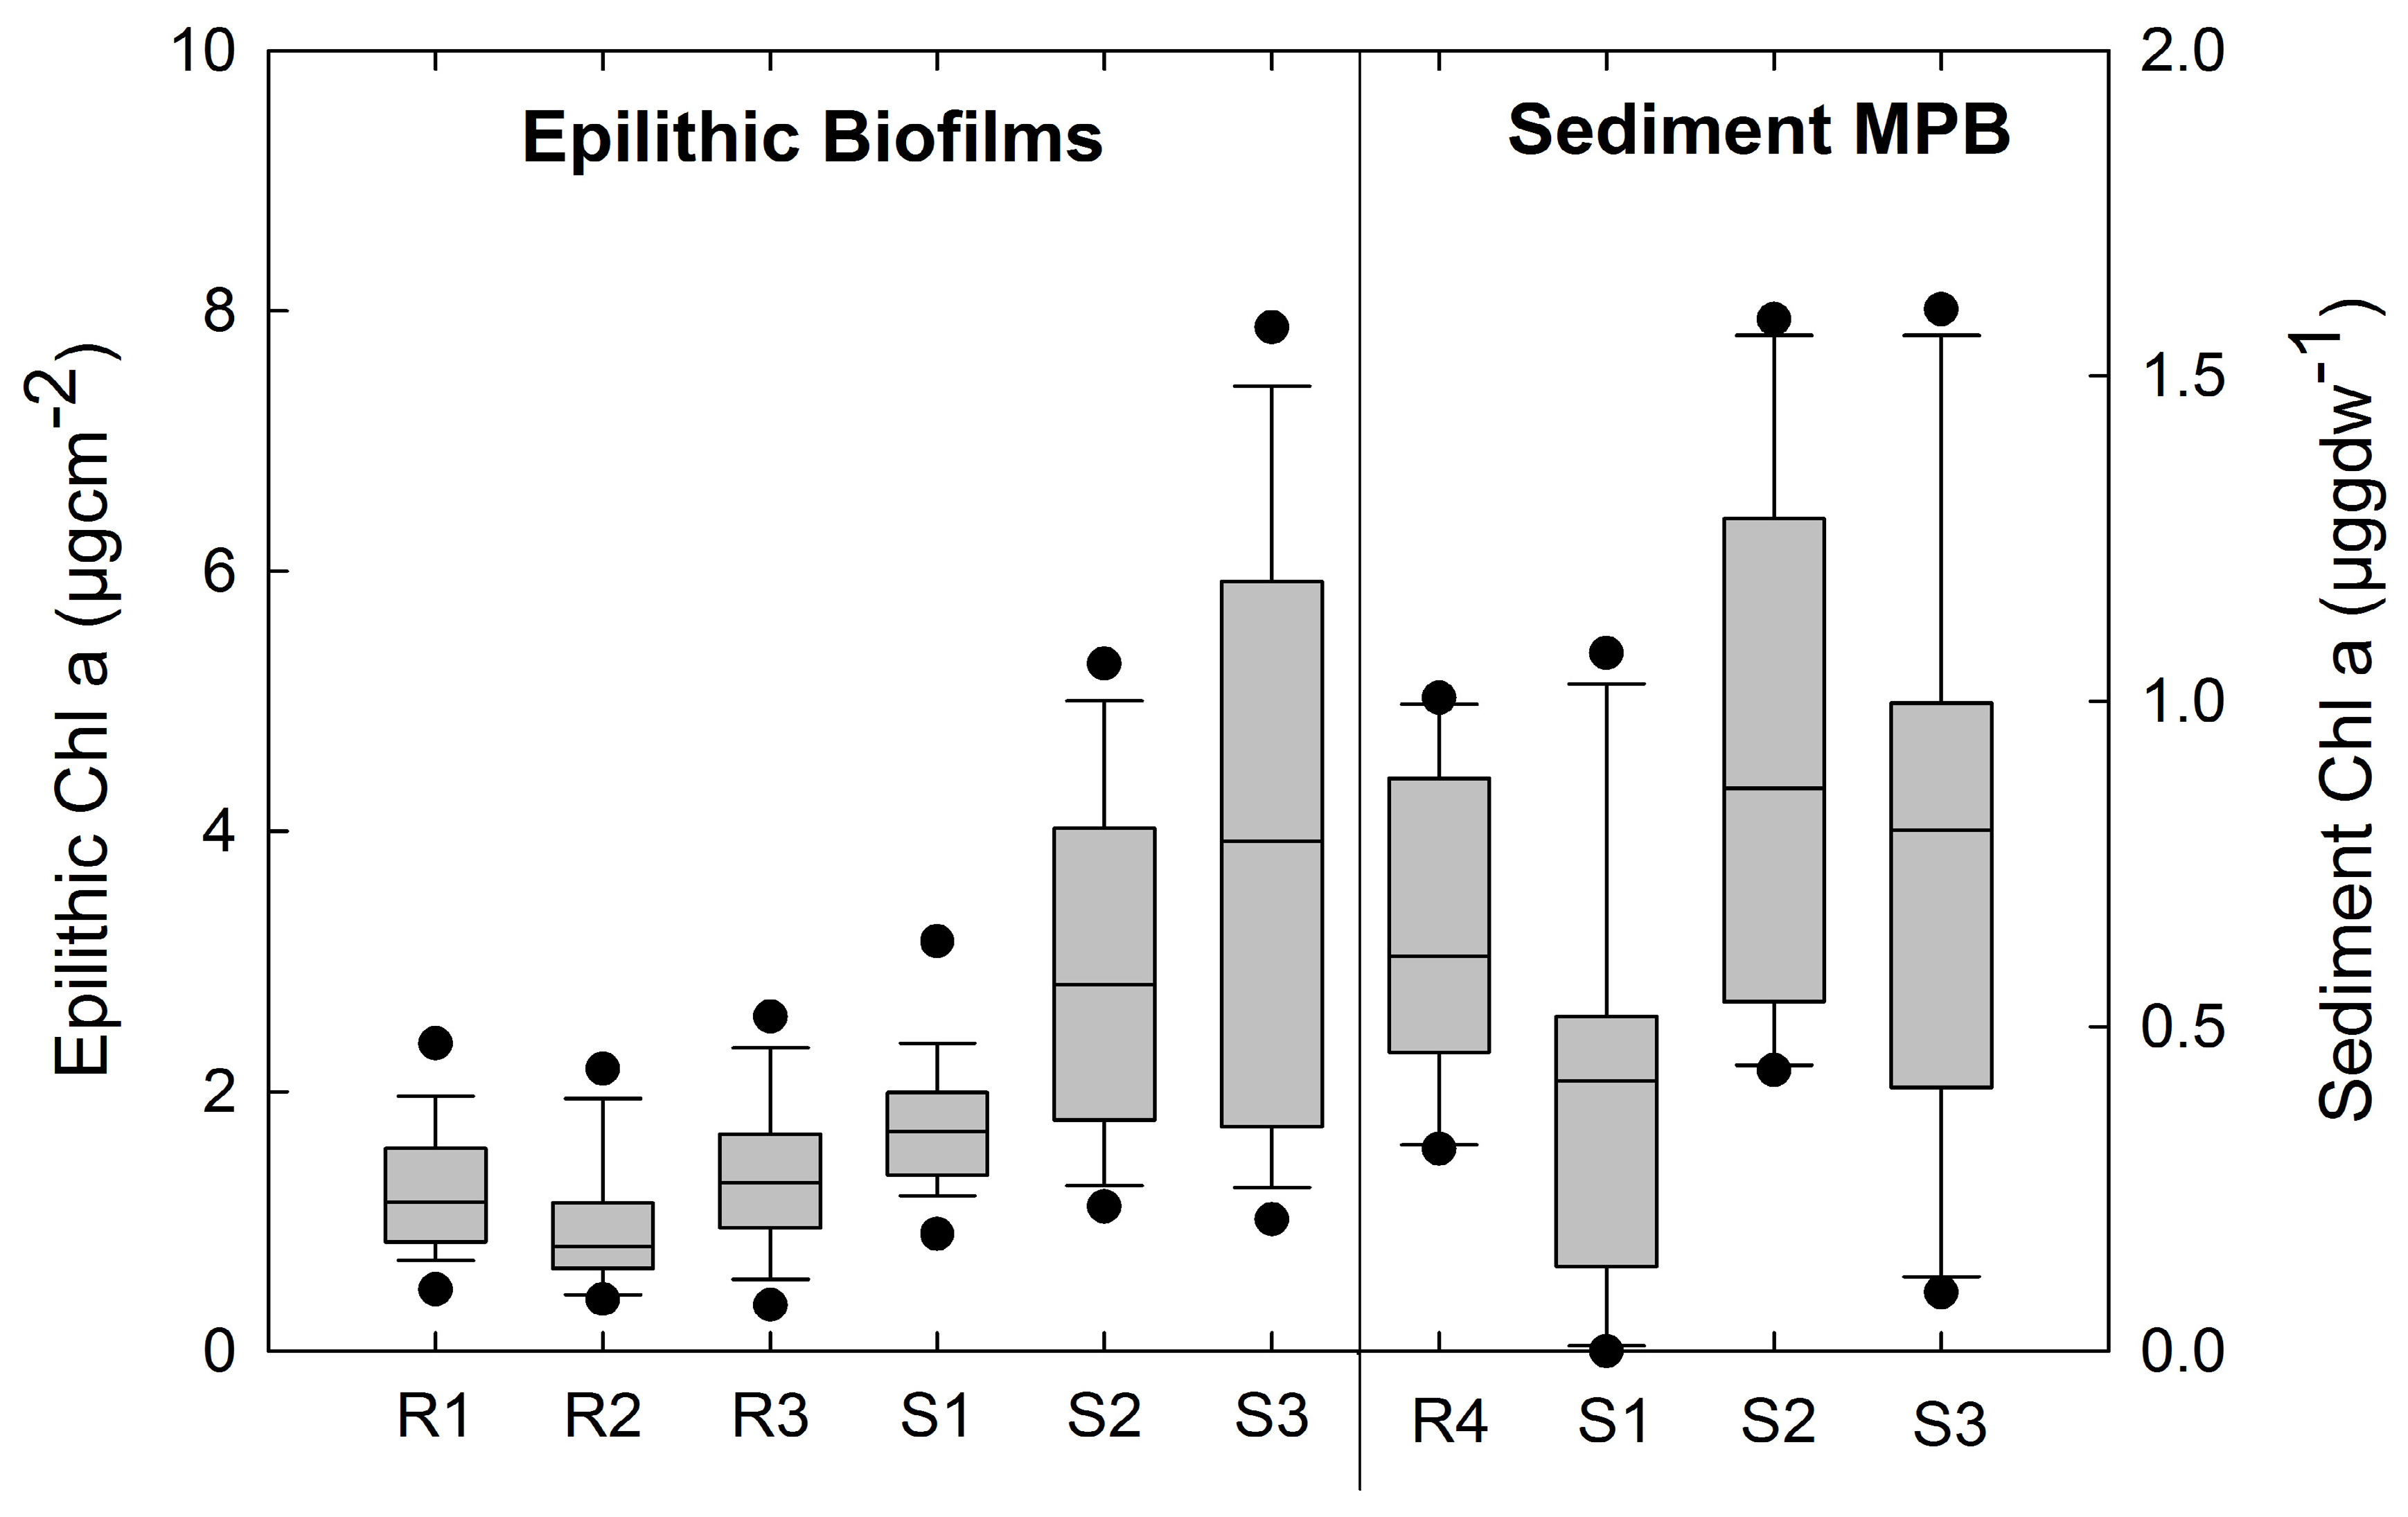
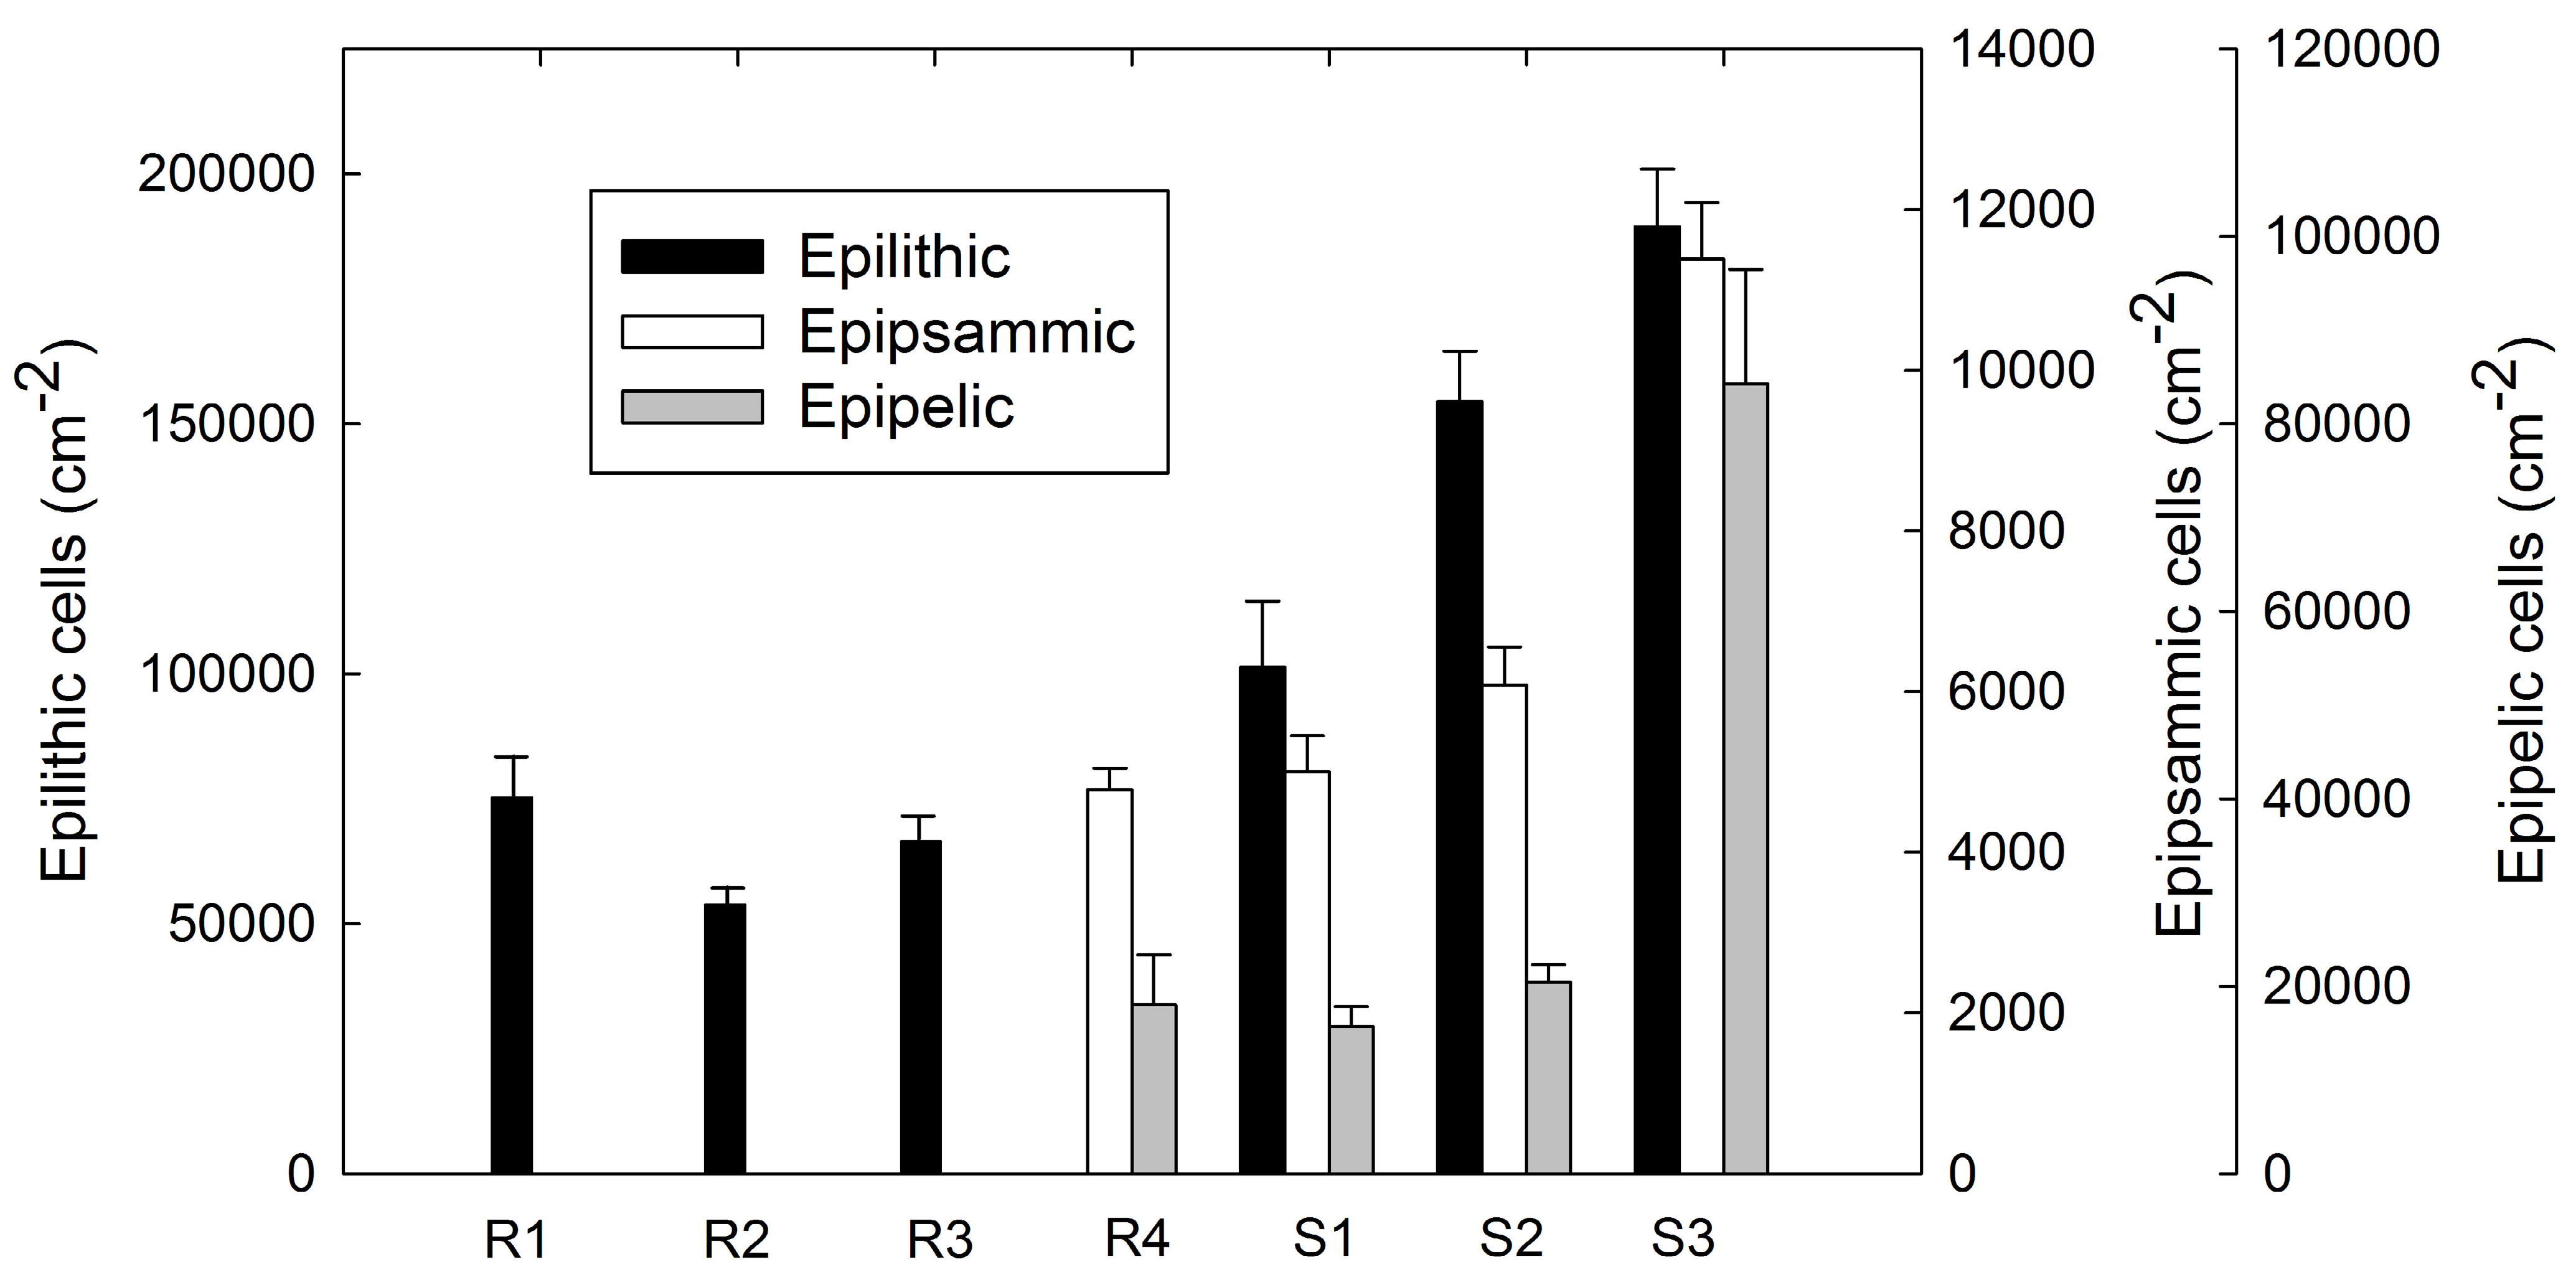
3.2. Photosynthetic Standing Crop (Chla)

Chla concentration altered significantly in both rocky (Kruskal-Wallis, H5 = 84.219, p < 0.001) and sedimentary habitats (ANOVA: F(3,36) = 3.908, p < 0.05) along the gradient of increasing pCO2 (Figure 2). The Chla concentration in epilithic biofilms was significantly greater (Dunn, p < 0.05) in the CO2 enriched stations S2 (mean Chla = 2.9 μgcm−2 ± SE 0.2, n = 10) and S3 (4.0 μg cm−2 ± SE 0.4, n = 10) compared to the reference stations R1 (1.3 μgcm−2 ± SE 0.1 n = 10), R2 (1.0 μgcm−2 ± SE 0.09 n = 10) and R3 (1.4 μgcm−2 ± SE 0.10, n = 10) which did not differ significantly from one another (Dunn, p > 0.05). On sand, the highest mean values of Chla were recorded in the CO2 enriched stations S2 and S3 (0.92 μg gdw−1 ± 0.13 and 0.76 μg gdw−1 ± 0.14, respectively). Post hoc pairwise comparisons however, revealed that Chla content only differed significantly between stations S1 and S2 (Tukey, p < 0.05).

3.3 Benthic Diatom Abundance

Diatoms increased significantly in abundance along the gradient of increasing CO2 (Figure 3) in epilithic (ANOVA, F(5,54) = 34.554, p < 0.001), epipsammic (ANOVA: F(3,36) = 36.187, p < 0.001) and epipelic assemblages (ANOVA: F(3,36) = 24.653, p < 0.001). There were three times as many epilithic diatoms at S3 (189,448 cells cm−2 ± SE 11,494) than at the reference stations where diatom abundances did not significantly differ from each other (Tukey p > 0.05; R1 = 65,437 cells cm−2 ± SE 5527 n = 10, R2 = 52,135 ± SE 4114 n = 10, R3 = 73,639 ± SE 7904 n = 10). The abundances of epipsammic and epipelic diatoms were also significantly greater at S3 (11,384 cells cm−2 ± SE 702 n = 10 and 84,247 cells cm−2 ± SE 12,233 n = 10, respectively) compared to the other stations (Tukey, p < 0.05) where diatom abundances were not statistically different from each other (Tukey, p > 0.05).
Figure 3. Mean diatom abundance (+SE) of epilithic, epipsammic and epipelic assemblages along a natural CO2 gradient (n = 10 per station).
Jmse 03 01425 g003

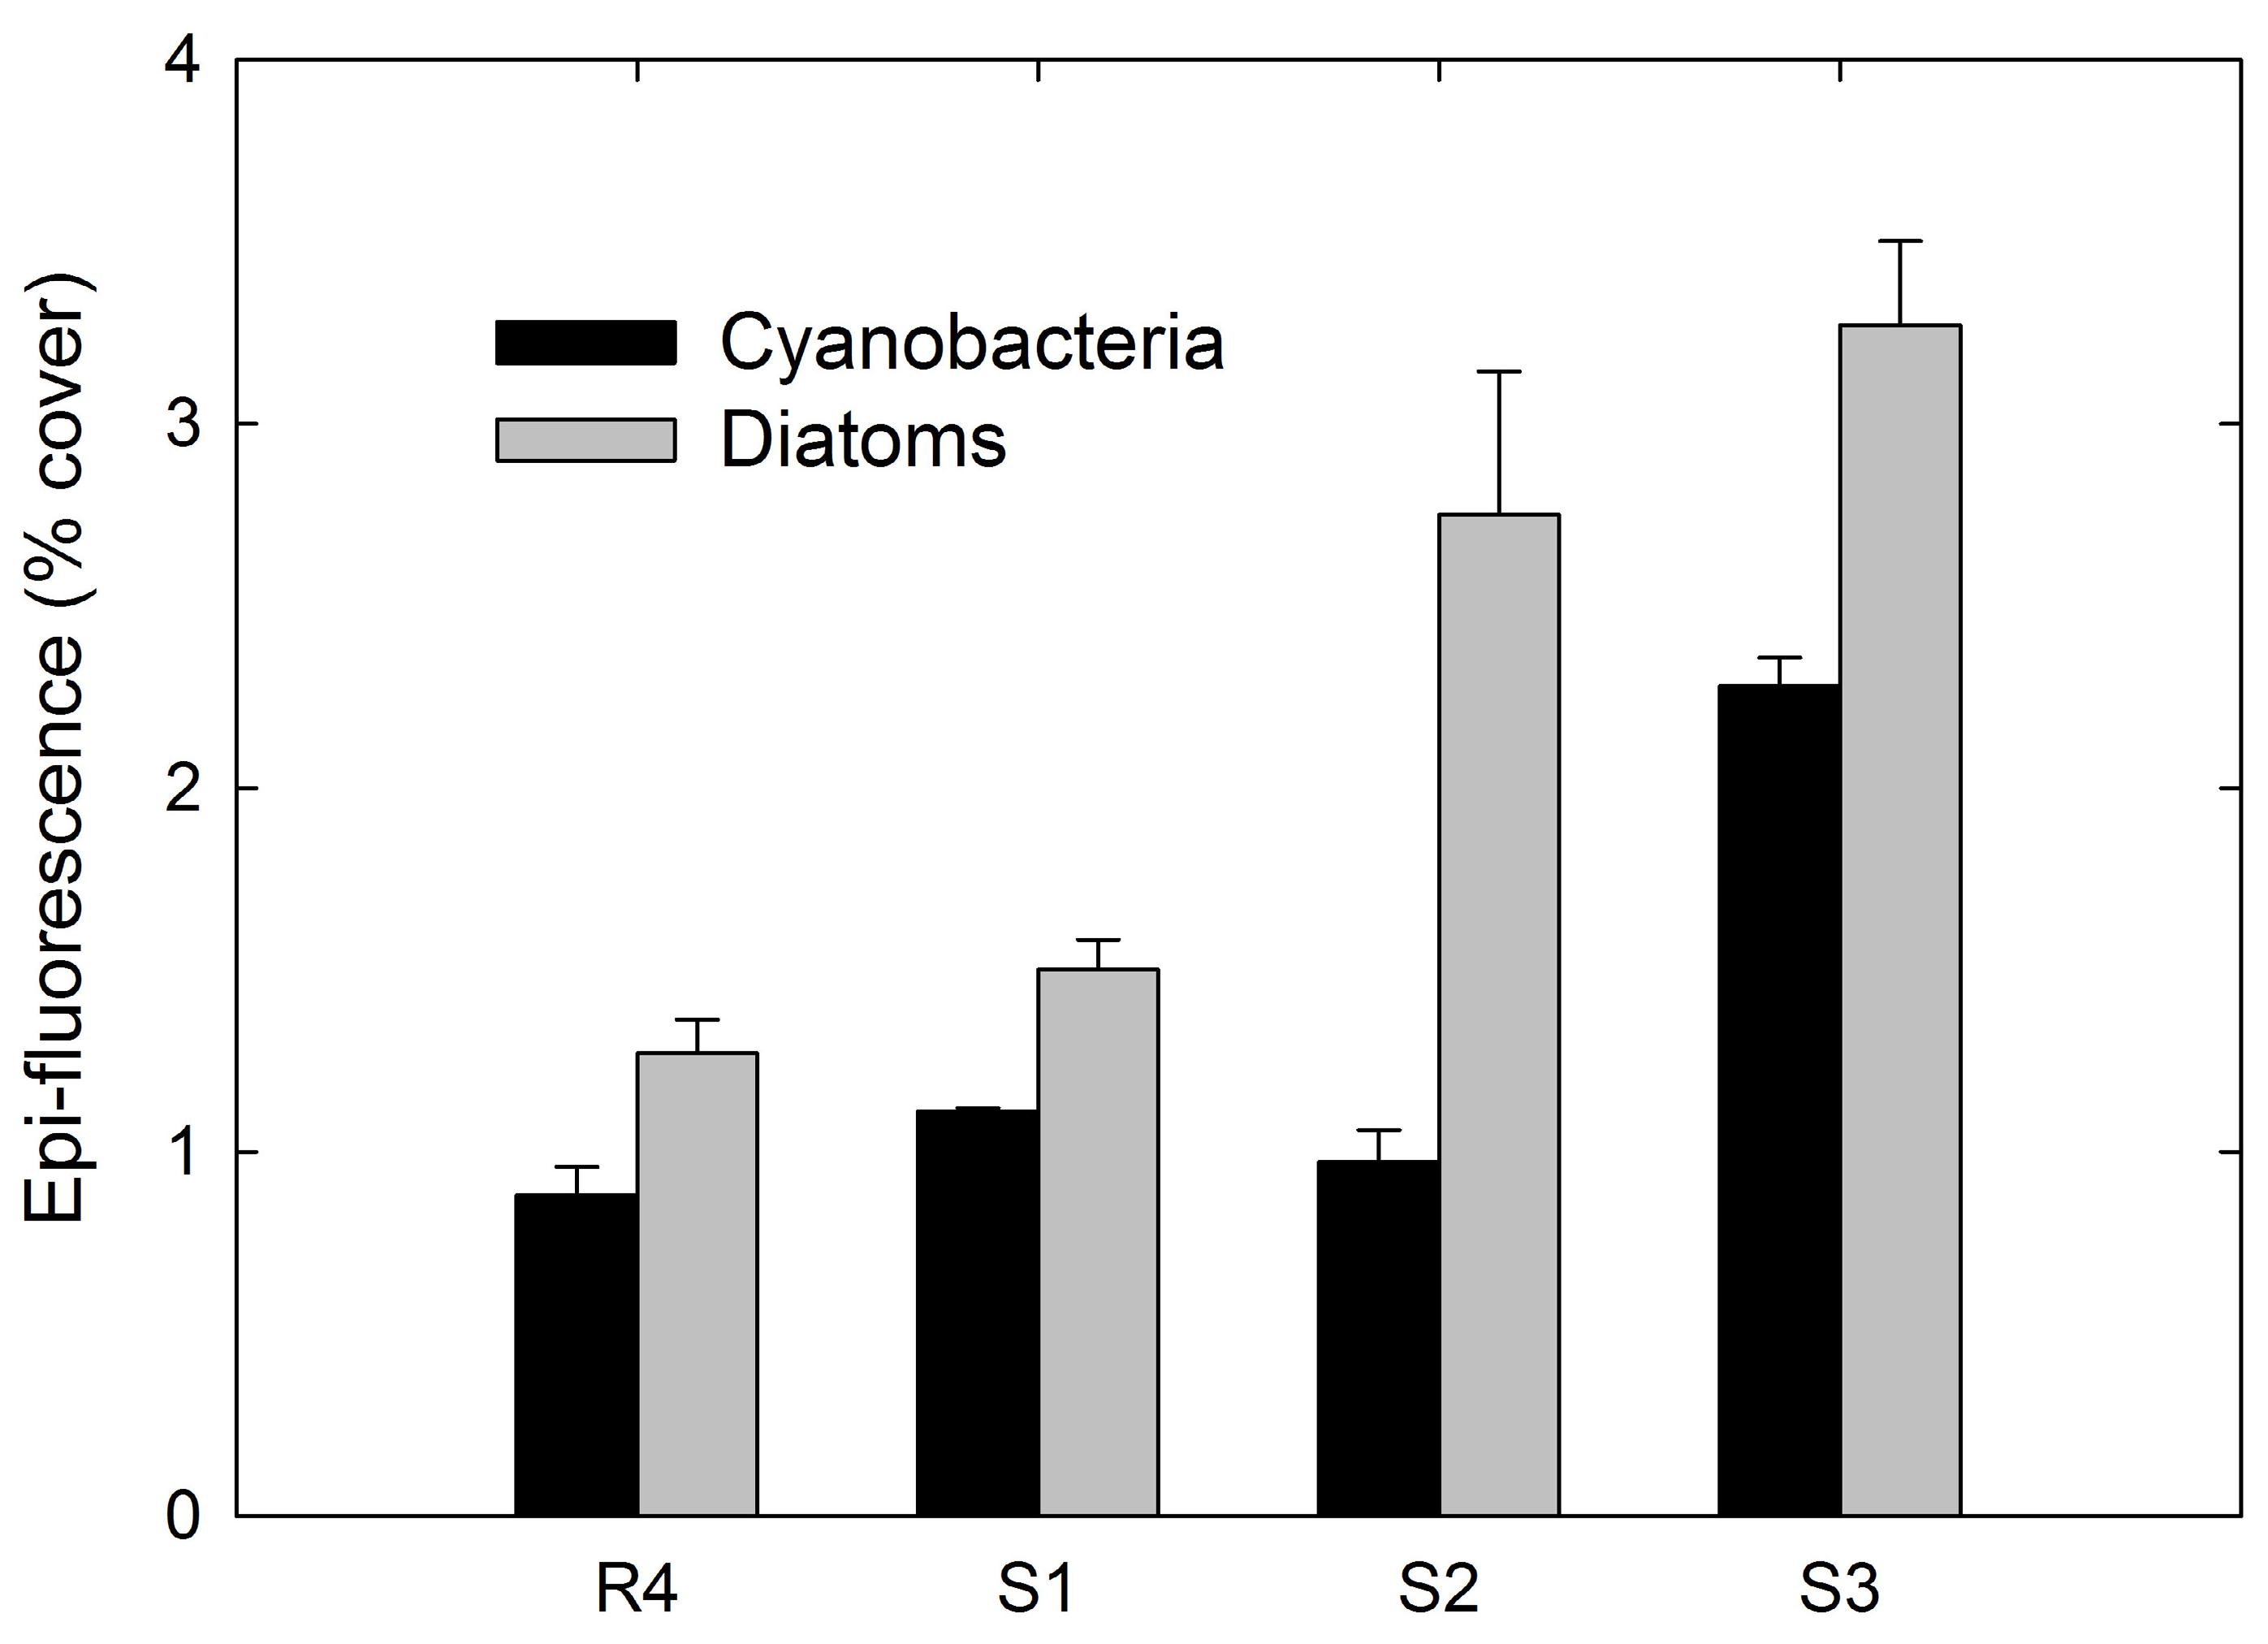
3.4. Epi-Fluorescence Analysis

Filamentous rhodophytes were ubiquitous in the biofilms sampled (Figure S2). Their photosynthetic pigments emit fluorescence at the same wavelength as cyanobacteria (~660 nm) so it was not possible to use this technique to accurately differentiate between the groups as both can occur in filamentous, branching forms. Therefore, areal coverage of phycobilin fluorescence was used to indicate changes in photosynthetic biomass along the CO2 gradient. There was a significant difference detected in the percentage cover of phycobilin related fluorescence within biofilms sampled along the gradient (ANOVA: F(5,54) = 9.09, p < 0.001), but there were no significant differences detected between R1, R2, R3, S1 and S2 (Tukey, p > 0.05). Only biofilm at S3 had a significantly higher cover of algae containing phycobilins (15.4% ± SE 1.8%, n = 10) than the remaining stations (Tukey, p < 0.001), the cover of which ranged between 6% and 9%.
Epipelic diatom epi-fluorescence also varied significantly between stations (Figures S3 and S4; ANOVA: F(3,36) = 25.065, p < 0.001). The percentage cover of diatom epi-fluorescence was significantly greater at stations S2 and S3 (2.7% ± SE 0.39% and 3.3% ± SE 0.23% respectively) than R4 (Tukey, p < 0.05). The cover of cyanobacteria epifluorescence (in this case there was an absence of the filamentous epilithic rhodophytes observed in biofilm samples) was significantly different along the CO2 gradient (Figure 4; ANOVA: F(3,36) = 52.936, p < 0.001). The cover at S3 (2.3% ± SE 0.08%) was significantly greater than at S1, S2 and R4 (Tukey, p < 0.05) which were all found to be statistically similar (Tukey, p > 0.05).
Figure 4. Mean (+SE) epi-fluorescence of epipelic diatoms and cyanobacteria sampled from the surface sediment at each station (n = 10).
Jmse 03 01425 g004

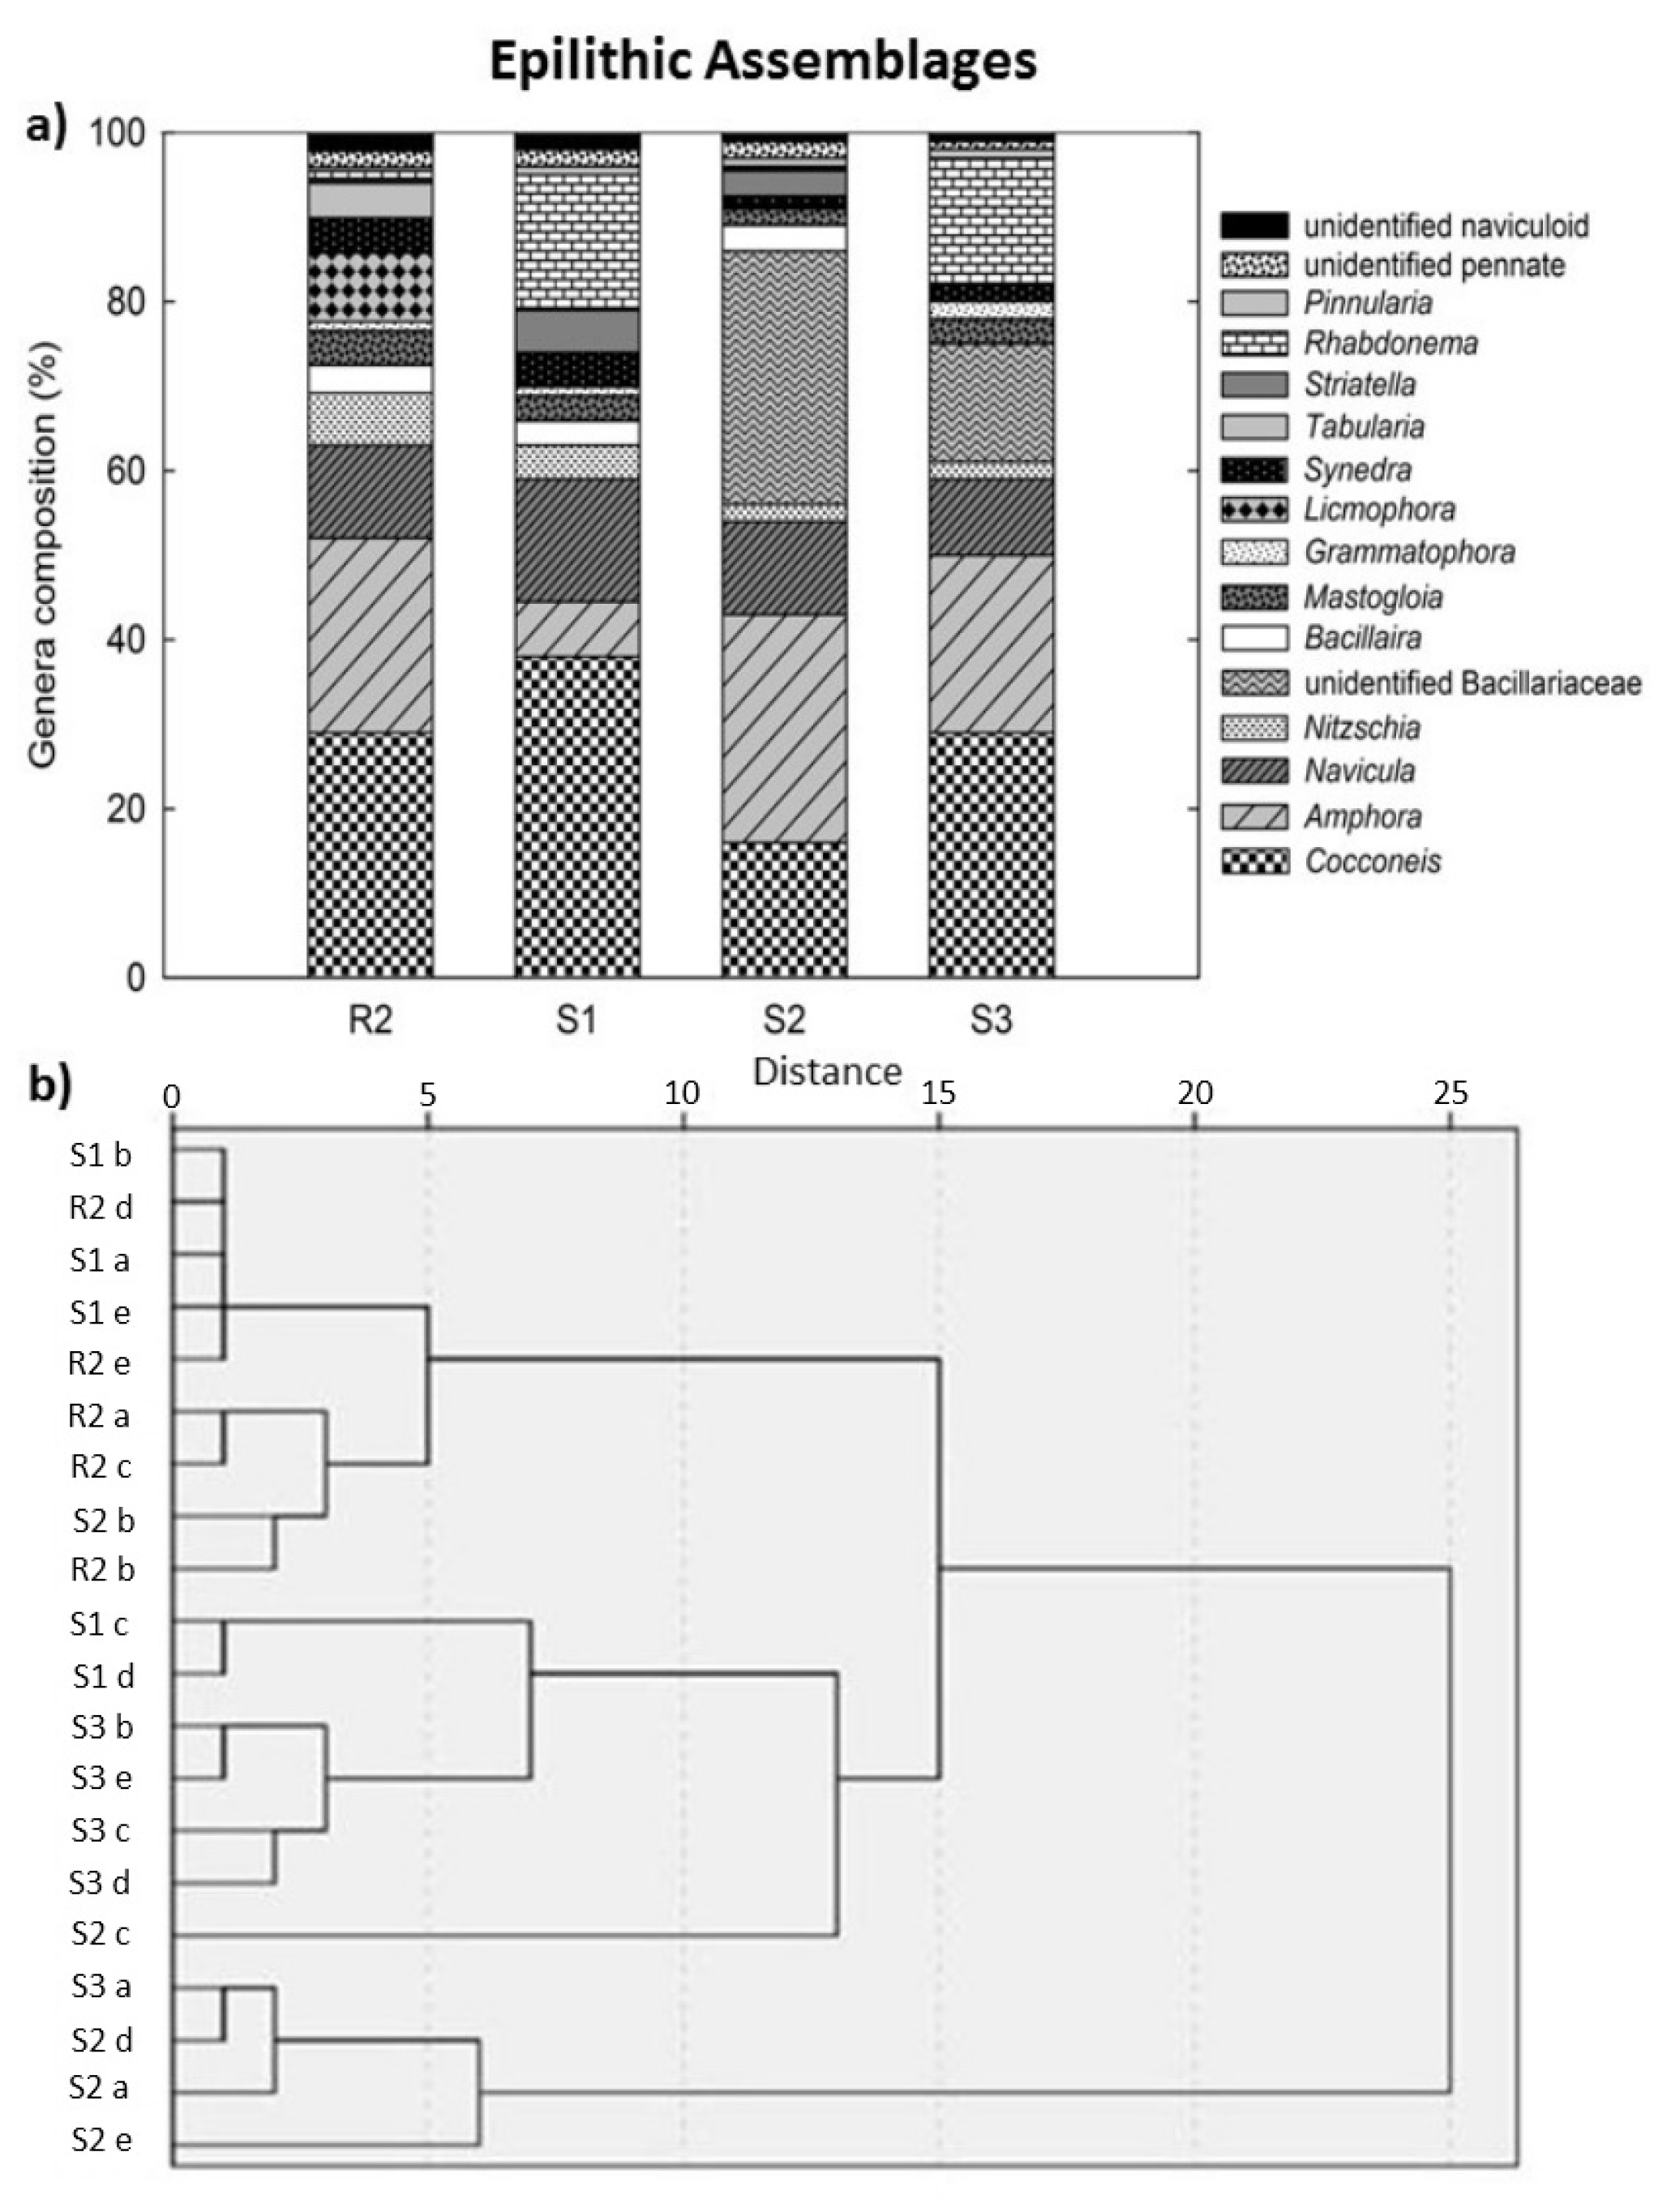
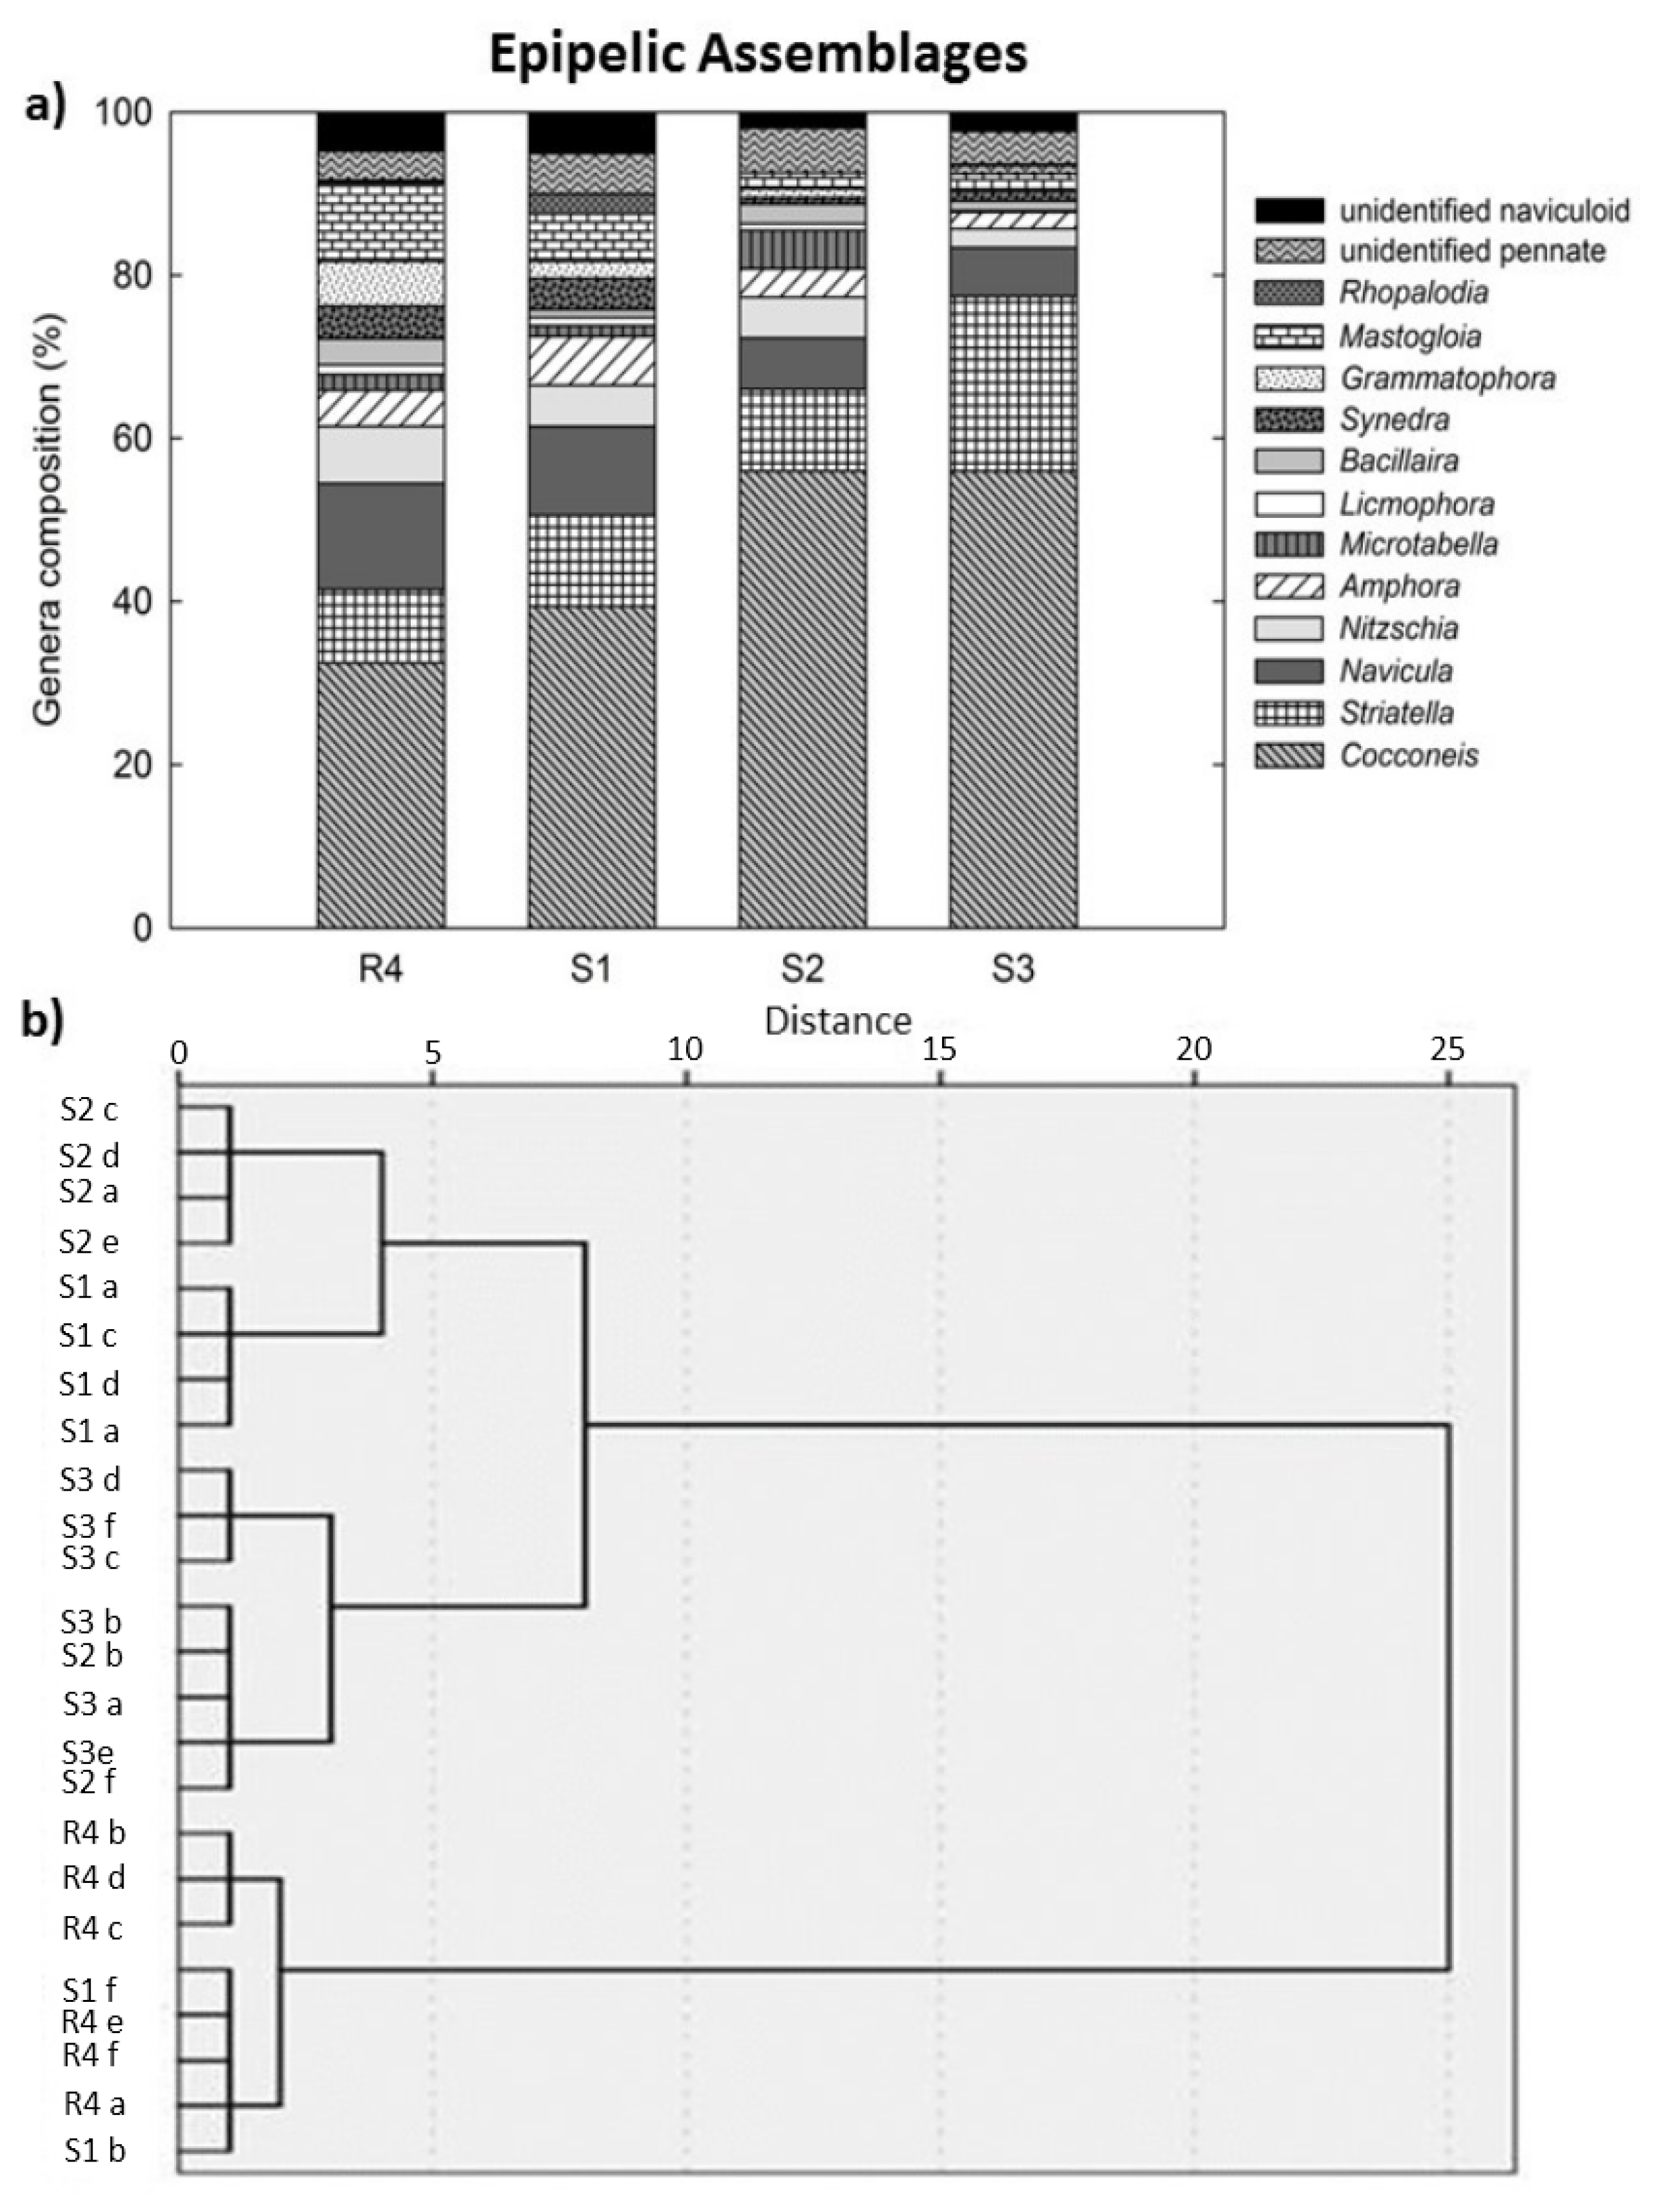
3.5. Benthic Diatom Assemblage Composition

Both rocky shore and sedimentary diatom assemblages altered significantly along the CO2 gradient (Figure 5). Epilithic assemblages were similar at the reference stations and S1, where there was a small increase in pCO2, but markedly different from the stations S2 and S3 which had high levels of pCO2 (Figure 5). Biofilm SEM images (Figure S4) and cell counts of the most numerous taxa (Figure S5) reveal which epilithic genera proliferated at elevated CO2 levels (Rhabdonema, unidentified Bacillariaceae, Cocconeis, Amphora, Striatella), which became more scarce (Licmophora, Tabularia) and those that appear to be unaffected by the changes in seawater carbonate chemistry (Synedra, Mastogloia, Navicula, Nitzschia). The CO2 enriched stations had a larger proportion of chain-forming genera (Rhabdonema, Striatella, unidentified Bacillariaceae) than the reference station. The diversity of epilithic diatom genera (Figure S6) was higher at the reference station H′ 2.12 ± SE 0.07 n = 5) than at the CO2 enriched stations (S1 = 1.83 ± SE 0.06 n = 5, S2 = 1.55 ± SE 0.24 n = 5, S3 = 1.77 ± SE 0.07 n = 5) although differences in diversity indices between these stations were not statistically significant (H’ ANOVA: F(3,16) = 2.927, p = 0.066; evenness J ANOVA: F(3,16) = 3.113, p = 0.056; dominance D ANOVA: F(3,16) = 0.718, p = 0.556).
Figure 5. Epilithic diatom assemblages along a natural CO2 gradient. (a) Relative composition of epilithic assemblages at different pCO2 levels. Bar charts include all genera present over 1% and all unidentified diatoms grouped as unidentified pennate or naviculoid (n = 5 per station,); (b) Hierarchical cluster analyses of the similarity of epilithic diatom assemblage composition based on Ward’s method with squared Euclidian distance for all the biofilms sampled along a natural CO2 gradient (n = 20). Analysis consists of all genera present over 1%, including any of the unidentified groups.
Jmse 03 01425 g005
In epipelic assemblages, Cocconeis and Striatella were more prevalent at the high CO2 stations (S2 and S3) but several genera were less abundant than in reference conditions (Mastogloia, Grammatophora, Synedra, Nitzschia and Amphora, Figure 6a). The assemblages differed markedly between the reference station and the CO2 enriched stations (Figure 6b). At elevated pCO2 there was a proliferation of some sand-dwelling genera (Cocconeis, Striatella), reduced abundance of several others (Navicula, Nitzschia, Grammatophora, Mastogloia, Synedra, Amphora), while the abundance of other genera showed relatively little change along the CO2 gradient (Licmophora, Bacillaria). The diversity of epipelic diatom genera decreased significantly at stations with high CO2 (ANOVA, F(3,20) = 48.120, p < 0.001), the dominance index was significantly higher at S2 and S3 than the other two stations (ANOVA: F(3,20) = 47.516, p < 0.001; Tukey, p < 0.05) and the evenness of the assemblage decreased significantly at elevated CO2 (ANOVA: F(3,20) = 19.877, p < 0.001), with the reference station having significantly greater evenness than S2 and S3 (Tukey, p < 0.05).
Figure 6. Epipelic diatom assemblages along a natural CO2 gradient. (a) Relative composition of epipelic assemblages at different pCO2 levels. Bar charts include all genera present over 1% and all unidentified diatoms grouped as unidentified pennate or naviculoid (n = 6 per station,); (b) Hierarchical cluster analyses of the similarity of epipelic diatom assemblage composition based on Ward’s method with squared Euclidian distance for all the sediment samples collected along a natural CO2 gradient (n = 24). Analysis consists of all genera present over 1%, including any of the unidentified groups.
Jmse 03 01425 g006

4. Discussion

Researchers have recently begun to examine the potential effects of ocean acidification on microphytobenthic assemblages since they are known to play a crucial role in coastal ecosystems [21,22]. Since ocean acidification is occurring alongside a variety of other anthropogenic changes, studies of marine photoautotrophs have also started to address the interactive effects of multiple stressors [45]. To the best of our knowledge, the present study provides the first field observations of natural populations along a gradient of pCO2 subjected to multiple coastal stressors (e.g., fishing, coastal pollutionand heat waves) and revealed considerable differences between epilithic, epipelic and epipsammic microalgal assemblages in acidified vs. ambient conditions. The standing crop of microalgae on rock and sediment was significantly higher in areas with elevated pCO2 compared to reference conditions, with a proliferation of diatoms at moderate increases in pCO2 and of cyanobacteria in areas with extremely large increases in pCO2. This study validates the findings of previous work on the using artificial substrata [21]; by evaluating natural epilithic, epipelic and epipsammic communities this study provides a more realistic indication of the future changes expected in shallow sub-tidal rocky habitats as oceans acidify.
It is clear from our study, and others [4,46], that many coastal diatoms are tolerant of wide fluctuations in pH. However, it is important to consider the potential internal buffering capacity within these assemblages that occurs as a result of the high pH generated in dense photoautotrophic biofilms, since this may reduce the potential negative effects of low pH on the growth of microalgal cells [47]. In addition, the pH may vary in different layers of a biofilm; future studies should incorporate the use of pH microelectrodes to measure the potential gradient through the microalgal layers. Our observations contradict studies that report small or negative responses to CO2 in diatoms [48,49,50] but support those that found that elevated CO2 stimulated diatom growth [51,52,53,54,55]. Diatoms may benefit from seawater carbonation through down regulation of CCM capacity and the associated reductions in carbon fixation energy costs [4,6,7]. Hopkinson et al. [56] predicted that a doubling of ambient CO2 would save around 20% of the CCM expenditure, reducing the amount of energy expended on carbon fixation by 3% to 6% and increasing primary production. In contrast to our findings, mesocosm experiments investigating benthic microalgae in more cohesive sediments have failed to detect any influence of pCO2 levels on biomass [57,58]. Sediment type, however, has a major influence on microphytobenthic biomass, depth distribution, species diversity and assemblage composition [59,60]. The microphytobenthos at our coarse sediment stations will experience greater water exchange with the overlying water column than occurs in mud [61] and the microphytobenthos in muddy sediments may have access to other dissolved carbon sources; therefore, the responses observed in our study may not apply to all types of coastal sediments.
The use of natural analogues to predict effects of ocean acidification requires careful consideration of factors that may mask or enhance effects of elevated pCO2 levels [30,62]. Geochemical monitoring was carried out to choose rocky and sandy habitats that were very similar along a gradient in seawater carbonate chemistry but were away from the influence of heated water, H2S or anomalies in alkalinity and salinity, in order to provide a consistent basis for comparison of the effects of seawater CO2 enrichment [36]. Sediment analysis revealed similarities in the physical properties of the volcanic sand at each sampling station. Dissolved nutrient levels and light are potentially important confounding variables to consider in these in situ experiments as it is difficult to isolate these effects from CO2 elevations on algal growth. However, light intensity was constant between CO2 enriched and reference sites, and phosphate and nitrate levels were similar along the gradient, while the increase in nitrite at stations S2 and S3 was only very small (0.01 μM). This suggests that pCO2 was the main factor responsible for the observed differences in microphytobenthic communities between the CO2 enriched and reference stations. Silicate levels were the only parameter that we found co-varied significantly with increasing pCO2 levels; Dando et al. [63] also found that silicate is often elevated at submarine CO2 seeps. Silicate limits diatom growth below ~2 μM, above which diatom growth and abundance remain relatively constant as silicate concentrations are further elevated [64,65,66]. Since the background silicate concentration at Vulcano was well above 2 μM we may infer that increases in pCO2 (as opposed to silicate) were responsible for the significant increases in diatoms observed. However, while silicate uptake in diatoms has been typically characterised by saturation kinetics, non-saturable uptake kinetics have been observed in a few pelagic diatom species [67]. Consequently, not all diatom species in the microphytobenthos along the CO2 gradients may have been silicate-saturated; this clearly warrants further in-depth investigation. Furthermore, a limitation of this study was that nutrient analyses were only conducted in one season and are therefore not representative of the whole year. In addition, ammonium levels, that can constitute a significant source of inorganic nitrogen, were not assessed.
The high variability in the carbonate system of volcanic seep sites may be considered a drawback to in situ studies because accurate dose-response relationships become difficult to determine. Furthermore, surface waters are not thought to be characterised by such rapid variability as the oceans acidify [68] and this may complicate the use of the information derived from vent studies in projecting future high CO2 scenarios [69]. However, CO2 vent systems provide an opportunity to examine the ecological effects of pH variability. This is essential for forecasting organism responses to acidification in habitats exposed to large natural diel, semi-diurnal and stochastic fluctuations in the carbonate system. The pH of the oceans, particularly coastal regions, is not constant [70,71], over diurnal scales pH shows strong systematic variation as a result of CO2 uptake during photosynthesis and CO2 release during respiration [72]. A compilation of high resolution time series of upper ocean pH collected over a variety of ecosystems has highlighted the natural temporal fluctuations (over a period of one month) and environmental heterogeneity associated with coastal seawater pH [73]. This natural variability was seldom considered in the early stages of ocean acidification research, as perturbation experiments mainly investigated the responses of organisms to constant levels of lowered pH.
Acidification of coastal seawater can enhance iron bioavailability through pH-induced changes in iron chemistry [74] and increase concentrations of one of the most toxic and bioavailable forms of copper [75]. Laboratory experiments replicating near-future ocean acidification scenarios have found that the susceptibility of benthic ecosystems to metal contaminants increases at high pCO2 [13]. Natural CO2 vent gradients provide an opportunity to assess the combined effects of changes in ocean pH including increased solubility and bioavailability of trace elements [13,76] although care is needed to avoid areas that have higher levels of trace elements than are predicted due to ocean acidification [30]. The effects of ocean acidification on shallow ecosystems will depend on interactions between algae and their consumers since grazers have a major influence on the microflora of rocks and sediments [77]. Some ecologically important groups of grazers (e.g., gastropods and sea urchins) decrease in abundance along CO2 seep gradients [26] and whilst some micrograzers (e.g., amphipods) tolerate areas enriched with CO2, many do not [24,78]. Research into the biogeochemical influence of ocean acidification on grazer-primary producer interactions is in its infancy; Arnold et al. [79] found that several seagrass species are less able to chemically defend themselves from grazers when subjected to chronic exposures to elevated CO2 levels and Rossoll et al. [8] found that ocean acidification may degrade the food quality of phytoplankton. Preliminary work on grazer-microphytobenthos interactions at increased CO2 levels produced contradictory results from short-term and long-term experiments so field observations will be useful to determine likely effects of ocean acidification [22]. As we did not quantify herbivore abundance it is not possible to determine the influence of grazers on microphytobenthic communities in this study. Our findings confirm observations of stimulated microphytobenthic growth in CO2 enriched areas on artificial substrata where grazers were absent [20,21], increasing our confidence in the hypothesis that microbial primary producers will thrive on rocky and coarse sedimentary coastal habitats as pCO2 levels continue to rise.
Phycobylin fluorescence (from rhodophytes and cyanobacteria) was only significantly enhanced at >1400 μatm pCO2. Kübler et al. [80] observed positive effects of high CO2 on the red alga Lomentaria articulata and Porzio et al. [81] recorded an increase in abundance of fleshy rhodophytes along a natural volcanic CO2 gradient. There were no measurable effects of moderate increases in pCO2 levels on phycobilin fluorescence, which is consistent with the findings of Johnson et al. [21] and similar to those reported by Tribollet et al. [82] who did not detect a significant effect of 750 ppm CO2 on endolithic assemblages. Cyanobacteria possess a form of RUBSICO that has a very low affinity for CO2 [83,84] and as a result have developed a highly effective CCM that is thought to be one of the most effective of any photosynthetic organism [85]. This may explain why cyanobacteria were less sensitive to increasing pCO2 levels along the vent gradient than diatoms. Furthermore, in microbial mats dominated by cyanobacteria, photosynthesis has been shown to be non-sensitive to pH changes in the range of 5.6–9.6 [86]. Our findings contrast with several studies of oceanic species which reported significant, positive interactions of elevated CO2 on cyanobacterial photosynthesis, nitrogen fixation and growth [87,88,89]. These experiments appear to have been conducted in nutrient replete conditions; in oligotrophic conditions, such as off Sicily and in mid-ocean gyres, cyanobacteria may not respond positivity to levels of CO2 enrichment predicted this century [90].
The genus-specific differences in microphytobenthic abundance that we found tie-in with genus-specific diatom responses to changing CO2 levels [6,50,51,52]. While some genera (e.g., Amphora, Cocconeis and Navicula) remained relatively constant across the CO2 gradient, others became more scarce in areas of elevated pCO2 (Licmophora, Tabularia, Synedra) and some (including chain-forming genera, Rhabdonema, Striatella and an unidentified Bacillariaceae) increased in abundance. Elevations in CO2 have been shown to selectively enhance the growth of large planktonic diatom species over smaller species [91]. Furthermore, a greater dominance of large, chain forming periphytic species at elevated CO2 have also been reported by Tortell et al. [51] and by Johnson et al. [21]. Collectively, these findings indicate that elevated CO2 influences the competitive abilities of different size classes/morphologies of diatoms, causing shifts in assemblages. This may be related to differences in CO2 diffusion limitation between various diatom size groups and morphologies [92]. In addition to pCO2, changes in pH may also influence diatom community composition. Reductions in pH can affect diatom growth rate, silicon metabolism and intracellular pH homeostasis, which is believed to vary among different species according to species-specific intrinsic buffering capacity and adaptive capabilities [93]. Ocean acidification induced alterations in microphytobenthic assemblages may have wide-reaching ecological consequences as assemblage composition is known to mediate the structure of the overlying macrobenthos [94].
In summary, the microphytobenthic assemblages on natural substrata showed significant changes along a CO2 gradient that mirror those recorded on artificial substrata [16]. Photosynthetic standing crop of both epilithic biofilms and microphytobenthic assemblages found in surface layers of sandy sediment was greatest in areas with long-term exposures to elevated CO2 levels. Since these responses may have been modulated by concurrent stressors such as trace metal enrichment, overfishing and coastal pollution, they are valuable for formulating more realistic predictions of ocean acidification. Such alterations in microphytobenthic assemblages may have important consequences for benthic trophic webs and larger-scale biogeochemical processes as anthropogenic CO2 emissions continue to rise and interact with multiple environmental stressors.

Acknowledgments

We thank C. Totti and T. Romagnoli at Università Politecnica delle Marche, Ancona, Italy for assistance with diatom identification and Lisa Al-Moosawi at Plymouth Marine Laboratory for nutrient analyses. Funding was provided by the Marine Institute (Plymouth University) and EU FP7 “Mediterranean Sea Acidification under a changing climate” (grant 265103).

Author Contributions

Conceived and designed the experiments: V.R.J., J.M.H.-S., C.B., M.M. Performed the experiments: V.R.J.; Analysed the data: V. R. J.; Wrote the paper: V. R. J., J.M.H.-S., C.B., M.M.

Conflicts of Interest

The authors declare no conflict of interest.

References

  1. Hönisch, B.; Ridgwell, A.; Schmidt, D.N.; Thomas, E.; Gibbs, S.J.; Sluijs, A.; Zeebe, R.; Kump, L.; Martindale, R.C.; Greene, S.E.; et al. The geological record of ocean acidification. Science 2012, 335, 1058–1063. [Google Scholar] [CrossRef] [PubMed] [Green Version]
  2. Connell, S.D.; Kroeker, K.J.; Fabricius, K.E.; Kline, D.I.; Russell, B.D. The other ocean acidification problem: CO2 as a resource among competitors for ecosystem dominance. Philos. Trans. R. Soc. B 2013, 368. [Google Scholar] [CrossRef] [PubMed]
  3. Giordano, M.; Beardall, J.; Raven, J.A. CO2 concentrating mechanisms in algae: Mechanisms, environmental modulation, and evolution. Annu. Rev. Plant Biol. 2005, 56, 99–131. [Google Scholar] [CrossRef] [PubMed]
  4. Beardall, J.; Giordano, M. Ecological implications of microalgal and cyanobacterial CO2 concentrating mechanisms and their regulation. Funct. Plant Biol. 2002, 29, 335–347. [Google Scholar] [CrossRef]
  5. Collins, S.; Bell, G. Phenotypic consequences of 1000 generations of selection at elevated CO2 in a green alga. Nature 2004, 431, 566–569. [Google Scholar] [CrossRef] [PubMed]
  6. Trimborn, S.; Wolf-Gladrow, D.; Ritcher, K-L.; Rost, B. The effect of pCO2 on carbon acquisition and intracellular assimilation in four marine diatoms. J. Exp. Mar. Biol. Ecol. 2009, 376, 26–36. [Google Scholar] [CrossRef] [Green Version]
  7. Rost, B.; Zondervan, I.; Wolf-Gladrow, D. Sensitivity of phytoplankton to future changes in ocean carbonate chemistry: Current knowledge, contradictions and research directions. Mar. Ecol. Prog. Ser. 2008, 373, 227–237. [Google Scholar] [CrossRef]
  8. Rossoll, D.; Bermúdez, R.; Hauss, H.; Schulz, K.G.; Riebesell, U.; Sommer, U.; Winder, M. Ocean acidification-induced food quality deterioration constrains trophic transfer. PLoS ONE 2012, 7. [Google Scholar] [CrossRef] [PubMed] [Green Version]
  9. Sinutok, S.; Hill, R.; Doblin, M.A.; Wuhrer, R.; Ralph, P.J. Warmer more acidic conditions cause decreased productivity and calcification in subtropical coral reef sediment-dwelling calcifiers. Limnol. Oceangr. 2011, 56, 1200–1212. [Google Scholar] [CrossRef]
  10. Connell, S.D.; Russell, B.D. The direct effects of increasing CO2 and temperature on non-calcifying organisms: Increasing the potential for phase shifts in kelp forests. Proc. R. Soc. Lond. B 2010, 277, 1409–1415. [Google Scholar] [CrossRef] [PubMed]
  11. Gao, K.; Xu, J.; Gao, G.; Li, Y.; Hutchins, D.A.; Huang, B.; Wang, L.; Zheng, Y.; Jin, P.; Cai, X.; et al. Rising CO2 and increased light exposure synergistically reduce marine primary productivity. Nat. Clim. Chang. 2012, 2, 519–523. [Google Scholar] [CrossRef]
  12. Lefebvre, S.C.; Benner, E.; Stillman, J.H.; Parker, A.E.; Drake, M.K.; Rossignol, P. Nitrogen source and pCO2 synergisitically affect carbon allocation, growth and morphology of the coccolithophore Emiliania huxleyi: Potential implications of ocean acidification for the carbon cycle. Glob. Chang. Biol. 2012, 18, 493–503. [Google Scholar]
  13. Roberts, D.A.; Birchenough, S.N.R.; Lewis, C.; Sanders, M.B.; Bolam, T.; Sheahan, D. Ocean acidification increases the toxicity of contaminated sediments. Glob. Chang. Biol. 2013, 19, 340–351. [Google Scholar] [CrossRef] [PubMed]
  14. Zeng, X.; Chen, X.; Zhuang, J. The positive relationship between ocean acidification and pollution. Mar. Pollut. Bull. 2015, 91, 14–21. [Google Scholar] [CrossRef] [PubMed]
  15. MacIntyre, H.L.; Geider, R.J.; Miller, D.C. Microphytobenthos: The ecological role of the “secret garden” of unvegetated, shallow-water marine habitats. 1. Distribution, abundance and primary production. Estuaries 1996, 19, 186–201. [Google Scholar] [CrossRef]
  16. Magalhães, C.M.; Bordalo, A.A.; Wiebe, W.J. Intertidal biofilms on rocky substratum can play a major role in estuarine carbon and nutrient dynamics. Mar. Ecol. Prog. Ser. 2003, 258, 275–281. [Google Scholar] [CrossRef]
  17. Underwood, G.J.C.; Paterson, D.M. The importance of extracellular carbohydrate production by marine epipelic diatoms. Adv. Bot. Res. 2003, 40, 184–240. [Google Scholar]
  18. Brodie, J.; Williamson, C.J.; Smale, D. The future of the northeast Atlantic benthic flora in a high CO2 world. Ecol. Evol. 2014, 4, 2787–2798. [Google Scholar] [CrossRef] [PubMed]
  19. Koch, M.; Bowes, G.; Ross, C.; Zhang, X.H. Climate change and ocean acidification effects on seagrassess and marine macroalgae. Glob. Chang. Biol. 2013, 19, 103–132. [Google Scholar] [CrossRef] [PubMed]
  20. Lidbury, I.; Johnson, V.R.; Hall-Spencer, J.M.; Munn, C.B.; Cunliffe, M. Community-level response of coastal microbial biofilms to ocean acidification in a natural carbon dioxide vent system. Mar. Pollut. Bull. 2012, 64, 1063–1066. [Google Scholar] [CrossRef] [PubMed]
  21. Johnson, V.R.; Brownlee, C.; Rickaby, R.E.M.; Graziano, M.; Milazzo, M.; Hall-Spencer, J.M. Responses of marine benthic microalgae to elevated CO2. Mar. Biol. 2013, 160, 1813–1824. [Google Scholar] [CrossRef]
  22. Russell, B.D.; Connell, S.D.; Findlay, H.S.; Tait, K.; Widdicombe, S.; Mieszkowska, N. Ocean acidification and rising temperatures may increase biofilm primary productivity but decrease grazer consumption. Philos. Trans. R. Soc. B 2013, 368. [Google Scholar] [CrossRef] [PubMed]
  23. Snoeijs, P. Monitoring pollution effects by diatom community composition. A comparison of sampling methods. Arch. Hydrobiol. 1991, 121, 497–510. [Google Scholar]
  24. Kroeker, K.J.; Micheli, F.; Gambi, M.C. Ocean acidification causes ecosystem shifts via altered competitive interactions. Nat. Clim. Chang. 2012, 3, 156–159. [Google Scholar] [CrossRef]
  25. Kerfahi, D.; Hall-Spencer, J.M.; Tripathi, B.M.; Milazzo, M.; Lee, J.; Adams, J. Shallow water marine sediment bacterial community shifts along a natural CO2 gradient in the Mediterranean Sea off Vulcano, Italy. Microb. Ecol. 2014, 67, 819–828. [Google Scholar] [CrossRef] [PubMed]
  26. Hall-Spencer, J.M.; Rodolfo-Metalpa, R.; Martin, S.; Ransome, E.; Fine, M.; Turner, S.M.; Rowley, S.J.; Tedesco, D.; Buia, M-C. Volcanic carbon dioxide vents show ecosystem effects of ocean acidification. Nature 2008, 454, 96–99. [Google Scholar] [CrossRef] [PubMed]
  27. Fabricius, K.E.; De’ath, G.; Noonan, S.; Uthike, S. Ecological effects of ocean acidification and habitat complexity on reef-associated macroinvertebrate communities. Proc. R. Soc. B 2014, 281. [Google Scholar] [CrossRef] [PubMed]
  28. Vikas, M.; Dwarakish, G.S. Coastal pollution: A review. Aquat. Procedia 2015, 4, 381–388. [Google Scholar] [CrossRef]
  29. Vasilakopoulos, P.; Maravelias, C.D.; Tserpes, G. The alarming decline of Mediterranean fish stocks. Curr. Biol. 2014, 24, 1643–1648. [Google Scholar] [CrossRef] [PubMed]
  30. Vizzini, S.; Leonardo, R.D.; Costa, V.; Tramati, C.D.; Luzzu, F.; Mazzola, A. Trace element bias in the use of CO2 vents as analogues for low pH environments: Implications for contamination levels in acidified oceans. Estuar. Coast. Shelf Sci. 2013, 134, 19–30. [Google Scholar] [CrossRef]
  31. Gattuso, J.P.; Gentill, B.; Duarte, C.M.; Kleypas, J.A.; Middelburg, J.J.; Antione, D. Light availability in the coastal ocean: Impact on the distribution of benthic photosynthetic organisms and contribution to primary production. Biogeosciences 2006, 3, 489–513. [Google Scholar] [CrossRef]
  32. Johnson, V.R. Using volcanic CO2 Gradients to Investigate the Responses of Marine Benthic Algae to Ocean Acidification. PhD Thesis, School of Biomedical and Biological Sciences, Marine Biology and Ecology Research Centre, Plymouth University, Plymouth, UK, 2012. [Google Scholar]
  33. Lewis, E.; Wallace, W.R. Program Developed for CO2 System Calculations; Carbon dioxide information analysis center, Oak Ridge National Laboratory, U.S. Department of Energy: Oak Ridge, TN, USA, 1998. [Google Scholar]
  34. Fabricius, K.E.; Langdon, C.; Uthicke, S.; Humphrey, C.; Noonan, S.; De’ath, G.; Okazaki, R.; Muehllehner, N.; Glas, M.S.; Lough, J.M. Losers and winners in coral reefs acclimatized to elevated carbon dioxide concentrations. Nat. Clim. Chang. 2011, 1, 165–169. [Google Scholar] [CrossRef]
  35. Kerrison, P.; Hall-Spencer, J.M.; Suggett, D.; Hepburn, L.J.; Steinke, M. Assessment of pH variability at a coastal CO2 vent for ocean acidification studies. Estuar. Coast. Shelf Sci. 2011, 94, 129–137. [Google Scholar] [CrossRef] [Green Version]
  36. Boatta, F.; D’Alessandro, W.; Gagliano, A.; Liotta, M.; Milazzo, M.; Rodolfo-Metalpa, R.; Hall-Spencer, J.M.; Parello, F. Geochemical survey of Levante Bay, Vulcano Island (Italy) and its suitability as a natural laboratory for the study of ocean acidification. Mar. Pollult. Bull. 2013, 73, 485–494. [Google Scholar] [CrossRef] [PubMed]
  37. Hansson, L.-A. Chlorophyll-a determination of periphyton on sediments: Identification of problems and recommendation of method. Freshw. Biol. 1998, 20, 347–352. [Google Scholar] [CrossRef]
  38. Ritchie, R.J. Universal chlorophyll equations for estimating chlorophylls a, b, c, and d and total chlorophylls in natural assemblages of photosynthetic organisms using acetone, methanol, or ethanol solvents. Photosynthetica 2008, 46, 115–1126. [Google Scholar] [CrossRef]
  39. Hickman, M.; Round, F.E. Primary production and standing crops of epipsammic and epipelic algae. Br. Phycol. J. 1970, 5, 247–255. [Google Scholar] [CrossRef]
  40. Hickman, M. Methods for determining the primary productivity of epipelic and epipsammic algal associations. Limnol. Oceanogr. 1969, 14, 936–941. [Google Scholar] [CrossRef]
  41. McAlice, B.J. Phytoplankton sampling with the Sedgewick Rafter Cell. Limnol. Oceanogr. 1971, 16, 19–28. [Google Scholar] [CrossRef]
  42. Eaton, J.W.; Moss, B. The estimation of numbers and pigment content in epipelic algal populations. Limnol. Oceanogr. 1996, 11, 584–595. [Google Scholar] [CrossRef]
  43. Nagarkar, S.; Williams, G.A. Comparative techniques to quantify cyanobacteria dominated epilithic biofilms on tropical rocky shores. Mar. Ecol. Prog. Ser. 1997, 154, 281–291. [Google Scholar] [CrossRef] [Green Version]
  44. Thompson, R.C.; Tobin, M.L.; Hawkins, S.J.; Norton, T.A. Problems in extraction and spectrophotometric determination of chlorophyll from epilithic microbial biofilms: Towards a standard method. J. Mar. Biol. Assoc. UK 1999, 79, 551–558. [Google Scholar] [CrossRef]
  45. Celis-Plá1, P.S.M.; Hall-Spencer, J.M.; Antunes Horta, P. Macroalgal responses to ocean acidification depend on nutrient and light levels. Front. Mar. Sci. 2015, 2. [Google Scholar] [CrossRef]
  46. Hinga, K.R. Effects of pH on coastal marine phytoplankton. Mar. Ecol. Prog. Ser. 2002, 238, 281–300. [Google Scholar] [CrossRef]
  47. Hama, T.; Kawahima, S.; Shimotori, K.; Satoh, Y.; Omori, Y.; Wada, S.; Adachi, T.; Hasegawa, S.; Midorikawa, T.; Ishii, M.; et al. Effect of ocean acidification on coastal phytoplankton composition and accompanying organic nitrogen production. J. Oceanogr. 2012, 68, 183–194. [Google Scholar] [CrossRef]
  48. Burkhardt, S.; Zondervan, I.; Riebesell, U. Effect of CO2 concentration on C:N:P ratio in marine phytoplankton: A species comparison. Limnol. Oceanogr. 1999, 44, 683–690. [Google Scholar] [CrossRef]
  49. Crawfurd, K.J.; Raven, J.A.; Wheeler, G.L.; Baxter, E.J.; Joint, I. The response of Thalassiosira pseudonana to long-term exposure to increased CO2 and decreased pH. PLoS ONE 2011, 6, e26695. [Google Scholar] [CrossRef] [PubMed] [Green Version]
  50. Torstensson, A.; Chierici, M.; Wulff, A. The influence of increased temperature and carbon dioxide levels on the benthic/sea ice diatom Navicula directa. Polar Biol. 2011, 35, 205–214. [Google Scholar] [CrossRef]
  51. Tortell, P.D.; DiTullio, G.R.; Sigman, D.M.; Morel, F.M.M. CO2 effects on taxonomic composition and nutrient utilisation in an Equatorial Pacific phytoplankton assemblage. Mar. Ecol. Prog. Ser. 2002, 236, 37–43. [Google Scholar] [CrossRef]
  52. Tortell, P.D.; Payne, C.D.; Li, Y.; Trimborn, S.; Rost, B.; Smith, W.O.; Riesselman, C.; Dunbar, R.B.; Sedwick, P.; DiTullio, G.R. CO2 sensitivity of southern ocean phytoplankton. Geophysi. Res. Lett. 2008, 35. [Google Scholar] [CrossRef]
  53. Feng, Y.; Hare, C.E.; Leblanc, K.; Rose, J.M.; Zhang, Y.; DiTullio, G.R.; Lee, P.A.; Wilhelm, S.W.; Rowe, J.M.; Nemcek, N.; et al. Effects of increased pCO2 and temperature on the North Atlantic spring bloom. I. The phytoplankton community and biogeochemical response. Mar. Ecol. Prog. Ser. 2009, 388, 13–25. [Google Scholar] [CrossRef]
  54. Sun, J.; Hutchins, D.A.; Feng, Y.; Seubert, E.L.; Caron, D.A.; Fu, F-X. Effects of changing pCO2 and phosphate availability on domoic acid production and physiology of the marine harmful bloom diatom Pseudo-nitzschia multiseries. Limnol. Oceanogr. 2011, 56, 829–840. [Google Scholar] [CrossRef]
  55. Gao, K.; Xu, J.; Gao, G.; Li, Y.; Hutchins, D.A.; Huang, B.; Wang, L.; Zheng, Y.; Jin, P.; Cai, X.; et al. Rising CO2 and increased light exposure synergistically reduce marine primary productivity. Nat. Clim. Chang. 2012, 2, 519–523. [Google Scholar]
  56. Hopkinson, B.M.; Dupont, C.L.; Allen, A.E.; Morel, F.M.M. Efficiency of the CO2-concentrating mechanism of diatoms. Proc. Nat. Acad. Sci. USA 2011, 108, 3830–3837. [Google Scholar] [CrossRef] [PubMed]
  57. Hicks, N.; Bulling, M.T.; Solan, M.; Raffaelli, D.; White, P.C.L.; Paterson, M.P. Impact of biodiversity-climate futures on primary production and metabolism in a model benthic estuarine system. BMC Ecol. 2011, 11, 7. [Google Scholar] [CrossRef] [PubMed] [Green Version]
  58. Alsterberg, C.; Eklöf, J.S.; Gamfeldt, L.; Havenhand, J.N.; Sundbäck, K. 2013. Consumers mediate the effects of experimental ocean acidification and warming on primary producers. Proc. Nat. Acad. Sci. USA 2013, 110, 8603–8608. [Google Scholar] [CrossRef] [PubMed]
  59. Underwood, G.J.C.; Barnett, M. What Determines Species Composition in Microphytobenthic Biofilms? In Functioning of Microphytobenthos in Estuaries. Proceedings of the Microphytobenthos symposium, Amsterdam, The Netherlands, Royal Netherlands Academy of Arts and Sciences, 21–23 August 2006; Kromkamp, J., Ed.; pp. 121–138.
  60. Jesus, B.; Brotas, V.; Ribeiro, L.; Mendes, C.R.; Cartaxana, P.; Paterson, D.M. Adaptations of microphytobenthos assemblages to sediment type and tidal position. Cont. Shelf Res. 2009, 29, 1624–1634. [Google Scholar] [CrossRef]
  61. Cook, P.L.M.; Roy, H. Advective relief of CO2 limitation in microphytobenthos in highly productive sandy sediments. Limnol. Oceanogr. 2006, 51, 1594–1601. [Google Scholar] [CrossRef]
  62. Kitidis, V.; Laverock, B.; McNeill, L.C.; Beesley, A.; Cummings, D.; Tait, K. Impact of ocean acidification on benthic and water column ammonia oxidation. Geophys. Res. Lett. 2011, 38. [Google Scholar] [CrossRef]
  63. Dando, P.R.; Stüben, D.; Varnavas, S.P. Hydrothermalism in the Mediterranean Sea. Progr. Oceanogr. 1999, 44, 333–367. [Google Scholar] [CrossRef]
  64. Egge, J.K.; Aksnes, D.L. Silicate as a regulating nutrient in phytoplankton competition. Mar. Ecol. Prog. Ser. 1992, 83, 281–289. [Google Scholar] [CrossRef]
  65. Martin-Jézéquel, V.; Hildebrand, M.; Brzezinski, M.A. Silicon metabolism in diatoms: Implications for growth. J. Phycol. 2000, 36, 821–840. [Google Scholar] [CrossRef]
  66. Claquin, P.; Leynaert, A.; Sferratore, A.; Garnier, J.; Ragueneau, O. Physiological Ecology of Diatoms Along the Land-Sea Continuum. In Land-Ocean Nutrient Fluxes: Silica Cycle; Ittekot, V., Humborg, C., Garnier, J., Eds.; Island Press: Washington, DC, USA, 2006. [Google Scholar]
  67. Thamatrakoln, K.; Hildebrand, M. Silicon uptake in diatoms revisited: A model for saturable and nonsaturable uptake kinetics and the role of silicon transporters. Plant Physiol. 2008, 146, 1397–1407. [Google Scholar] [CrossRef] [PubMed]
  68. Riebesell, U. Acid test for marine biodiversity. Nature 2008, 454, 46–47. [Google Scholar] [CrossRef] [PubMed]
  69. Gazeau, F.; Martin, S.; Hansson, L.; Gattuso, J.-P. Ocean acidification in the coastal zone. Available online: http://www.loicz.org/imperia/md/content/loicz/print/newsletter/Inprint_2011_3_online72.pdf (accessed on 24 November 2015).
  70. Middelboe, A.L.; Hansen, P.J. High pH in shallow-water macroalgal habitats. Mar. Ecol. Prog. Ser. 2007, 338, 107–117. [Google Scholar] [CrossRef]
  71. Joint, I.; Doney, S.C.; Karl, D.M. Will ocean acidification affect marine microbes? ISME J. 2011, 5, 1–7. [Google Scholar] [CrossRef] [PubMed]
  72. Wooton, J.T.; Pfister, C.A.; Forester, J.D. Dyanamic patterns and ecological impacts of declining ocean pH in a high-resolution multi-year dataset. Proc. Nat. Acad. Sci. USA 2008, 105, 18848–18853. [Google Scholar] [CrossRef] [PubMed]
  73. Hoffmann, G.E.; Smith, J.E.; Johnson, K.S.; Send, U.; Levin, L.A.; Micheli, F.; Paytan, A.; Price, N.N.; Peterson, B.; Takeshita, Y.; et al. High-frequent dynamics of ocean pH: A multi-ecosystem comparison. PLoS ONE 2011, 6. [Google Scholar] [CrossRef] [PubMed]
  74. Breitbarth, E.; Bellerby, R.J.; Neill, C.C.; Ardelan, M.V.; Meyerhofer, M.; Zollner, E.; Croot, P.L.; Riebesell, U. Ocean acidification affects iron speciation during a coastal seawater mesocosm experiment. Biogeosciences 2010, 7, 1065–1073. [Google Scholar] [CrossRef] [Green Version]
  75. Richards, R.; Chaloupka, M.; Sanò, M.; Tomlinson, R. Modelling the effects of “coastal” acidification on copper speciation. Ecol. Model. 2011, 22, 3559–3567. [Google Scholar] [CrossRef]
  76. Millero, F.J.; Woosley, R.; DiTrolio, B.; Waters, J. Effect of ocean acidification on the speciation of metals in seawater. Oceanography 2009, 22, 72–85. [Google Scholar] [CrossRef]
  77. Dyson, K.E.; Bulling, M.T.; Solan, M.; Hernandez-Milian, G.; Raffaelli, D.G.; White, P.C.L.; Paterson, D.M. Influence of macrofaunal assemblages and environmental heterogeneity on microphytobenthic production in experimental systems. Proc. R. Soc. B 2007, 274, 2547–2554. [Google Scholar] [CrossRef] [PubMed] [Green Version]
  78. Cigliano, M.; Gambi, M.C.; Rodolfo-Metalpa, R.; Patti, F.P.; Hall-Spencer, J.M. Effects of ocean acidification on invertebrate settlement at volcanic CO2 vents. Mar. Biol. 2010, 157, 2489–2502. [Google Scholar] [CrossRef]
  79. Arnold, T.; Mealey, C.; Leahey, H.; Miller, A.W.; Hall-Spencer, J.M.; Milazzo, M.; Maers, K. Ocean acidification and the loss of protective phenolics in seagrasses. PLoS ONE 2012, 7, e35107. [Google Scholar] [CrossRef] [PubMed] [Green Version]
  80. Kübler, J.E.; Johnston, A.M.; Raven, J.A. The effects of reduced and elevated CO2 and O2 on the seaweed Lomentaria articulate. Plant Cell Environ. 1991, 22, 1303–1310. [Google Scholar] [CrossRef]
  81. Porzio, L.; Buia, M.C.; Hall-Spencer, J.M. Effects of ocean acidification on macroalgal communities. J. Exp. Mar. Biol. Ecol. 2011, 400, 278–287. [Google Scholar] [CrossRef] [Green Version]
  82. Tribollet, A.; Atkinson, M.J.; Langdon, C. Effects of elevated pCO2 on epilithic and endolithic metabolism on reef carbonates. Glob. Chang. Biol. 2006, 12, 2200–2208. [Google Scholar]
  83. Badger, M.R.; Andrews, T.J.; Whitney, S.M.; Ludwig, M.; Yellowlees, D.C.; Leggat, W.; Price, G.D. The diversity and co-evolution of Rubisco, plastids, pyrenoids and chloroplast-based CCMs in the algae. Can. J. Bot. 1998, 76, 1052–1071. [Google Scholar]
  84. Kaplan, A.; Reinhold, L. CO2 concentrating mechanisms in photosynthetic microorganisms. Annu. Rev. Plant Physiol. Plant Mol. Biol. 1999, 50, 539–559. [Google Scholar] [CrossRef] [PubMed]
  85. Badger, M.R.; Price, G.D. CO2 concentrating mechanisms in cyanobacteria: Molecular components, their diversity and evolution. J. Exp. Bot. 2002, 54, 609–622. [Google Scholar] [CrossRef]
  86. Carrasco, M.; Mercado, J.M.; Niel, F.X. Diversity of inorganic carbon acquisition mechanisms by intact microbial mats of Microcoleus chthonoplastes (Cyanobacteriae, Oscillatoriaceae). Physiol. Plant. 2008, 133, 49–58. [Google Scholar] [CrossRef] [PubMed]
  87. Hutchins, D.A.; Fu, F-X.; Zhang, Y.; Warner, M.E.; Feng, Y.; Portune, K.; Bernhardt, P.W.; Mullholland, M.R. CO2 control of Trichodesmium N2 fixation, photosynthesis, growth rates and elemental ratios: Implications for past, present and future ocean biogeochemistry. Limnol. Oceanogr. 2007, 52, 1293–1304. [Google Scholar]
  88. Levitan, O.; Rosenberg, G.; Setlik, I.; Setlikova, E.; Grigel, J.; Klepetar, J.; Prasil, O.; Berman-Frank, I. Elevated CO2 enhances nitrogen fixation and growth in the marine cyanobacterium Trichodesmium. Glob. Chang. Biol. 2007, 13, 531–538. [Google Scholar] [CrossRef]
  89. Kranz, S.A.; Sültemeyer, D.; Richter, K.U.; Rost, B. Carbon acquisition in Trichodesmium: Diurnal variation and effect of pCO2. Limnol. Oceanogr. 2009, 54, 548–559. [Google Scholar] [CrossRef]
  90. Kletou, D.; Hall-Spencer, J.M. Threats to Ultraoligotrophic Marine Ecosystems. In Marine Ecosystems; Cruzado, A., Ed.; InTech—Open Access Publisher: Rijeka, Croatia, 2012. [Google Scholar]
  91. Wu, Y.; Campbell, D.D.; Irwin, A.J.; Suggett, D.J.; Finkel, Z.V. Ocean acidification enhances the growth rate of larger diatoms. Limnol. Oceanogr. 2014, 59, 1027–1034. [Google Scholar] [CrossRef]
  92. Flynn, K.J.; Blackford, C.J.; Baird, M.E.; Raven, J.A.; Clark, D.R.; Beardall, J.; Brownlee, C.; Fabian, H.; Wheeler, G.L. Changes in pH at the exterior surface of plankton with ocean acidification. Nat. Clim. Chang. 2012, 2, 510–513. [Google Scholar] [CrossRef]
  93. Hervé, V.; Derr, J.; Douady, S.; Quinet, M.; Moisan, L.; Lopez, P.J. Multiparametric analyses reveal the pH-dependence of silicon biomineralization in diatoms. PLoS ONE 2012, 7. [Google Scholar] [CrossRef] [PubMed]
  94. Huang, R.; Boney, A.D. Growth interactions between littoral diatoms and juvenile marine algae. J. Exp. Mar. Biol. Ecol. 1984, 81, 21–45. [Google Scholar] [CrossRef]

