
Application of a Coupled Vegetation Competition and Groundwater Simulation Model to Study Effects of Sea Level Rise and Storm Surges on Coastal Vegetation

Abstract
:
1. Introduction
2. Methods
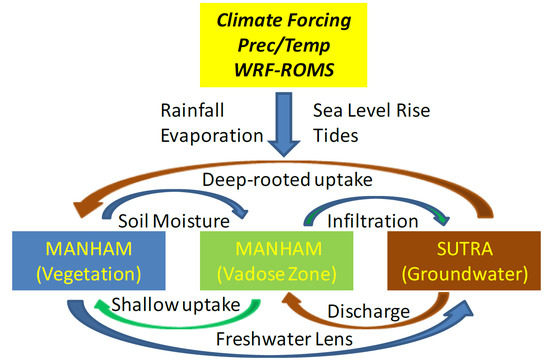
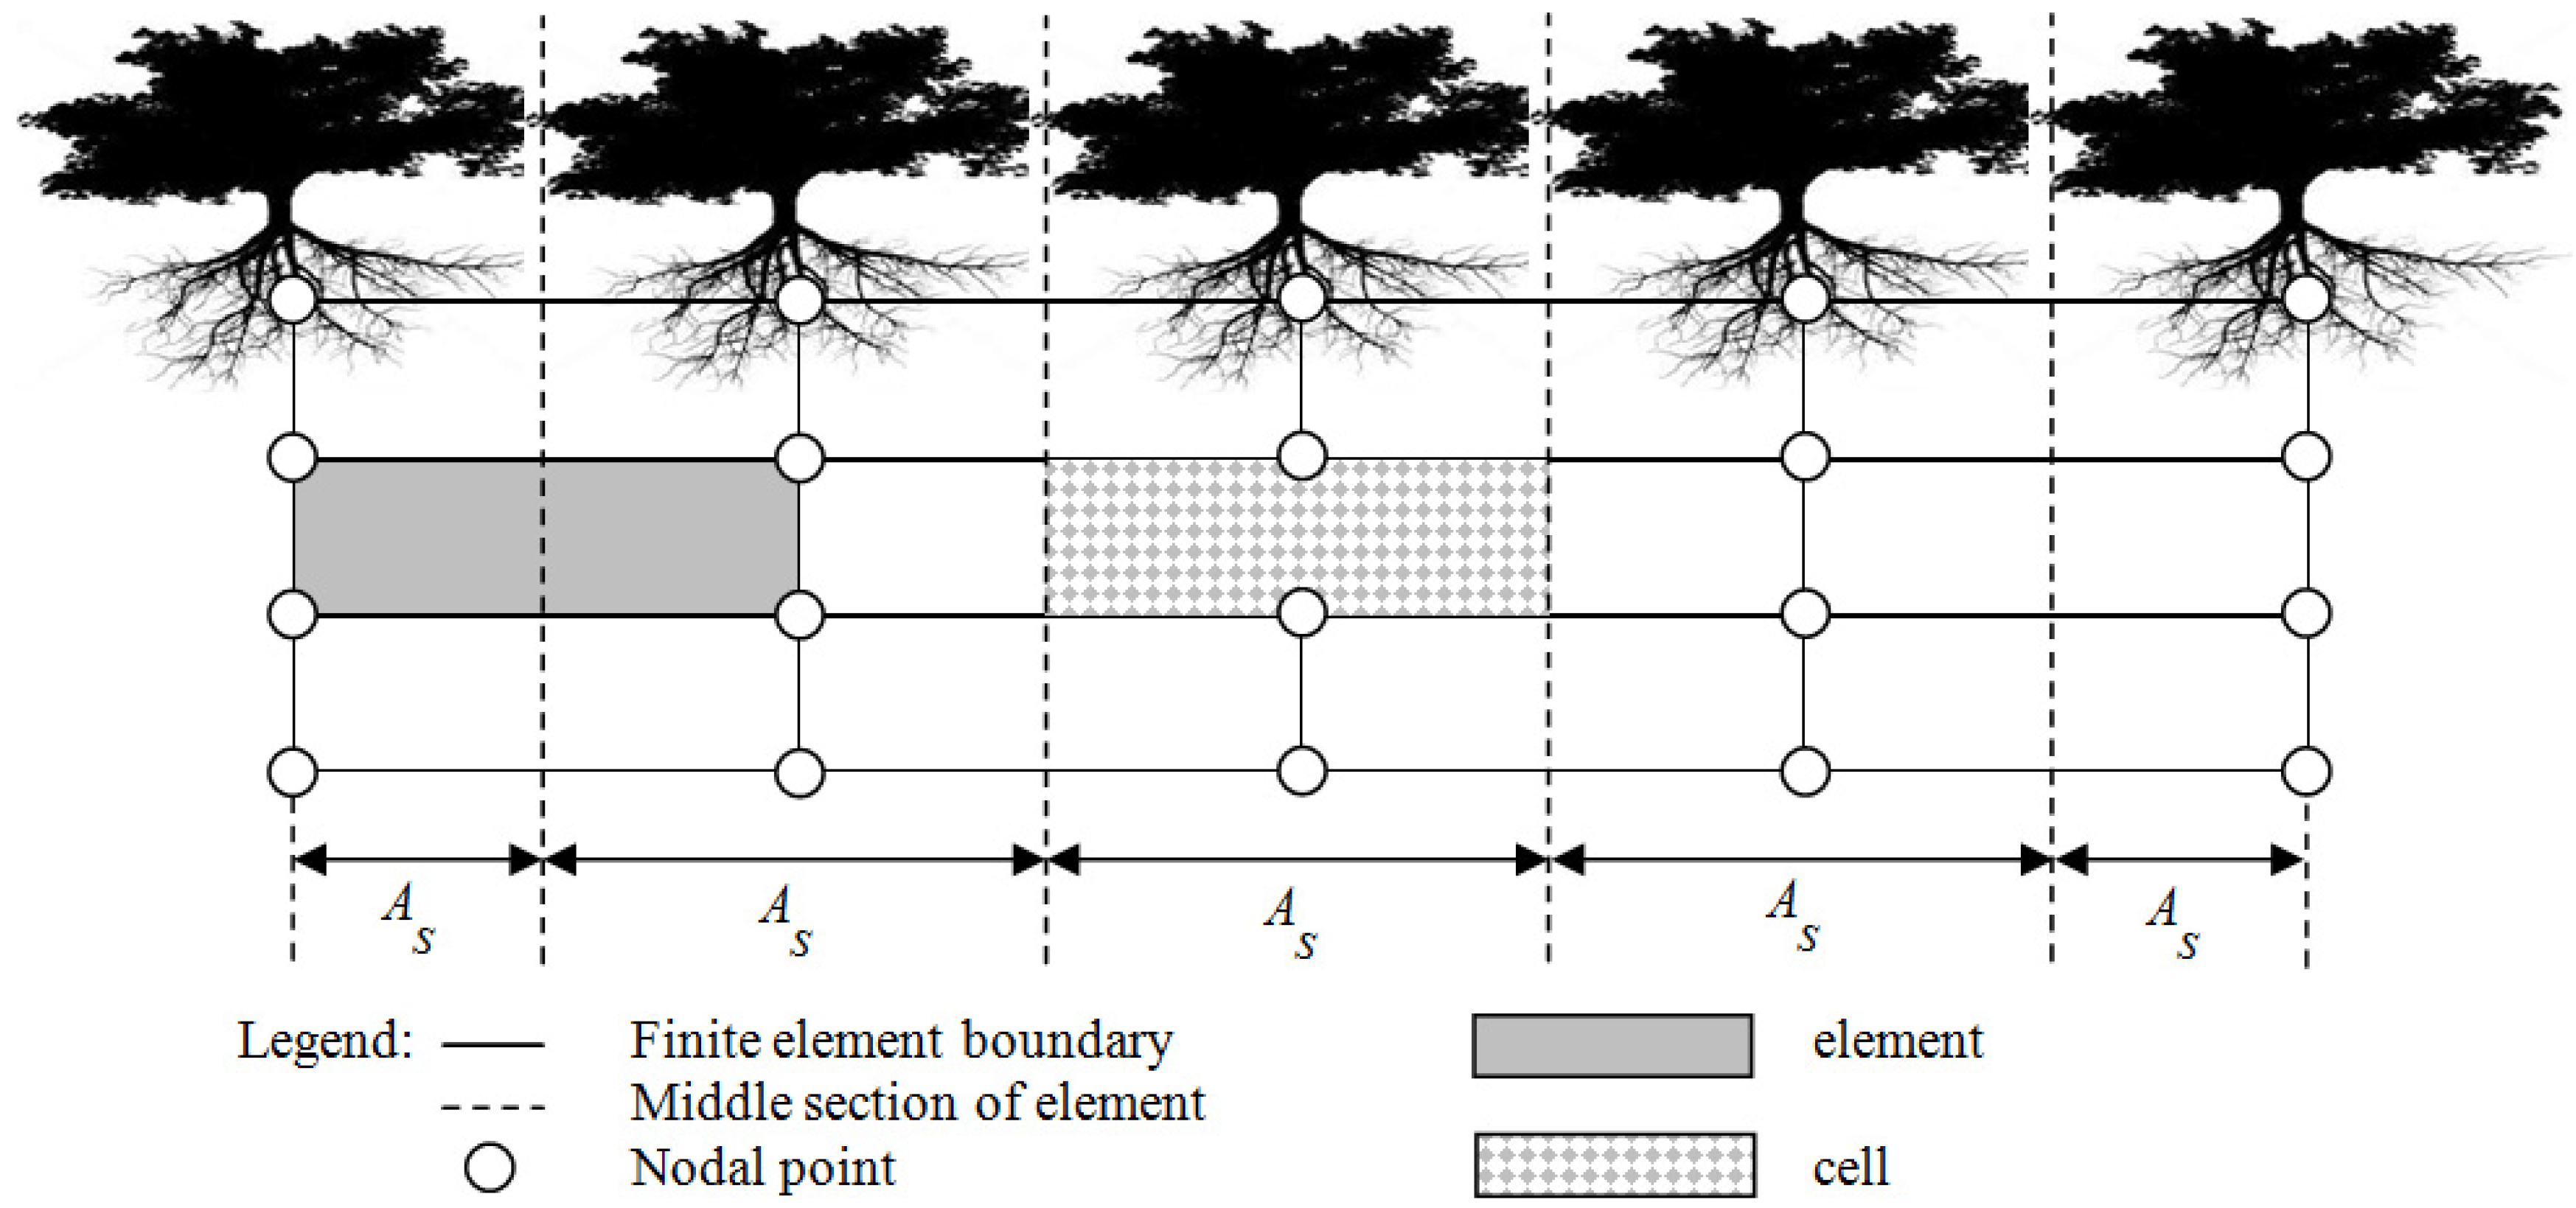
2.1. MANTRA Model
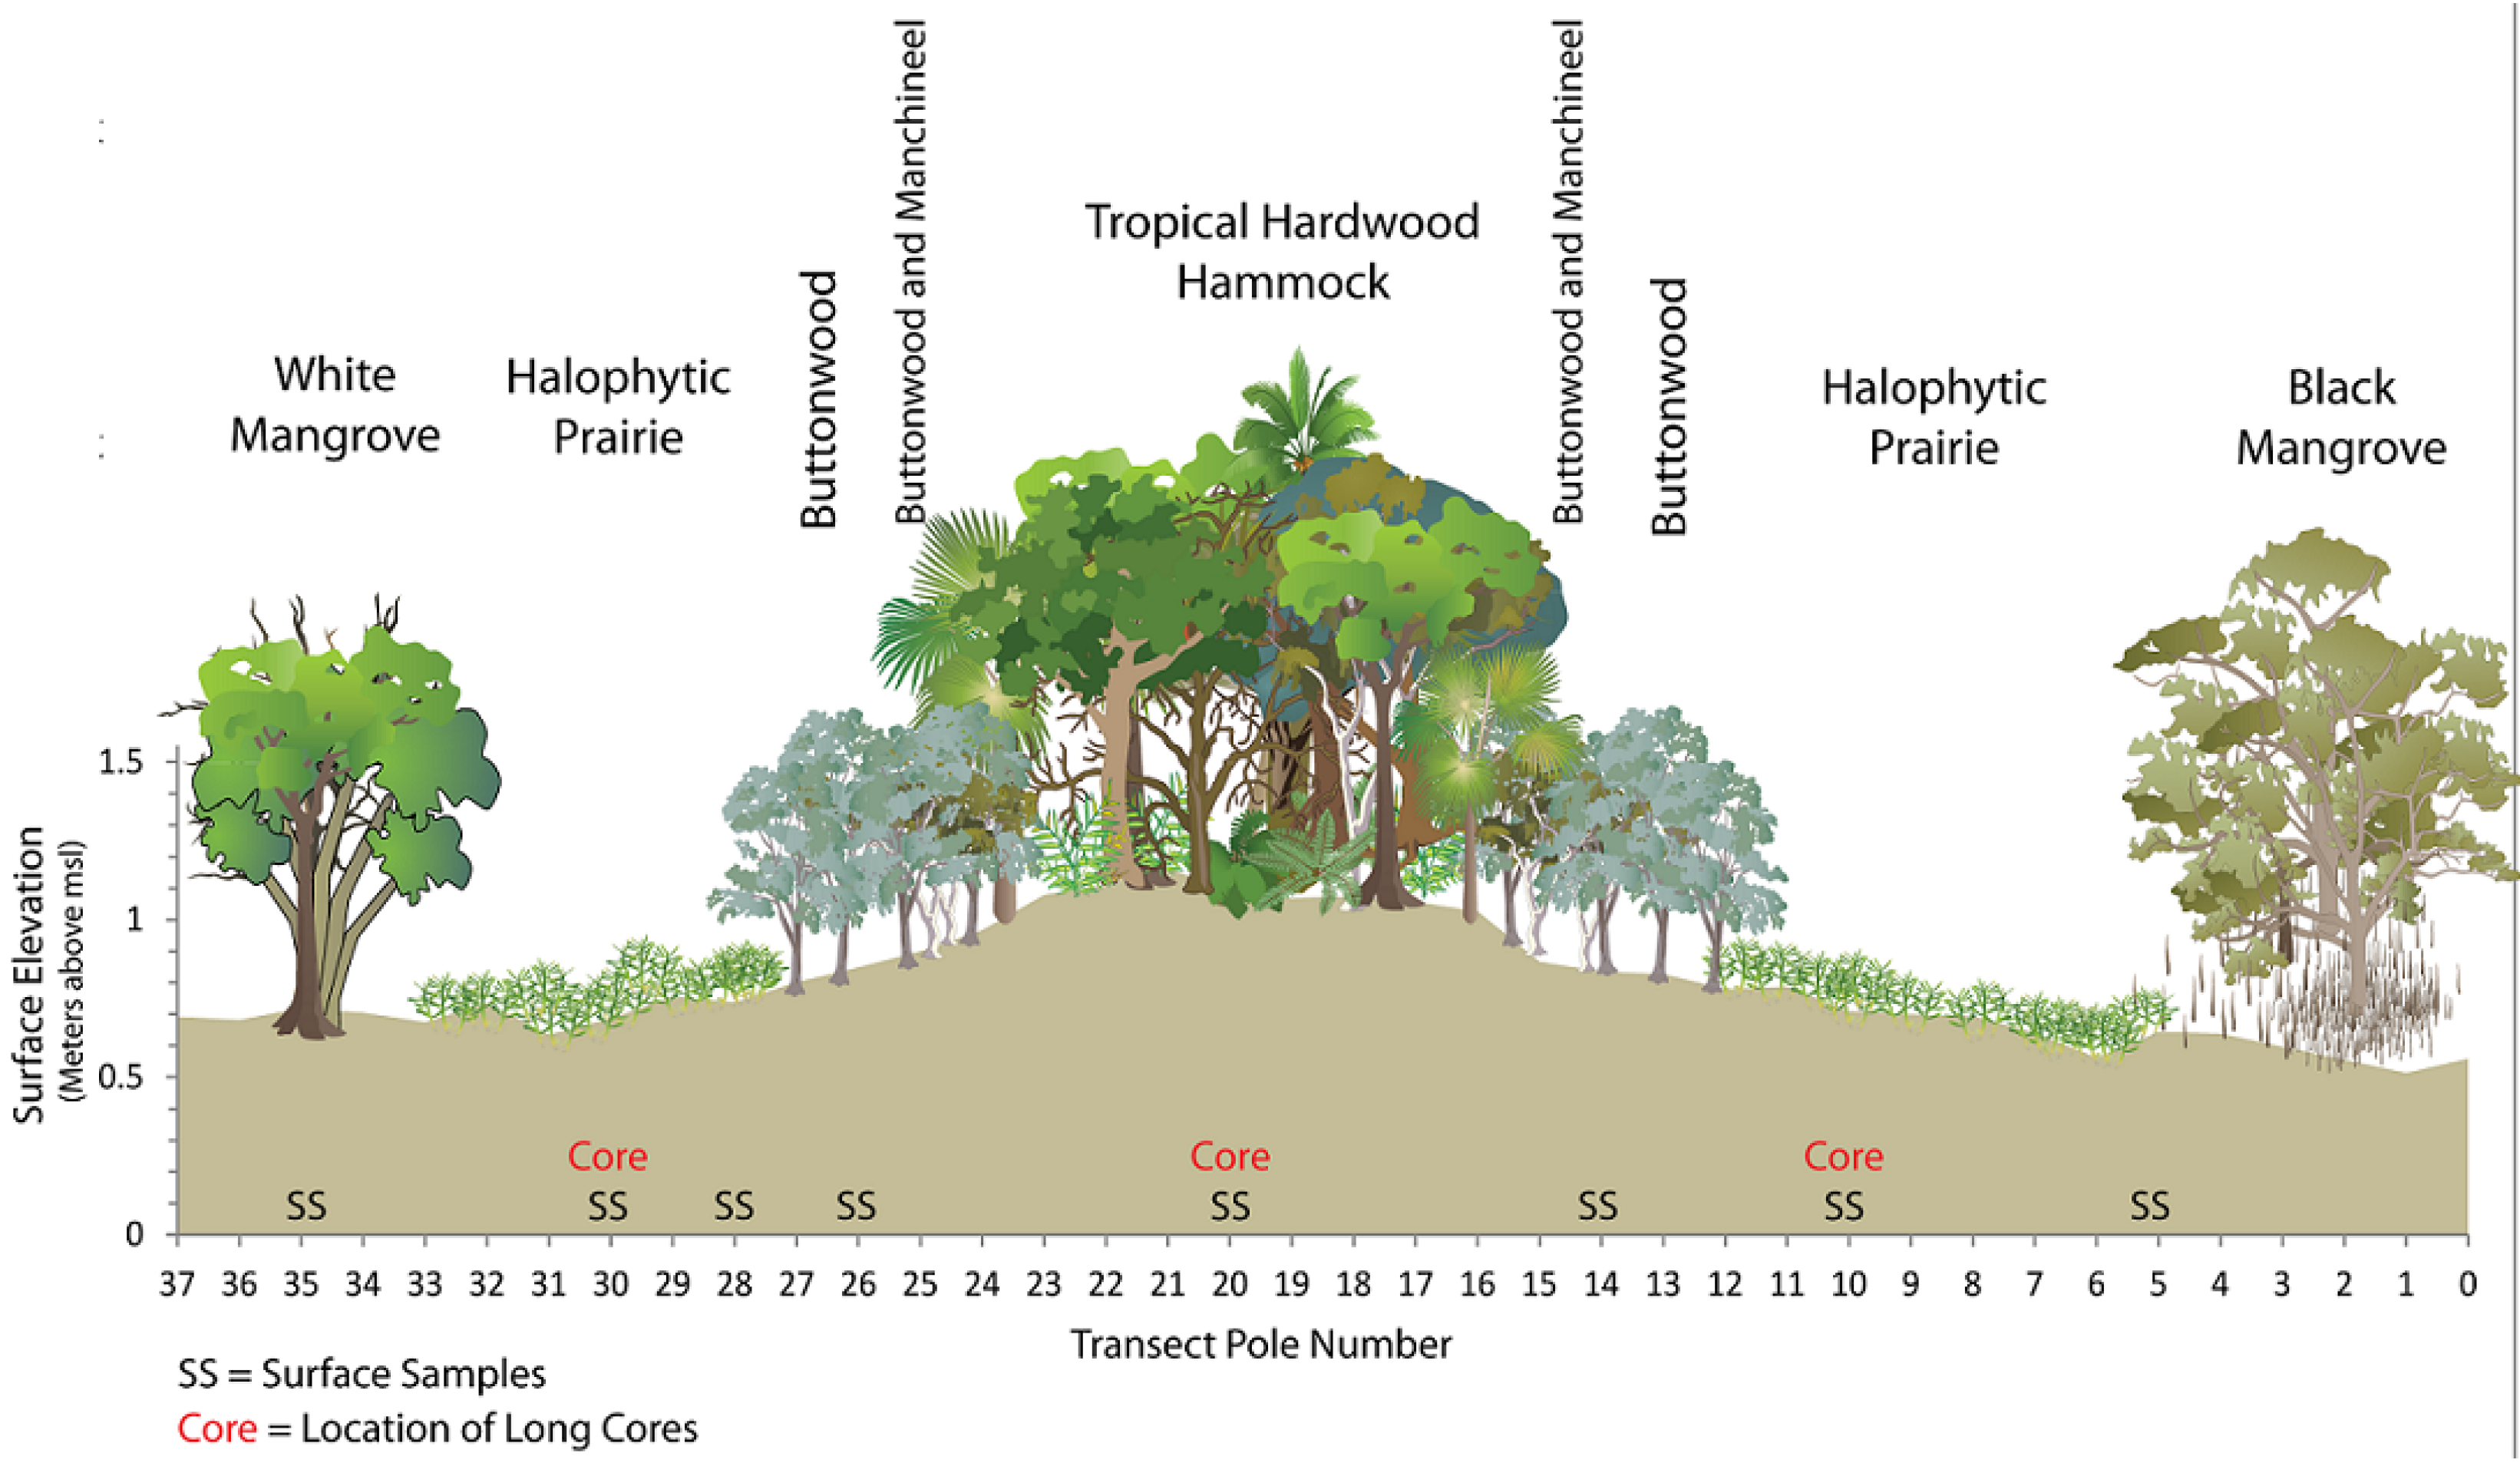
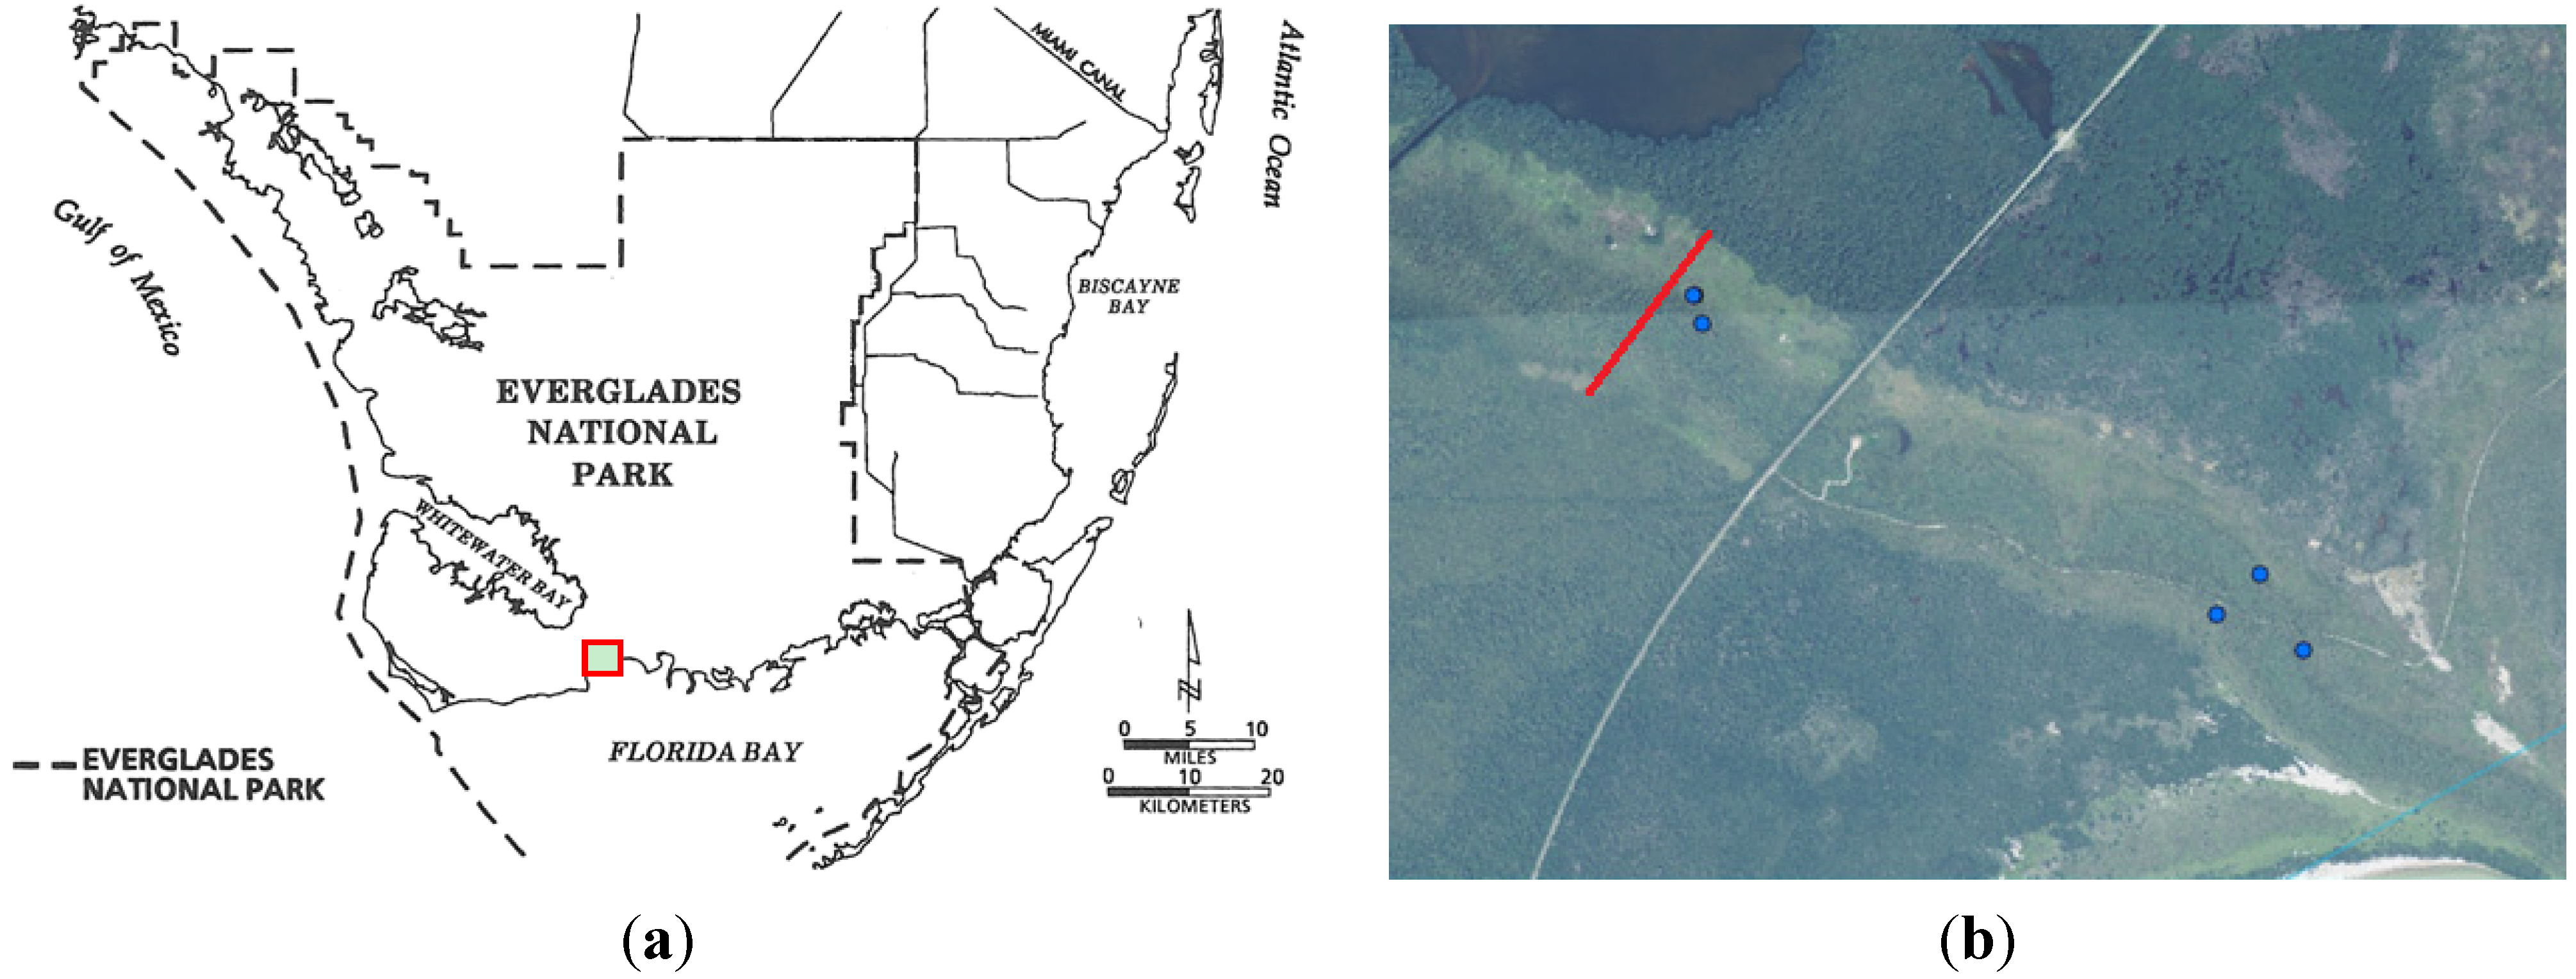
2.2. Study Transect


| Layer Name | Lower Boundary (m) | Hydraulic Conductivity (Qualitative) (m/Day) | |
|---|---|---|---|
| Marl plus peat | ~2–3 | low | <0.3 |
| karst | ~6 | high | >1000 |
| sand | ~9 | medium | 10 to 100 |
| noflow | ~9 | ||
2.3. Model Simulations
2.3.1. Scenario 1: Existing Conditions
2.3.2. Scenarios 2 and 3: Storm Surges
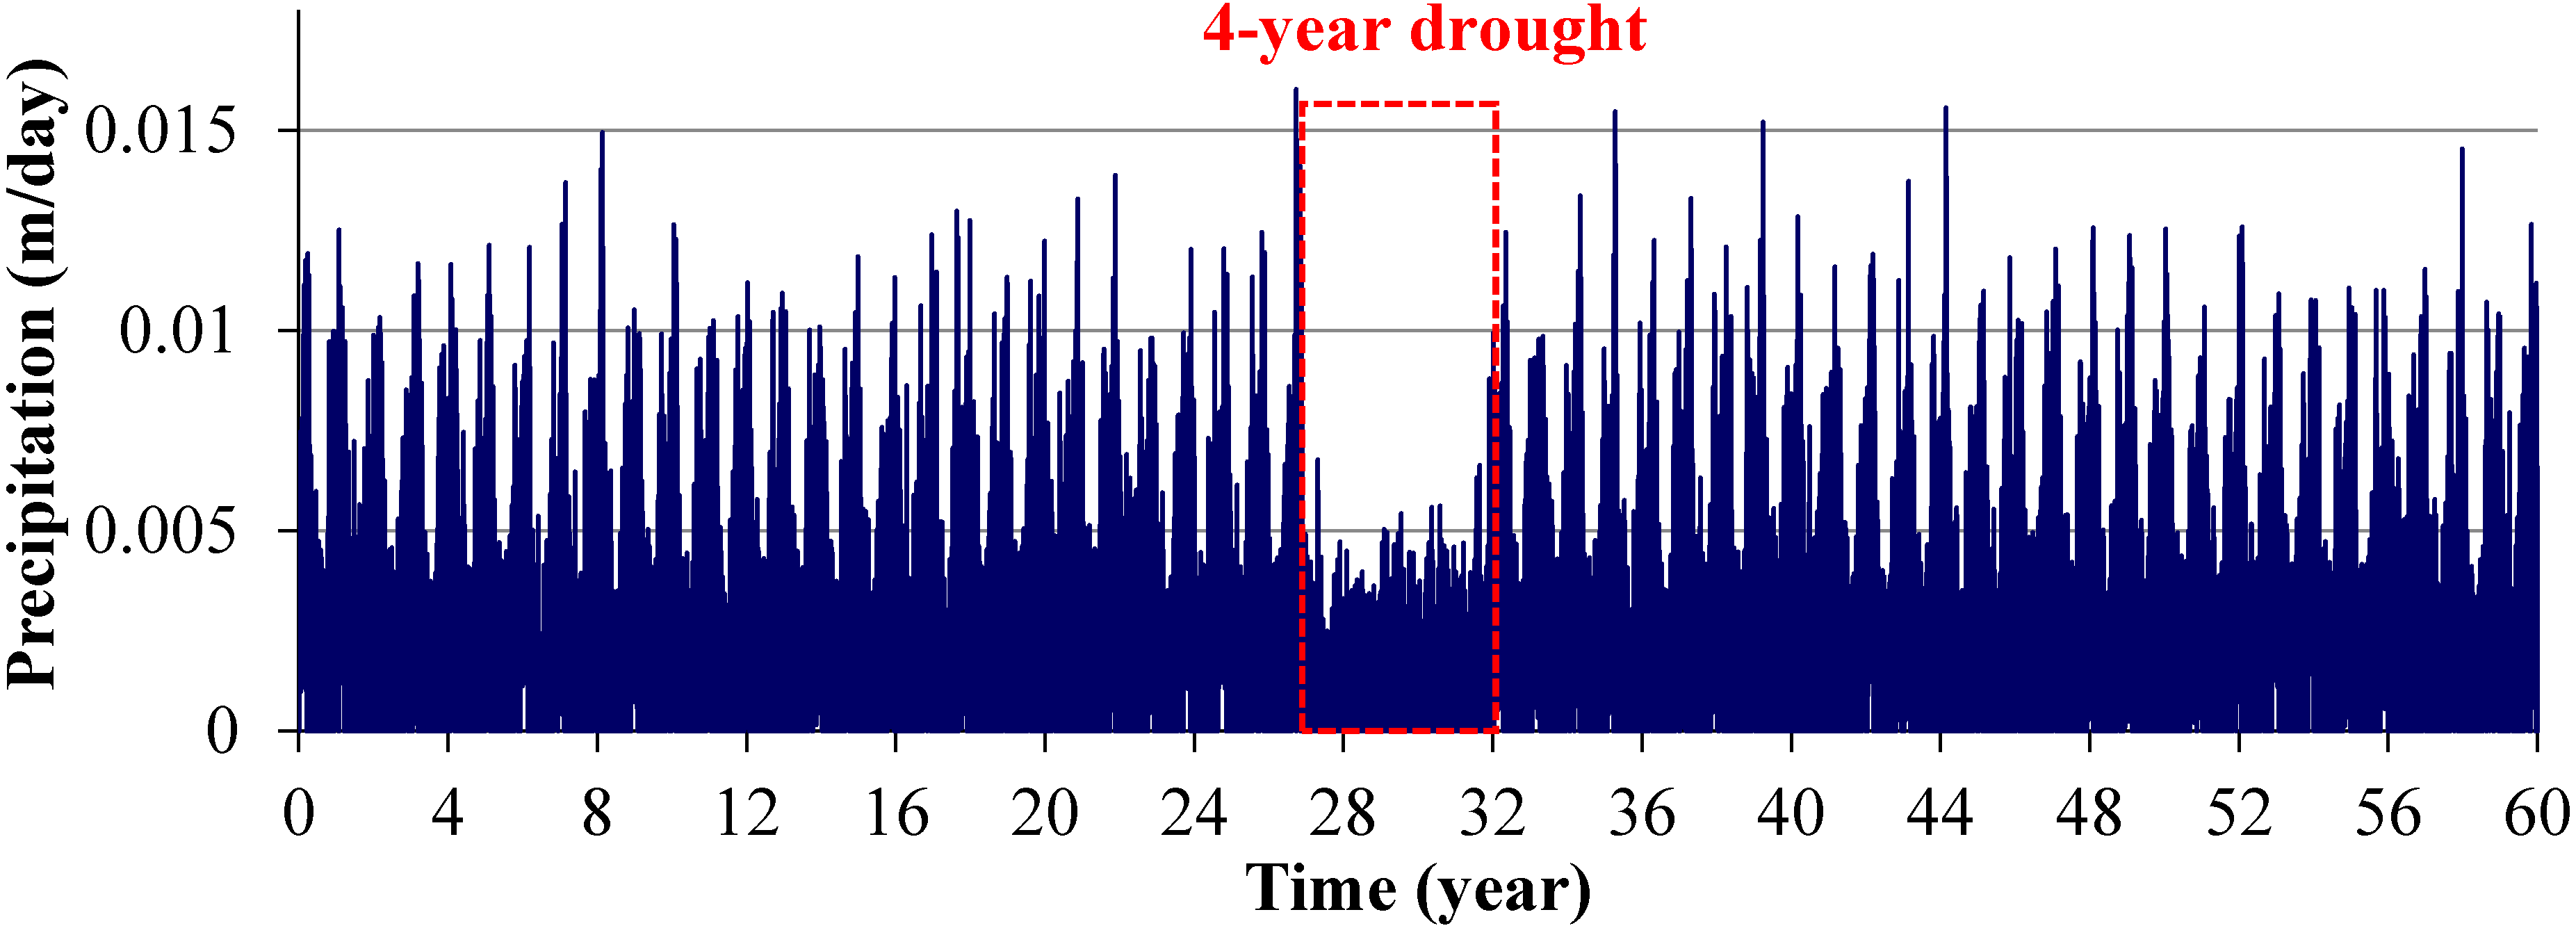
2.3.3. Scenario 4: Gradual SLR
3. Results
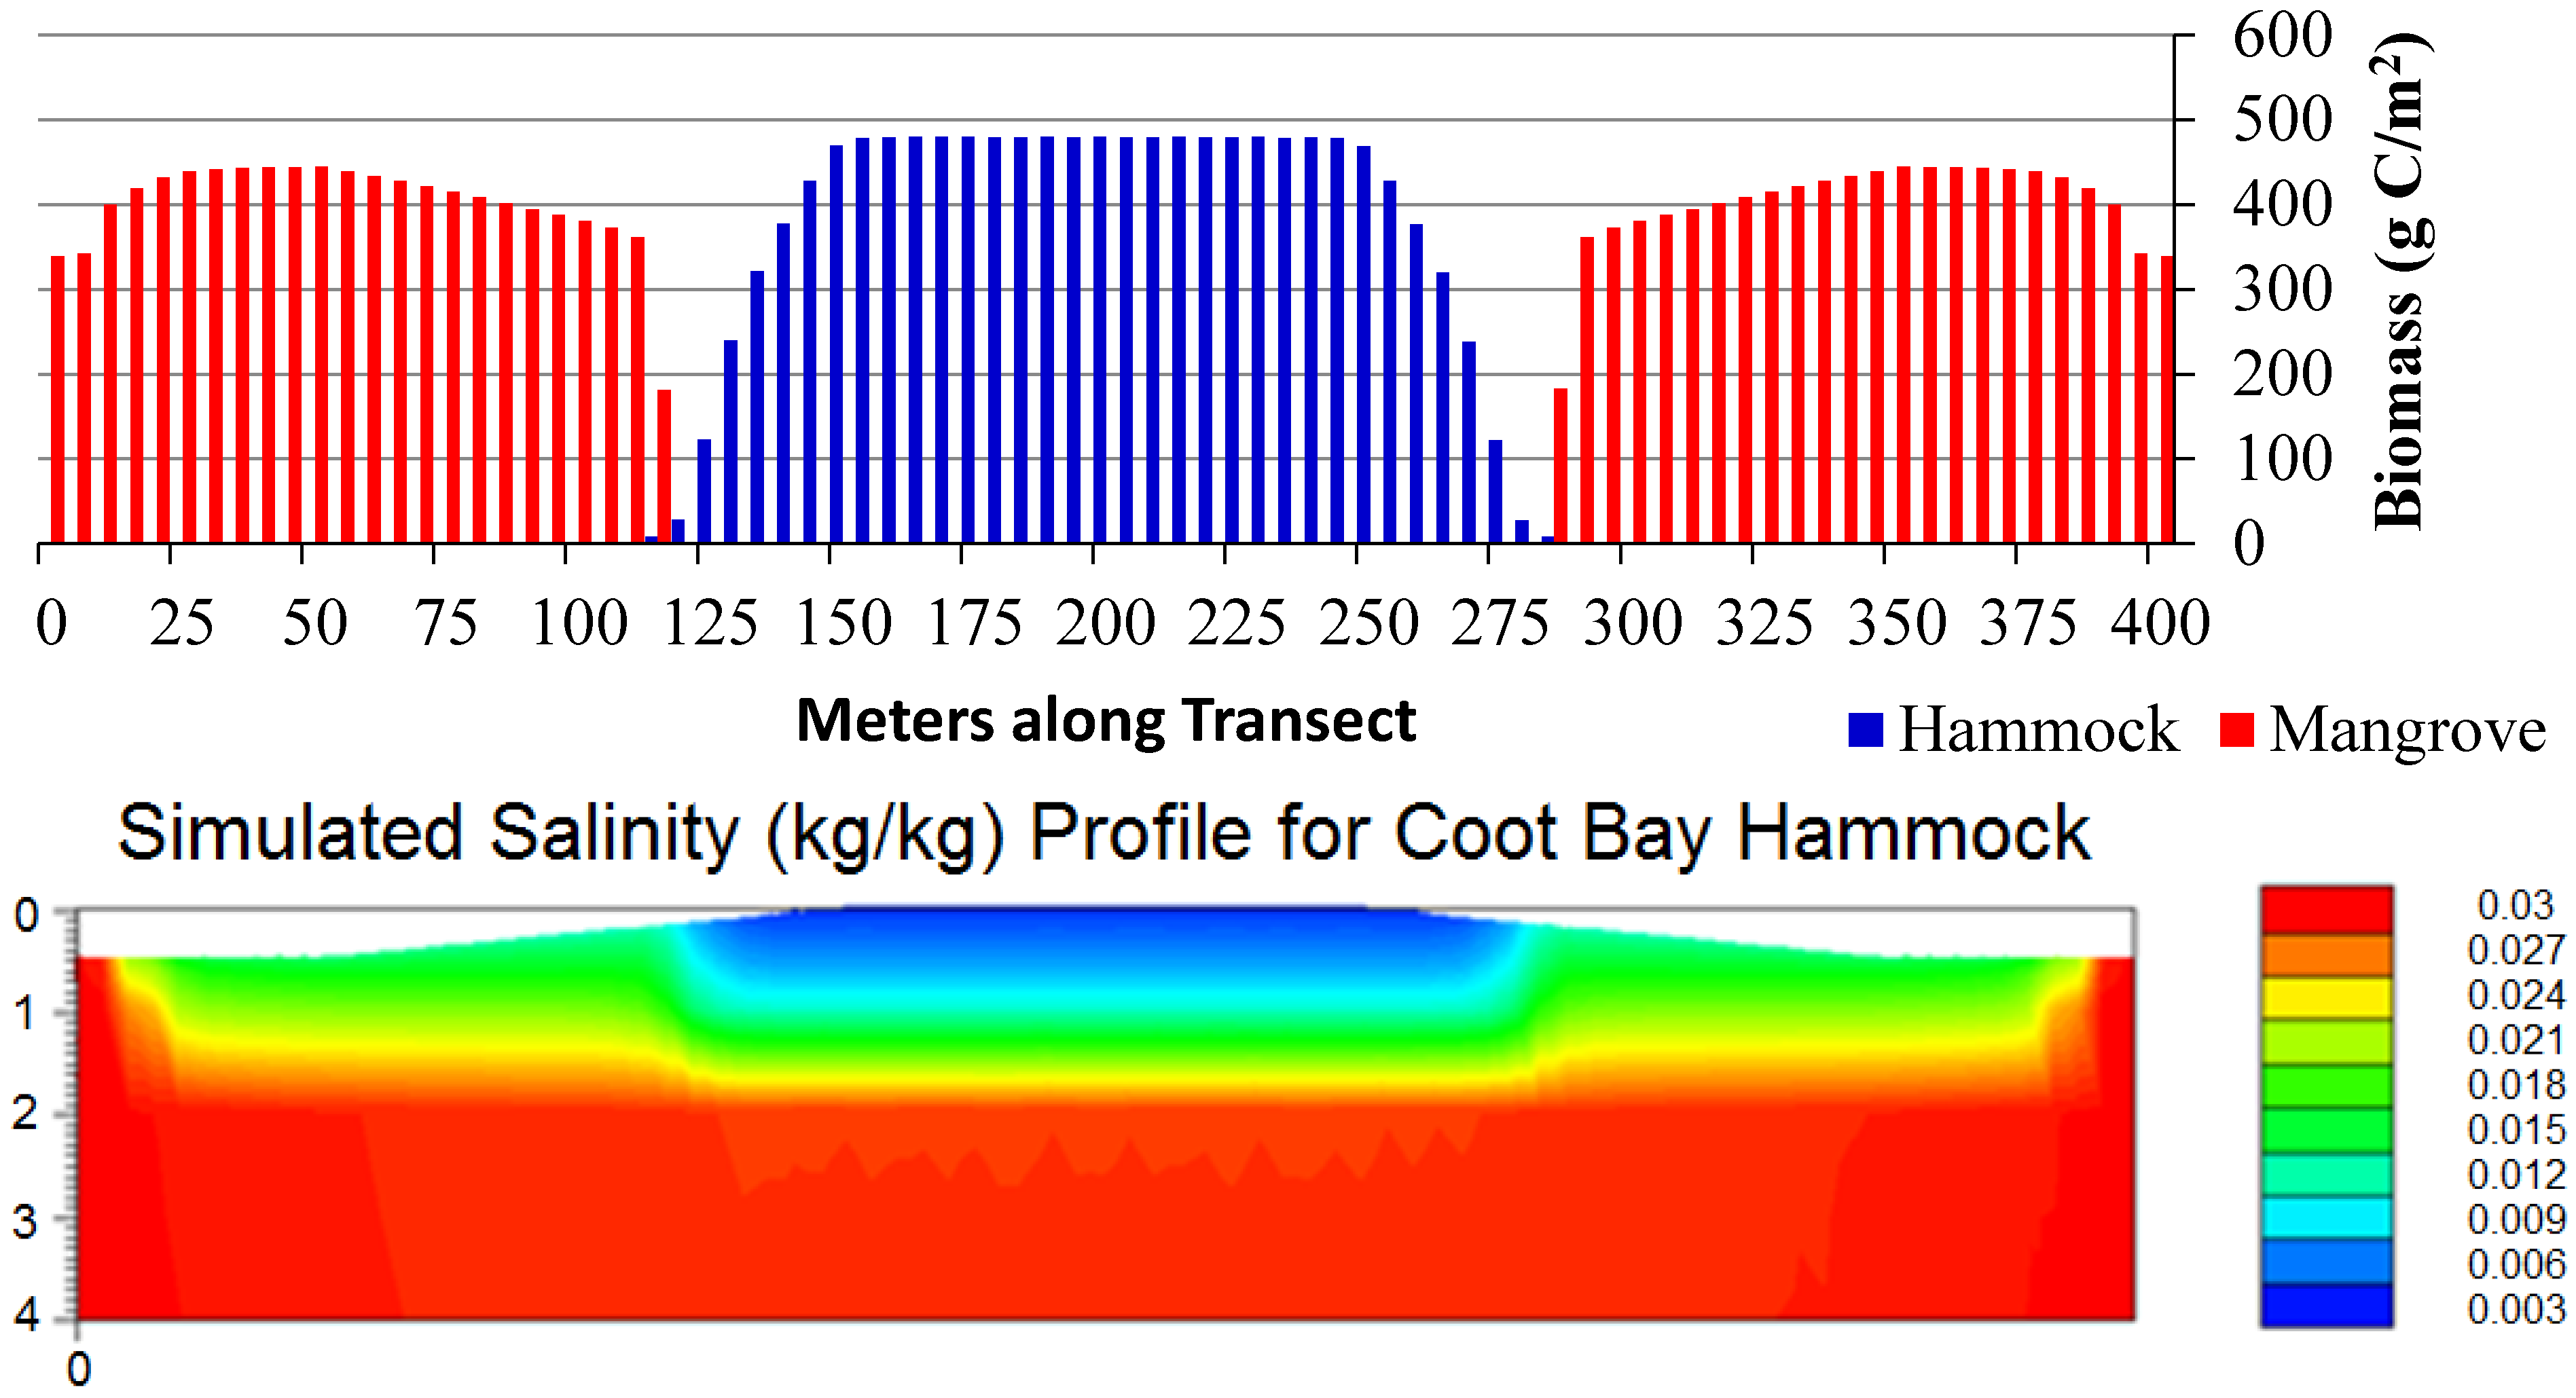
3.1. Scenario 1: Existing Conditions
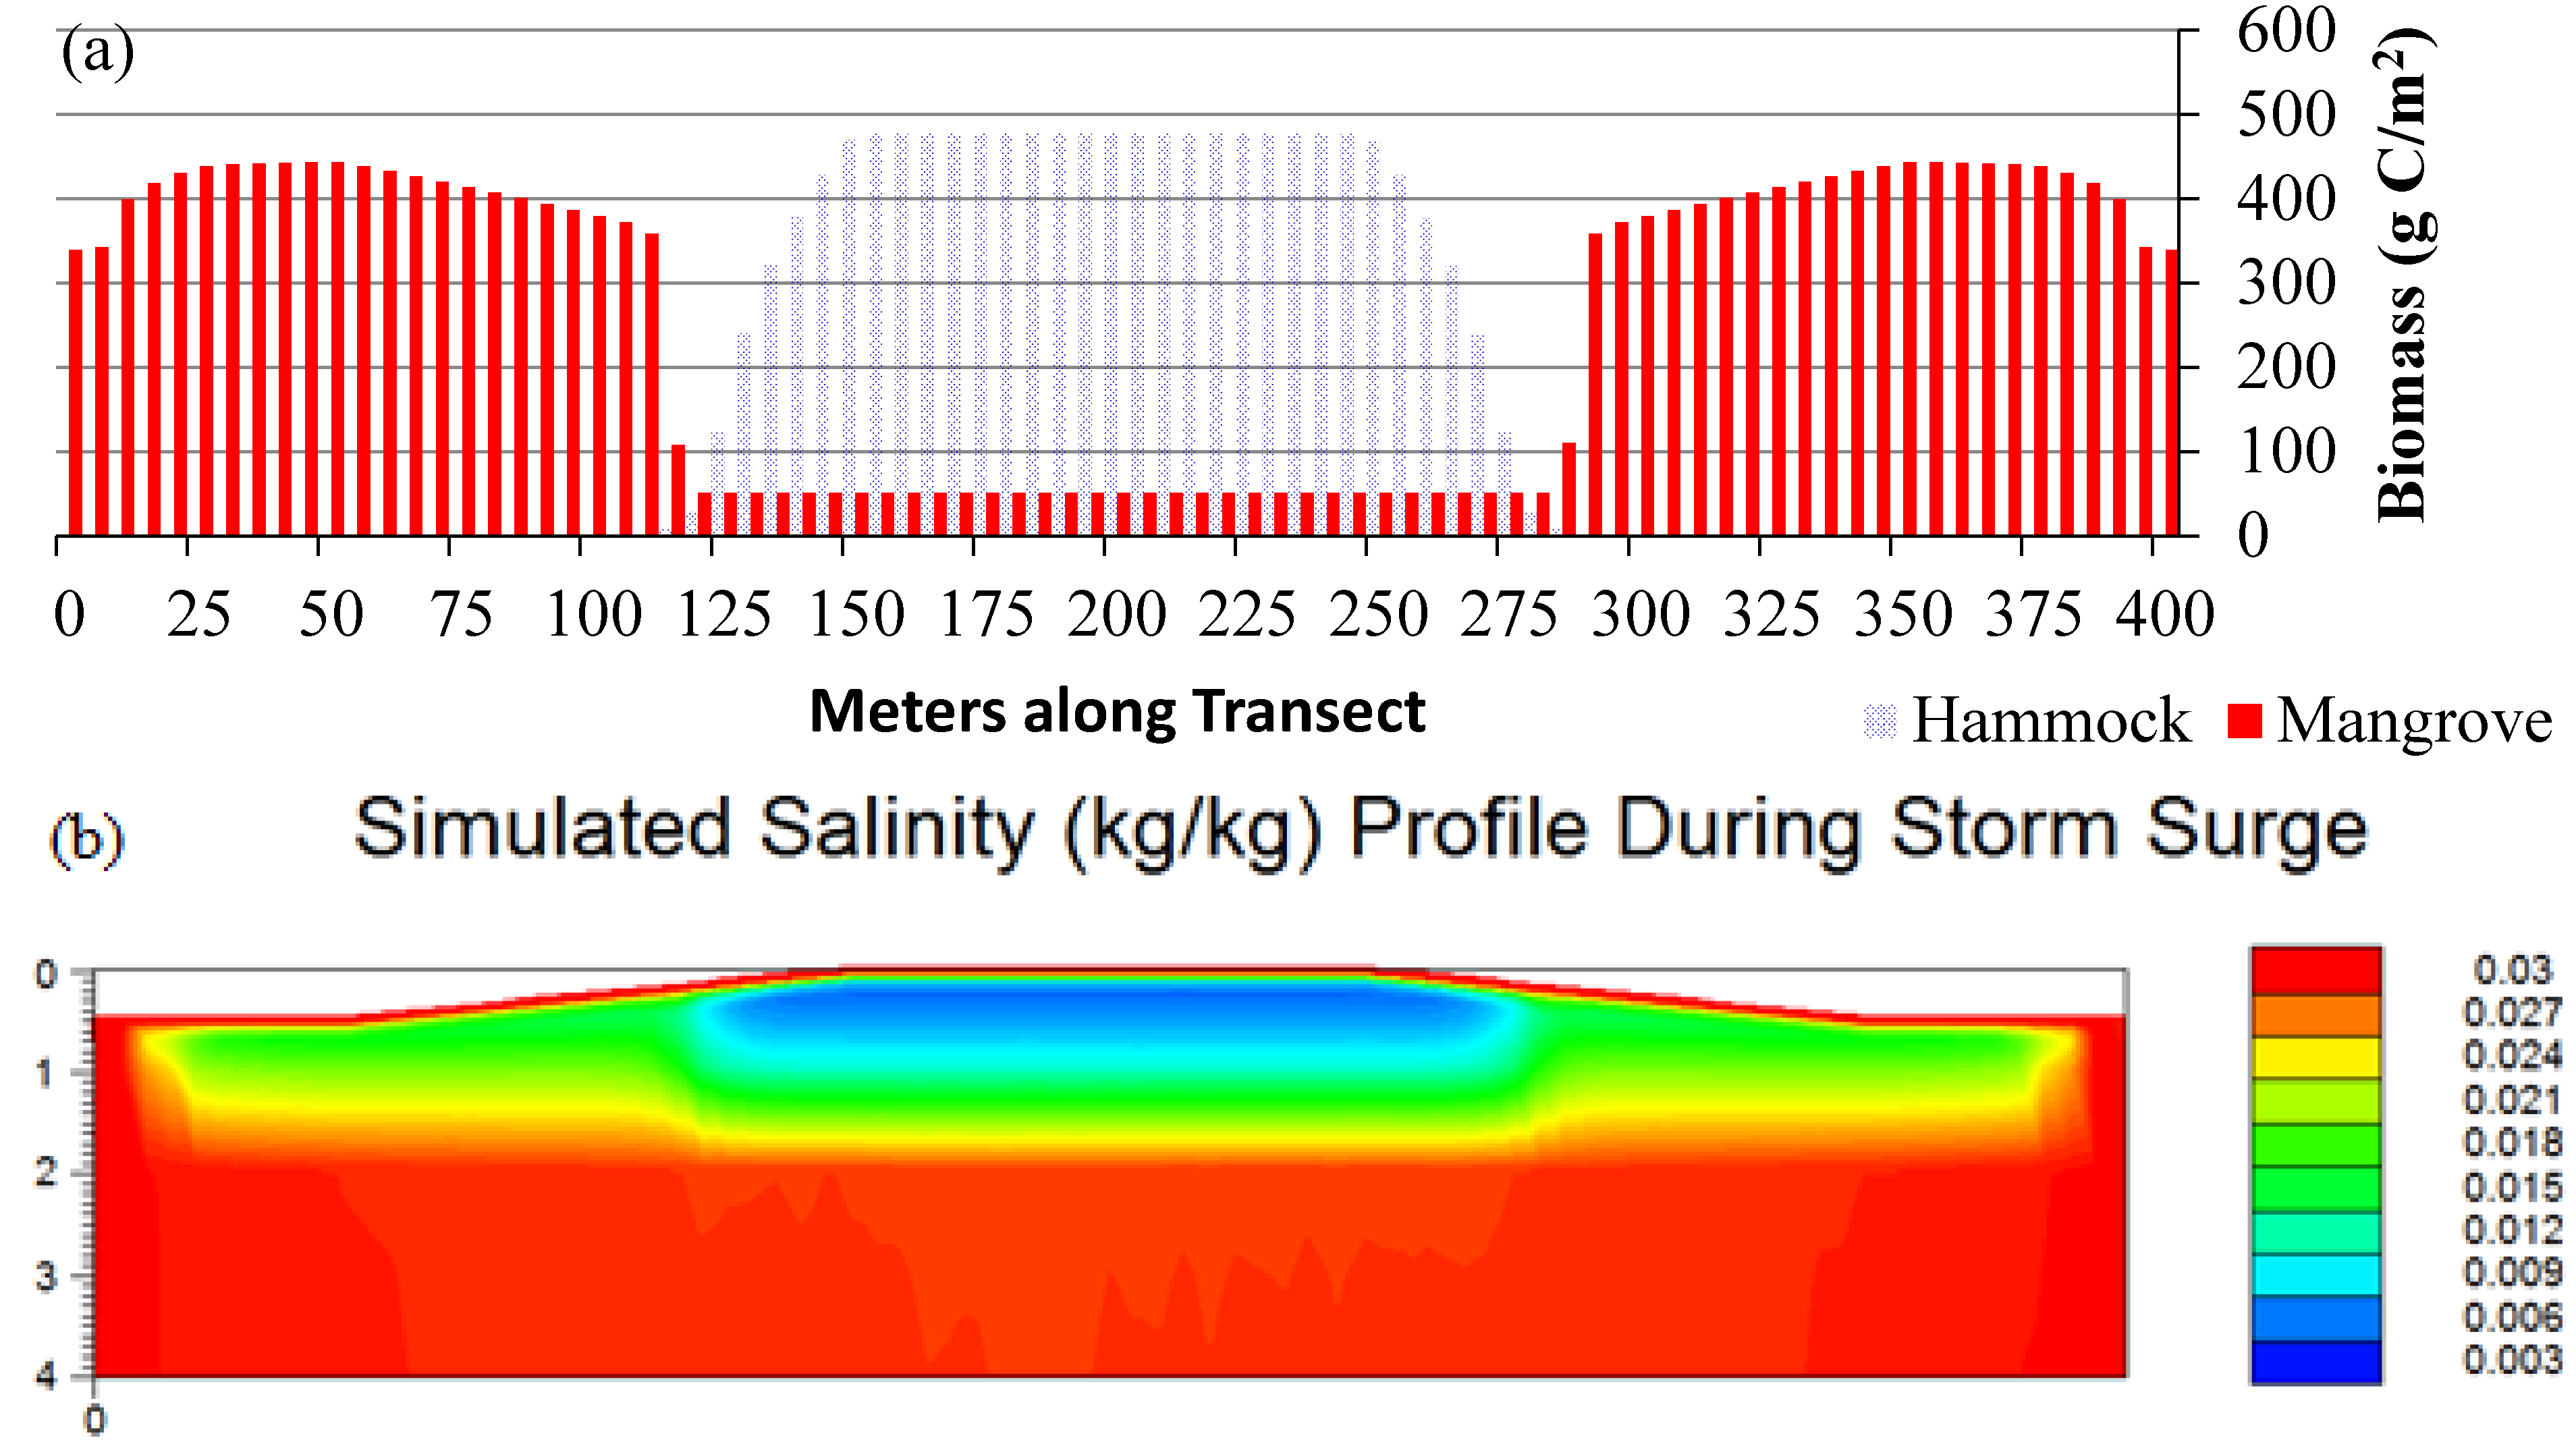
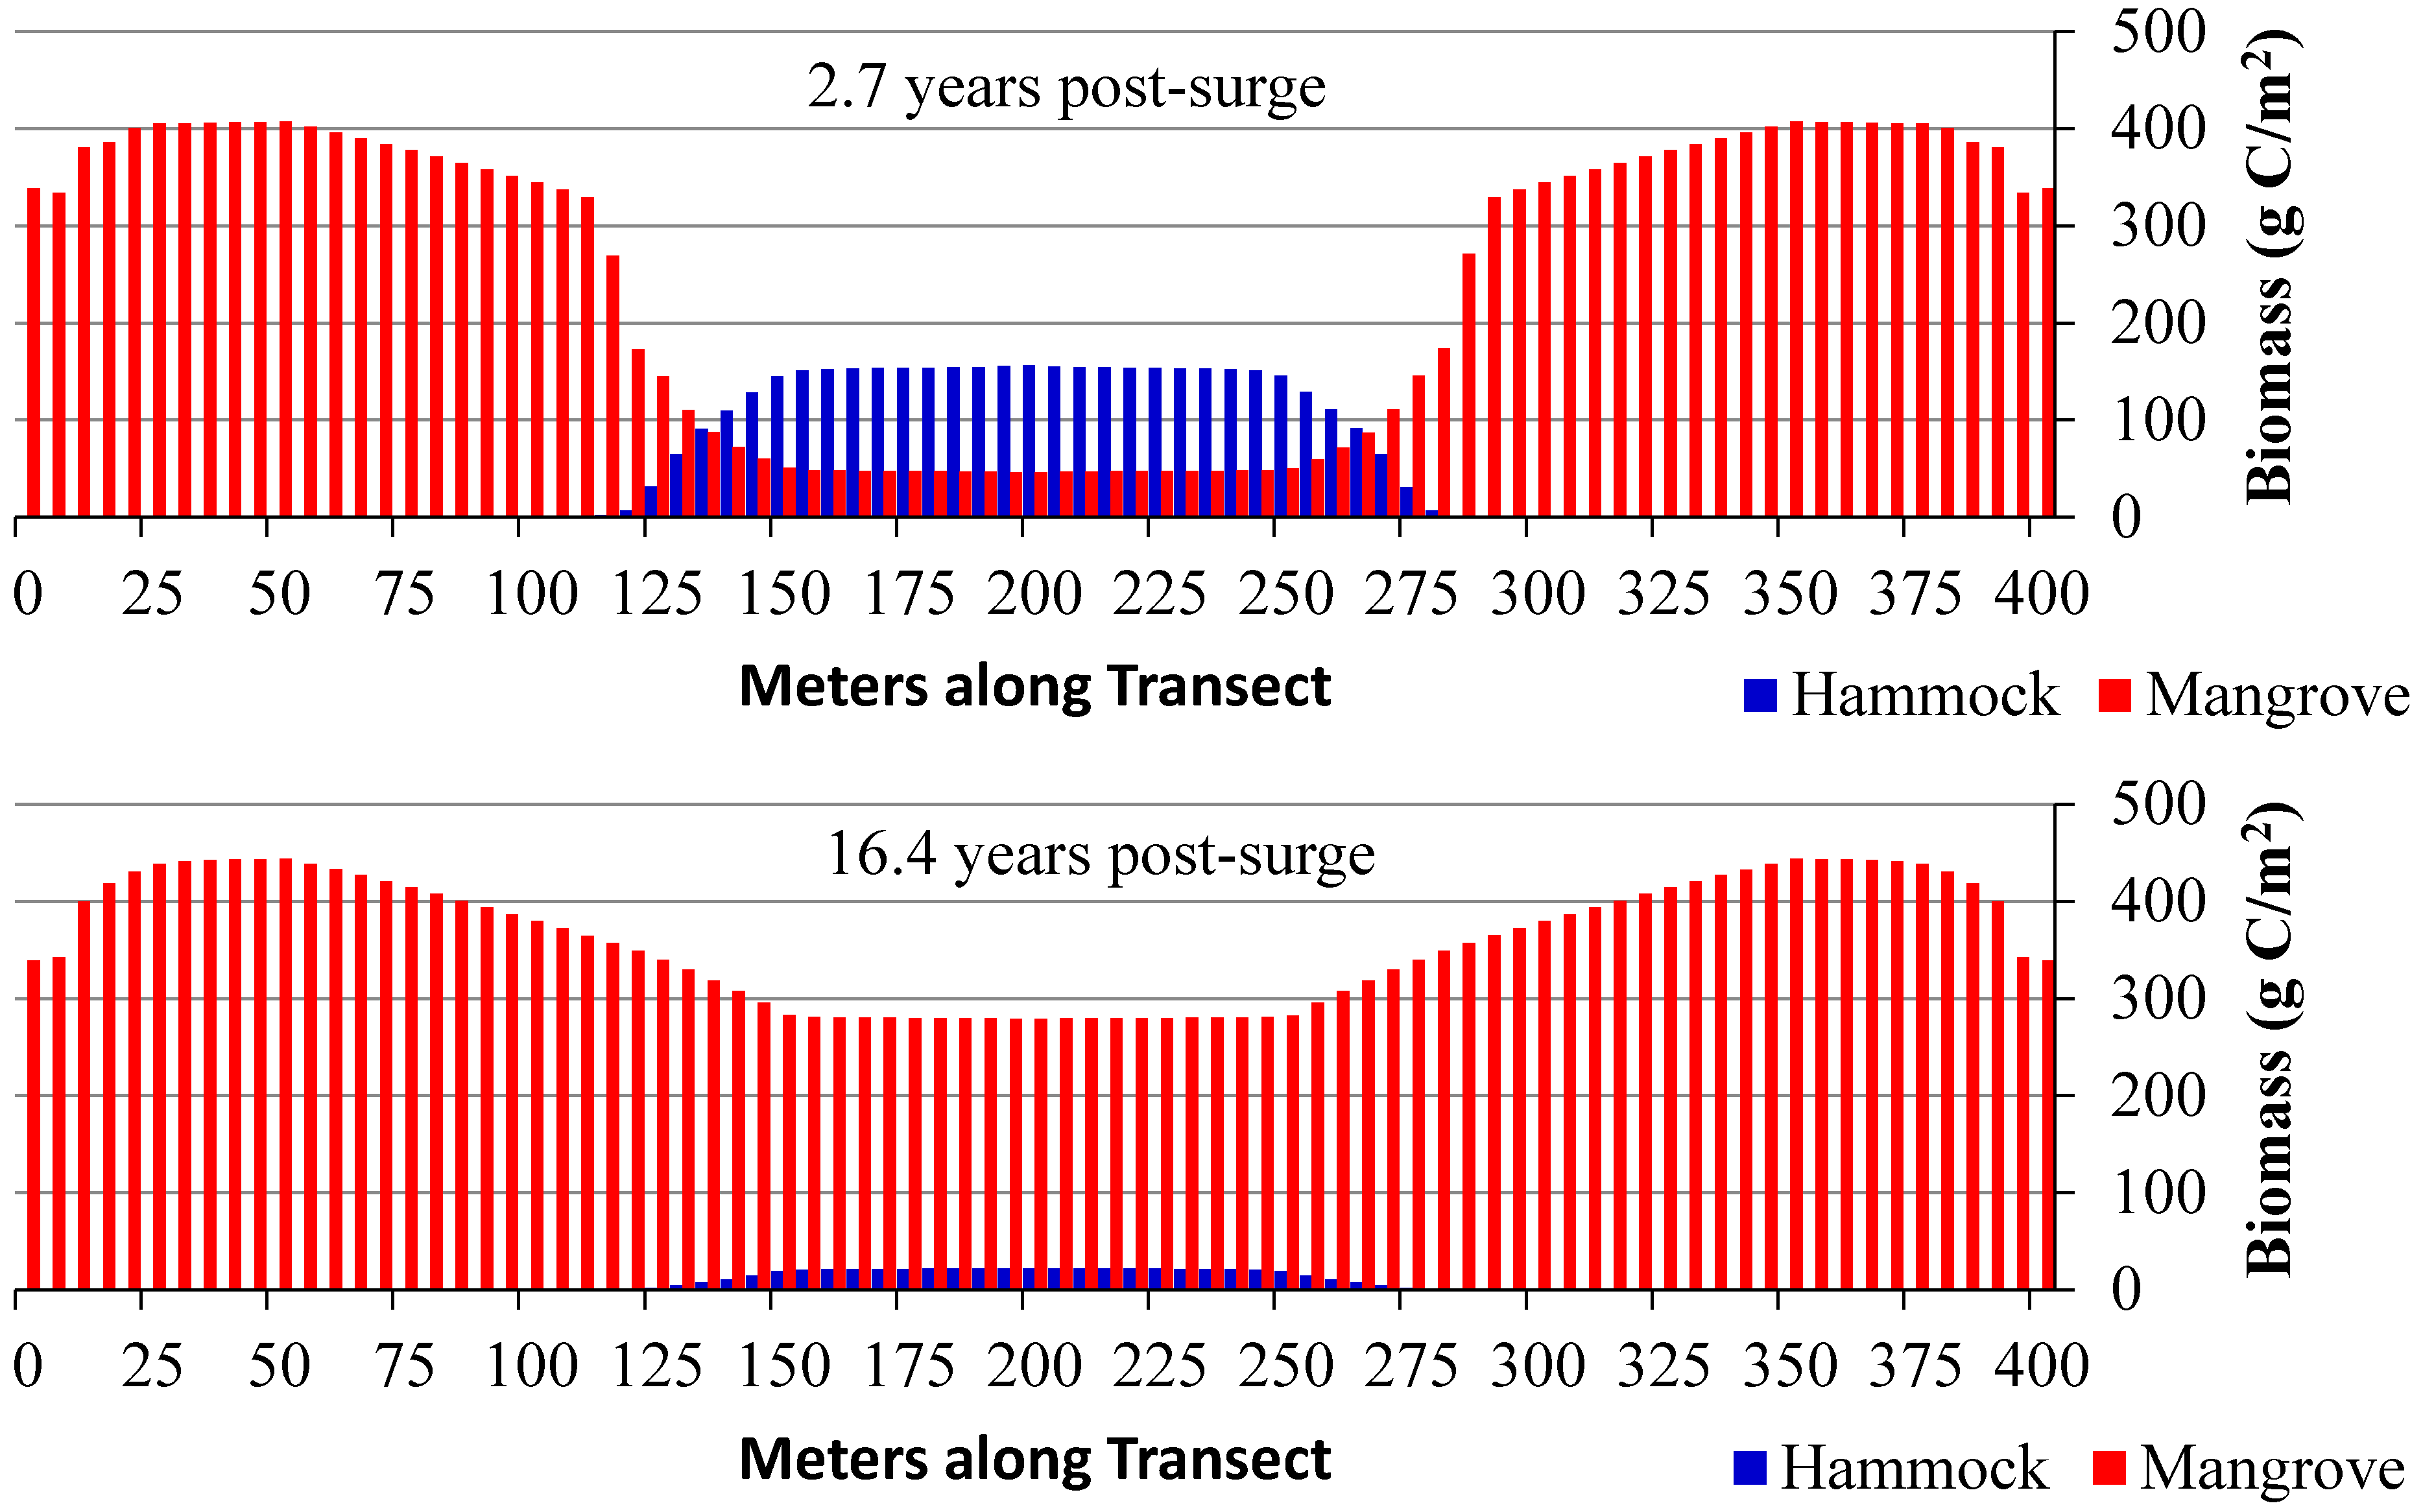
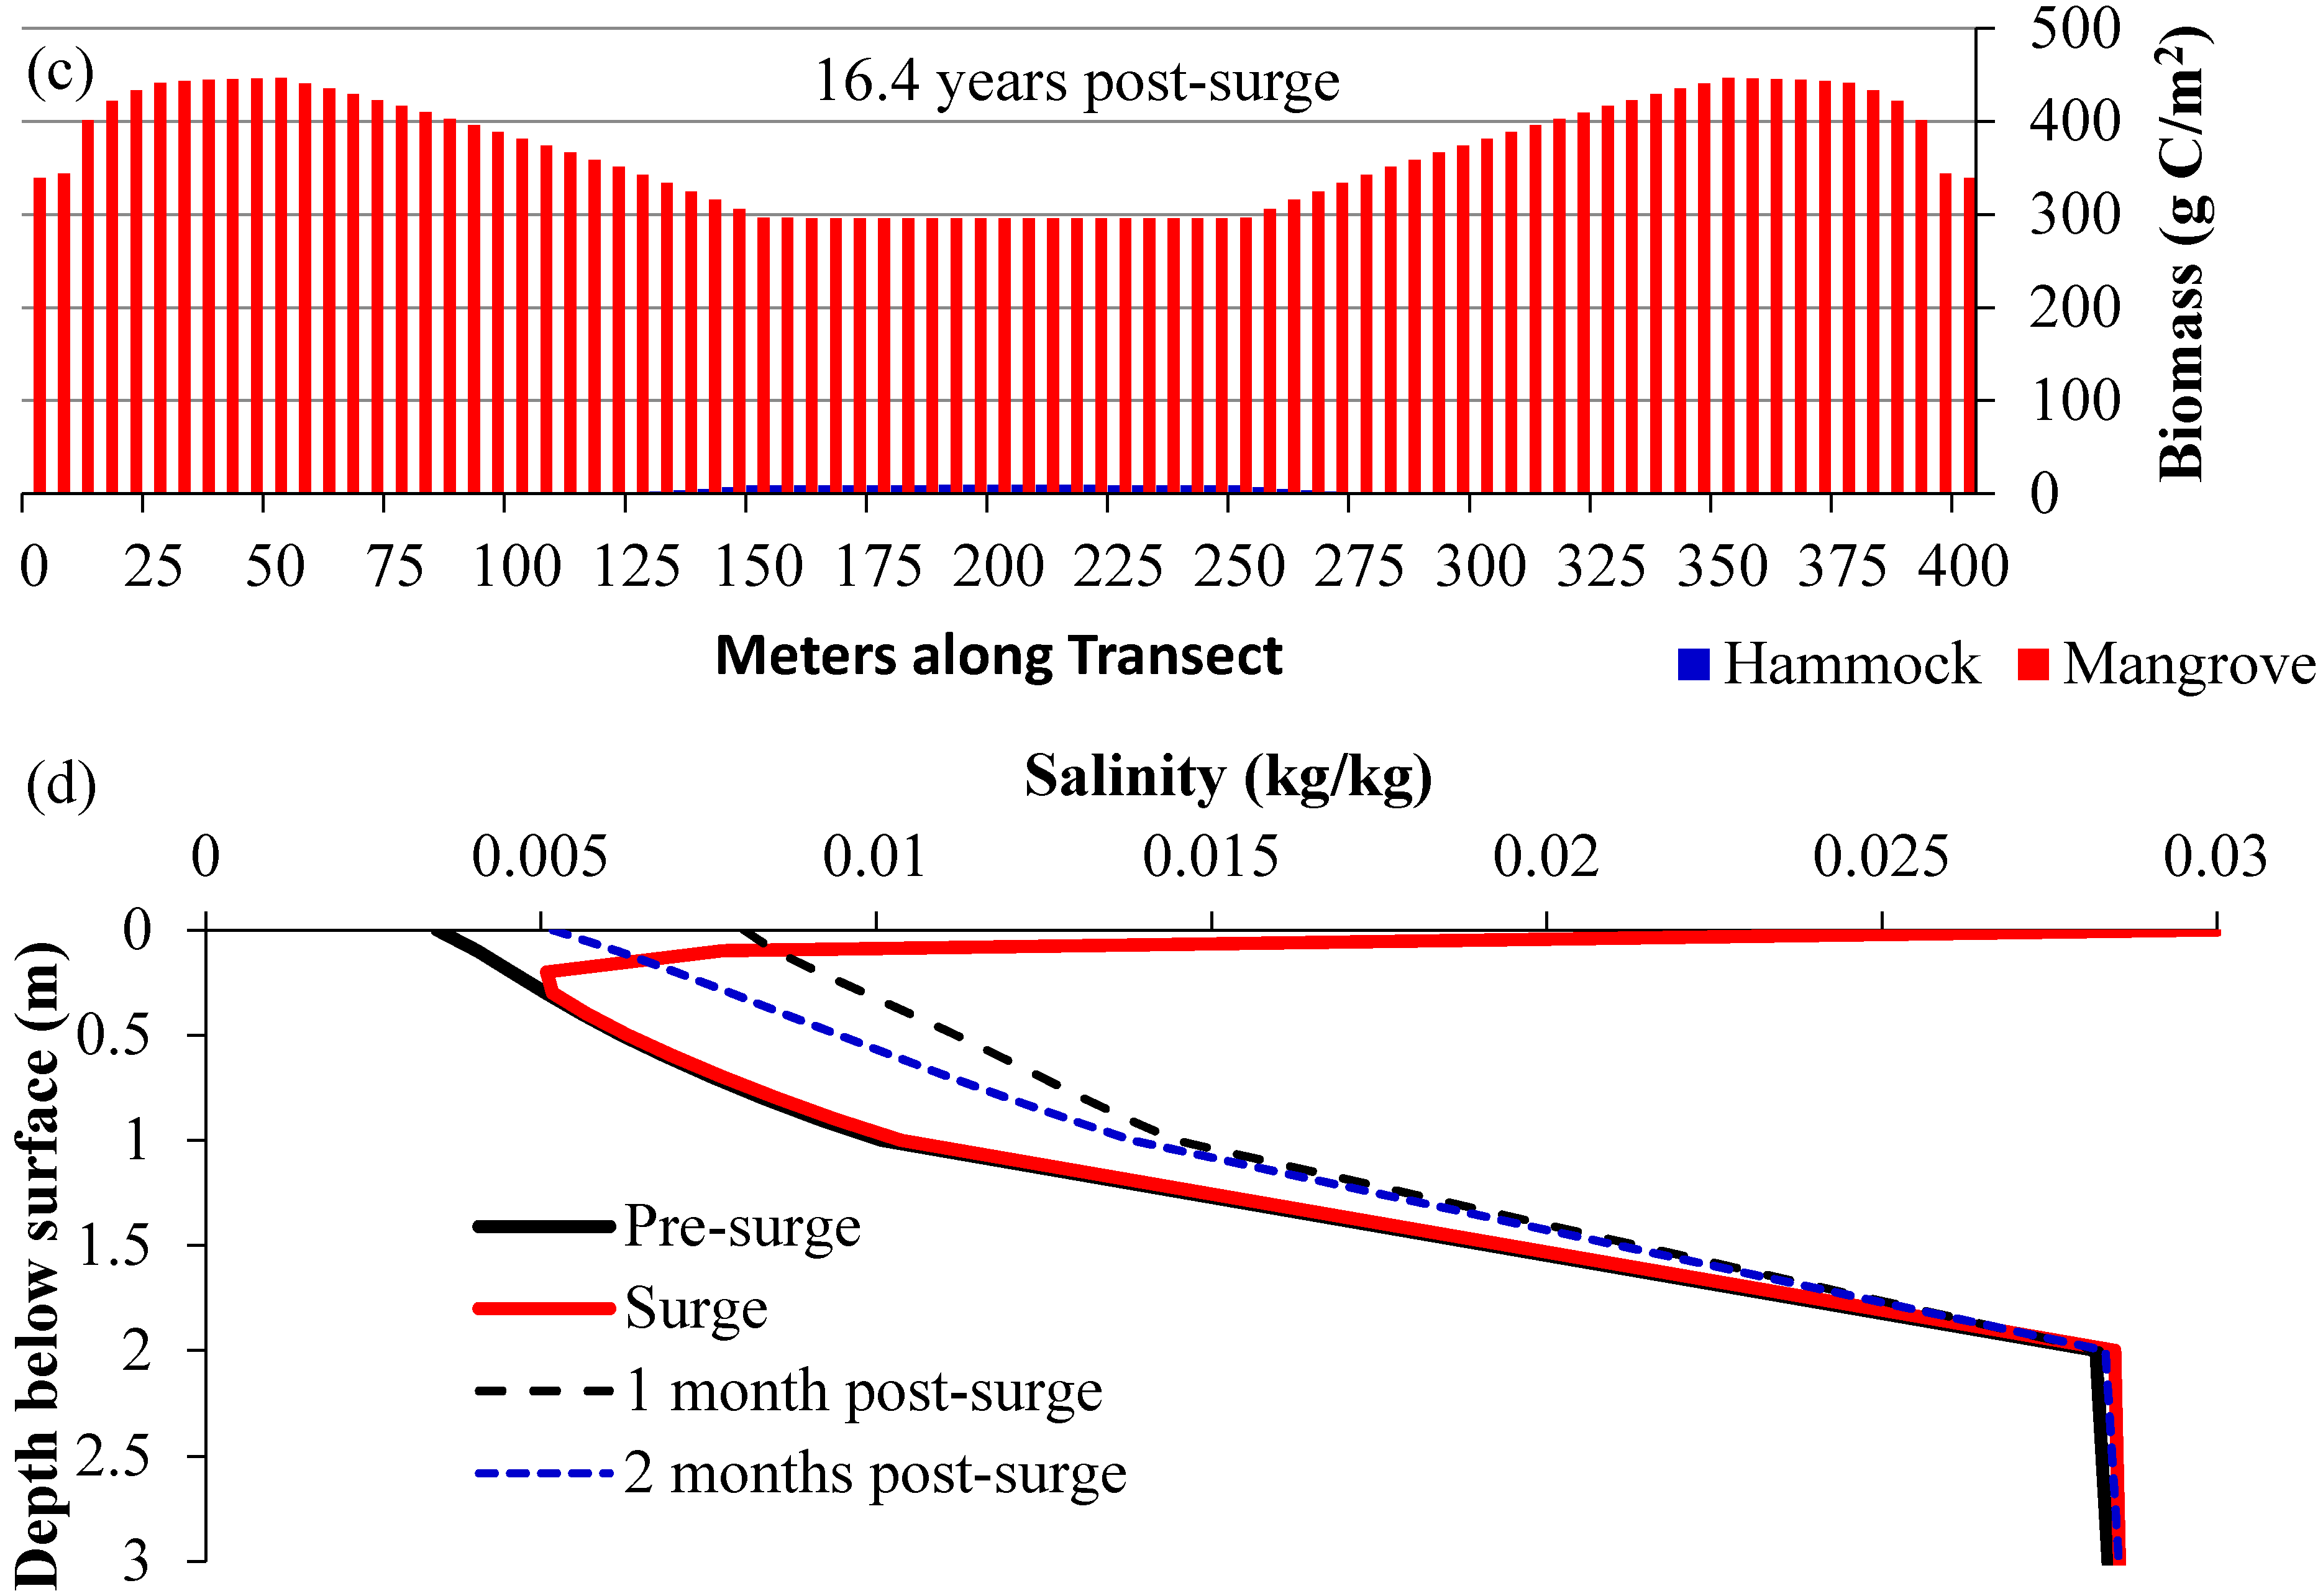
3.2. Scenarios 2 and 3: Storm Surges


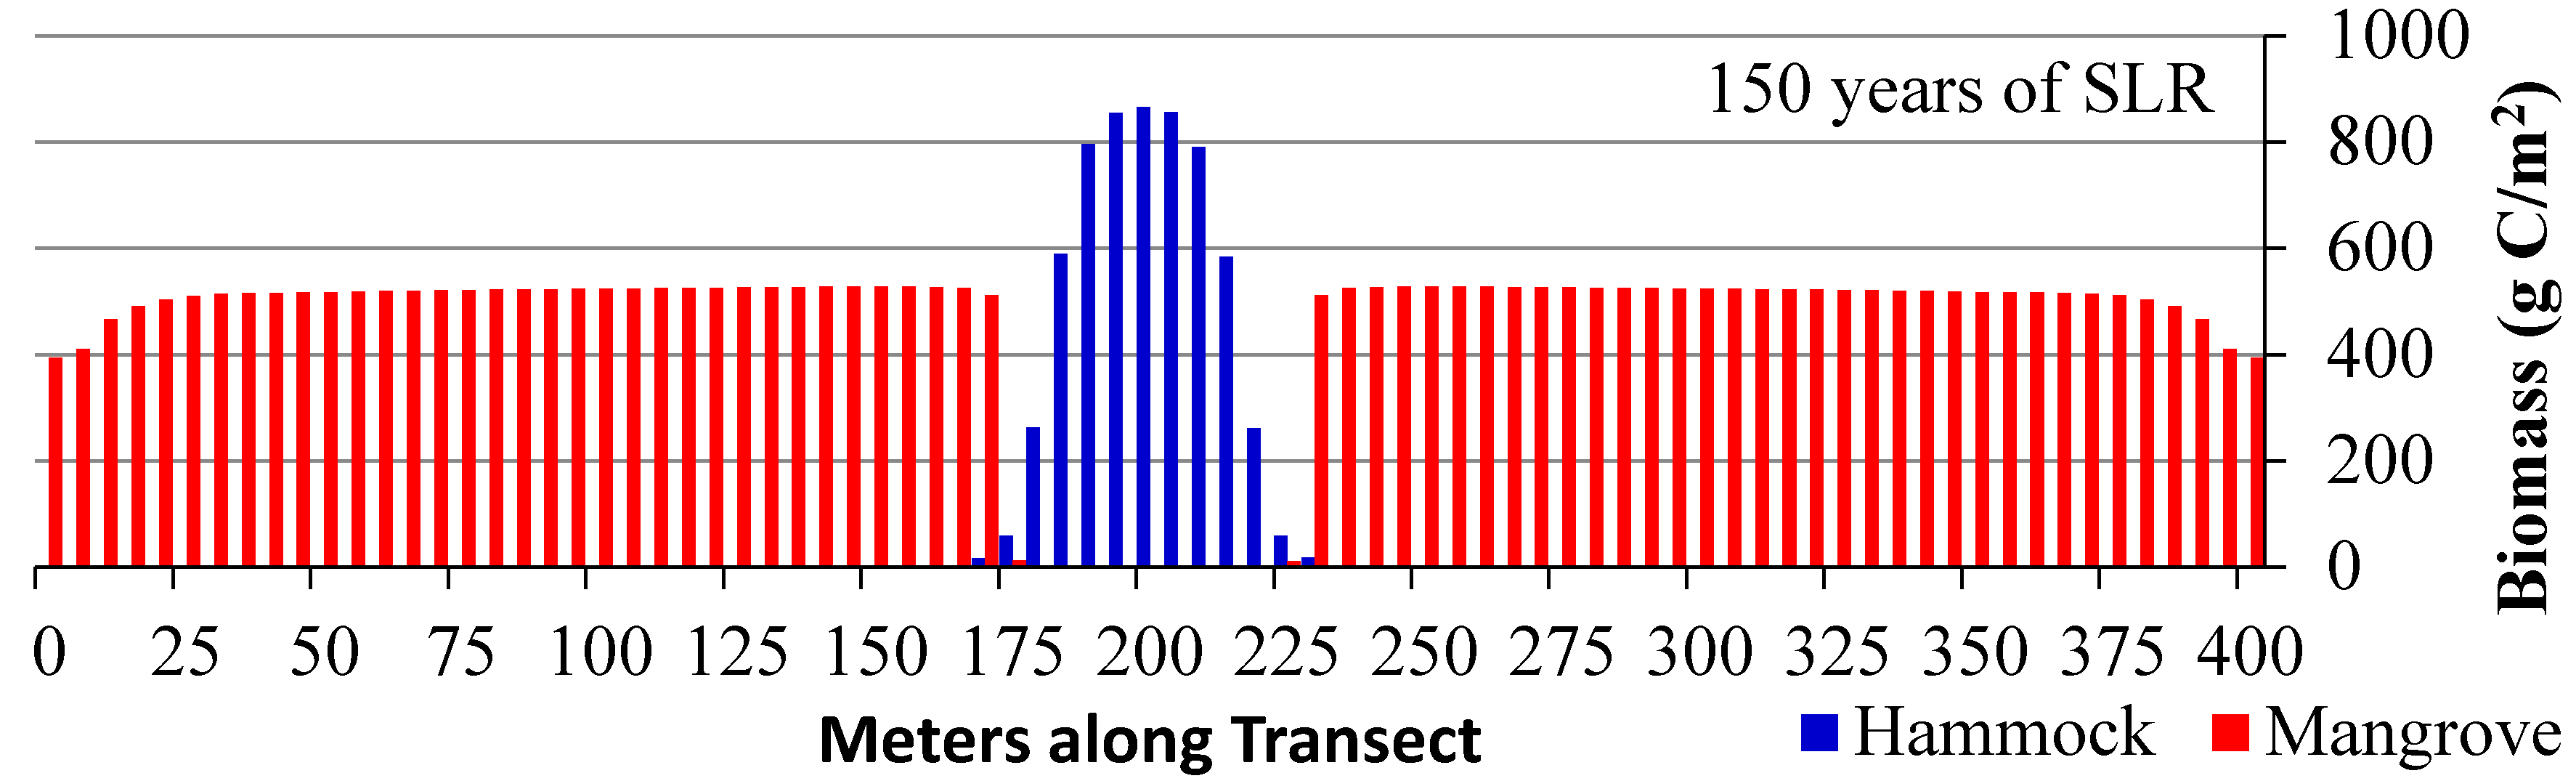
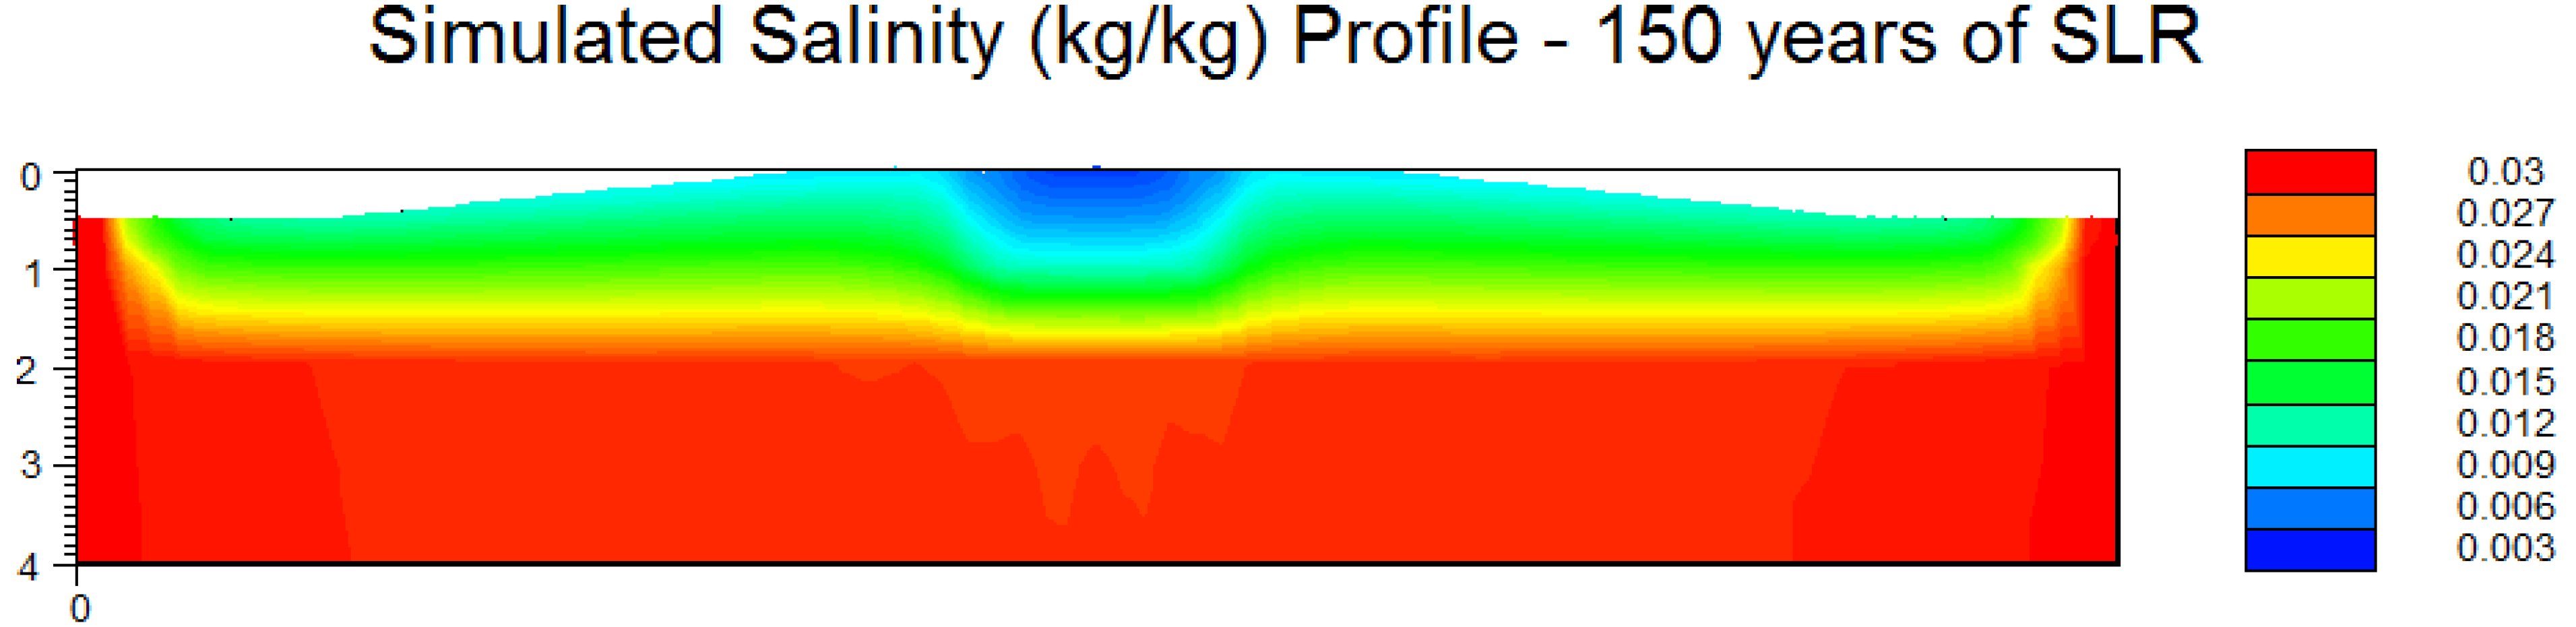
3.3. Scenario 4: Gradual SLR

4. Discussion
4.1. Relevance of MANTRA for Management
4.2. Future Plans
5. Conclusions
Acknowledgments
Appendix
Appendix 1. Description of MANHAM Model
Appendix 2. MANTRA Version 1 Manual: August 1, 2014
| Filename | Remarks |
|---|---|
| SUTRA.FIL SUTRA.inp SUTRA.ics | These are the files that are also needed to run the original version of SUTRA. These files contain the input parameters for the groundwater flow and solute transport simulation. These files can be created by using ArgusONE. |
| MANTRA.exe | This is the executable file of MANTRA. This executable file is built from fmods_2_2.f, sutra_2_2.f, ssubs_2_2.f, usubs_2_2.f. Modifications have been made to incorporate the MANHAM module into sutra_2_2.f. A storm surge event is incorporated into usub_2_2.f as time-dependent specified pressure. |
| MANHAM.DAT | This is the input file for the MANHAM module in MANTRA. This file contains the input parameters related to the vegetation. |
| Variable Name | Type | Description | Value | Unit | |||
|---|---|---|---|---|---|---|---|
| Input File | Eqn | ||||||
| SUTRA Node Control | |||||||
| NSNODE | − | Integer, I10 | Number of sets of surface nodes | 1 | − | ||
| NFIRST | − | Integer, I10 | First surface node number in SUTRA domain | 1 | − | ||
| NLAST | − | Integer, I10 | Last surface node number in SUTRA domain | 1601 | − | ||
| NDIFF | − | Integer, I10 | Interval between surface node numbers | 20 | − | ||
| Storm Surge Control | |||||||
| IT_Surge | − | Integer, I10 | Iteration time of a storm surge event | 60,000 | − | ||
| SDepth | hsurge | Real, F10.2 | Storm surge inundation depth in relation to the height of SUTRA computational domain | 10.5 | m | ||
| SSalinity | Ssea | Real, F10.3 | Storm surge water salinity | 0.030 | kg/kg | ||
| Plant Initial Condition (IC) Control | |||||||
| NSPEC | − | Integer, I10 | Number of plant species | 2 | − | ||
| NRAND | − | Integer, I10 | Seed for random number generator | 1234 | − | ||
| BEGINHAM | − | Real, F10.2 | Ratio of cells dominated by hardwood hammock | 0.50 | − | ||
| BC0 | − | Real, F10.2 | Total initial biomass in a cell | 20,000.00 | g C m−2 | ||
| PERSPEC | − | Real, F10.2 | Ratio of plant i in a cell | 0.50 | − | ||
| Light Parameters | |||||||
| SI | I | Real, F10.3 | Solar irradiance | 0.010 | GJ m-2day-1 | ||
| EKI | ki | Real, F10.4 | Light extinction factor | 0.600 | 0.400 | ||
| GC(NSPEC) | gCi | Real, F10.1 | Light-use efficiency | 520.0 | 380.0 | g C GJ-1 | |
| BAMAX(NSPEC) | BAmax,i | Real, F10.1 | Maximum value attainable by BAi | 350.0 | 350.0 | g C m-2 | |
| Plant Parameters | |||||||
| bc(NSPEC) | bci | Real, F10.4 | Leaf area per unit carbon | 0.0355 | 0.0170 | m2/g C | |
| RA(NSPEC) | rAi | Real, F10.4 | Active tissue respiration rate | 4.0000 | 4.0000 | year-1 | |
| RW(NSPEC) | rWi | Real, F10.4 | Woody tissue respiration rate | 0.0296 | 0.0296 | year-1 | |
| RMA(NSPEC) | mAi | Real, F10.4 | Active tissue litter loss rate | 1.7000 | 1.7000 | year-1 | |
| RMW(NSPEC) | mWi | Real, F10.4 | Woody tissue litter loss rate | 0.0148 | 0.0148 | year-1 | |
| RFWMAX(NSPEC) | Rmax,i | Real, F10.4 | Maximum water uptake for plant NSPEC | 0.0026 | 0.0088 | mm day-1 | |
| SATK(NSPEC) | Shalf,i | Real, F10.4 | Half saturation constant for maximum water uptake for plant NSPEC | 3.1400 | 15.0000 | ppt | |
| C(NSPEC, NSPEC) | cii | Real, F10.4 | Parameters for plant allometry | 0.1000 | 0.1000 | − | |
| 0.5000 | 0.5000 | ||||||
| Environmental Parameters | |||||||
| VPRE(12) | Mpre | Real, F10.4 | Means precipitation rate for twelve months | 1.590 | 1.360 | ... | mm day-1 |
| VPRESD(12) | SDpre | Real, F10.4 | Standard deviations of precipitation rate | 1.870 | 1.200 | ... | mm day-1 |
References
- Nicholls, R.J.; Cazenave, A. Sea-level rise and its impact on coastal zones. Science 2010, 328, 1517–1520. [Google Scholar] [CrossRef] [PubMed]
- Gornitz, V. Rising Seas: Past, Present, Future; Columbia University Press: New York, NY, USA, 2013; p. 344. [Google Scholar]
- Anderson, W.P., Jr. Aquifer salinization from storm overwash. J. Coast. Res. 2002, 18, 413–420. [Google Scholar]
- Anderson, W.P., Jr.; Lauer, R.M. The role of overwash in the evolution of mixing zone morphology within barrier islands. Hydrogeol. J. 2008, 16, 1483–1495. [Google Scholar] [CrossRef]
- Terry, J.P.; Falkland, A.C. Responses of atoll freshwater lenses to storm-surge overwash in the Northern Cook Islands. Hydrogeol. J. 2010, 18, 749–759. [Google Scholar] [CrossRef]
- Sklar, F.H.; Chimney, M.J.; Newman, S.; McCormick, P.; Gawlik, D.; Miao, S.; McVoy, C.; Said, W.; Newman, J.; Coronado, C. The ecological-societal underpinnings of Everglades restoration. Front. Ecol. Environ. 2005, 3, 161–169. [Google Scholar]
- Ross, M.S.; O’Brien, J.J.; Flynn, L.J. Ecological site classification of Florida Keys terrestrial habitats. Biotropica 1992, 24, 488–502. [Google Scholar] [CrossRef]
- Smith, T.J.I.; Foster, A.M.; Tiling-Range, G.; Jones, J.W. Dynamics of mangrove–marsh ecotones in subtropical coastal wetlands: fire, sea-level rise, and water levels. Fire Ecol. 2013, 9, 66–77. [Google Scholar] [CrossRef]
- Gosz, J.R. Ecotone hierarchies. Ecol. Appl. 1993, 3, 369–376. [Google Scholar] [CrossRef]
- Snyder, J.R.; Herndon, A.; Robertson, W.B.J. South Florida rockland. In Ecosystems of Florida; Myers, R.L., Ewel, J.J., Eds.; The University of Central Florida Press: Orlando, FL, USA, 1990; pp. 230–279. [Google Scholar]
- Sternberg, L.D.L.; Teh, S.Y.; Ewe, S.M.L.; Miralles-Wilhelm, F.; DeAngelis, D.L. Competition between hardwood hammocks and mangroves. Ecosystems 2007, 10, 648–660. [Google Scholar] [CrossRef]
- Baldwin, A.H.; Mendelssohn, I.A. Effects of salinity and water level on coastal marshes: An experimental test of disturbance as a catalyst for vegetation change. Aquatic Botany 1998, 61, 255–268. [Google Scholar] [CrossRef]
- Steyer, G.D.; Cretini, K.F.; Piazza, S.; Sharp, L.A.; Snedden, G.A.; Sapkota, S. Hurricane Influences on Vegetation Community Change in Coastal Louisiana; U.S. Geological Survey: Reston, VA, USA, 2010.
- Teh, S.Y.; DeAngelis, D.L.; Sternberg, L.D.L.; Miralles-Wilhelm, F.R.; Smith, T.J.I.; Koh, H.L. A simulation model for projecting changes in salinity concentrations and species dominance in the coastal margin habitats of the Everglades. Ecol. Model. 2008, 213, 245–256. [Google Scholar] [CrossRef]
- Saha, A.; Saha, S.; Sadle, J.; Jiang, J.; Ross, M.; Price, R.; Sternberg, L.; Wendelberger, K. Sea level rise and South Florida coastal forests. Clim. Chang. 2011, 107, 81–108. [Google Scholar] [CrossRef]
- Voss, C.I.; Provost, A.M. SUTRA, A Model for Saturated-Unsaturated Variable-Density Ground-Water Flow with Solute or Energy Transport; U.S. Geological Survey Water-Resources Investigations Report 02–4231; U.S. Geological Survey: Reston, VA, USA, 2010; p. 291.
- Voss, C. USGS SUTRA code—History, practical use, and application in Hawaii. In Seawater Intrusion in Coastal Aquifers—Concepts, Methods and Practices; Practices, J., Bear, A., Cheng, H.D., Sorek, S., Ouazar, D., Herrera, I., Eds.; Kluwer Acdemic Publishers: Dordrecht, Netherlands, 1999; pp. 249–313. [Google Scholar]
- Vrugt, J.; Wijk, M.V.; Hopmans, J.W.; Šimunek, J. One-, two-, and three-dimensional root water uptake functions for transient modeling. Water Resour. Res. 2001, 37, 2457–2470. [Google Scholar] [CrossRef]
- Zhu, Y.; Ren, L.; Skaggs, T.H.; Lü, H.; Yu, Z.; Wu, Y.; Fang, X. Simulation of Populus euphratica root uptake of groundwater in an arid woodland of the Ejina Basin, China. Hydrol. Process. 2009, 23, 2460–2469. [Google Scholar] [CrossRef]
- Tian, W.; Li, X.; Wang, X.-S.; Hu, B. Coupling a groundwater model with a land surface model to improve water and energy cycle simulation. Hydrol. Earth Syst. Sci. Discuss. 2012, 9, 1163–1205. [Google Scholar] [CrossRef]
- Kooi, H.; Groen, J.; Leijnse, A. Modes of seawater intrusion during transgressions. Water Resour. Res. 2000, 36, 3581–3589. [Google Scholar] [CrossRef]
- Saha, A.; Moses, C.; Price, R.; Engel, V.; Smith, T., III; Anderson, G. A hydrological budget (2002–2008) for a large subtropical wetland ecosystem indicates marine groundwater discharge accompanies diminished freshwater flow. Estuaries Coasts 2012, 35, 459–474. [Google Scholar] [CrossRef]
- Light, S.S.; Dineen, J.W. Water control in the Everglades: A historical perspective. In Everglades: The Ecosystem and its Restoration; Davis, S.M., Ogden, J.C., Eds.; St. Lucie Press: Florida, FL, USA, 1994; pp. 47–84. [Google Scholar]
- Sadle, J.; Everglades National Park. Homestead, Florida, FL, USA. Personal communication, 2014.
- Olmstead, I.C.; Loope, L.L. Vegetation along a Microtopographic Gradient in the Estuarine Region of Everglades National Park, Florida, USA; South Florida Research Center: Florida, FL, USA, 1981; p. 41. [Google Scholar]
- Smith, T.; Anderson, G.H.; Tiling, G. Science and the Storms: The USGS Response to the Hurricanes of 2005; Farris, G.S., Smith, G.J., Crane, M.P., Demas, C.R., Robbins, L.L., Lavoie, D.L., Eds.; U. S. Geological Survey Circular 1306: Reston, VA, USA, 2007; pp. 169–174.
- Wanless, H.R.; Parkinson, R.W.; Tedesco, L.P. Sea level control on stability of Everglades wetlands. In Everglades: The Ecosystem and Its Restoration; St. Lucie Press: Delray Beach, FL, USA, 1994; pp. 199–223. [Google Scholar]
- Armentano, T.V.; Doren, R.F.; Platt, W.J.; Mullins, T. Effects of Hurricane Andrew on coastal and interior forests of southern Florida: Overview and synthesis. J. Coast. Res. 1995, 21, 111–144. [Google Scholar]
- Slater, H.H.; Platt, W.J.; Baker, D.B.; Johnson, H.A. Effects of Hurricane Andrew on damage and mortality of trees in subtropical hardwood hammocks of Long Pine Key, Everglades National Park, Florida, USA. J. Coast. Res. 1995, 21, 197–207. [Google Scholar]
- Horvitz, C.C.; Pascarella, J.B.; McMann, S.; Freedman, A.; Hofstetter, R.H. Functional roles of invasive non-indigenous plants in hurricane-affected subtropical hardwood forests. Ecol. Appl. 1998, 8, 947–974. [Google Scholar] [CrossRef]
- Swain, E.D.; Krohn, D.; Langtimm, C.A. Numerical computation of hurricane effects on historic coastal hydrology in southern Florida. Ecol. Process. 2015, 4, 4. [Google Scholar] [CrossRef]
- Hook, D.D.; Buford, M.A.; Williams, T.M. Impact of Hurricane Hugo on the South Carolina coastal plain forest. J. Coast. Res. 1991, 8, 291–300. [Google Scholar]
- Rathcke, B.J.; Landry, C.L. Dispersal and recruitment of white mangrove on San Salvador Island, Bahamas after Hurricane Floyd. In Proceedings of the Ninth Symposium on the Natural History of the Bahamas, San Salvador, Bahamas, 14–18 June 2001.
- Jiang, J.; DeAngelis, D.L.; Anderson, G.H.; Smith, T.J., III. Analysis and simulation of propagule dispersal and salinity intrusion from storm surge on the movement of a marsh-mangrove ecotone in South Florida. Estuar. Coasts 2014, 37, 24–35. [Google Scholar] [CrossRef]
- López-Hoffman, L.; Ackerly, D.D.; Anten, N.P.R.; Denoyer, J.L.; Martinez-Ramos, M. Gap-dependence in mangrove life-history strategies: A consideration of the entire life cycle and patch dynamics. J. Ecol. 2007, 95, 1222–1233. [Google Scholar] [CrossRef]
- Wanless, H.R.; Brigitte, M.V. Coastal Landscape and Channel Evolution Affecting Critical Habitats at Cape Sable; Final Report to ENP; Everglades National Park: Homestead, FL, USA, 2005.
- Ross, M.S.; O’Brien, J.J.; Ford, R.G.; Zhang, K.; Morkill, A. Disturbance and the rising tide: The challenge of biodiversity management for low island ecosystems. Front. Ecol. Environ. 2009, 9, 471–478. [Google Scholar] [CrossRef]
- Cabral, O.M.; McWilliam, A.; Roberts, J. In-canopy microclimate of Amazonian forest and estimates of transpiration. In Amazon Deforestation and Climate; Gash, J., Nobre, C., Roberts, J., Victoria, R., Eds.; Wiley Press: Chichester, UK, 1996; pp. 207–220. [Google Scholar]
- White, I.; Falkland, T. Management of freshwater lenses on small Pacific islands. Hydrogeol. J. 2010, 18, 227–246. [Google Scholar] [CrossRef]
- Chui, T.F.; Terry, J.P. Modeling fresh water lens damage and recovery on atolls after storm-wave washover. Ground Water 2012, 50, 412–420. [Google Scholar] [CrossRef] [PubMed]
- Pearlstine, L.G.; Pearlstine, E.V.; Aumen, N.G. A review of the ecological consequences and management implications of climate change for the Everglades. J. Am. Benthol. Soc. 2010, 29, 1510–1526. [Google Scholar] [CrossRef]
- Odum, W.E.; McIvor, C.C.; Smith, T.J., III. The Ecology of the Mangroves of South Florida: A Community Profile; Bureau of Land Management Fish and Wildlife Service: Washington, DC, USA, 1982.
- Meshaka, W.; Loftus, W.F.; Steiner, T. The herpetofauna of Everglades National Park. Fla. Sci. 2000, 63, 84–103. [Google Scholar]
- Zinke, PJ. Forest interception study in the United States. In Forest Hydrology; Sopper, W.E., Lull, H.W., Eds.; Pergamon: Oxford, UK, 1967; pp. 137–161. [Google Scholar]
- Zhai, L.; Jiang, J.; DeAngelis, D.L.; Sternberg, L.S.L. Prediction of plant vulnerability to salinity increase in a coastal ecosystem by stable isotopic composition of plant stem water: A model study. In review.
- Swain, E.D.; Wolfert, M.A.; Bales, J.D.; Goodwin, C.R. Two-dimensional hydrodynamic simulation of surface-water flow and transport to Florida bay through the Southern Inland and Coastal Systems (SICS); U.S. Geological Survey Water-Resources Investigations Report 03-4287; U.S. Geological Survey: Reston, VA, USA, 2003.
- Munns, R. Comparative physiology of salt and water stress. Plant Cell Environ. 2002, 25, 239–250. [Google Scholar] [CrossRef] [PubMed]
- Moreira, M.; Sternberg, L.D.L.; Martinelli, L.; Victoria, R.; Barbosa, E.; Bonates, L.; Nepstad, D. Contribution of transpiration to forest ambient vapour based on isotopic measurements. Glob. Change Biol. 1997, 3, 439–450. [Google Scholar] [CrossRef]
- Harwood, K.; Gillon, J.; Roberts, A.; Griffiths, H. Determinants of isotopic coupling of CO2 and water vapour within a Quercus petraea forest canopy. Oecologia 1999, 119, 109–119. [Google Scholar] [CrossRef]
- Passioura, J.B.; Ball, M.C.; Knight, J.H. Mangroves may salinize the soil and in so doing limit their transpiration rate. Funct. Ecol. 1992, 6, 476–481. [Google Scholar] [CrossRef]
- Hollins, S.E.; Ridd, P.V.; Read, W.W. Measurement of the diffusion coefficient for salt in salt flat and mangrove soils. Wetl. Ecol. Manag. 2000, 8, 257–262. [Google Scholar] [CrossRef]
- Herbert, D.A.; Rastetter, E.B.; Gough, L.; Shaver, G.R. Species diversity across nutrient gradients: an analysis of resource competition in model ecosystems. Ecosystems 2004, 7, 296–310. [Google Scholar] [CrossRef]
- Jiang, J.; DeAngelis, D.; Smith, T.J.I.; Teh, S.Y.; Koh, H.L. Spatial pattern formation of coastal vegetation in response to external gradients and positive feedbacks affecting soil porewater salinity: a model study. Landsc. Ecol. 2012, 27, 109–119. [Google Scholar] [CrossRef]
© 2015 by the authors; licensee MDPI, Basel, Switzerland. This article is an open access article distributed under the terms and conditions of the Creative Commons Attribution license ( http://creativecommons.org/licenses/by/4.0/).
Share and Cite
Teh, S.Y.; Turtora, M.; DeAngelis, D.L.; Jiang, J.; Pearlstine, L.; Smith, T.J., III; Koh, H.L. Application of a Coupled Vegetation Competition and Groundwater Simulation Model to Study Effects of Sea Level Rise and Storm Surges on Coastal Vegetation. J. Mar. Sci. Eng. 2015, 3, 1149-1177. https://doi.org/10.3390/jmse3041149
Teh SY, Turtora M, DeAngelis DL, Jiang J, Pearlstine L, Smith TJ III, Koh HL. Application of a Coupled Vegetation Competition and Groundwater Simulation Model to Study Effects of Sea Level Rise and Storm Surges on Coastal Vegetation. Journal of Marine Science and Engineering. 2015; 3(4):1149-1177. https://doi.org/10.3390/jmse3041149
Chicago/Turabian StyleTeh, Su Yean, Michael Turtora, Donald L. DeAngelis, Jiang Jiang, Leonard Pearlstine, Thomas J. Smith, III, and Hock Lye Koh. 2015. "Application of a Coupled Vegetation Competition and Groundwater Simulation Model to Study Effects of Sea Level Rise and Storm Surges on Coastal Vegetation" Journal of Marine Science and Engineering 3, no. 4: 1149-1177. https://doi.org/10.3390/jmse3041149
APA StyleTeh, S. Y., Turtora, M., DeAngelis, D. L., Jiang, J., Pearlstine, L., Smith, T. J., III, & Koh, H. L. (2015). Application of a Coupled Vegetation Competition and Groundwater Simulation Model to Study Effects of Sea Level Rise and Storm Surges on Coastal Vegetation. Journal of Marine Science and Engineering, 3(4), 1149-1177. https://doi.org/10.3390/jmse3041149