1. Introduction
The tsunami was considered as a secondary hazard included with earthquake [
1,
2] or volcanic eruption archives [
3,
4]. The first tsunami catalogue of the Eastern Mediterranean Sea was published by Antonopoulos
et al. [
5] and only at the end of the 1990s, thanks to the results of the European projects GITEC (1992–1995) and GITEC TWO (1998–2001), a database of tsunamis that occurred in the Mediterranean basin was published.
The analysis of available data [
6,
7,
8] revealed that from 2000 B.C. to present, about 476 tsunamis occurred in the Mediterranean Sea; as far as their causes are concerned, 380 were triggered by earthquakes and only 20 by volcanic eruptions, the remaining were ascribed to mass failure, earthquakes, landslides, volcanic eruptions or unknown causes.
These natural events become dangerous when the tsunamis hit a densely inhabited area, where they can pose hazards and turn into disasters. Risk is defined by UNISDR [
9] as the combination of the probability of occurrence of an event and its negative consequences. Mostly for geophysical risks [
10,
11,
12,
13,
14,
15,
16,
17], the notation proposed by UNESCO [
18] and Fournier d’Albe [
19], Risk = Hazard × Vulnerability × Exposure, is adopted. Hazard is the likely frequency of occurrence of a dangerous event in a fixed future time, Exposure measures people, property, systems, or other elements present in hazard zones that are thereby subject to potential losses, Vulnerability is the proportion of lives or goods likely to be lost, and accounts for the features of a system or asset that make it susceptible to the damaging effects of a hazard. This definition identifies vulnerability as a characteristic of the element of interest (community, system or asset) which does not depend on its exposure [
9]. Ultimately, the notation points out that the risk can be reduced both by lowering exposure and acting on vulnerability.
Traditionally, the vulnerability of a territorial system affected by tsunami events was assumed to be invariable within the flood zone. e.g., [
20,
21]. Recent papers, thanks to the analysis of damages caused by tsunamis in many areas around the world, evidenced that tsunami vulnerability changes within the flood zone in response to several parameters mainly reflecting the features of urban environment [
22,
23,
24,
25,
26,
27].
Starting from this idea, to evaluate the territorial vulnerability, Papathoama
et al. [
22] developed the Papathoma Tsunami Vulnerability Assessment Model (PTVA). They built a database recording information on building features, sociological, economic, environmental and physical data and assigned to each a weight to quantify its contribution to the vulnerability assessment. Two indices, the building vulnerability and human vulnerability, defined as weighted average of data recorded into the database were assessed to show into maps the spatial and temporal variability of tsunami vulnerability over the inundated area [
22,
24,
28].
Dall’Osso
et al. [
29] improved the PTVA Model, renamed PTVA-3, introducing a new set of attributes, related to the water intrusion effects, and the use of the Analytic Hierarchy Process (AHP) to evaluate the building vulnerability. This multi-criteria approach limits the subjective ranking and displays the contribution of the single attribute to the overall buildings vulnerability.
In this paper, the PTVA-3 model was partly modified to implement it in a Geographic Information System (GIS), as a procedure to assess the Relative Vulnerability Index (RVI) of an urban environment
(i.e., of wide zones with high building density) without losing the information associated with individual buildings, to which the procedure had originally been applied. The implemented workflow takes advantage of the experiences gained in the areas recently affected by tsunamis and of freely available datasets as the ISTAT (Italian National Institute for Statistics) [
30] data and the Google Earth satellite images.
The main outcome of the present research is the urban vulnerability map; it represents a good tool to limit the physical damage of tsunami propagation and to improve social preparedness, essential to favor the development of a resilient community. The method was tested on Napoli megacity because it is exposed to many natural events (seismic, volcanic, landslide) that could trigger tsunamis.
2. Method for Tsunami Vulnerability Assessment at Urban Scale
In the present paper, the PTVA-3 model previously applied to the single buildings of several areas [
29,
31,
32,
33,
34] was partially modified to work at the regional scale, assessing the urban vulnerability of wide areas by using remote sensing and National Institute for Statistics data. The procedure was implemented in a GIS environment to take full advantage of the spatial analysis algorithms for analyzing and integrating data with different spatial resolutions.
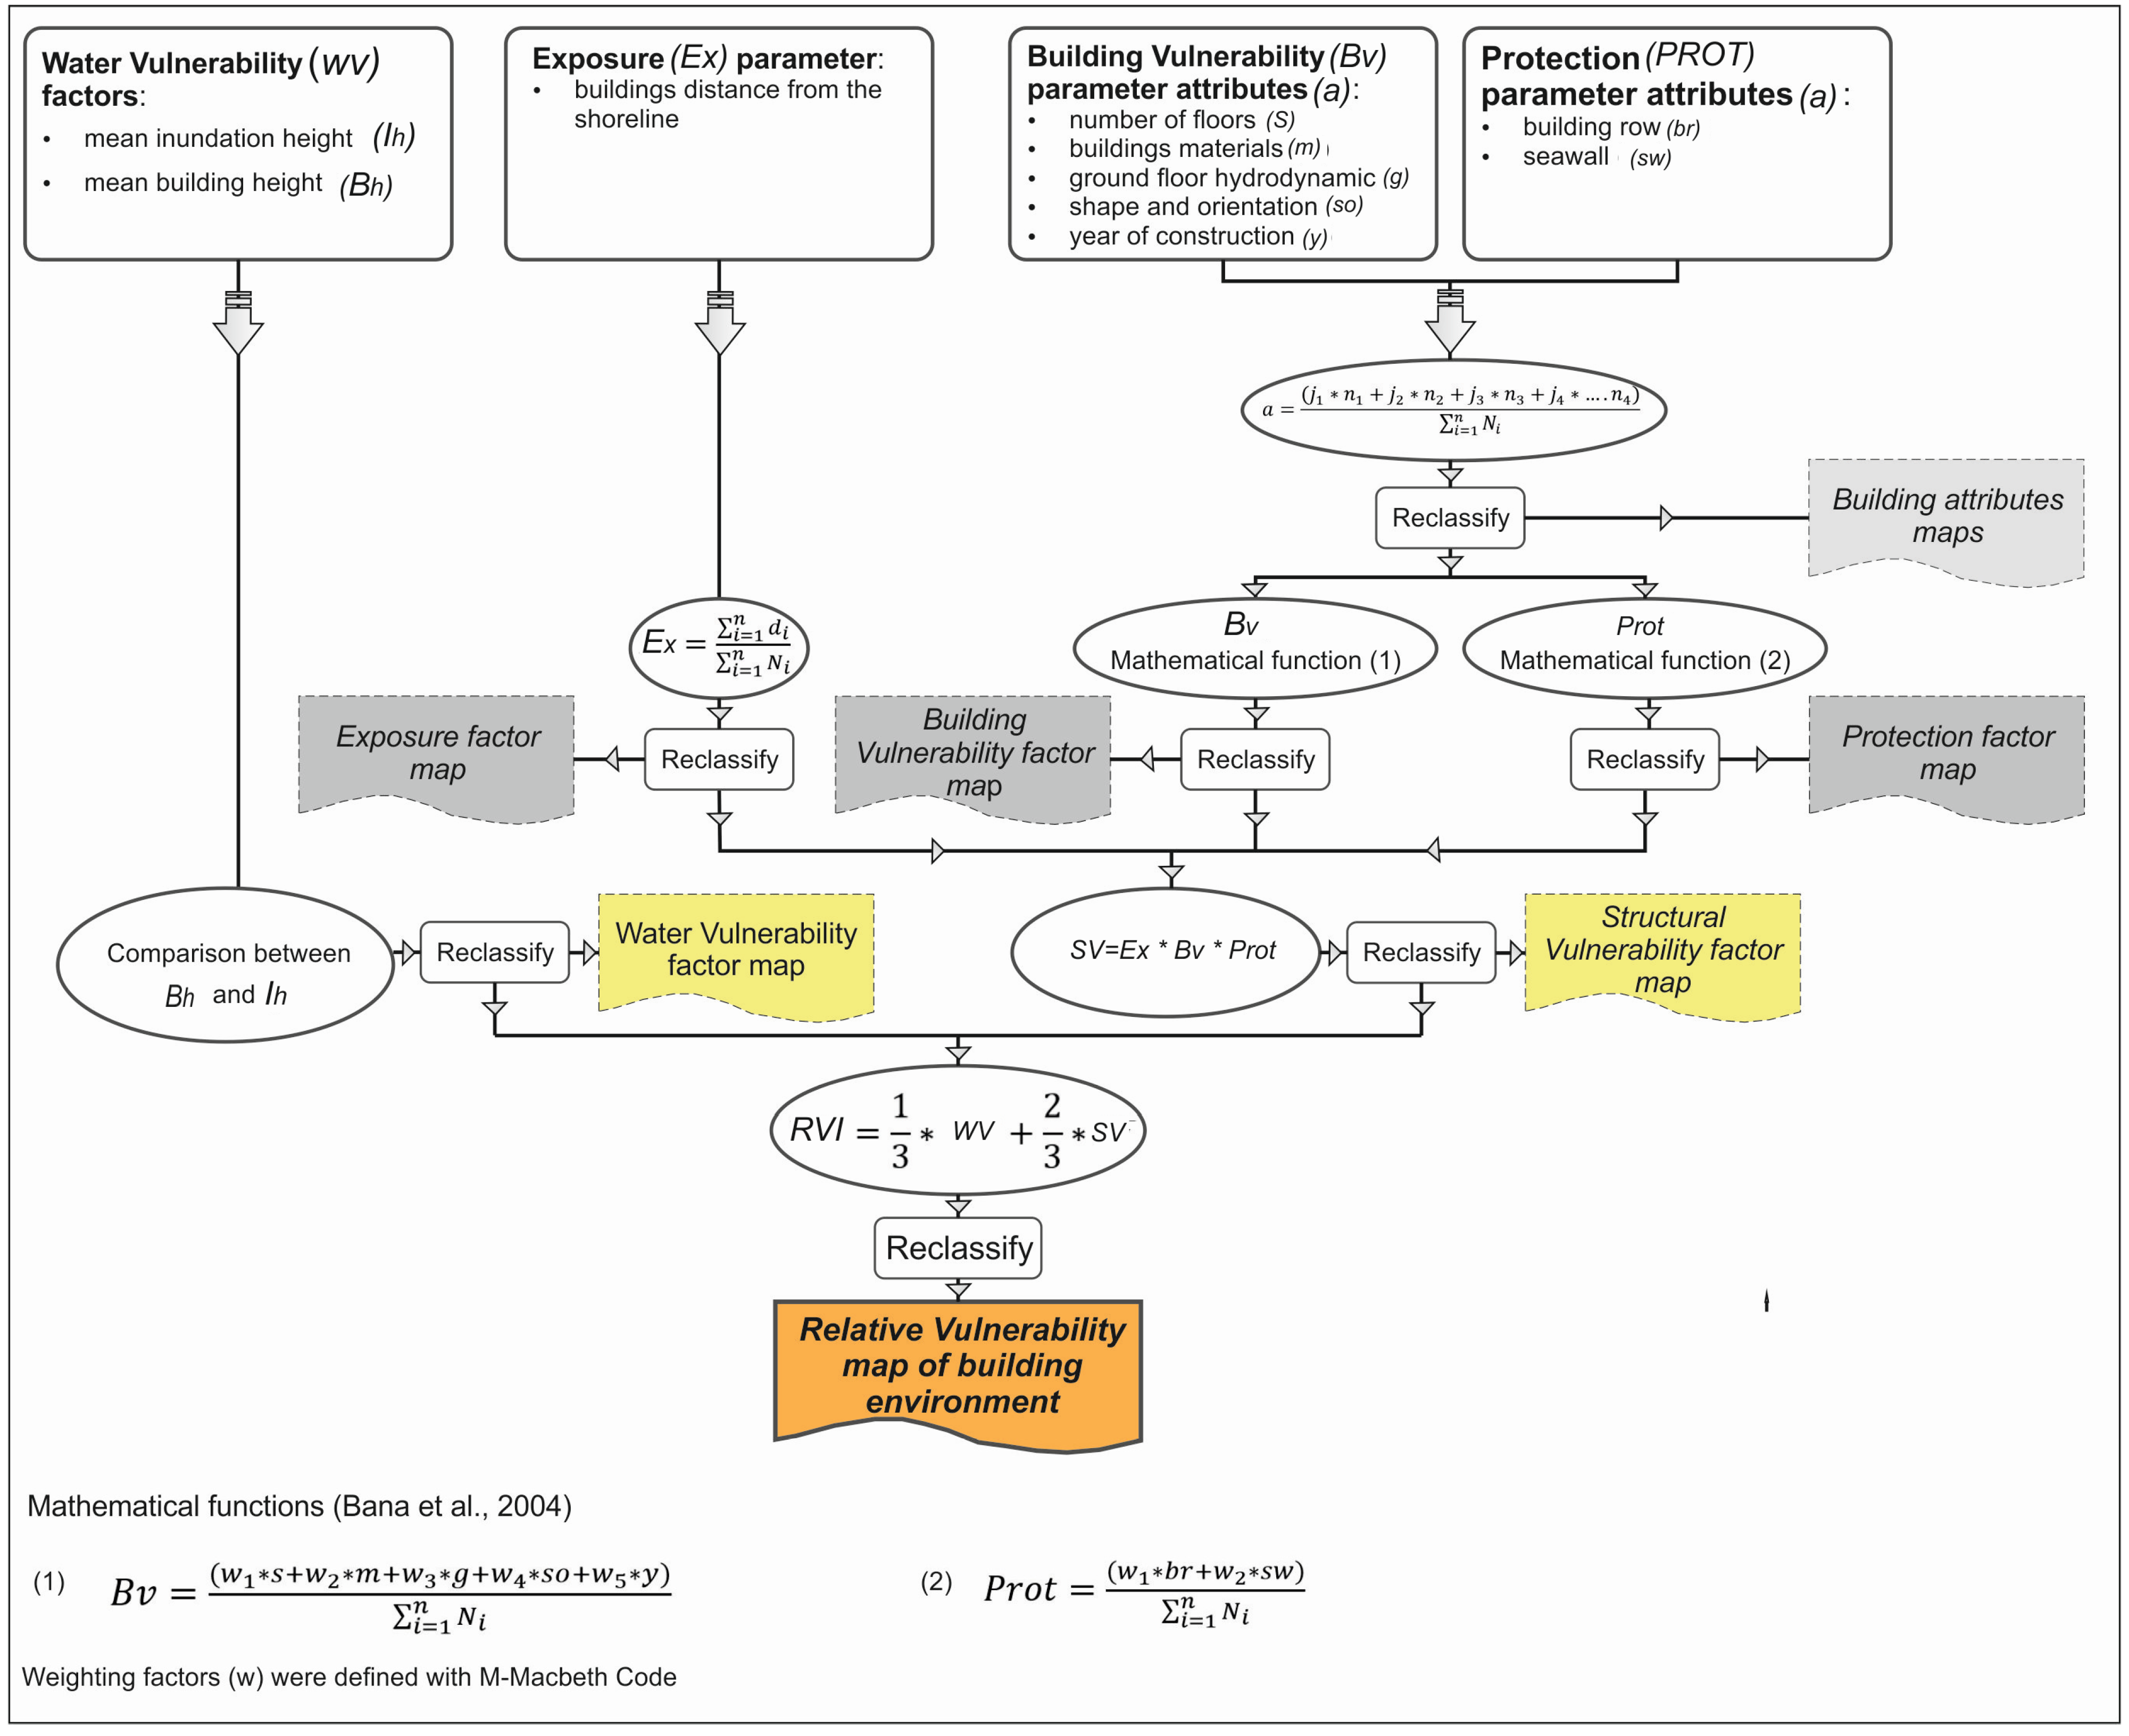
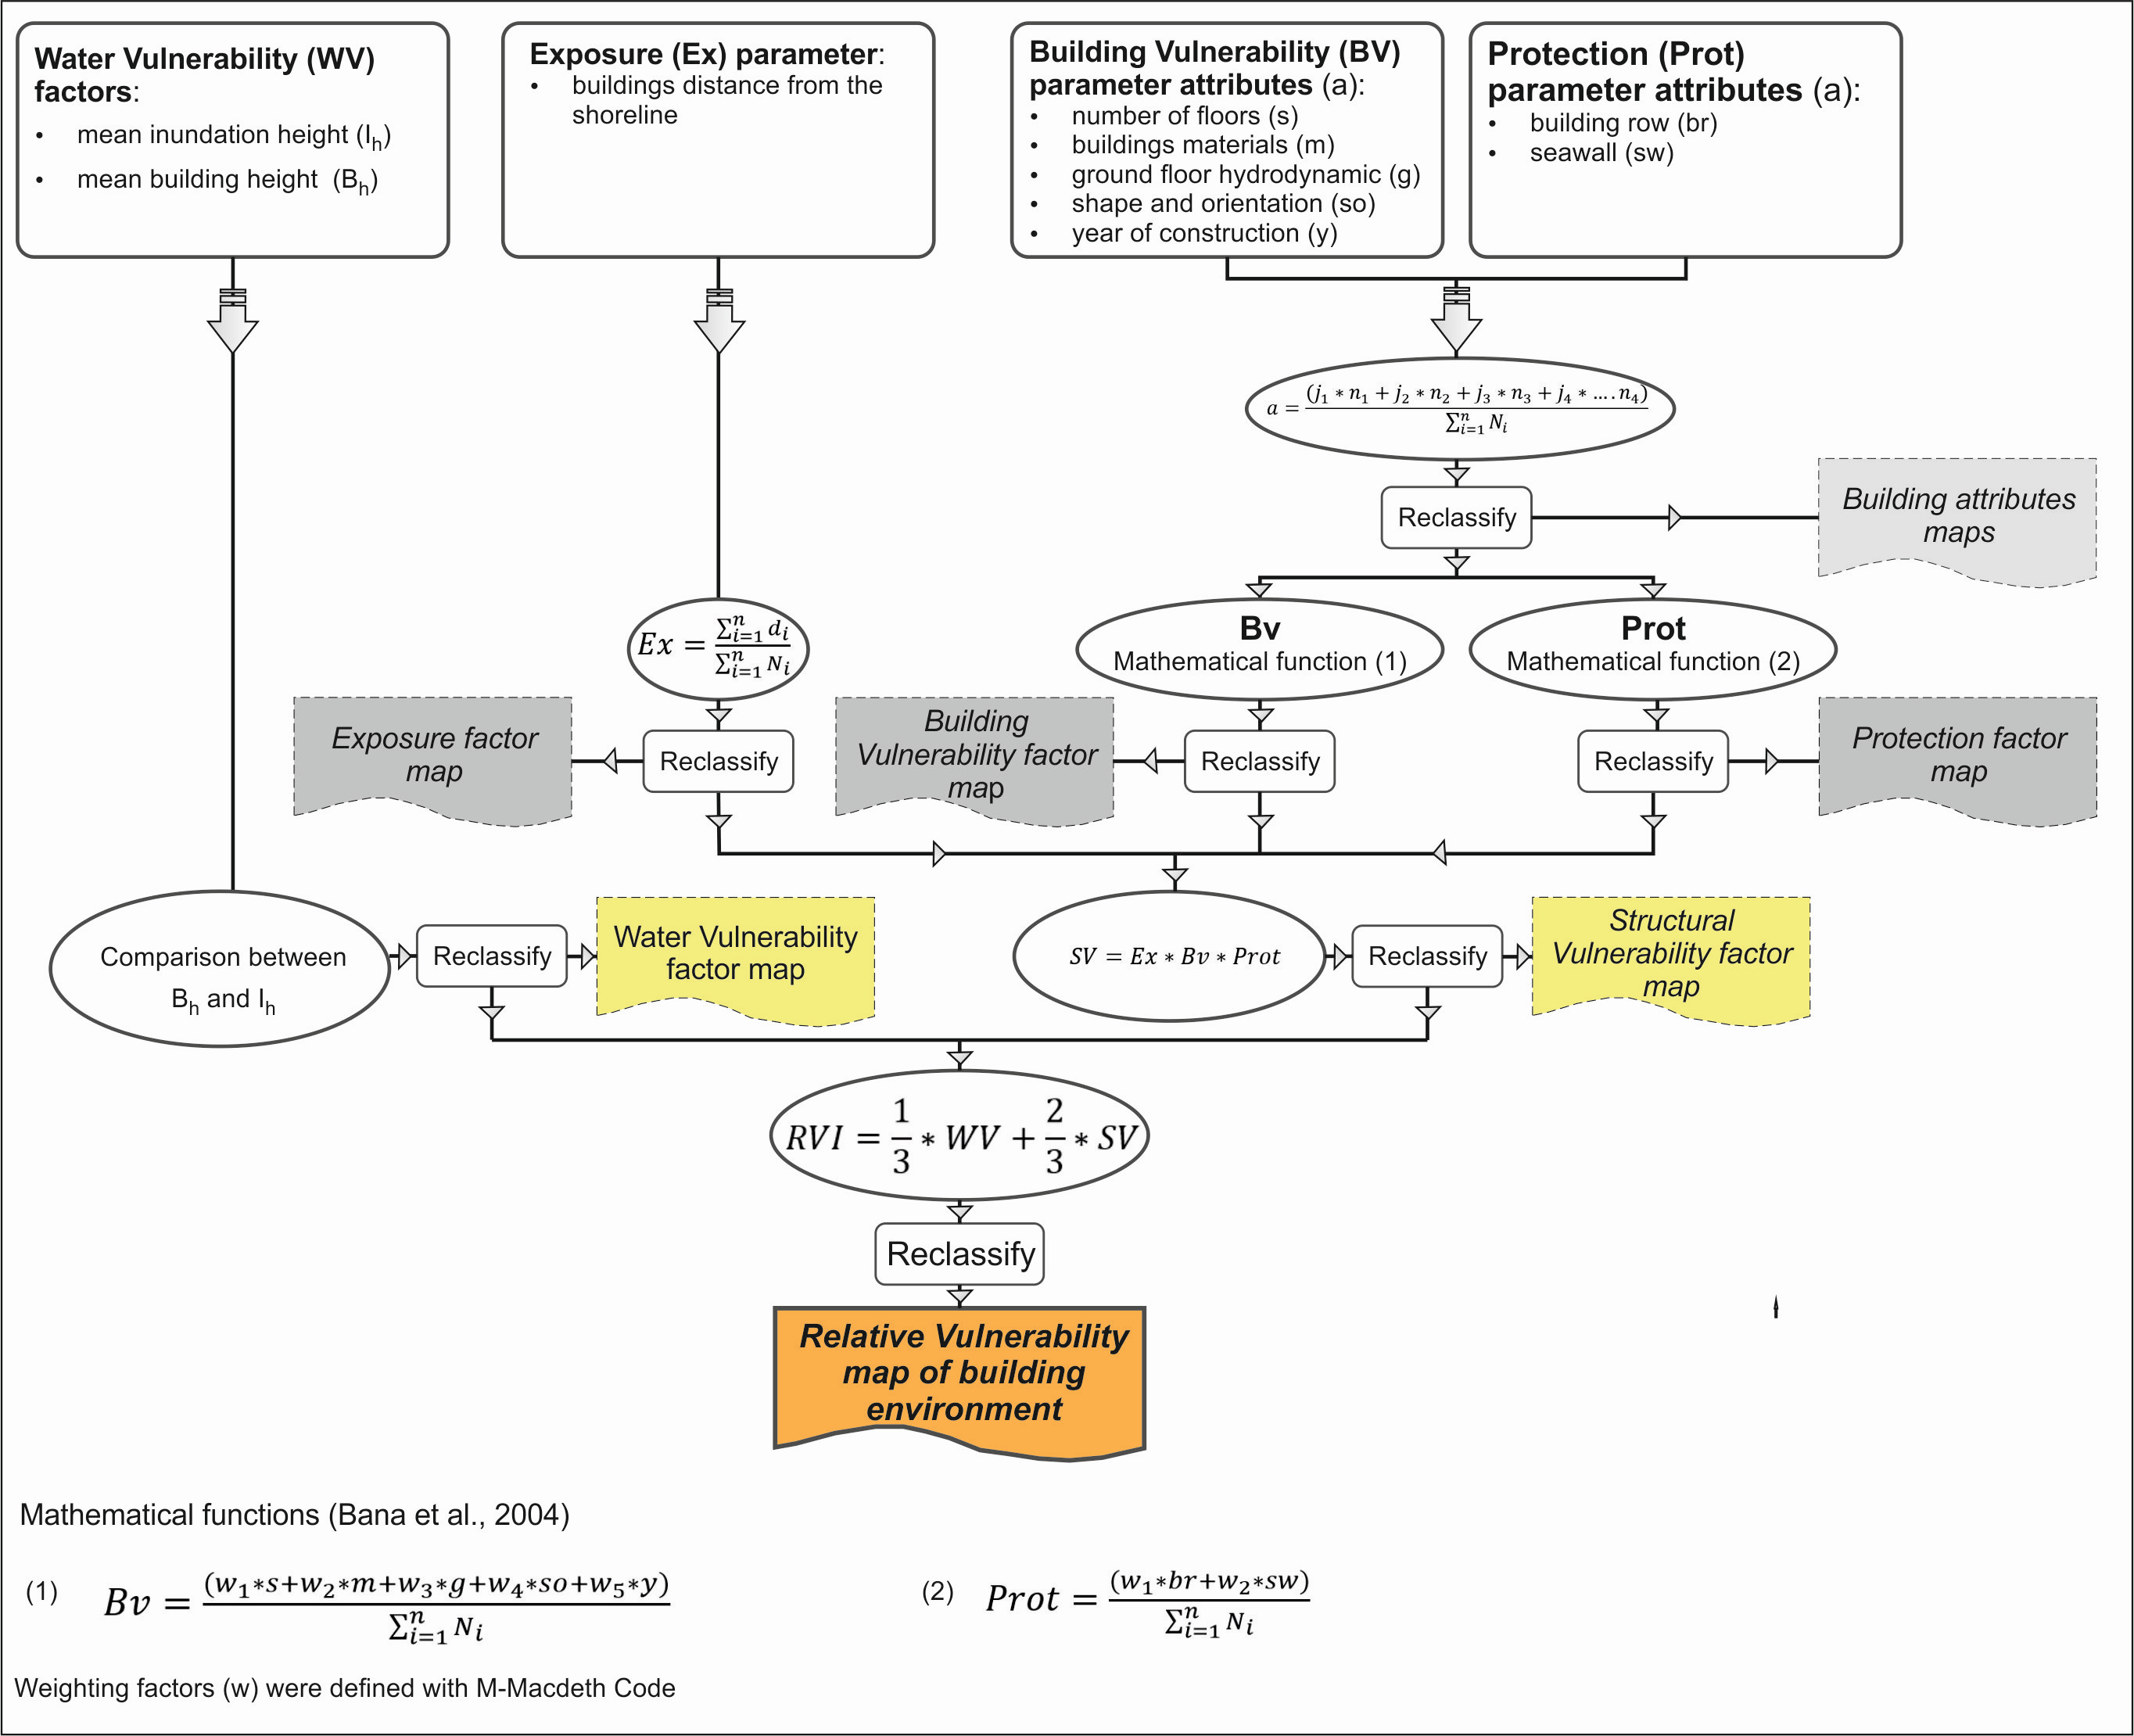
Figure 1 shows the input data and the sequence of steps required for calculation of Relative Vulnerability Index (RVI); the ISTAT [
30] geodataset and the satellite images represent the main source of data needed to implement the proposed procedure.
The censual district (ISTAT 2011, [
30]) was assumed as the smallest geographical feature (spatial resolution) while the associated dataset (number of buildings, typologies of buildings, number of floors, age of building) provided part of the parameters required for the vulnerability assessment. The distance from the shoreline, shape and orientation of buildings, building rows and the presence of seawalls were identified thanks to the analysis of Google Earth satellite images of 2015 (
Figure 1). The method adopted to calculate the inundation height is described in the hazard assessment section.
The RVI was defined as the sum of two factors:
The WV (Water Vulnerability) is the vulnerability of buildings linked to the impact of water and SV (Structural Vulnerability) is the carrying capacity of buildings associated with horizontal hydrodynamic force of water flow. The WV factor was calculated by comparing the mean building elevation with the mean inundation height.
The mean building elevation at census district scale (
Bh) was calculated for the four building categories defined by the ISTAT [
30] (buildings with one floor, two floors, three floors, four and more than four floors) and assuming a mean floor height (
hi) of 3 m, as follows:
where
B represents the number of buildings pertaining to the four ISTAT [
30] categories,
fn is the number of floors and
N is the total number of buildings located in the census district.
Figure 1.
Flow chart. Diagram reporting the procedure for census districts vulnerability assessment: white rounded rectangles enclose the factors and the attributes; ellipses indicate the algorithm adopted; the colored boxes indicate the maps drawn in the different steps of the procedure.
Figure 1.
Flow chart. Diagram reporting the procedure for census districts vulnerability assessment: white rounded rectangles enclose the factors and the attributes; ellipses indicate the algorithm adopted; the colored boxes indicate the maps drawn in the different steps of the procedure.
Similarly to the last parameter, the inundation height was calculated, at census district scale, as mean of inundation values assigned to each building from the inundation dataset.
The water vulnerability was evaluated through the comparison of the mean inundation height and the mean building elevation; the census districts with inundation height higher than building elevation were identified as the most vulnerable. Following this premise we identified four categories of vulnerability (1 floor flooded /4 floors, 2 floors flooded /4 floors, 3 floors flooded/4 floors, buildings totally flooded) with a weight varying linearly from 0.25 to 1.
The SV factor of (1), was defined as the product of Ex, Bv and Prot parameters.
The Ex (Exposure) parameter depends on the water depth and on the location of the building.
The Bv (Building Vulnerability) parameter depends on the building features and reflects the resistance to flooding.
The Prot (Protection) parameter expresses the capability of manmade structures to protect the coastal zone from the tsunami during its inland propagation.
For the
Ex definition, in accordance with Fritz
et al. [
35], the assumption that exposure is directly related to the depth of the flow and decreases away from the coast was adopted. This parameter was calculated as average of building distance from the shoreline assigned to each census district.
For the
Bv and
Prot assessment were used the following relations:
where
s is the number of floors,
m is the building materials,
g is the ground floor hydrodynamics,
so is the shape and orientation,
y is the age of building,
br is the building row,
sw is the seawall,
are the weighting coefficients of each attribute and
N is the total number of buildings pertaining to each census district.
The weighting coefficients (
w) reported in
Table 1, the only available for the building vulnerability assessment, are those defined by Dall’Osso
et al. [
29] through the Analytic Hierarchy Process (AHP) accessible in the M-Macbeth environment [
36,
37]. The attributes
s,
m,
y, were derived from the ISTAT geodataset (2011, [
30]) and are linked to geographical element of census districts, whereas
g,
so,
br sw attributes were acquired through the visual analysis of Google Earth satellite images and are related to the single buildings (
Table 2). Since the census district was assumed as the smallest geographical element available for analysis at urban scale, a procedure to summarize the different features of single attributes
(i.e., for
so there are four classes: regular floor plan inscribed in a square, regular floor plan with the short side oriented perpendicularly to the flow direction,
etc.) and transfer the information from the buildings to the censual district was defined.
Table 1.
Weights of attributes. List of attributes weighting factors used for the
Bv and
Prot assessment (from Dall’Osso
et al. [
29]).
Table 1.
Weights of attributes. List of attributes weighting factors used for the Bv and Prot assessment (from Dall’Osso et al. [29]).
| Building Vulnerability (Bv) | Protection (Prot) |
|---|
| Attributes | Weighting Factors (%) | Attributes | Weighting Factors (%) |
|---|
| s (number of floors) | w1 = 100 | br (building row) | w1 = 100 |
| m (building materials) | w2 = 80 | sw (seawall) | w2 = 73 |
| g (ground floor hydrodynamics) | w3 = 60 | | |
| so (shape and orientation) | w4 = 46 | | |
| y (year of construction) | w5 = 23 | | |
Table 2.
Indices of building vulnerability attributes. List of indices assigned to the single attribute influencing the structural vulnerability of a building (
Bv). The values ranging from 0.25 to 1 indicate an increase of the average building vulnerability ([
29]; modified).
Three main steps were followed: (a) the
so,
br,
g and
sw attributes were identified for the single building; (b) these values were successively ranked and to each class an index
ji ranging between 0.25 and 1 was assigned (
Table 2), where the higher index accounts for the higher vulnerability; (c) these indices were introduced in the following formula to calculate the value of each attribute as arithmetic mean:
where (
a) is one of the seven attributes listed above (for example: shape and orientation), (
n) symbolizes the number of buildings with specific features (for example: regular floor plan inscribed in a square, regular floor plan with the short side oriented perpendicularly to the flow direction,
etc.) and
N is the number of buildings pertaining to each census district. The procedure is used to define the average of ISTAT [
30] attributes as well, because the single census district has different classes for each attribute type
(i.e., for the number of floors).
The criteria used to define the
ji indices are:
For the “
s” attribute - starting from the idea that multi-floors buildings have a good possibility of not being completely submerged by water and could promote the vertical evacuation, the lowest vulnerability was assigned to buildings with four and more than four floors and the highest to buildings with one floor (
Table 2).
For the “
m” attribute - the reinforced concrete buildings resist the tsunami effects better than the other building typologies (
Table 2).
For the “
g” attribute - the survey of damages to buildings as a consequence of several tsunamis, points out that buildings with openings on the ground floor suffered a lower damage than the other buildings typologies [
38] (
Table 2).
For the “
so” attribute - the buildings with long rectangular shape or “L” shaped with the main wall oriented perpendicular to the flow direction showed high vulnerability [
24,
39]. The buildings with the lowest damages are those having a shape fitting into a square, because they react equally to the flows notwithstanding the direction of impact [
40]. Furthermore, the degree of vulnerability decreases progressively from buildings diagonal to perpendicular to parallel to the coastline [
24].
For the “
y” attribute - since the older a building the higher is its vulnerability, the elapsed time from its construction was used as indicator of good/worst condition (
Table 2).
For the “
br” attribute - the number of structures located between each building and the coastline is one of the most important protection factors against the tsunami impact. The lower the value of this attribute, the higher is vulnerability (
Table 3).
For the “
sw” attribute - Darlymple and Kriebel [
38] stated that buildings protected by enclosure walls were significantly less damaged (
Table 3).
Moreover, for the formulae (3) and (4) some simplifications were needed at the scale adopted in the present work. In detail, the sub-parameter age of building, displaying the state of preservation of buildings, substitutes the foundation type and the preservation condition considered by Dall’Osso
et al. [
29] because this data is not available at census district scale. The attribute “seawall” was not considered because this information was too detailed for an analysis at urban scale.
3. The Case Study of the City of Napoli
Napoli megacity, with about one million people, has one of the highest population rates of all of Europe (population rate reaching apex values of 5000 inh/km
2). The long history of this city can be read by both punctual architectures and large zones displaying the historical transition from ancient to modern time. We can read the signs of the first settlements at Echia Mount (Pizzofalcone), the site of the first Greek inhabitants of Parthenope and Neapolis; the Roman town; the modern city, which grew in size and population density; Napoli as capital in Byzantine age and the urban zones built after the Second World War [
41]. Today, these territorial transformations result in a complex urban texture and space configuration that schematically divide the city into five macro-zones. The old town includes all districts sourced until the end of last century. The consolidated urban zones coincide with the hills bordering the core of the city where the population has moved from the overcrowded central urban area after the First World War. The western area includes the districts falling inside the Campi Flegrei volcanic area, whose original agricultural vocation was gradually transformed into industrial and then tertiary activities in the last decade. The suburbs include the northern and eastern zones of the city, the former as a symbol of the urban distress characterizing the megacity while the latter as a symbol of degradation mainly linked to the progressive abandon of the factories once well developed in these zones [
41].
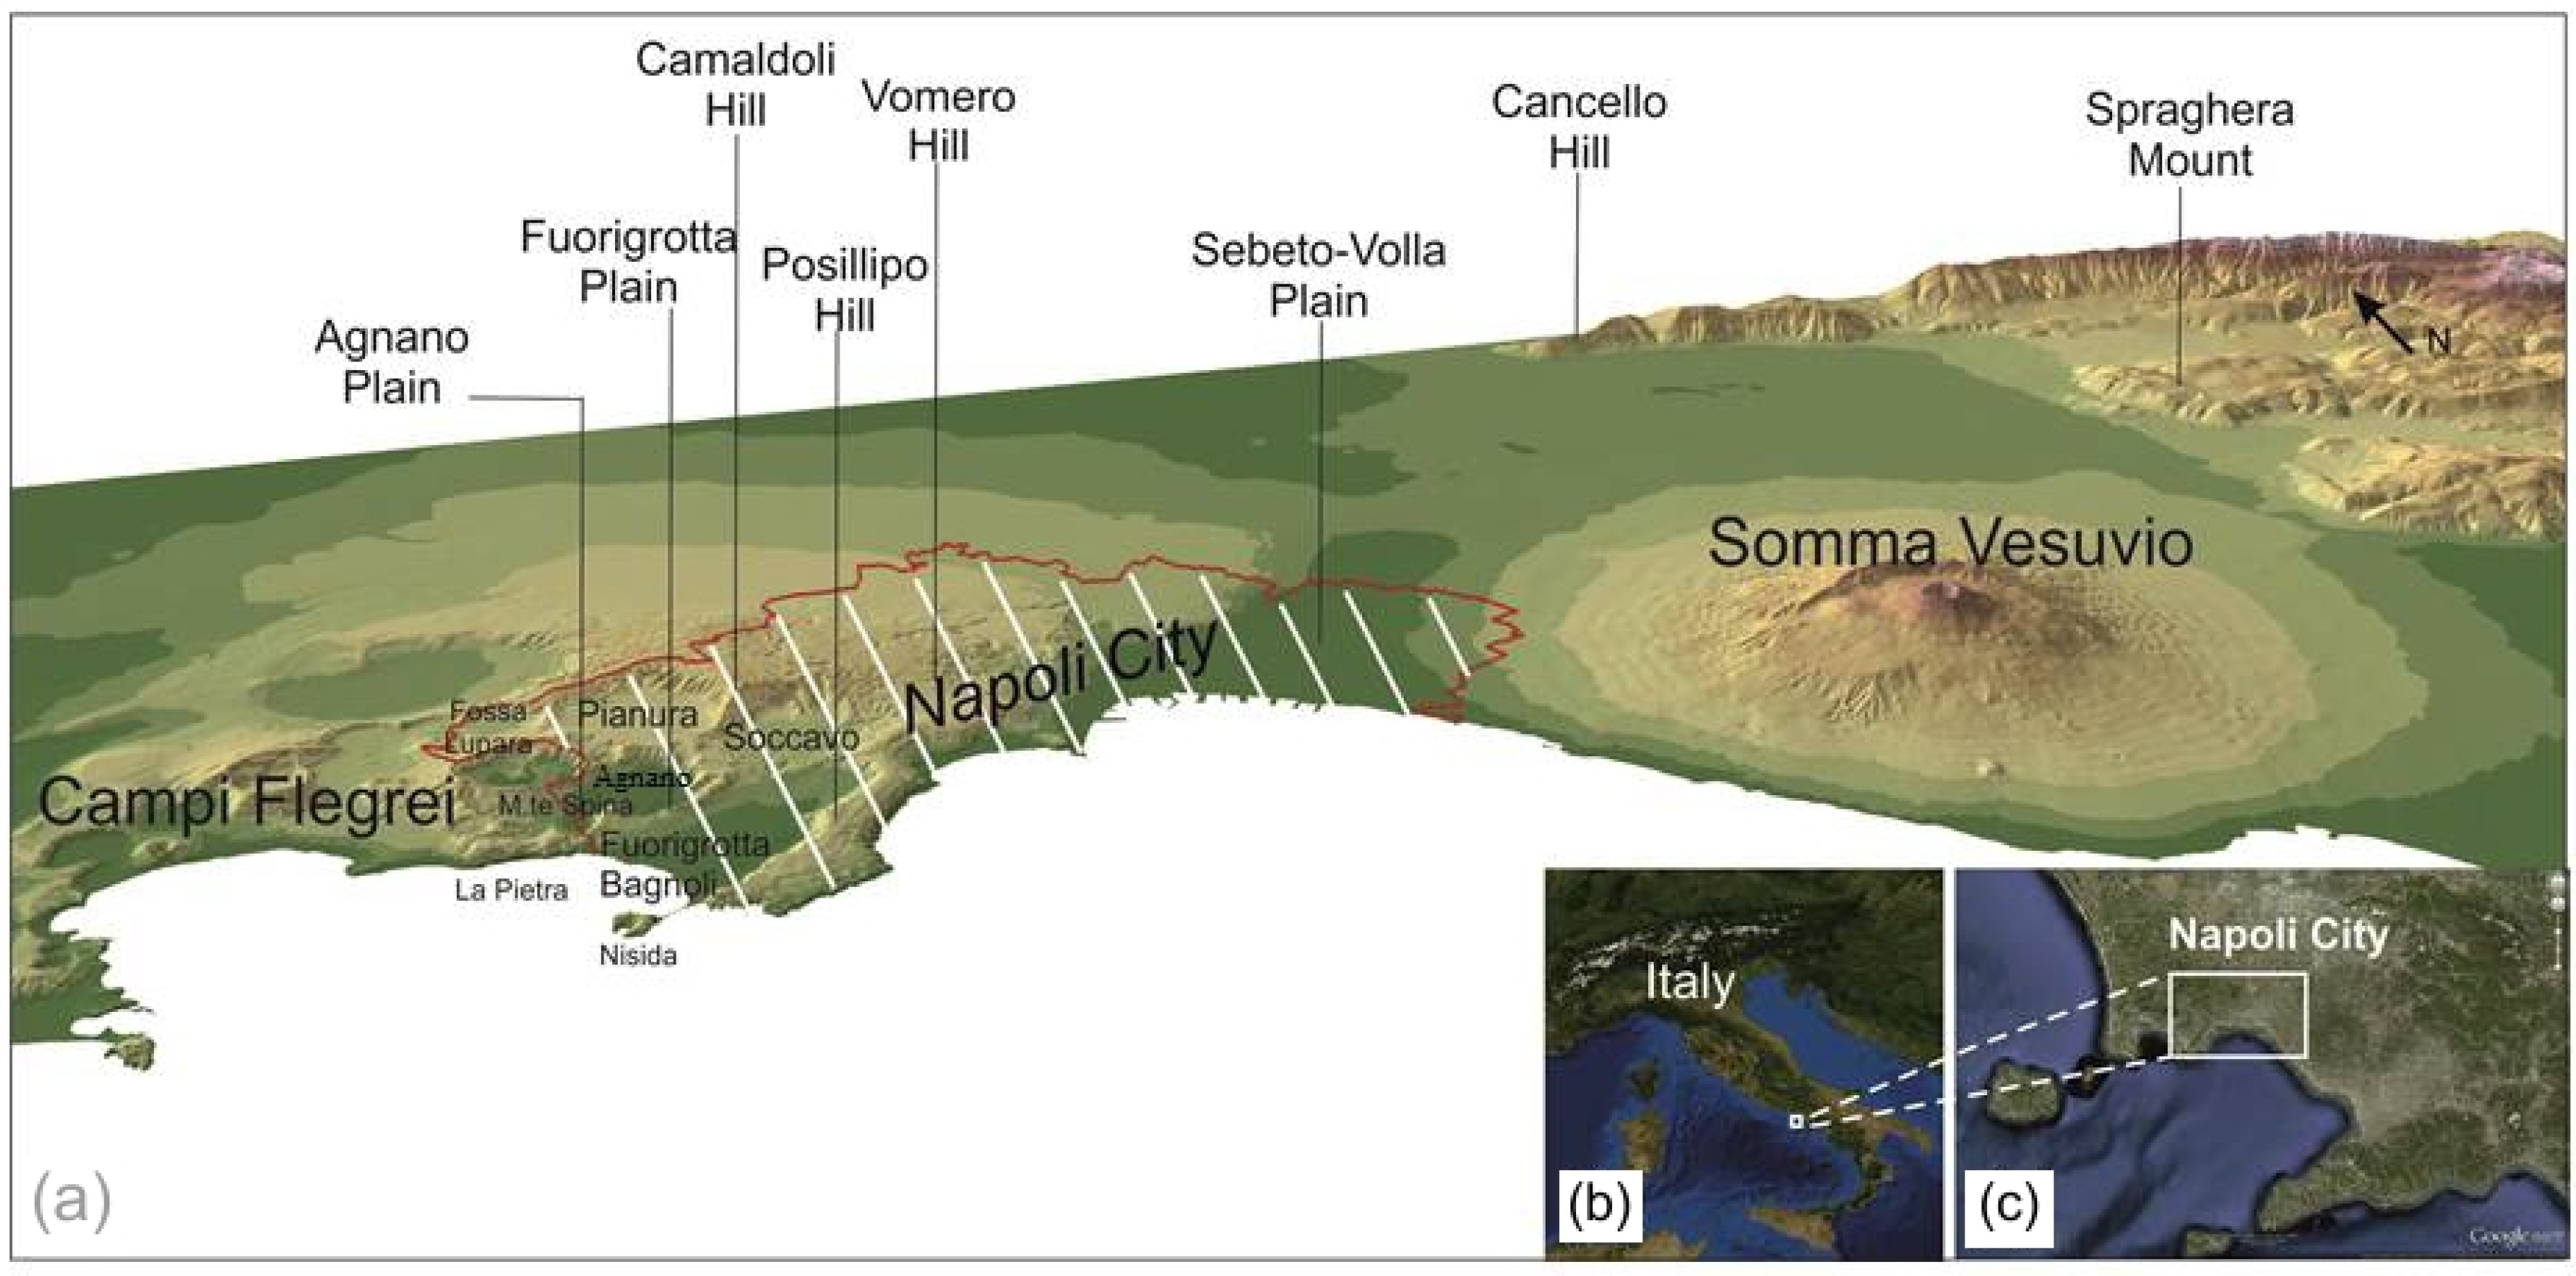
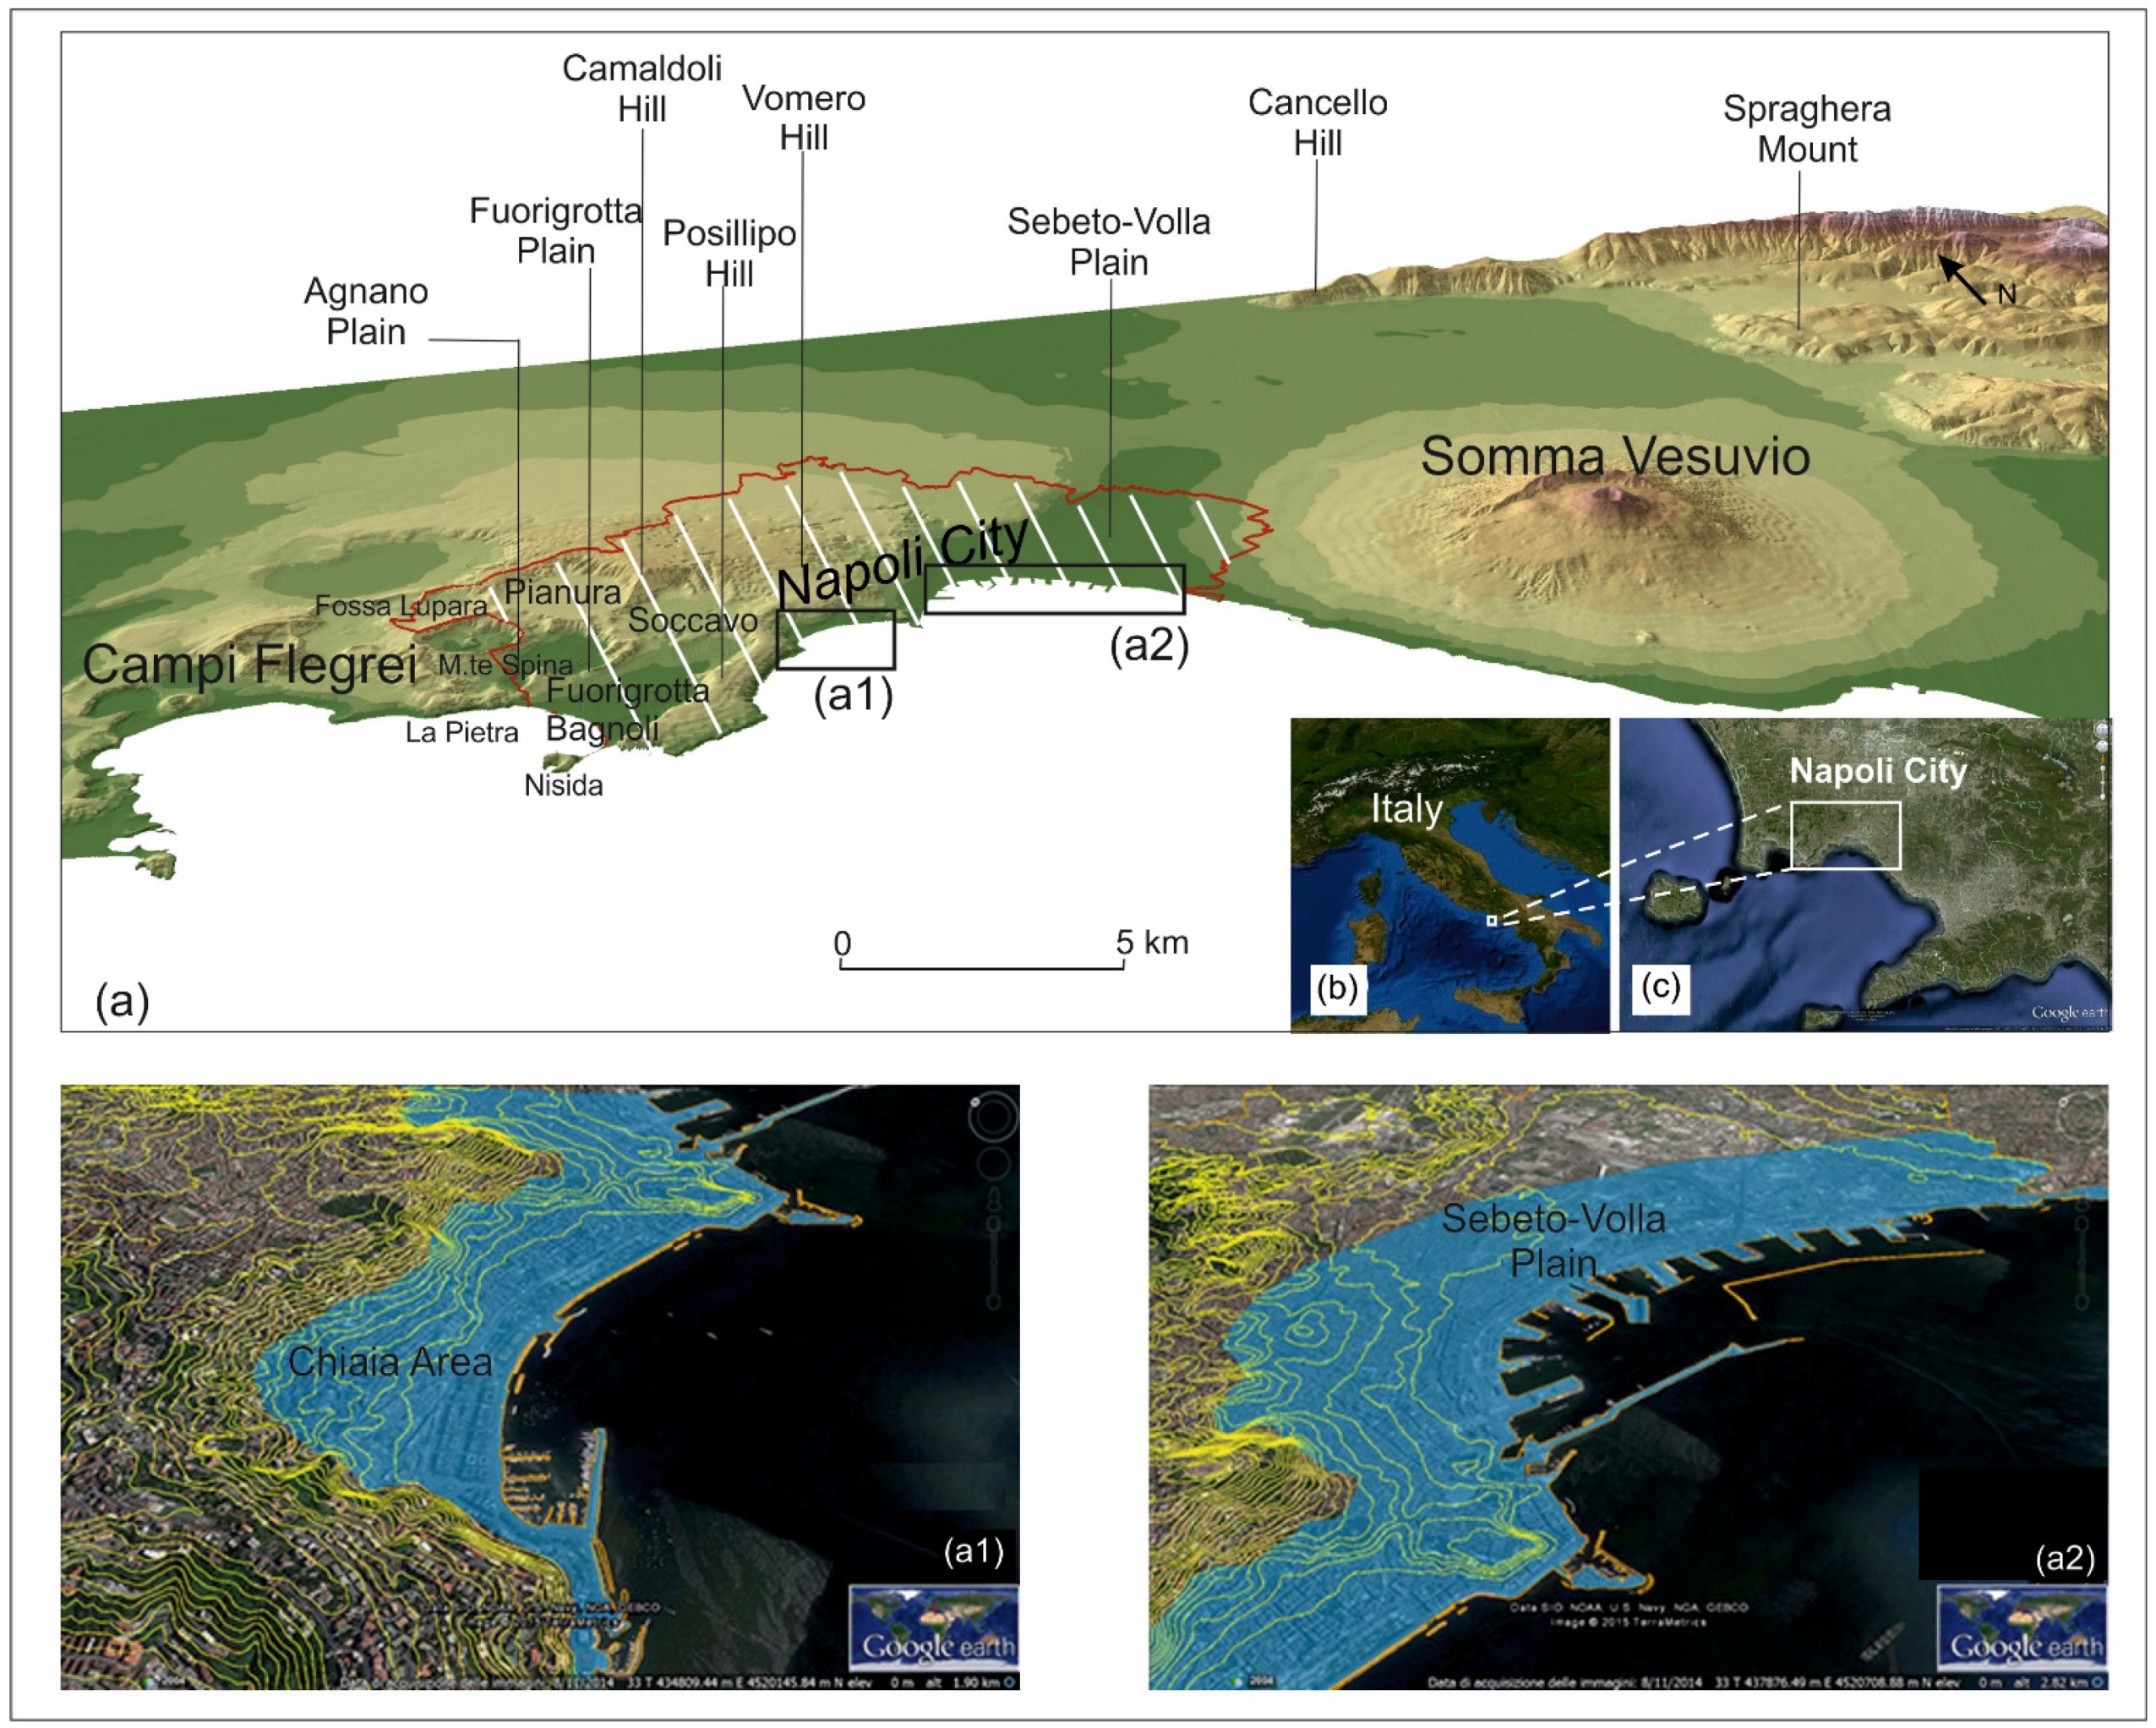
This urban landscape, representing about 78% of Napoli city, was conditioned by the morphology (
Figure 2). It is quite various, since several monogenetic volcanic edifices like Nisida Island, La Pietra, Monte Spina and Fossa Lupara characterize the area. The highest peak of the city is the Camaldoli hill (454 m), bordered to the west by Pianura (175 m a.s.l.) and Soccavo (100 m a.s.l.) inland plains, and gradually dipping towards the Agnano-Bagnoli coastal plain. The Camaldoli hill passes to the East to the Vomero area, where the narrow tuffaceous belt of the Posillipo hill (150 m a.s.l) starts, and gently dips towards E-NE in the Sebeto-Volla plain [
42]. This morphology is linked to the growth of Napoli city in a complex multi-source active volcanic area sandwiched between the Campi Flegrei volcanic field and the Somma-Vesuvio district. It is situated in a large graben, broken into smaller horst and graben structures, connected to the Pliocene-Quaternary Tyrrhenian margin evolution [
42,
43,
44,
45,
46,
47]. In particular, the western sector of the city is set on the horst-type structure of Campi Flegrei caldera, the eastern one is located in a smaller graben, bounded to the east by another horst which hosts the Somma-Vesuvio volcano. The substratum of the city is made up of volcanic rocks, marine and alluvial deposits in response to regional, volcano tectonics and sea level changes occurred during the Holocene [
48].
Neapolitan Yellow Tuff (NYT, 15 ky, [
49]) forms the framework of most of the hills in Napoli and is overlain by the fall products of the last 10 ka explosive activity of Campi Flegrei. The same products are found in sparse boreholes of the Agnano, Bagnoli-Fuorigrotta, Pianura and Soccavo plains, with a mean thickness of 30 m [
50,
51]). The Agnano plain, generated by a volcano-tectonic collapse following the Agnano-Monte Spina eruption (4.1 ka [
52]), has a poly-crateric morphology linked to several eruptive events [
53]. In the subsurface also marine and swampy deposits are found, related to the volcano-tectonic evolution which occurred in the middle of the Holocene, when the northern half of the caldera was uplifted, while the southern half remained under the sea level to form the present bay of Pozzuoli [
54]. The Bagnoli-Fuorigrotta volcano-tectonic plain is filled with the products of the post-NYT explosive activity. In the southern part of the Bagnoli-Furigrotta plain, as in the Agnano plain, the volcanic products are interbedded to marine deposits [
48,
50,
51].
Several drill holes performed in the eastern part of the city, corresponding to the Sebeto-Volla Holocene coastal plain, encountered the effusive and explosive products of Somma-Vesuvio and the explosive products of Campi Flegrei piled up during the last 15 ka. The stratigraphic successions of over one hundred drill holes were investigated [
51,
55] and made it possible to deduce the presence of marine and alluvial deposits embedded to volcanic products. In the western sector of Sebeto-Volla plain prevails the NYT that thins toward the eastern sector, where lava flows and pyroclastic flow deposits of the Somma-Vesuvio eruptions are more common.
Figure 2.
Location of study area. In the 3D view the morphology of area close to the Napoli municipality is reported (red line) (a); The Napoli city is drawn at national (b) and regional (c) scale.
Figure 2.
Location of study area. In the 3D view the morphology of area close to the Napoli municipality is reported (red line) (a); The Napoli city is drawn at national (b) and regional (c) scale.
This complex geological and morphological on-set coupled with several sources of hazard (earthquakes, landslides, pyroclastic flows) that could trigger the tsunamis as cascade events and the intense urbanization make the Napoli city a good test area for the RVI assessment. For the case study area, firstly the tsunami hazard zone was defined by applying a deterministic approach based on a worst case scenario [
56] and then the urban vulnerability was assessed.
3.1. Tsunami Hazard in Napoli Gulf
The occurrence of past tsunami events in the Napoli Bay is testified to in historical sources. In his
Geographica (source in Buchner, [
57]), the Greek writer Strabo (64 B.C.–21 A.D.) gives the description of a sudden collapse of a sector of the Ischia island with an associated tsunami wave aged before the Greek period and recently dated between ~3 ka B.P. and 2.4 ka B.P. [
58]. The possible consequences of this event were assessed by Tinti
et al. [
59], suggesting that this could have produced a tsunami that propagated in the Gulf of Napoli in 8 to 15 minutes time and reached the present city site with a water elevation of 20 m.
The mass failures may be responsible for the generation of tsunami waves [
60]; the largest events may have an effect at the scale of the whole Mediterranean basin and bear a high tsunamigenic potential regardless of the water depth at which they occur. Landslides exceeding 10 km
3 in volume can still bear significant tsunamigenic potential at regional scale, and therefore their probability of occurrence should be carefully considered.
Tsunamis linked to the volcanic activity of Somma-Vesuvio are rare, nevertheless, the historical documents report the occurrence of anomalous waves in the Gulf of Napoli not only in correspondence of the largest explosive eruptions (79 A.D., 1631) but also of the low-size eruptive events of 14 May 1698, 17 May 1813 and 4 April 1906 [
61,
62]. Tinti
et al. [
62] analyzed through numerical simulations the sea perturbation provoked by the lightest component of the pyroclastic flows travelling down the flank of the Vesuvio volcano. They pointed out that the size of tsunamis that could reach Napoli is moderate and that they would produce effects similar to those triggered by the pyroclastic flows of the 1631 eruption [
63,
64,
65,
66].
Tsunami hydrodynamic modeling includes three main steps: generation, propagation and inundation [
67]. The thorniest issue in tsunami calculation is not deep water propagation, but rather the point where the waves are generated and the point where the waves run into shallow water and then onto land. The first part is critical to assess the intrinsic level of hazard, the second is important to map site-specific hazard [
68].
The present work mainly deals with the inland propagation of water. The results of numerical model applied by Tinti
et al. [
59] that explores the consequences of the Ischia Debris Avalanche (IDA) which occurred in historical times, was used as input data to assess the maximum inland inundation. A giant sea wave triggered by the flank collapse of Ischia Island may have affected all the coasts of Ischia and of the Gulf of Napoli. It can be considered an extreme event for the Napoli Bay, in fact those occurred in historical times were characterized by a lower wave height [
59,
61,
62,
63,
64,
65,
69]. The mechanism that has led to overload-oversteepening, and thus to failure, is the volcano-tectonic uplift of the Mt Epomeo and the recurrent seismicity of the area may ultimately have triggered the mass failure [
58].
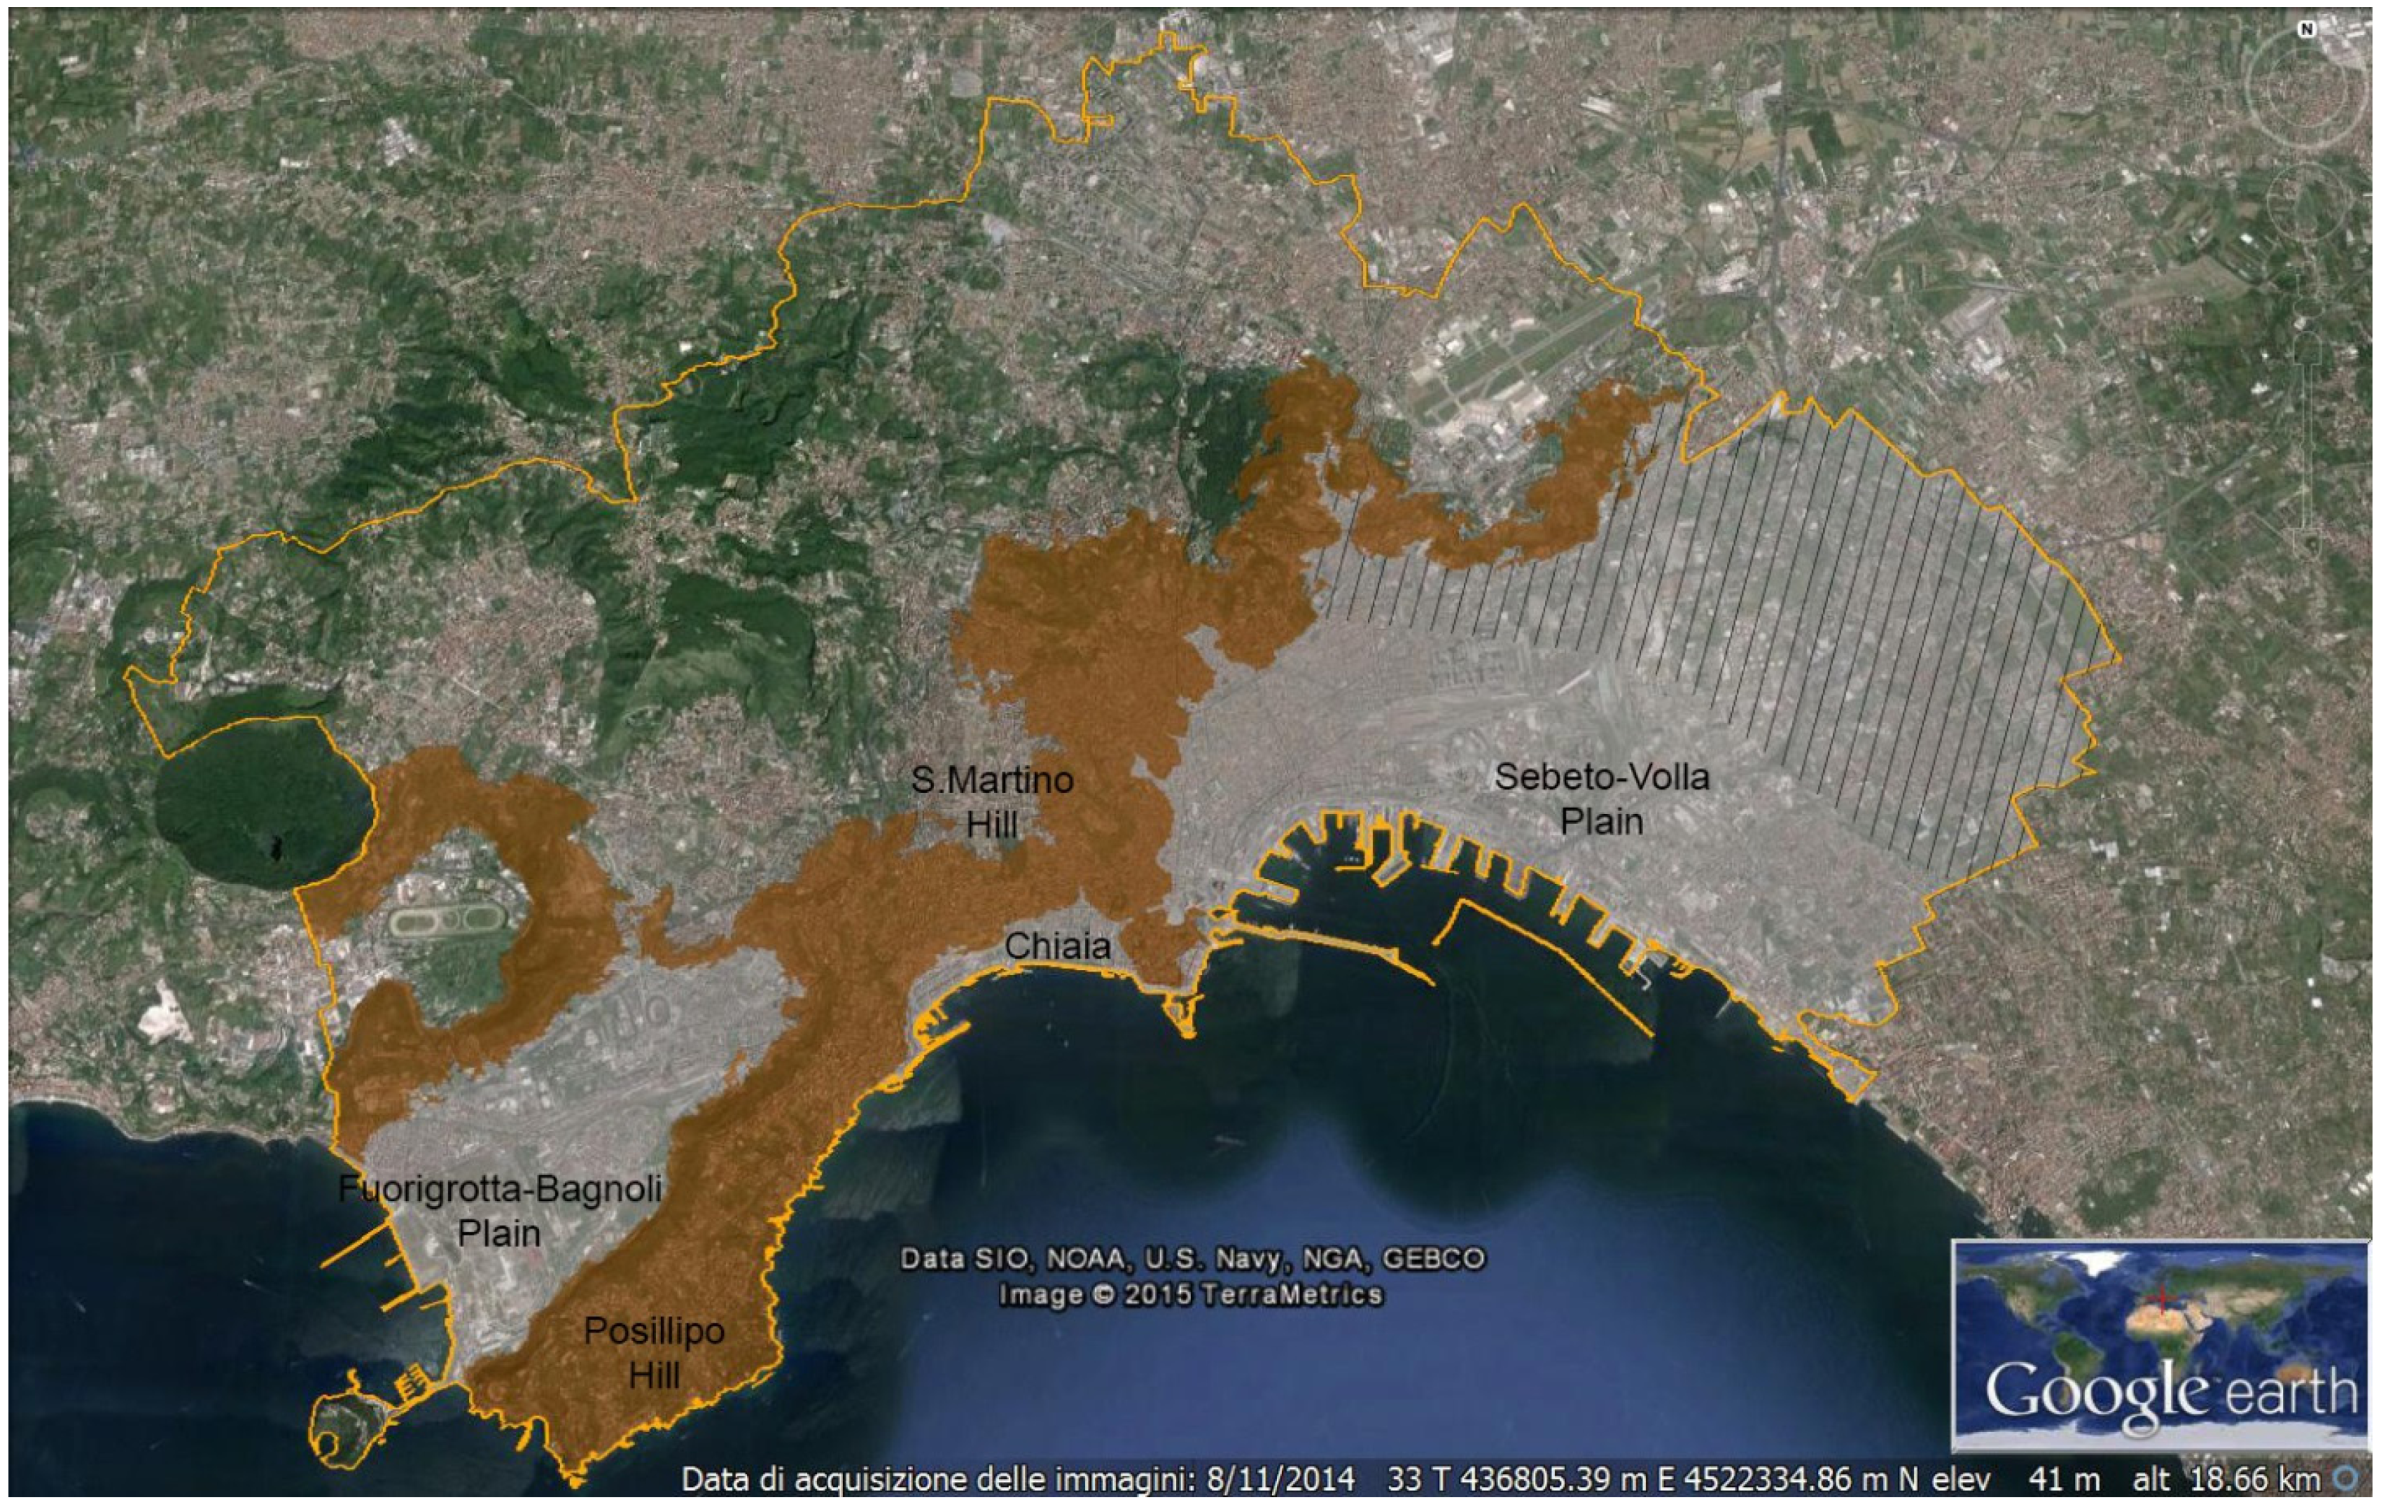
Figure 3.
Topographic barriers and areas prone to inundation. The zones with slope exceeding 5° (brown color) and those prone to inundation (white color, slope lower than 5°) are shown. The dashed lines indicate the areas more than 1200 m away from the shoreline.
Figure 3.
Topographic barriers and areas prone to inundation. The zones with slope exceeding 5° (brown color) and those prone to inundation (white color, slope lower than 5°) are shown. The dashed lines indicate the areas more than 1200 m away from the shoreline.
This event, which occurred about 36 km away from Napoli city, may have determined a maximum wave height of about 20 m along the coast of the study area. The identification of areas likely to be flooded was carried out assuming that the first wave reaches the maximum height and keeps the free horizontal surface condition. This hypothesis, as a first approach to the problem, acts for safety advantage and completely neglects the loss of energy to which the mass of water undergoes during propagation on the mainland. Accepting this hypothesis, the inland tsunami propagation was defined through a run up formula
[
70], where “
I” is the maximum inland inundation,
Ru is the maximum water height calculated by Tinti
et al. [
59] and α is the slope characterizing the coastal zones of the study area. In order to consider the influence of inland morphology on the maximum inland propagation [
71,
72,
73,
74], a slope zoning of coastal zone was performed from a detailed Digital Elevation Model (DEM) [
75]. Firstly a Boolean map was drawn to point out the area with high spatial probability to be inundated (white zones in
Figure 3), and those with slope exceeding 5° that represent topographic barriers against the tsunami inland propagation (dark brown in
Figure 3); in fact, since a value of α = 5° and a water elevation of 20 m, deduced for IDA [
29], were taken into account the maximum depth is about 200 m. For the Sebeto-Volla and Chiaia zones a mean slope of 1° and 2° was respectively calculated and used in the run-up formula to delineate the maximum inundation depth (
Figure 4). Moreover, the inundation height (
Ih) was assessed by applying the relation
Ih =
Wh −
Th, where
Wh is the water height and
Th is the topographic height [
70,
76], the inundability becomes zero when topographic height is larger than the water height.
Figure 4.
Location of zones that could be reached by a tsunami. The black boxes in (a) indicate the two inland zones prone to tsunami inundation. In (a1) and (a2) the light blue zones point out the maximum tsunami inland propagation and the green lines represent the topographic contours with 10 m interval. The Napoli city is drawn at national (b) and regional (c) scale.
3.2. Urban Vulnerability of Napoli City
Starting from the method described in
section 2, in the following the criteria adopted to define the role of attribute, parameters and factors necessary to calculate the RVI for urban areas of Napoli city are explained.
For the number of floors (
s), the lowest vulnerability was assigned to the buildings with four and more than four floors and the highest to buildings with one floor considering that several floors of a multi-floor building could be safe from inundation and consequently host the people climbing upstairs from the lower floors (
Table 2,
Figure 5A1).
As far as the building materials (
m) are concerned, Napoli is characterized by reinforced concrete and masonry buildings; a level of vulnerability higher than reinforced concrete was assigned to masonry because of its excellent resistance to vertical stresses, but poor ability to react to horizontal forces (
Table 2,
Figure 5A2).
As to the ground floor hydrodynamics (
g), buildings with openings on the ground floor showed lower damage than the other building typologies. In the study area, there are few buildings displaying these features, therefore a unique index was assigned to all buildings (
Table 2,
Figure 5A3).
For the shape and orientation of buildings (
so), an index value that increases from buildings inscribed into a square to buildings with irregular floor plan and with the long side normal to the direction of flow was defined (
Table 2,
Figure 5A4).
For the year of construction (
y), an index taking into account the age of the building (
Table 2,
Figure 5A5) was calculated.
Table 3.
Indices of protection attributes. List of indices assigned to the single attribute influencing the level of protection of a building (
Prot). The values from 0.25 to 1 indicate an increase of the average building vulnerability ([
29], modified).
For building row (
br), the number of structures located between each building and the coastline is one of the most important protection factors against the impact of tsunami. For the “Porto di Napoli” and the area close to “Via Marina”, the buildings are spread over the territory and are directly exposed to the tsunami propagation; the maximum vulnerability was assigned to them. To each building located at the back of Via Marina a decreasing vulnerability was assigned in response to the idea that moving away from the coast the buildings are protected by an increasing numbers of building rows (
Table 3,
Figure 5B1).
For seawall (
sw), in the Gulf of Napoli there are just two breakwaters with rectangular shape with the main wall perpendicular to the flood. The height of these protections was used to calculate the related index value, the higher the protection the lower is the vulnerability. The
sw was the only attribute defined at a scale larger than the census district. The area exposed to tsunamis was divided into three sectors: (a) the zone without seawall protection; (b) the zone protected by a seawall with a mean height of 1.20 m a.s.l.; (c) the zone protected by a seawall with mean height of 0.9 m a.s.l. (
Table 3,
Figure 5B2).
Figure 5.
Attributes maps. Frameworks displaying the spatial distribution of building vulnerability (A1–A5) and protection factors (B1-B2): (A1) number of floors; (A2) buildings material; (A3) capability of the ground floor to resist to water flow pressure; (A4) shape and the orientation of building; (A5) year of building; (B1) buildings row; (B2) seawall protection; In the picture (C) the framework of the study area is shown.
The attributes were ranked into several classes and labeled with specific indices to figure out their contribution to the vulnerability assessment at census scale (
Table 4). The ranking of values was performed according to the natural break method; it identifies groups and patterns of data in a set by defining the separation points among the frequency values and minimizing the variance in each class [
77]. These values and the weighting factors (
wi) were entered in equations (3) and (4) to define the
Bv and
Prot parameters and consequently the
Sv factor of equation (1).
Moreover, to easily and entirely visualize the spatial distribution of the attributes, the sub-parameters and factors used in the RVI assessment were depicted into easily readable maps.
Table 4.
List of attributes and parameters structural vulnerability assessment. The attributes and parameters were classified into four vulnerability classes.
Table 4.
List of attributes and parameters structural vulnerability assessment. The attributes and parameters were classified into four vulnerability classes.
| Parameters and Attributes | Range |
|---|
| Low (1) | Medium (2) | High (3) | Very high (4) |
|---|
| Building vulnerability (Bv) | 1.00–2.25 | 2.25–2.83 | 2.83–3.45 | 3.45–4.00 |
| Number of stories (s) | 0.00–0.35 | 0.35–0.45 | 0.45–0.79 | 0.79–1.00 |
| Building materials (m) | 0.00–0.32 | 0.32–0.54 | 0.54–0.68 | 0.68–0.75 |
| Ground floor hydrodynamics (g) | | | | 1.00 |
| Shape and orientation (so) | 0.00–0.54 | 0.54–0.72 | 0.72–0.89 | 0.89–1.00 |
| Year of construction (y) | 0.00–0.58 | 0.58–0.81 | 0.81–0.93 | 0.93–1.00 |
| Protection (Prot) | 0.00–1.43 | 1.43–2.30 | 2.30–3.14 | 3.14–4.00 |
| Building row (br) | 0.00–0.35 | 0.35–0.59 | 0.59–0.82 | 0.82–1.00 |
| Seawall (sw) | | 0.5 | 0.75 | 1.00 |
| Exposure (Ex) | 1200–885 | 885–590 | 590–295 | ≤ 295 |
4. Results and Discussion
The main goal of this study was to draw a map showing the vulnerability of a wide urban environment to the occurrence of tsunamis thought as a tool for the territorial planning. In the following the spatial distribution of all attributes and parameters used to assess the tsunamis vulnerability of Napoli city is recalled.
4.1. Attributes Maps
In
Figure 5A,B the spatial distribution of attributes required to define the building vulnerability (frames A1 to A5) and protection parameters (frames B1 and B2) are respectively shown.
The frames from A1 to A5 point out some differences between the western part of the city, which represents the oldest suburb, and the eastern one, mainly characterized by industrial activities.
The frame A1 refers to the number of floors attribute. It shows that the western area has a medium-low vulnerability (yellow to green color) due to the presence of many buildings with four or more floors; the eastern area, on the counterpart, is characterized by buildings with few floors (orange to red color = medium-high vulnerability).
The frame A2 shows the distribution of type of material attribute, and a high vulnerability results for the western part of the city as a consequence of the wide presence of masonry buildings. The eastern zone is characterized by the presence of both reinforced concrete and masonry buildings; this condition causes a level of vulnerability variable and proportional to the type of buildings characterizing the single census district.
The frame A3 depicts the distribution of hydrodynamics of the ground floor attributes; a unique value of high vulnerability was assigned to the whole study area because most buildings have the ground floors closed by thick walls.
The frame A4 provides information on the distribution of shape and orientation of buildings attribute. The western part of the study area is more vulnerable than the eastern one, because in the former the buildings with the long side normal to water flow prevail.
The frame A5 shows the spatial distribution of the year of construction attribute; the census districts with low vulnerability (shades of green) are mostly made up of edifices built after 1982 and are concentrated in the eastern area.
The frame B1 outlines the areas with a different number of building rows attributes. Four zones with a level of vulnerability decreasing proportionally to the increasing distance from the shoreline are identified. The highest vulnerability pertains to the buildings located in the first row facing the shoreline, conversely the buildings far away from the shoreline (green color) are protected from the tsunami effect by a high number of building rows.
The frame B2 points out the protection role of seawalls. The western and the eastern zones have the highest vulnerability because of the absence of a seawall, whereas the central area shows a good level of protection due to the presence of two man-made protection structures.
4.2. The Bv, Prot and Ex Parameters Maps
The maps of the single attributes were spatially combined, following the relation (3) and (4), to outline the distribution of
Bv and
Prot (
Figure 6 A,B) parameters into two new maps.
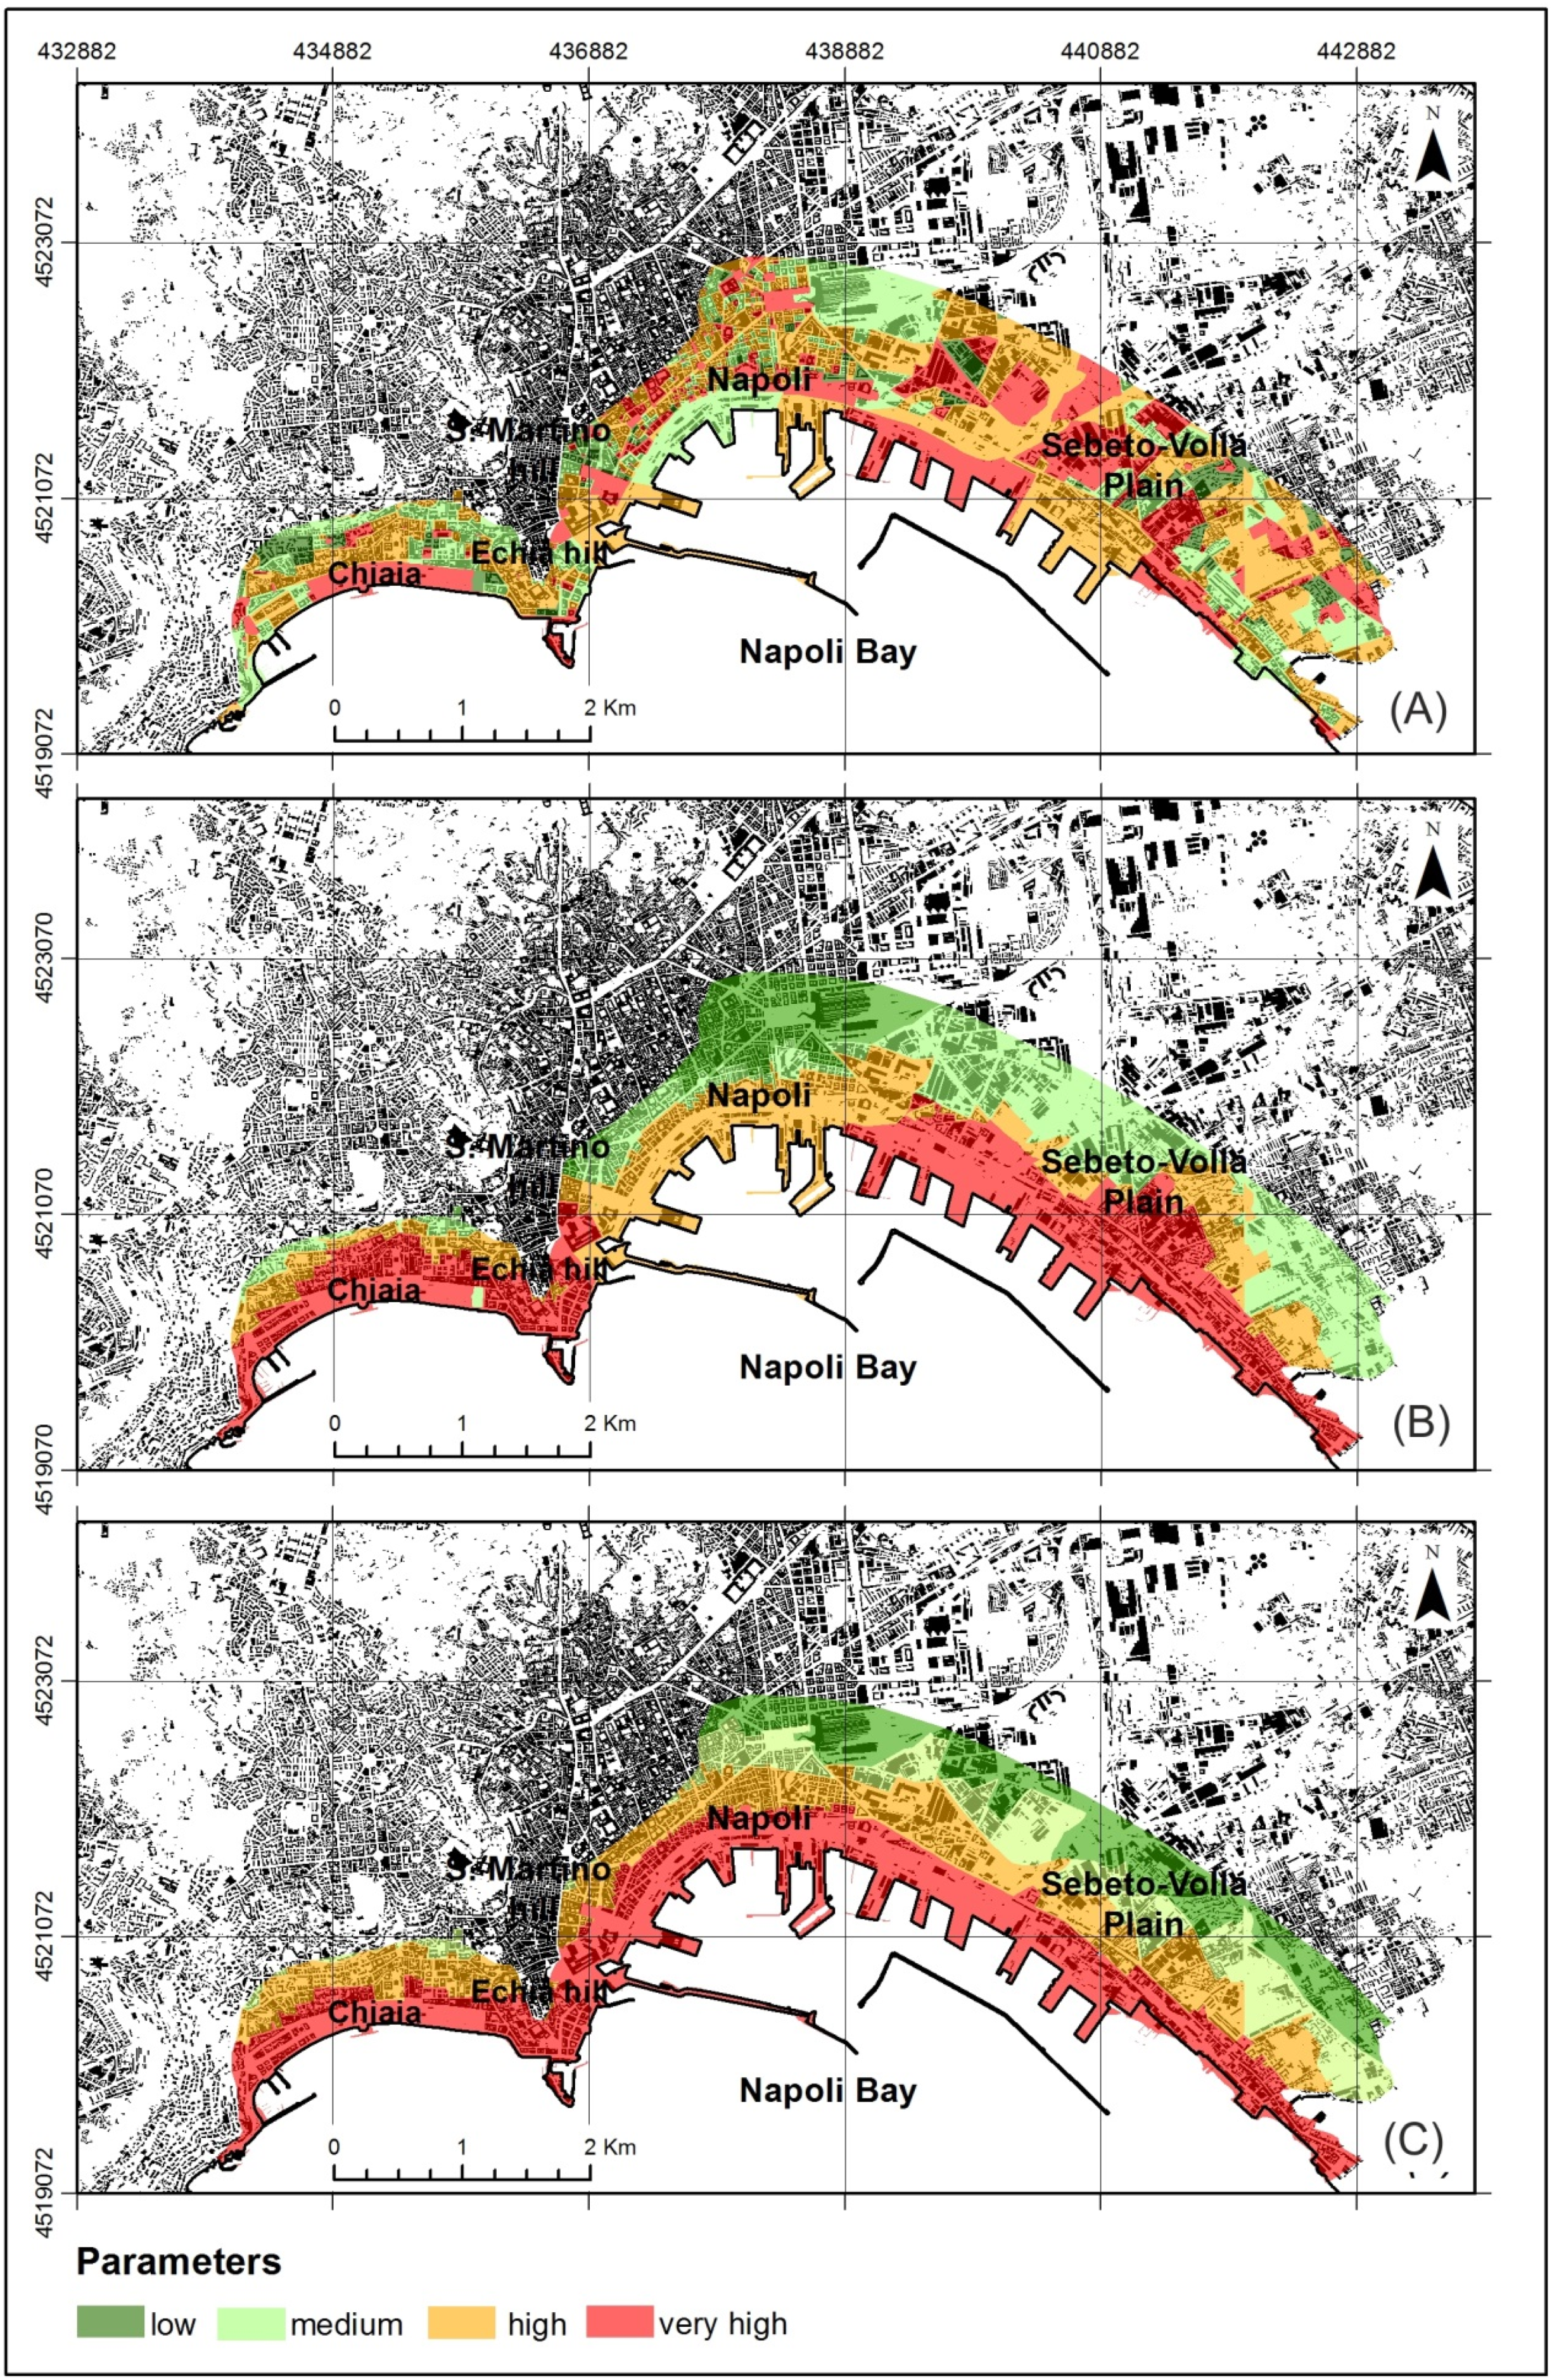
Figure 6A shows the vulnerability of urban environment in response to buildings features. Most of the investigated area shows a medium to high level of vulnerability, mainly due to the diffused presence of large masonry buildings. In detail, the low vulnerability of the western zone is linked to the number of floors and the medium-high vulnerability to shape and orientation and year of construction, whereas the eastern sector shows opposite conditions.
Figure 6B summarizes the effects of number of building rows and seawall attributes on the protection parameter assessment. The map points out that the more a vulnerable area is close to the shoreline and that at the same distance from it the central area of the city is less vulnerable (orange color) than the two side zones (red color) due to the presence of protection barriers. Yellow and green colors characterize the zones far from the shoreline.
Figure 6C depicts the contribution of water flow (
Ex parameter) at the site where the building is located; since the pressure applied to the building decreases with distance from the coastline, the census district vulnerability decreases with increasing distance from it.
Figure 6.
Parameters maps. The maps show the distribution of classes for building vulnerability (A), protection (B) and exposure (C) parameters.
Figure 6.
Parameters maps. The maps show the distribution of classes for building vulnerability (A), protection (B) and exposure (C) parameters.
4.3. The Sv and Wv Factors Maps
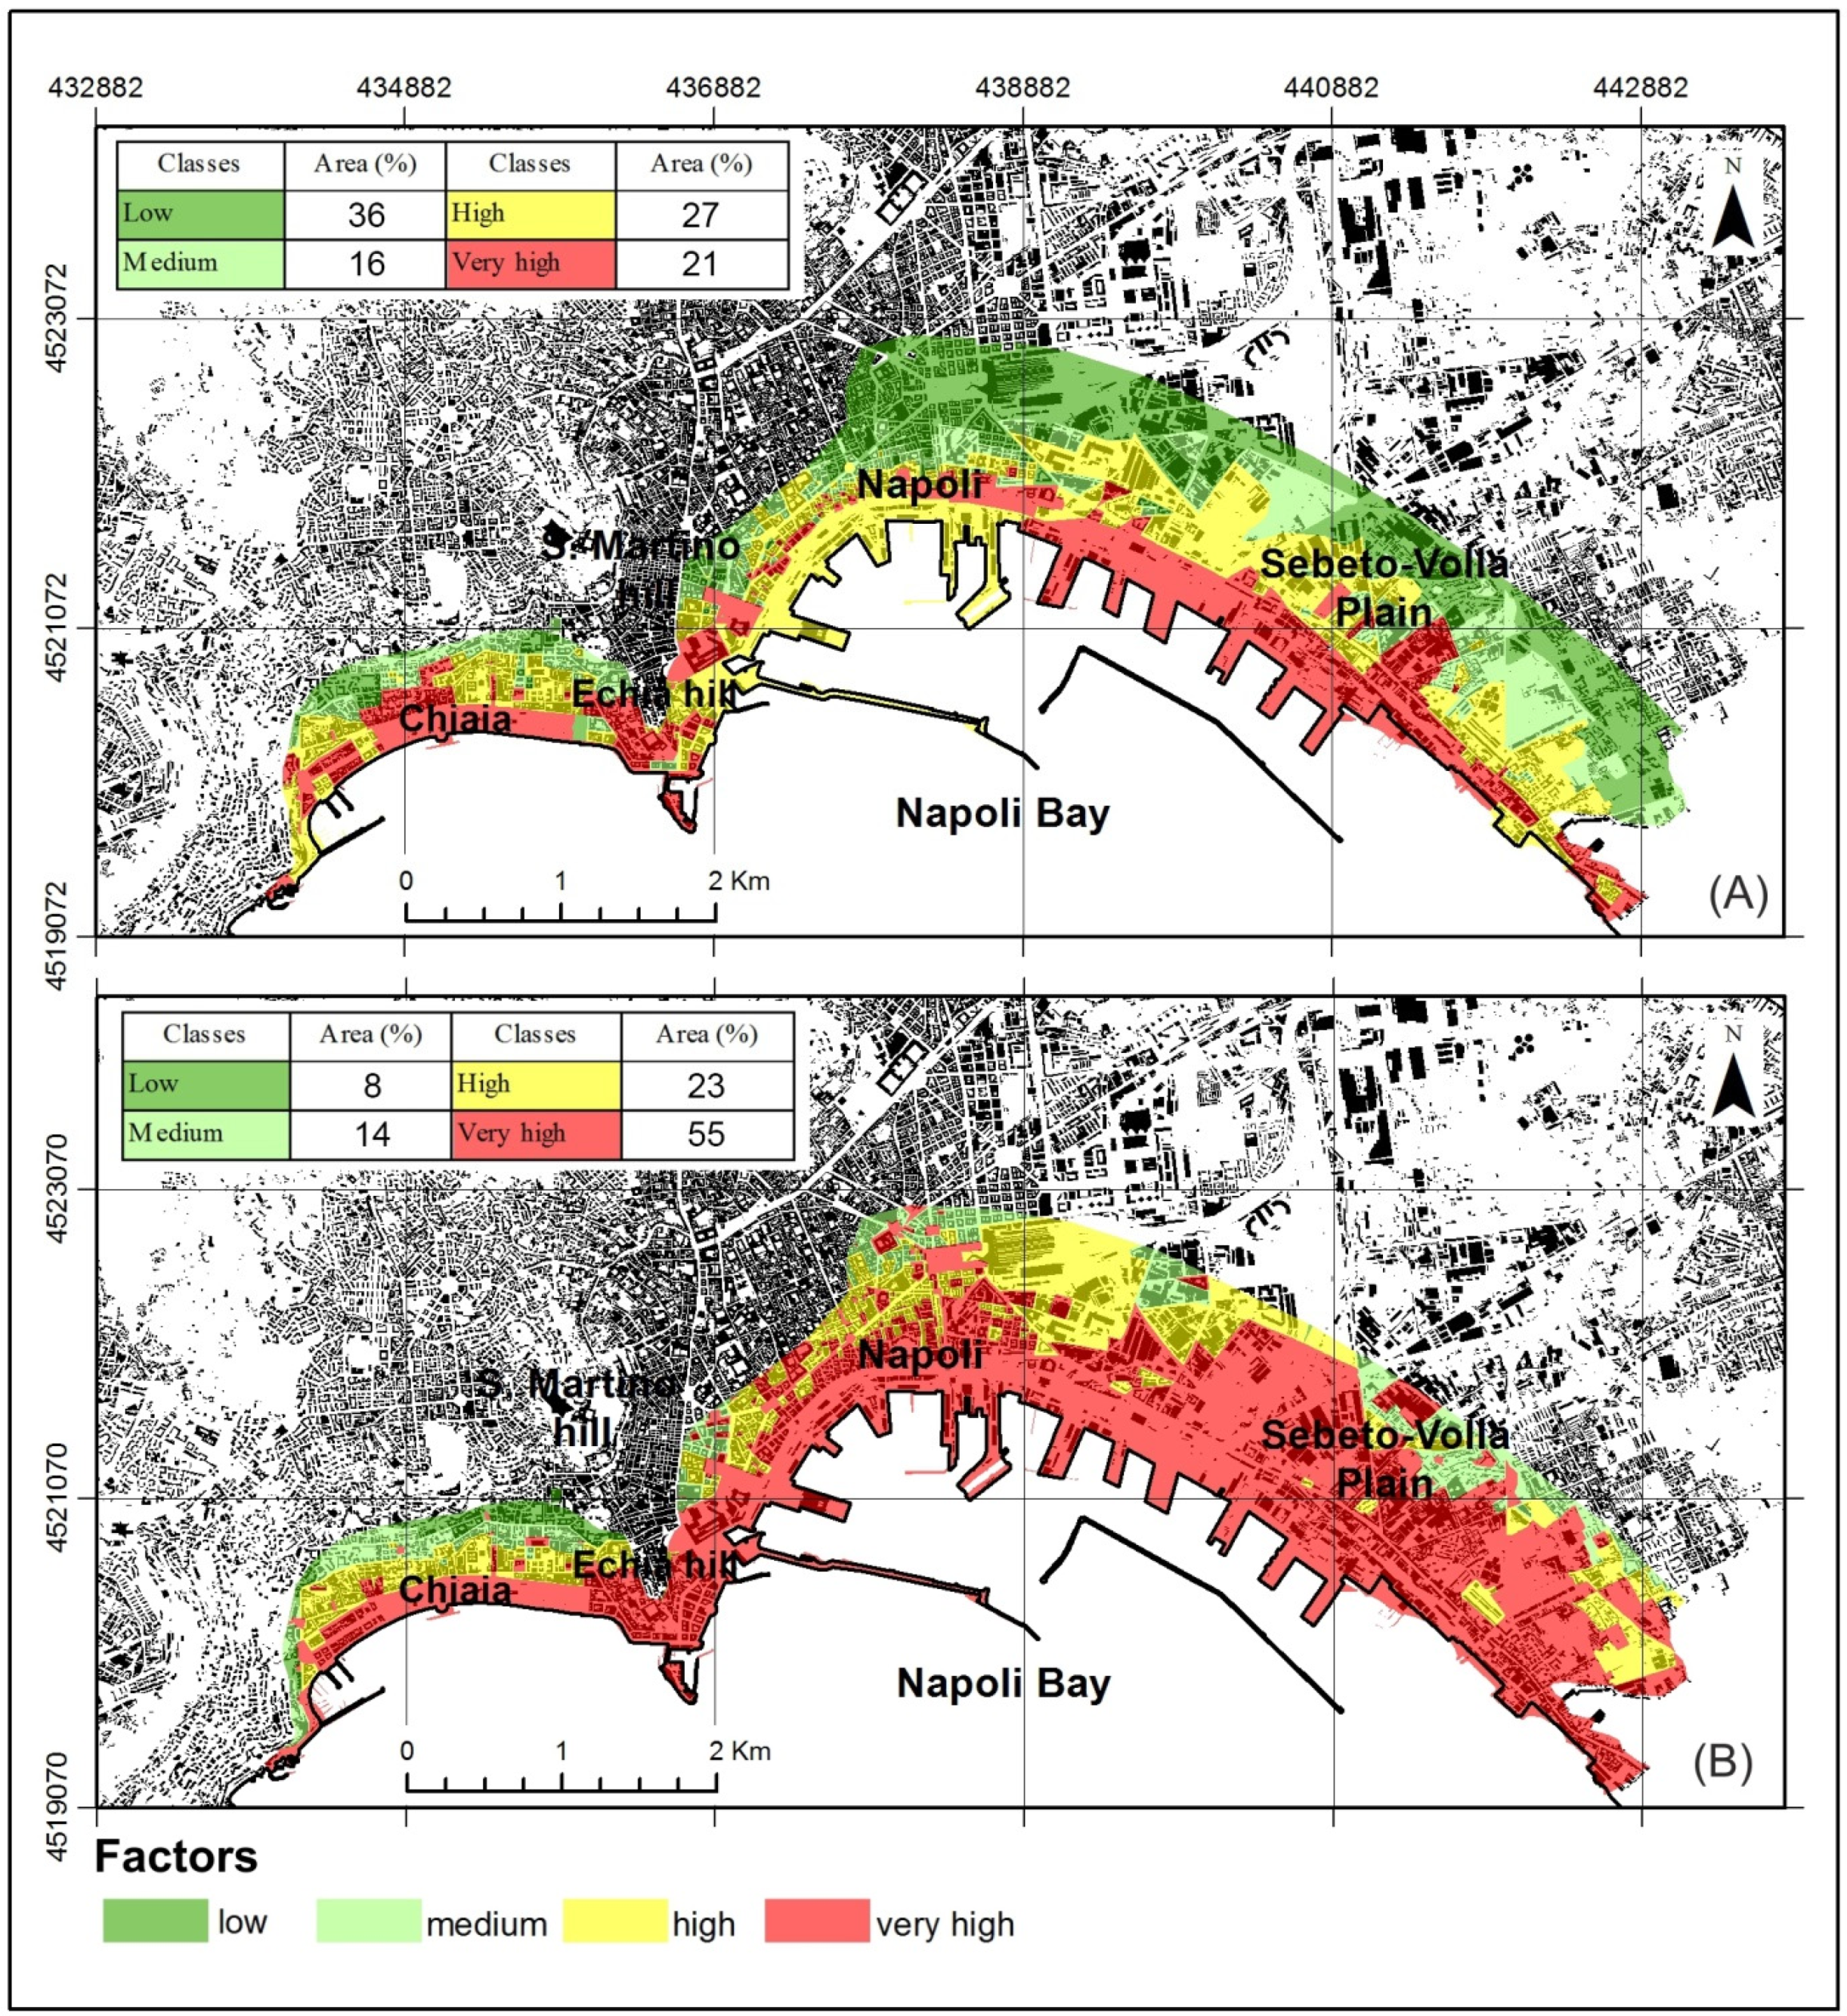
The structural vulnerability map (
Figure 7A) zones the territory through the combined effect of buildings vulnerability, protection and exposure parameters. The highest
Sv values characterize the Chiaia area close to the shoreline and the eastern sector of Sebeto-Volla plain. A sea protection favored the occurrence of a medium vulnerability class in the central sector of the city. Moving away from the shoreline medium and low structural vulnerability characterizes all the territory. In detail, the percentage of area pertaining to the four
Sv classes evidenced that 36% of the inundated area is characterized by low vulnerability, 48% by high and very high vulnerability and only 16% is characterized by medium values.
Figure 7.
Maps of vulnerability factors. In A the vulnerability of the carrying capacity of the buildings structures (Structural Vulnerability) is depicted while in B the vulnerability of buildings as a consequence of their contact with tsunami waves (Water Vulnerability) is shown.
Figure 7.
Maps of vulnerability factors. In A the vulnerability of the carrying capacity of the buildings structures (Structural Vulnerability) is depicted while in B the vulnerability of buildings as a consequence of their contact with tsunami waves (Water Vulnerability) is shown.
The territorial zoning of water vulnerability factor (
Wv) evidences that the buildings close to the shoreline, where the inundation height is the highest, are the most vulnerable (red color in
Figure 7B). This factor is linked to the magnitude of the tsunami event simulated to define a vulnerability scenario. Considering a water elevation of 20 m [
59], all the buildings along the shoreline are submerged by the tsunami wave propagation. The
Figure 7B points out the different extent of water vulnerability classes. In the Sebeto-Volla Plain the area displaying the highest vulnerability (red zone) extends inland for about 1 km while in the western sector this class has an extent of about 400 m. The distributions of medium and low water vulnerability classes are similar, occupying 14 and 8% of inundated zone, respectively.
4.4. The RVI Map
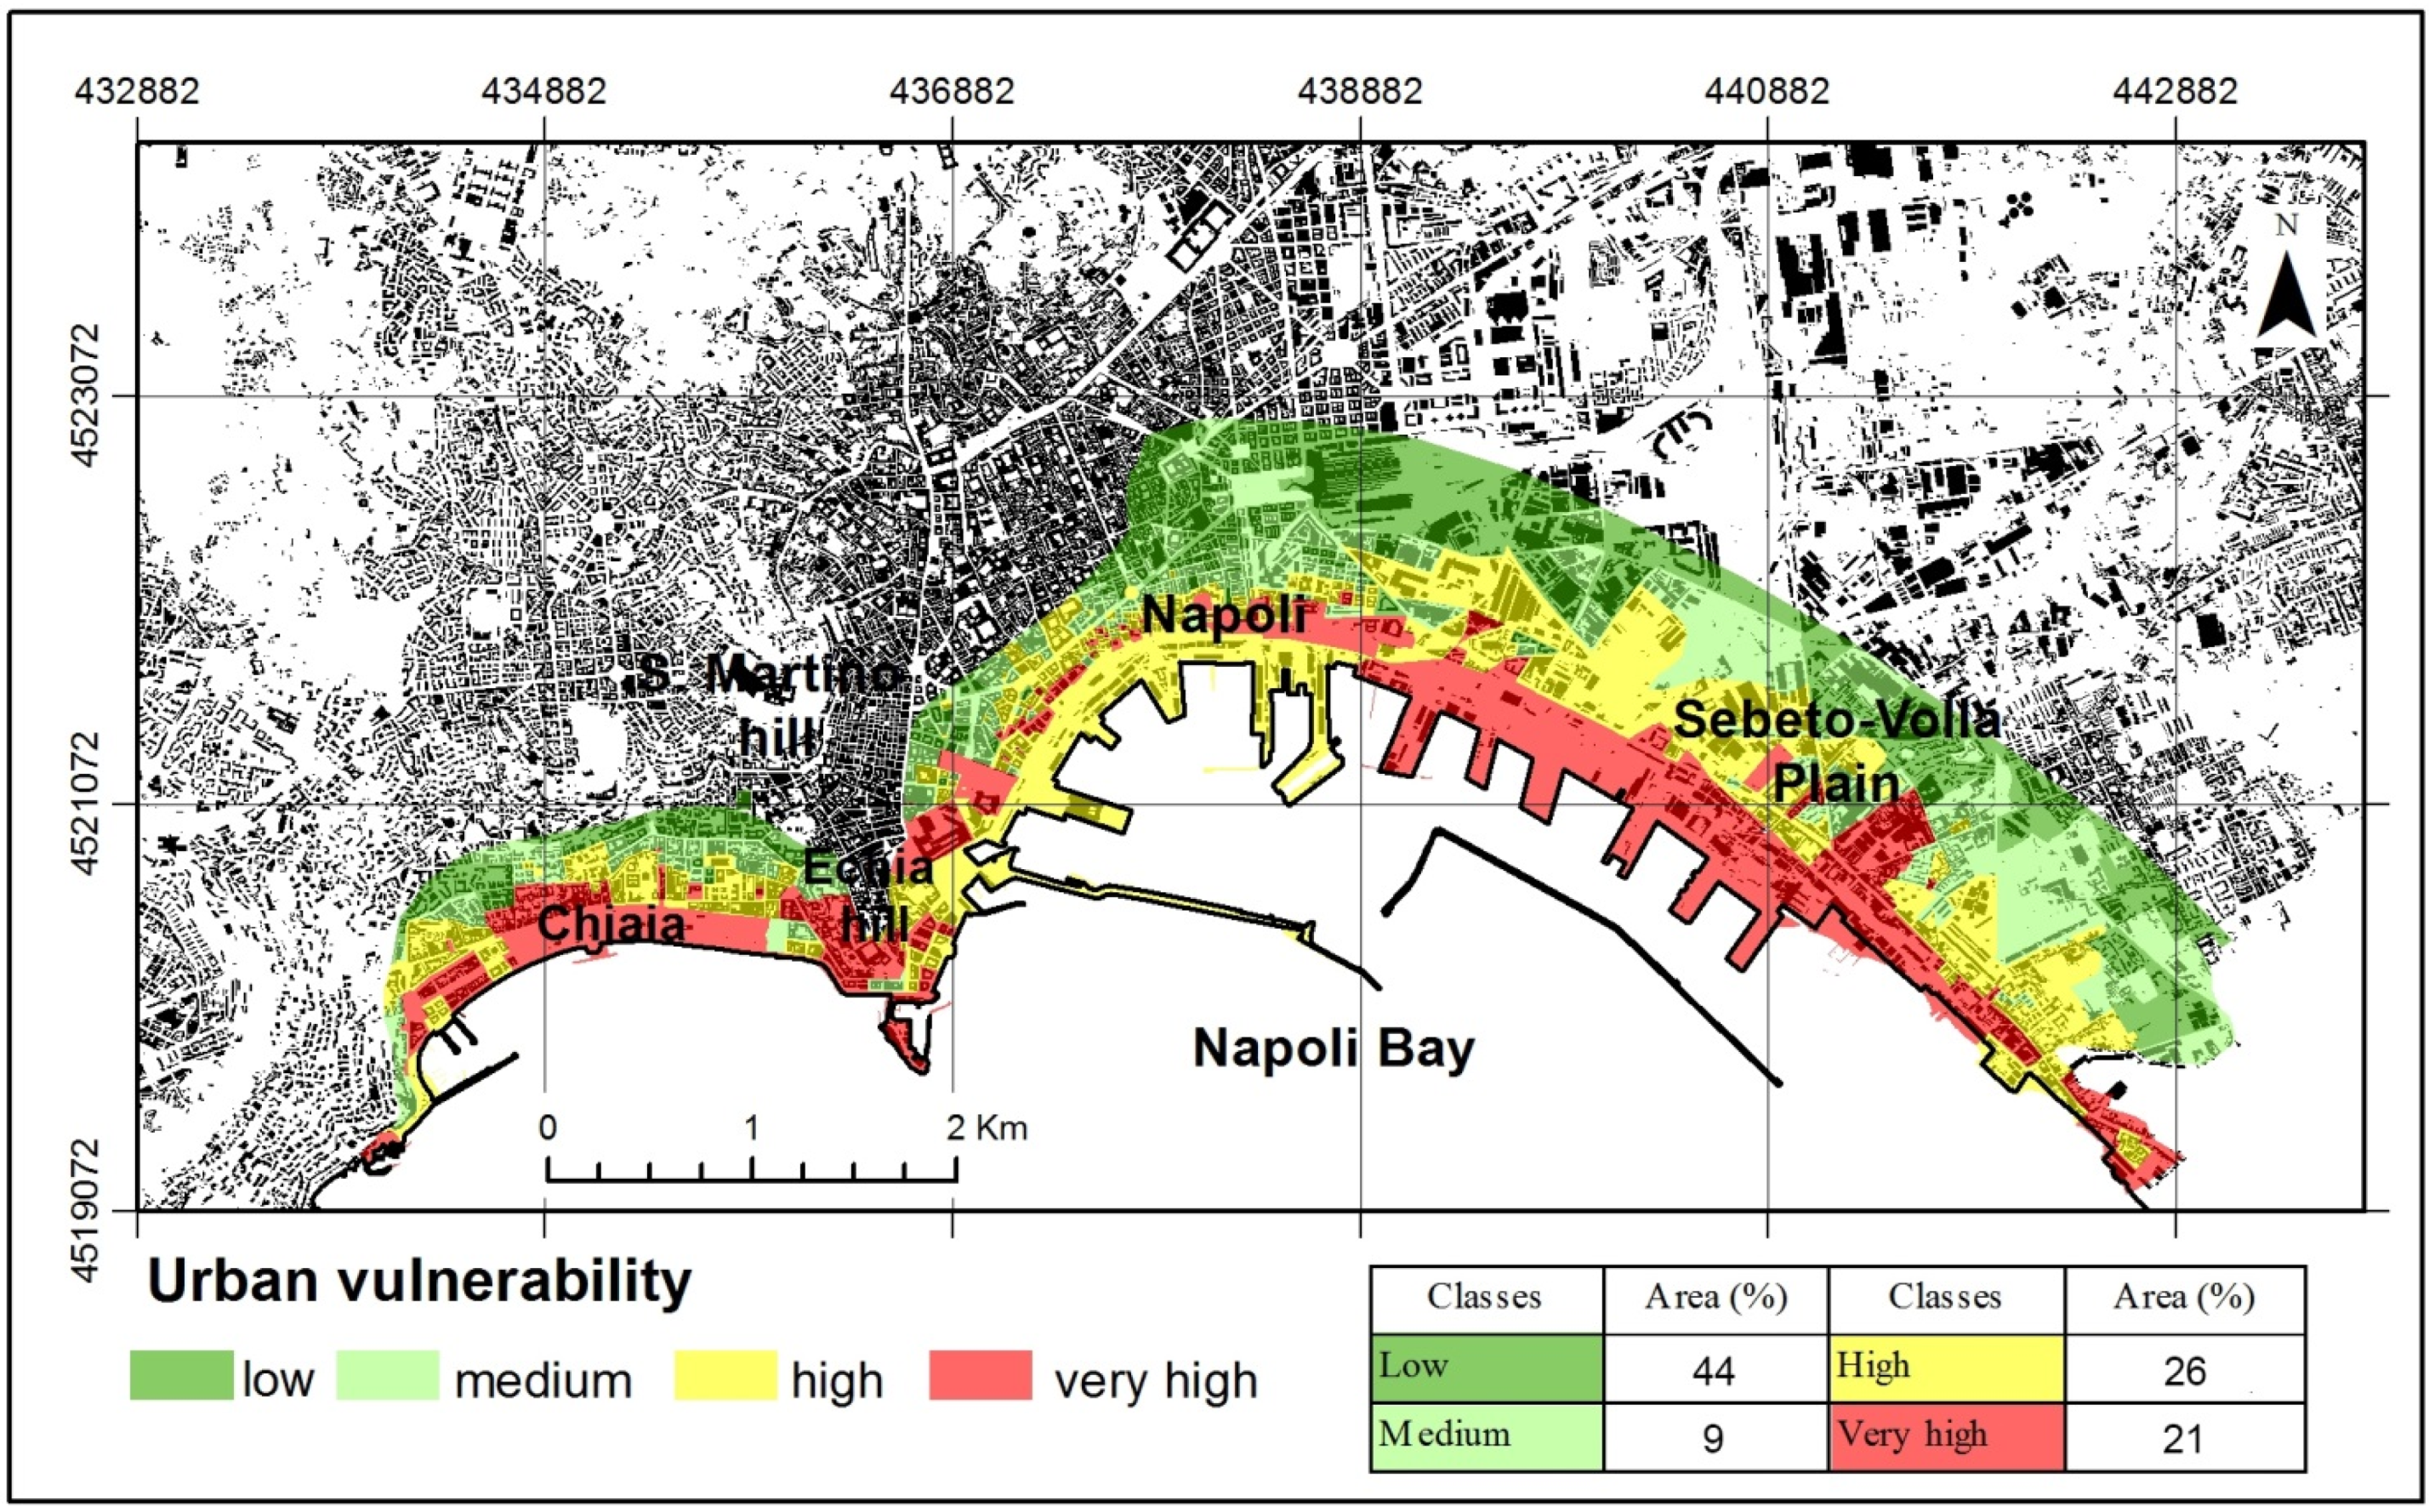
The Relative Vulnerability Index map summarizes the contribution of structural and water vulnerability factors. In fact, in the territorial zoning shown in
Figure 8 several sectors of coastal zones display medium structural vulnerability (
Figure 8) are classified as very highly vulnerable in the
RVI map thanks to the contribution of the
Wv factor. The coastal zones show the highest vulnerability of the whole study area, with a depth that increases moving from Chiaia to Sebeto-Volla plain. A similar spatial distribution characterizes the other vulnerability classes evidencing the key role of morphology. The gradient of area close to the narrow plain zone of Chiaia and the slopes of San Martino hill prevent the propagation of the tsunami that remains confined within the flat zone. In contrast, the gentle slope of Sebeto-Volla plain favors the propagation of tsunamis for a depth exceeding 1 km.
Figure 8.
The Relative Vulnerability Index Map of the study area. The colors from red to green indicate a decreasing level of vulnerability.
Figure 8.
The Relative Vulnerability Index Map of the study area. The colors from red to green indicate a decreasing level of vulnerability.
5. Conclusions
This paper proposes a workflow able to define the tsunami vulnerability of wide urban zones taking advantage of freely available datasets as the ISTAT [
30] urban dataset and the regularly up-dated Google Earth satellite images. The census district was assumed as the smallest geographical element for RVI (Relative Vulnerability index) assessment, which summarizes the contribution of two factors, the Structural Vulnerability (
Sv) and the Water Vulnerability (
Wv). The application of the procedure to the censual districts ensures a speedy data processing and a fast map visualization and can hence be successfully used both on the long time for territorial planning and on the short time for possible crisis management.
The method was applied to the case study of Napoli megacity because it is exposed to both volcanotectonic earthquakes, sourcing at Campania active volcanoes, and to tectonic high magnitude earthquakes, sourcing in the Apennine chain. Mostly the landslide cascade events of those earthquakes, implying the remobilization of huge quantities of rocks and their interaction with sea-water, could cause tsunami events. Apart from the high hazard related to tsunamis, the peculiar topography of the city, forcing urban zones to grow in the flat areas along the coastline, makes it even more vulnerable. Furthermore, the intense urbanization and the high population rates contribute to increase the risk of the city and make it worth a specific investigation of urban vulnerability in case of a future tsunami event.
The analysis make it possible to infer that all the buildings located within the narrow land belt along the coastline display a high vulnerability mainly because of their proximity to the sea and of the main occurrence of masonry building. In particular:
- A high value of Sv characterizes the Chiaia area close to the shoreline and the eastern sector of the Sebeto-Volla plain; sea protections favored the presence of a medium vulnerability class in the central sector of the city and moving away from the shoreline the medium and the low structural vulnerability prevails.
- A high value of Wv typifies a wide area of the Sebeto-Volla Plain, at depth more than 1 km, whereas in the western part Wv is controlled by the presence of a 70 m high hill, located only at 400 m from the coastline, that prevents the inland propagation of the tsunami wave.
- The same spatial distribution of high vulnerability class is shown by the medium and low vulnerability classes that are progressively located farther from the coastline.
-
RVI map, as the sum of
Sv and
Wv, shows that very high and high vulnerability (47%) typifies the areas along the shoreline for a depth of about 300 m in the western sector and of about 700 m in the eastern one. This final
RVI map reflects the magnitude of the type-event on which the procedure is based, that for the Napoli city case study is a high magnitude event (IDA, [
59]), but one of the advantages of the workflow implemented in a GIS environment is to make it possible to routinely change the tsunami scenario, by changing the
Wv factor, and rapidly redraw a new urban vulnerability map.
The RVI map here proposed is conceived as a basic tool for territorial planning in areas exposed to tsunami hazard, where laws and regulations are needed to promote the use of a building code with the aim of increasing durability of residential buildings and reducing the economic losses in case of a destructive event. In the present situation, for Napoli city, there is no tsunami risk program, either in the short term, finalized to a possible crisis management, or in the long term, for increasing resilience in population.
The possibility to identify the tsunami building vulnerability at the censual district scale, supplied by the noticeable flexibility of the GIS-aided procedure here coded, offers vital tools for spatial planning purposing to:
- identify the buildings with features that make them suitable for the vertical evacuation.
- hypothesize for the single areas a building code to reduce the future damage linked to a tsunami phenomenon (e.g., habitable space in building structures must be elevated above the regulatory flood elevation, walls and partitions are required to break away so as not to induce excessive loads on the structural frame, a stable refuge for the vertical evacuation should be provided, etc.).
- address resource allocation towards specific interventions aimed at reducing the urban vulnerability.


