Inter-Annual Variability in Blue Whale Distribution off Southern Sri Lanka between 2011 and 2012


Abstract
:1. Introduction
2. Methods
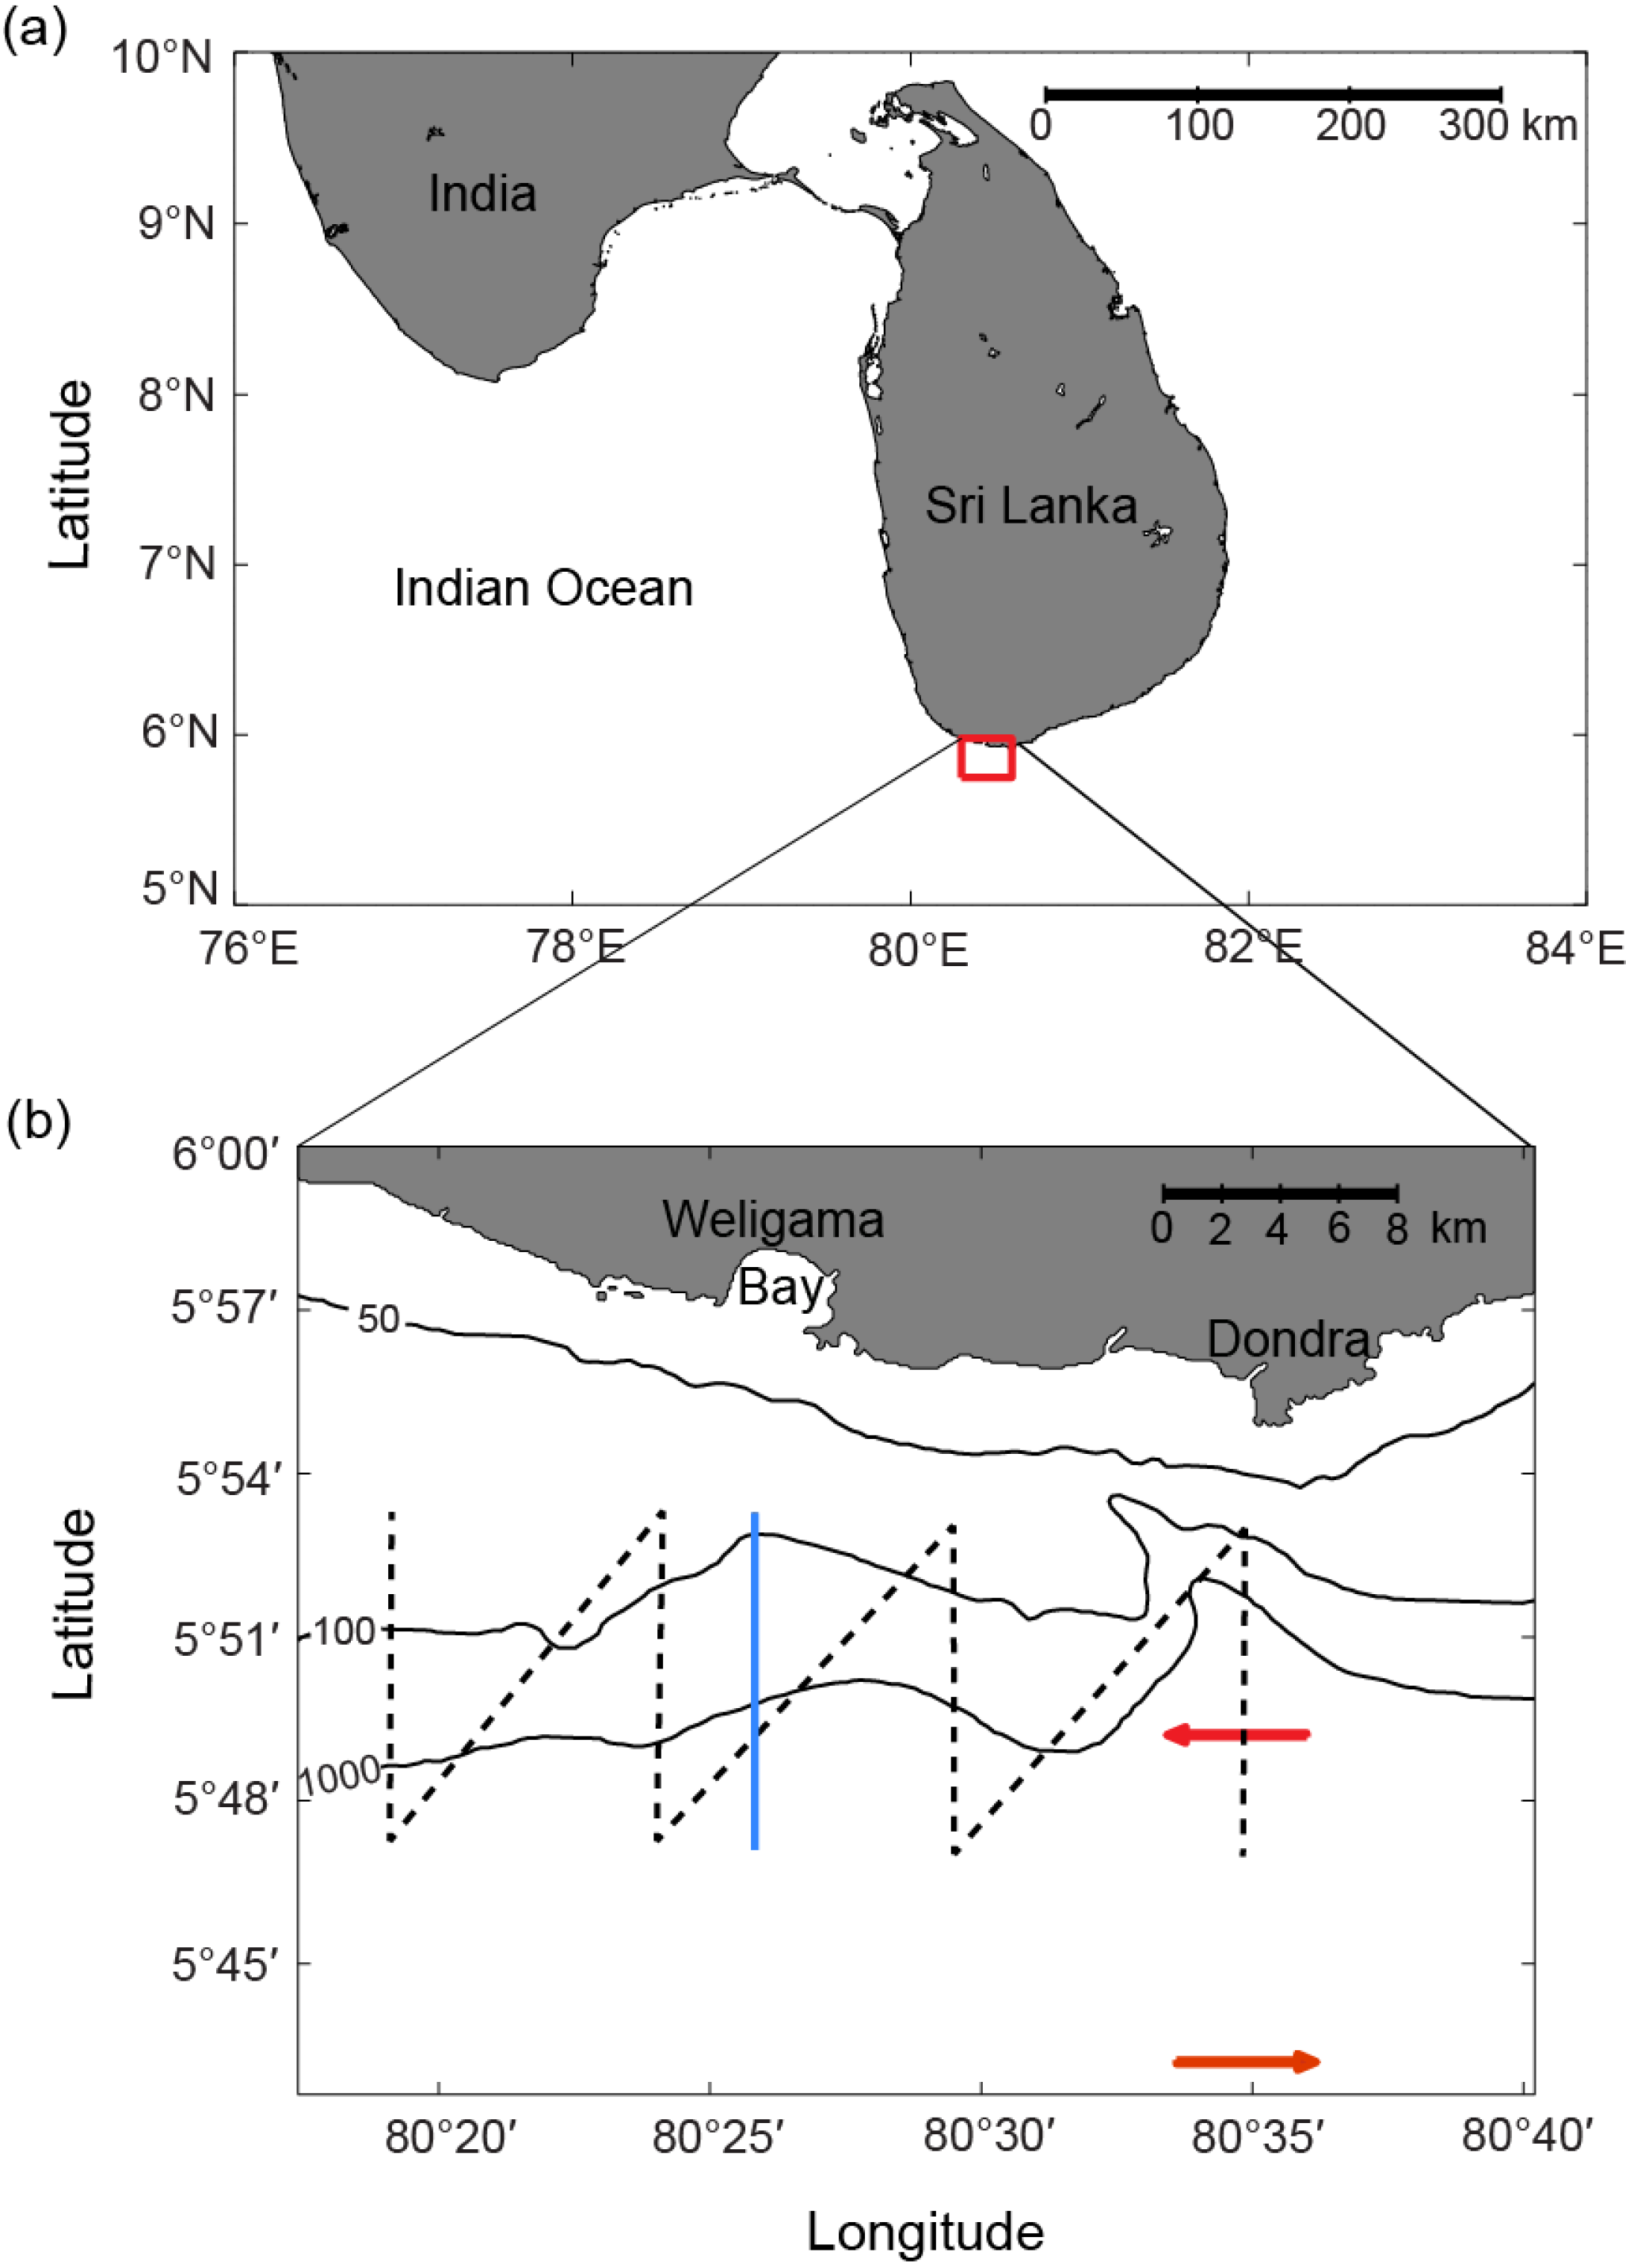
2.1. Survey Area

2.2. Satellite Data
2.3. Survey Methodology
2.4. Data Processing and Analysis
3. Results
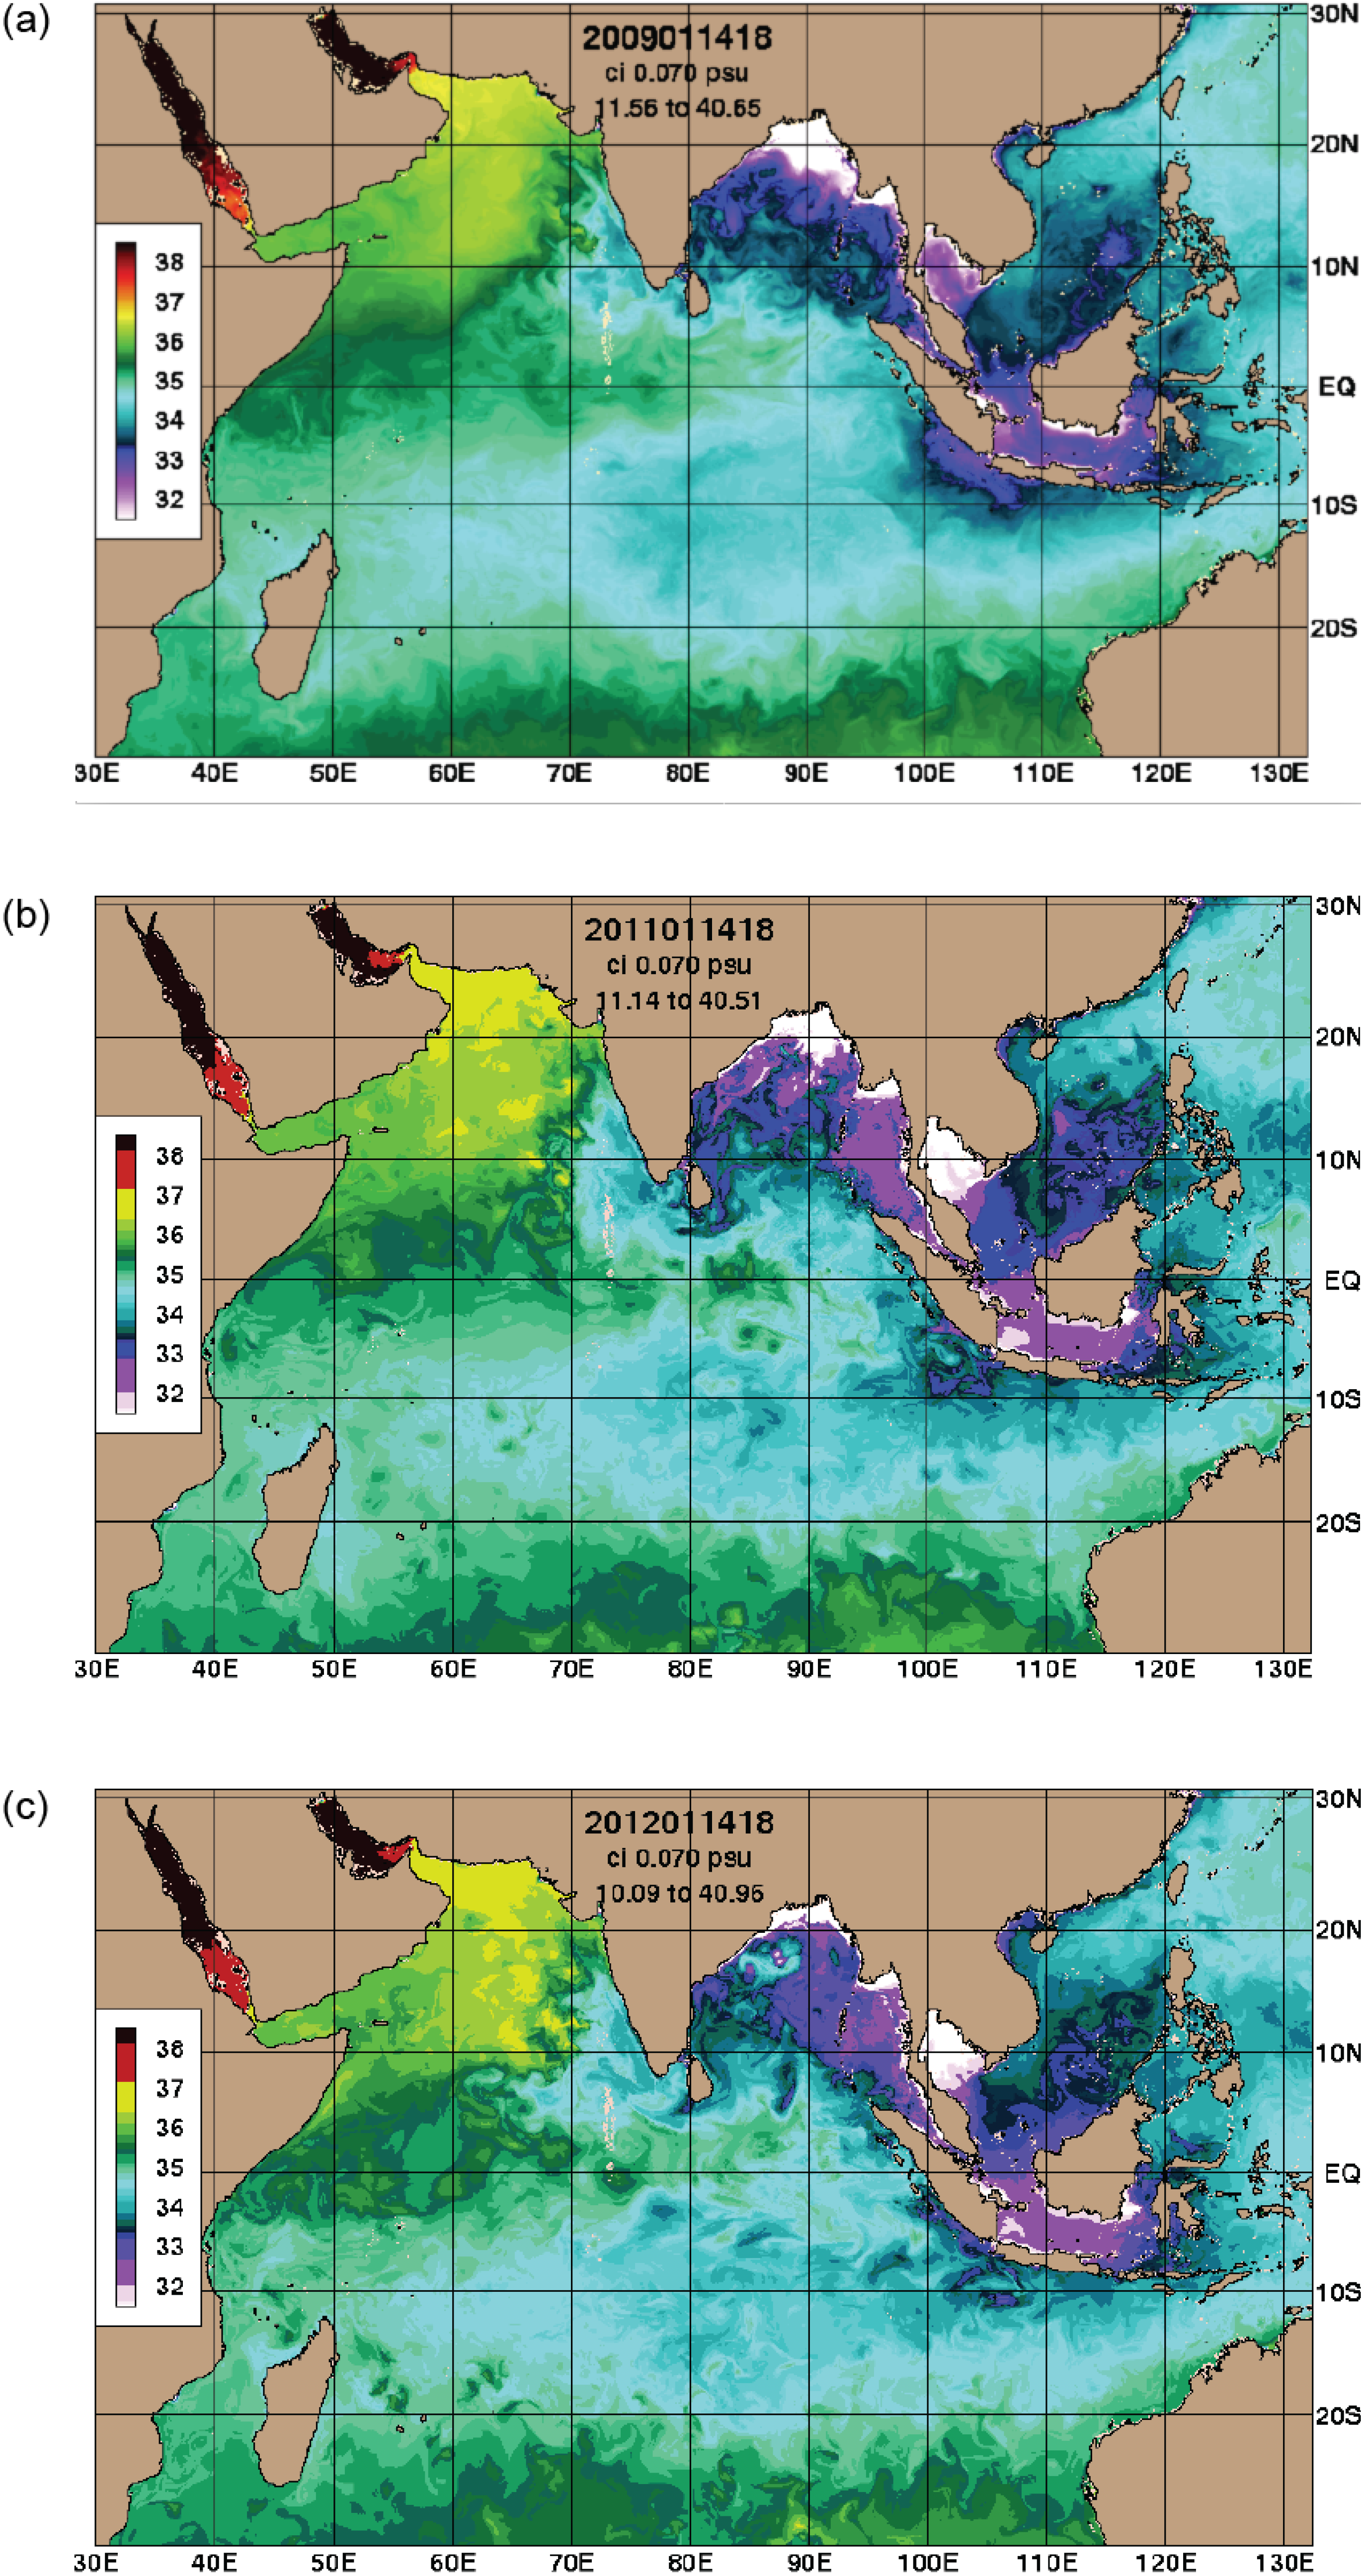
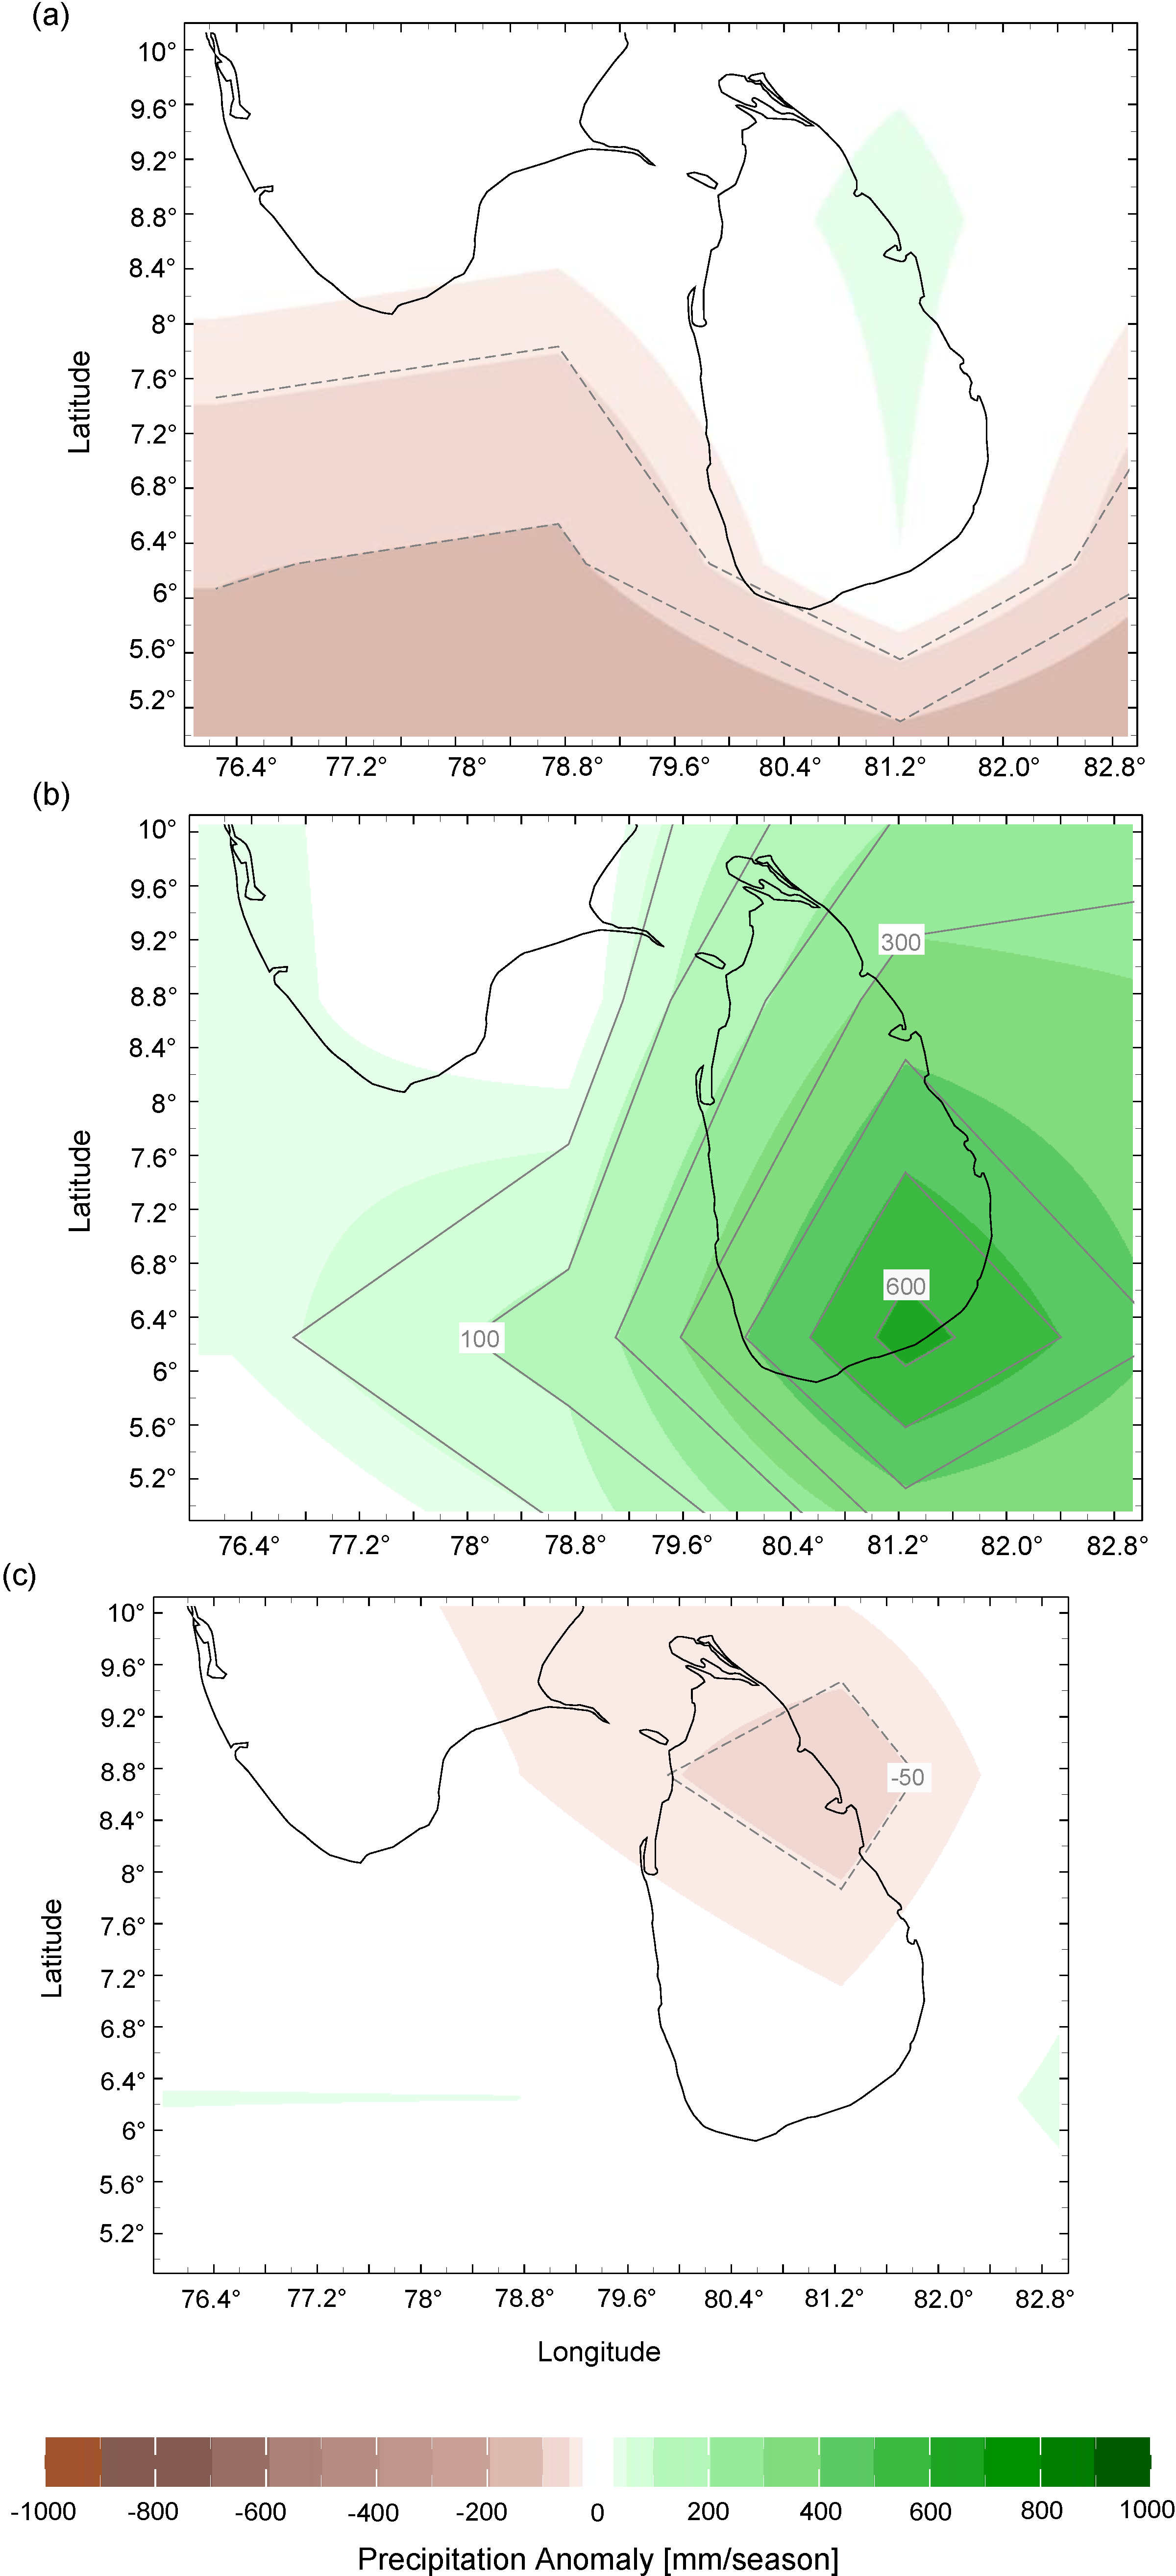
3.1. Climate Influences

| Year | Date | Effort (Distance in km) | Effort (min) | Weather (Beaufort Scale) | n |
|---|---|---|---|---|---|
| 2011 | 13 January | 92 | 340 | 1 | 1 |
| 9 February | 92 | 360 | 2 | 1 | |
| 2012 | 20 January | 92 | 367 | 2 | 41 |
| 4 February | 92 | 393 | 1 | 25 |
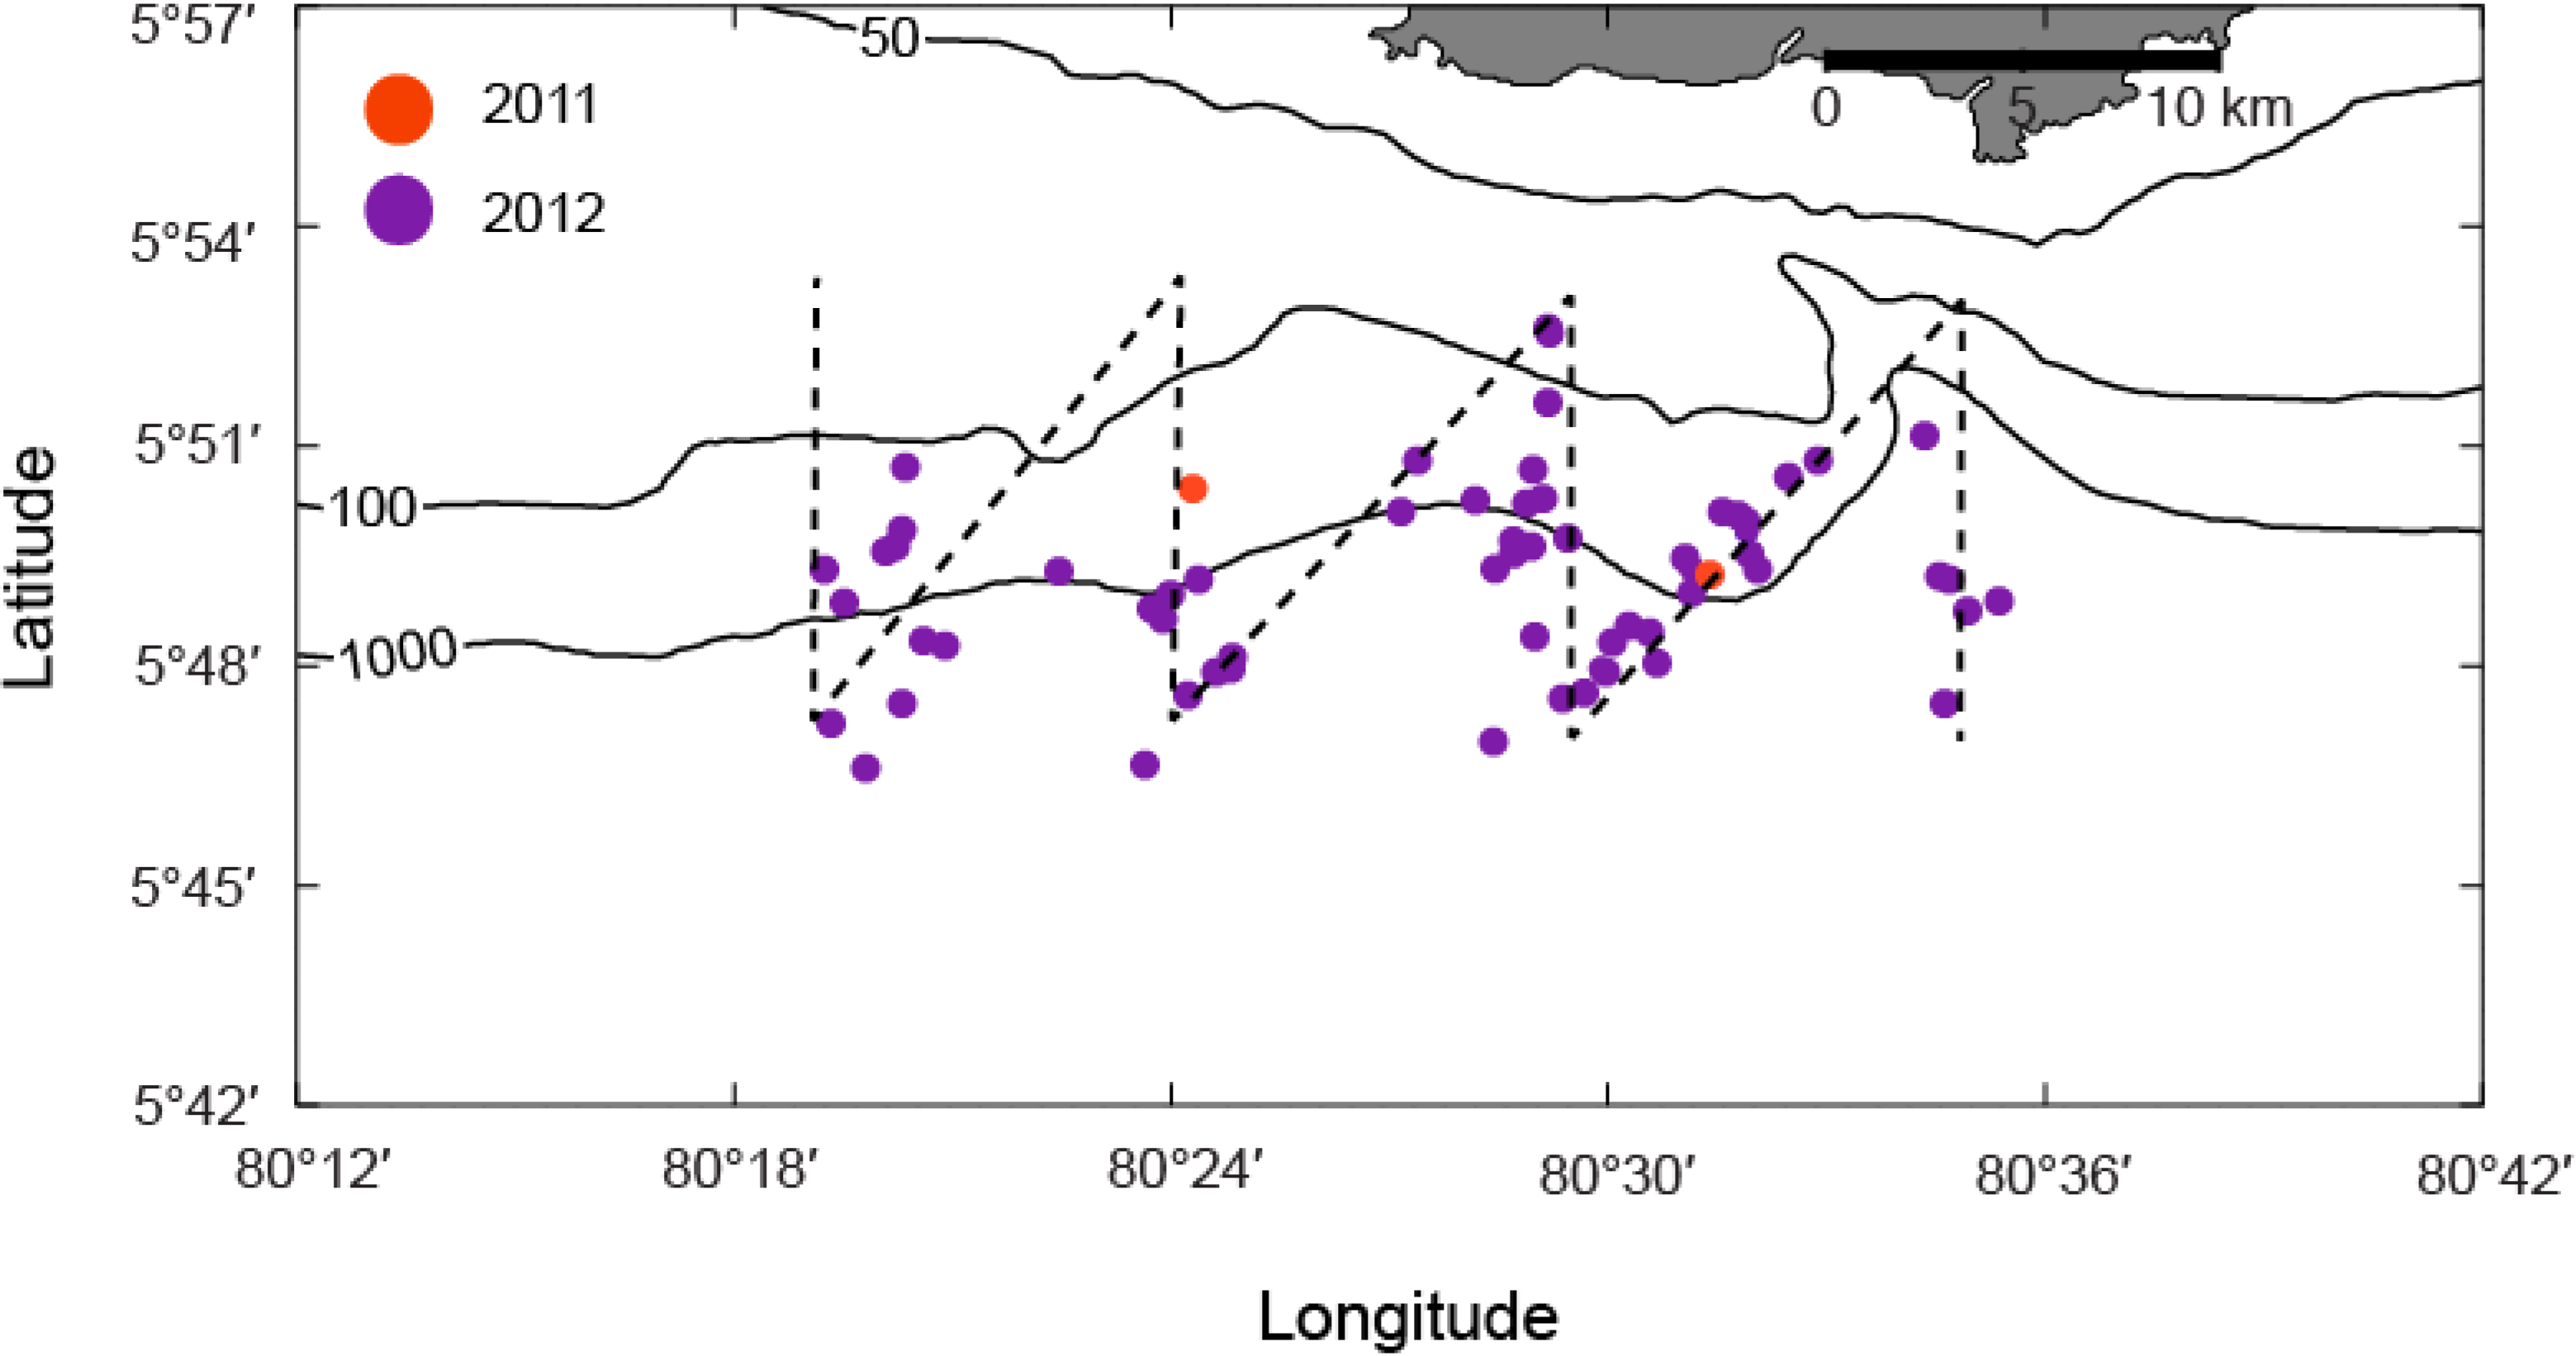
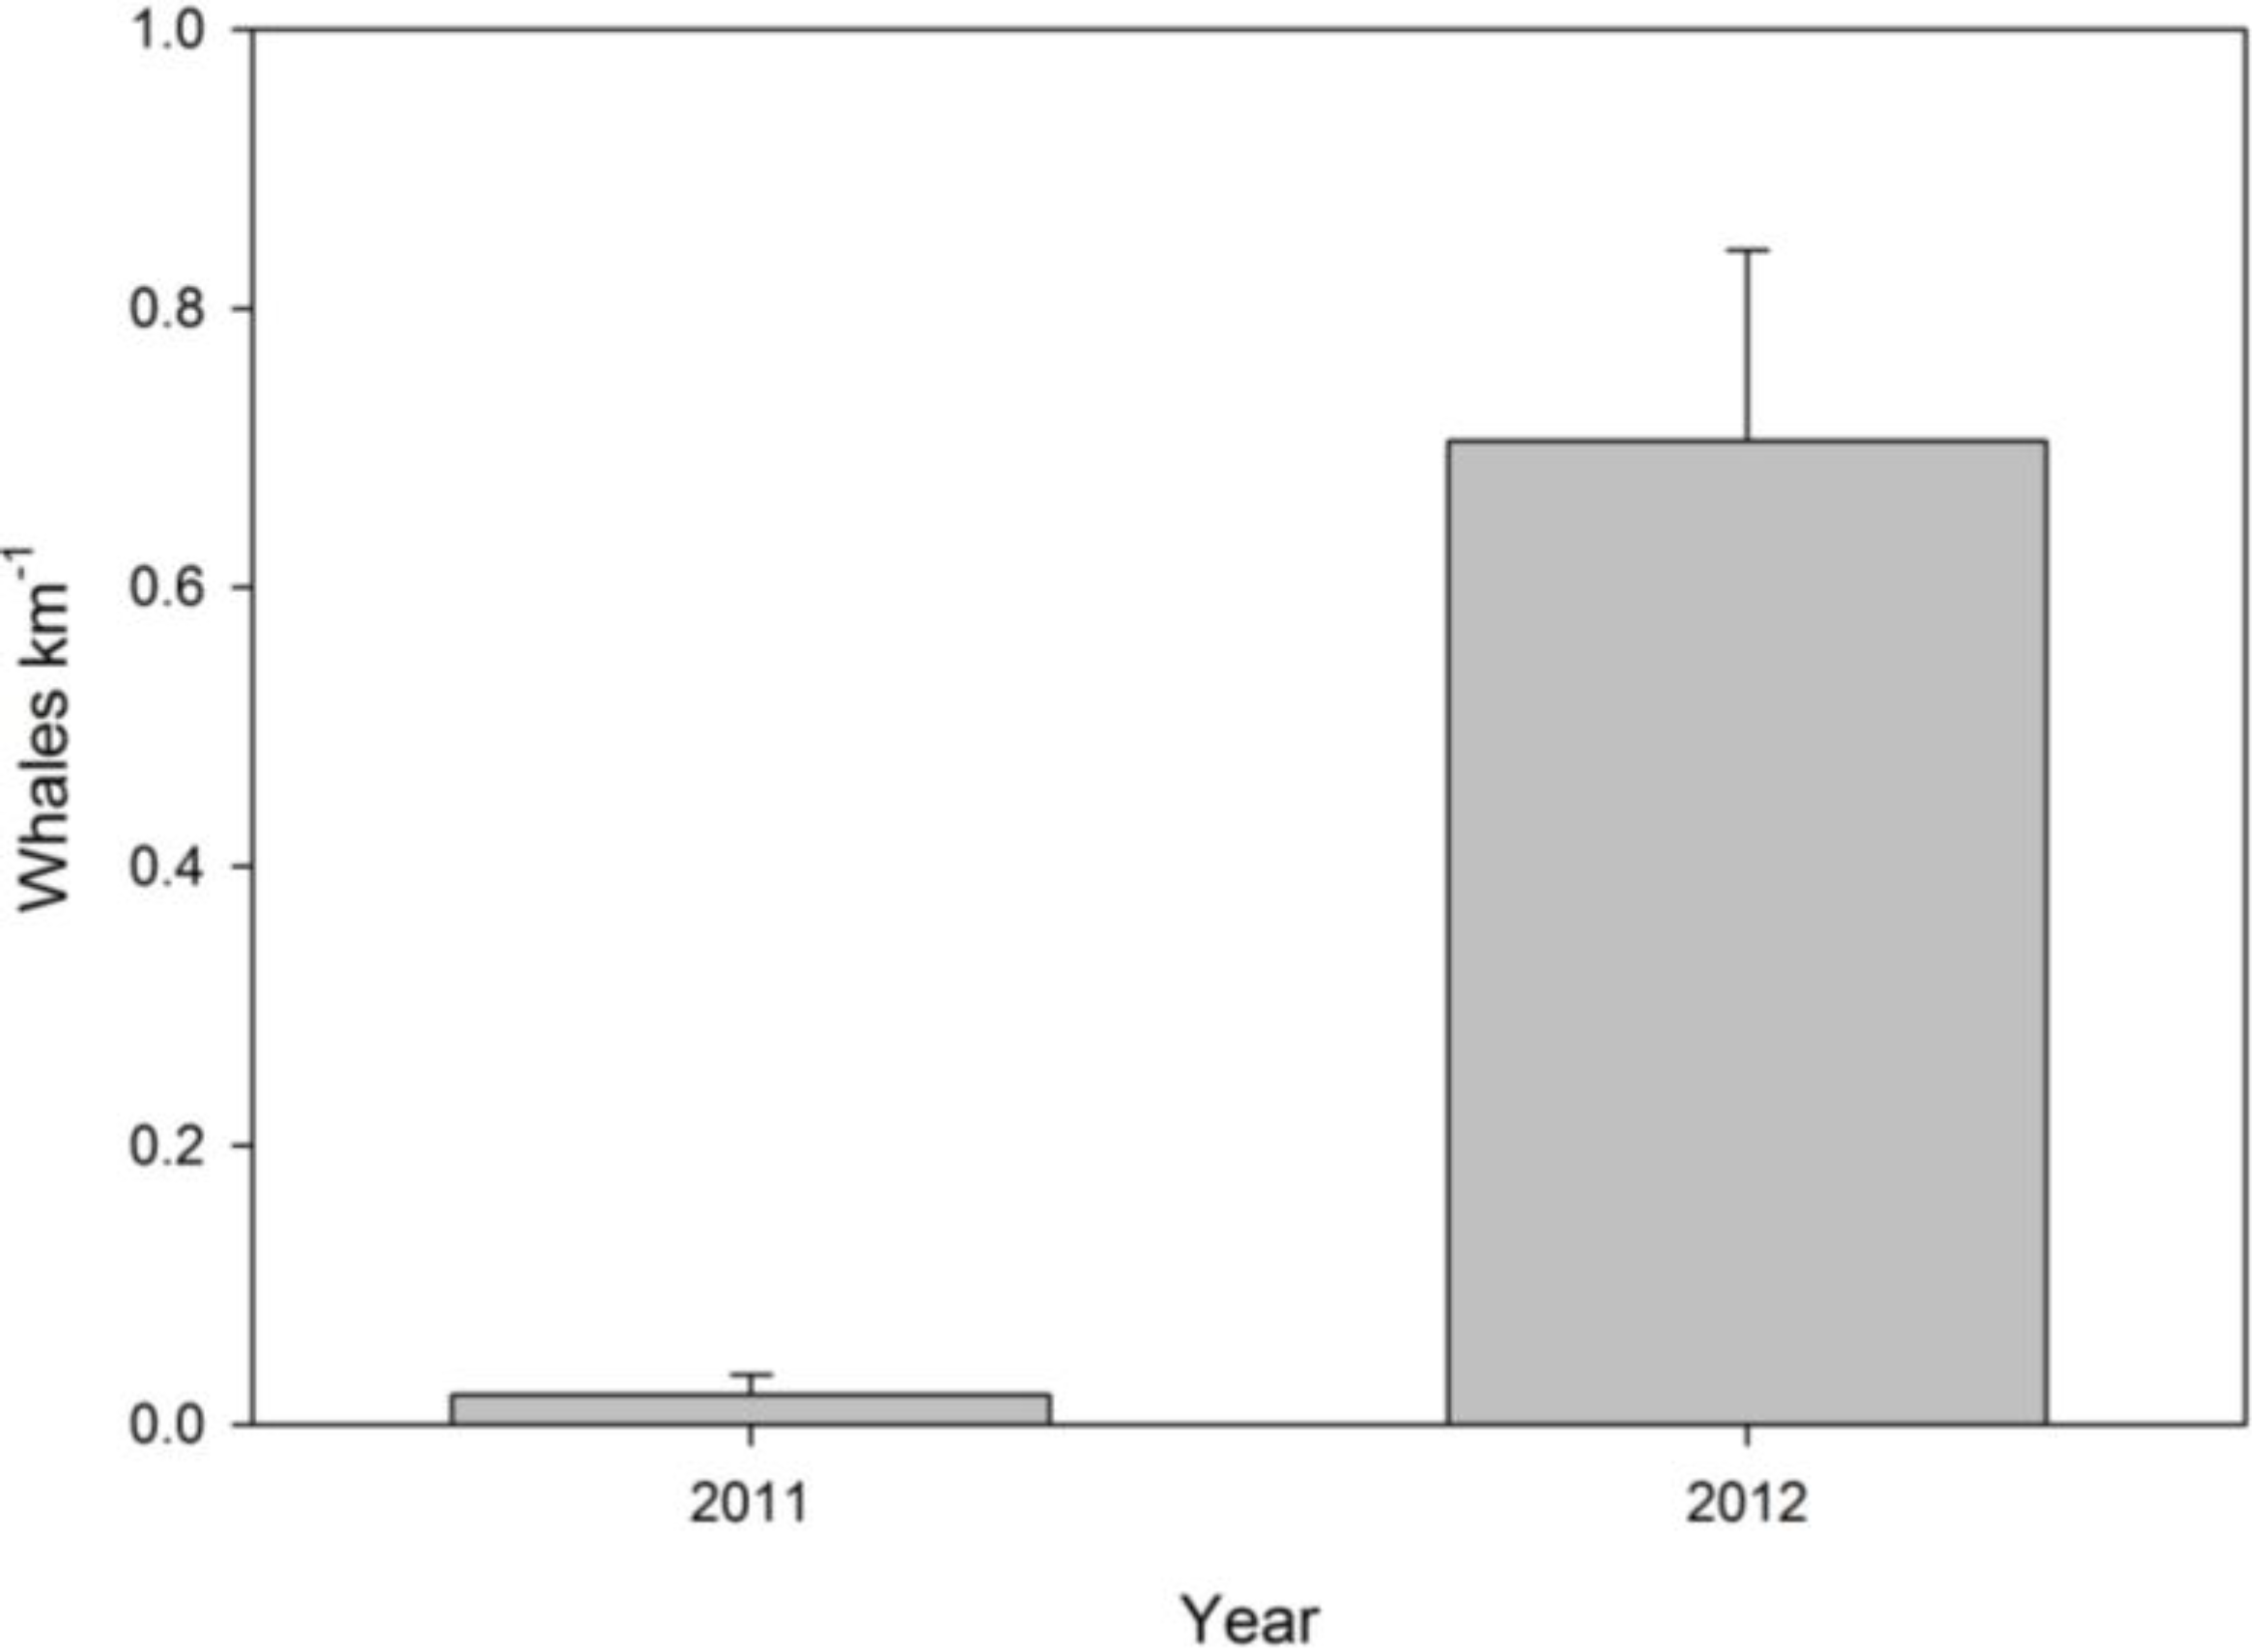
3.2. Systematic Survey Data


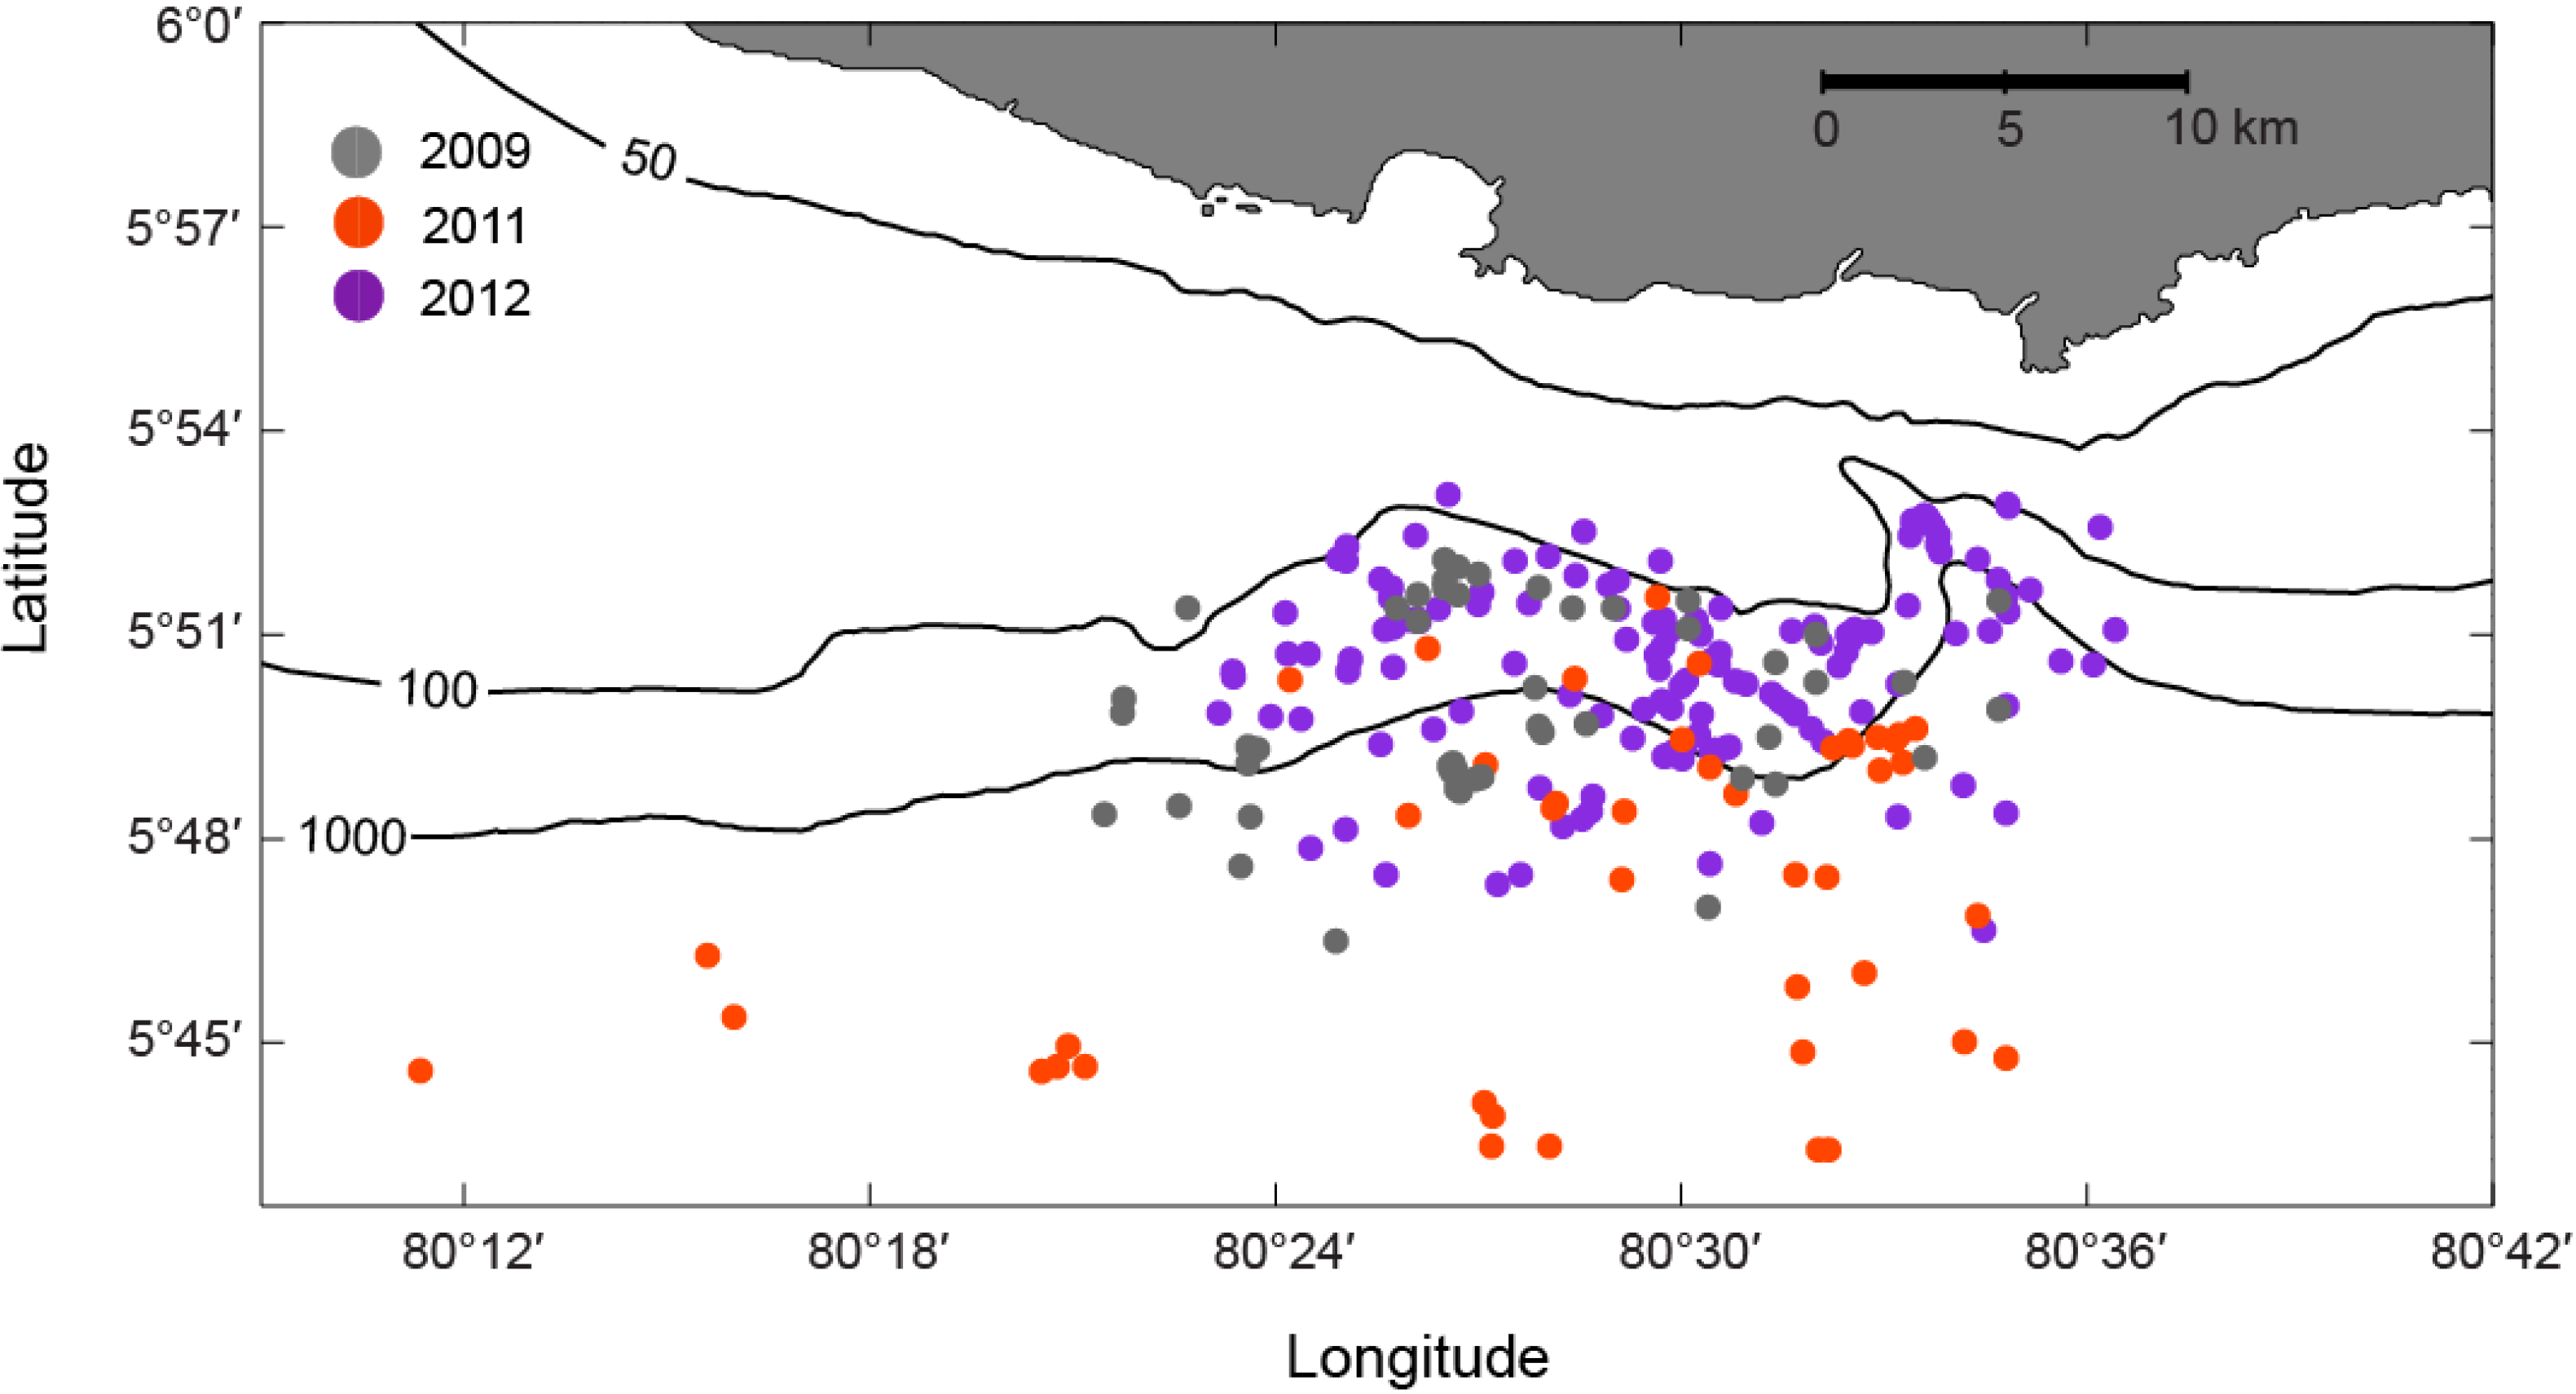
3.3. Opportunistic Sighting Data
| Year | n | ≤1000 m | >1000 m | Mean Distance from Shore (km) |
|---|---|---|---|---|
| 2009 | 53 | 79% | 21% | 11.8 |
| 2011 | 39 | 20% | 80% | 16.6 |
| 2012 | 176 | 82% | 18% | 11.6 |

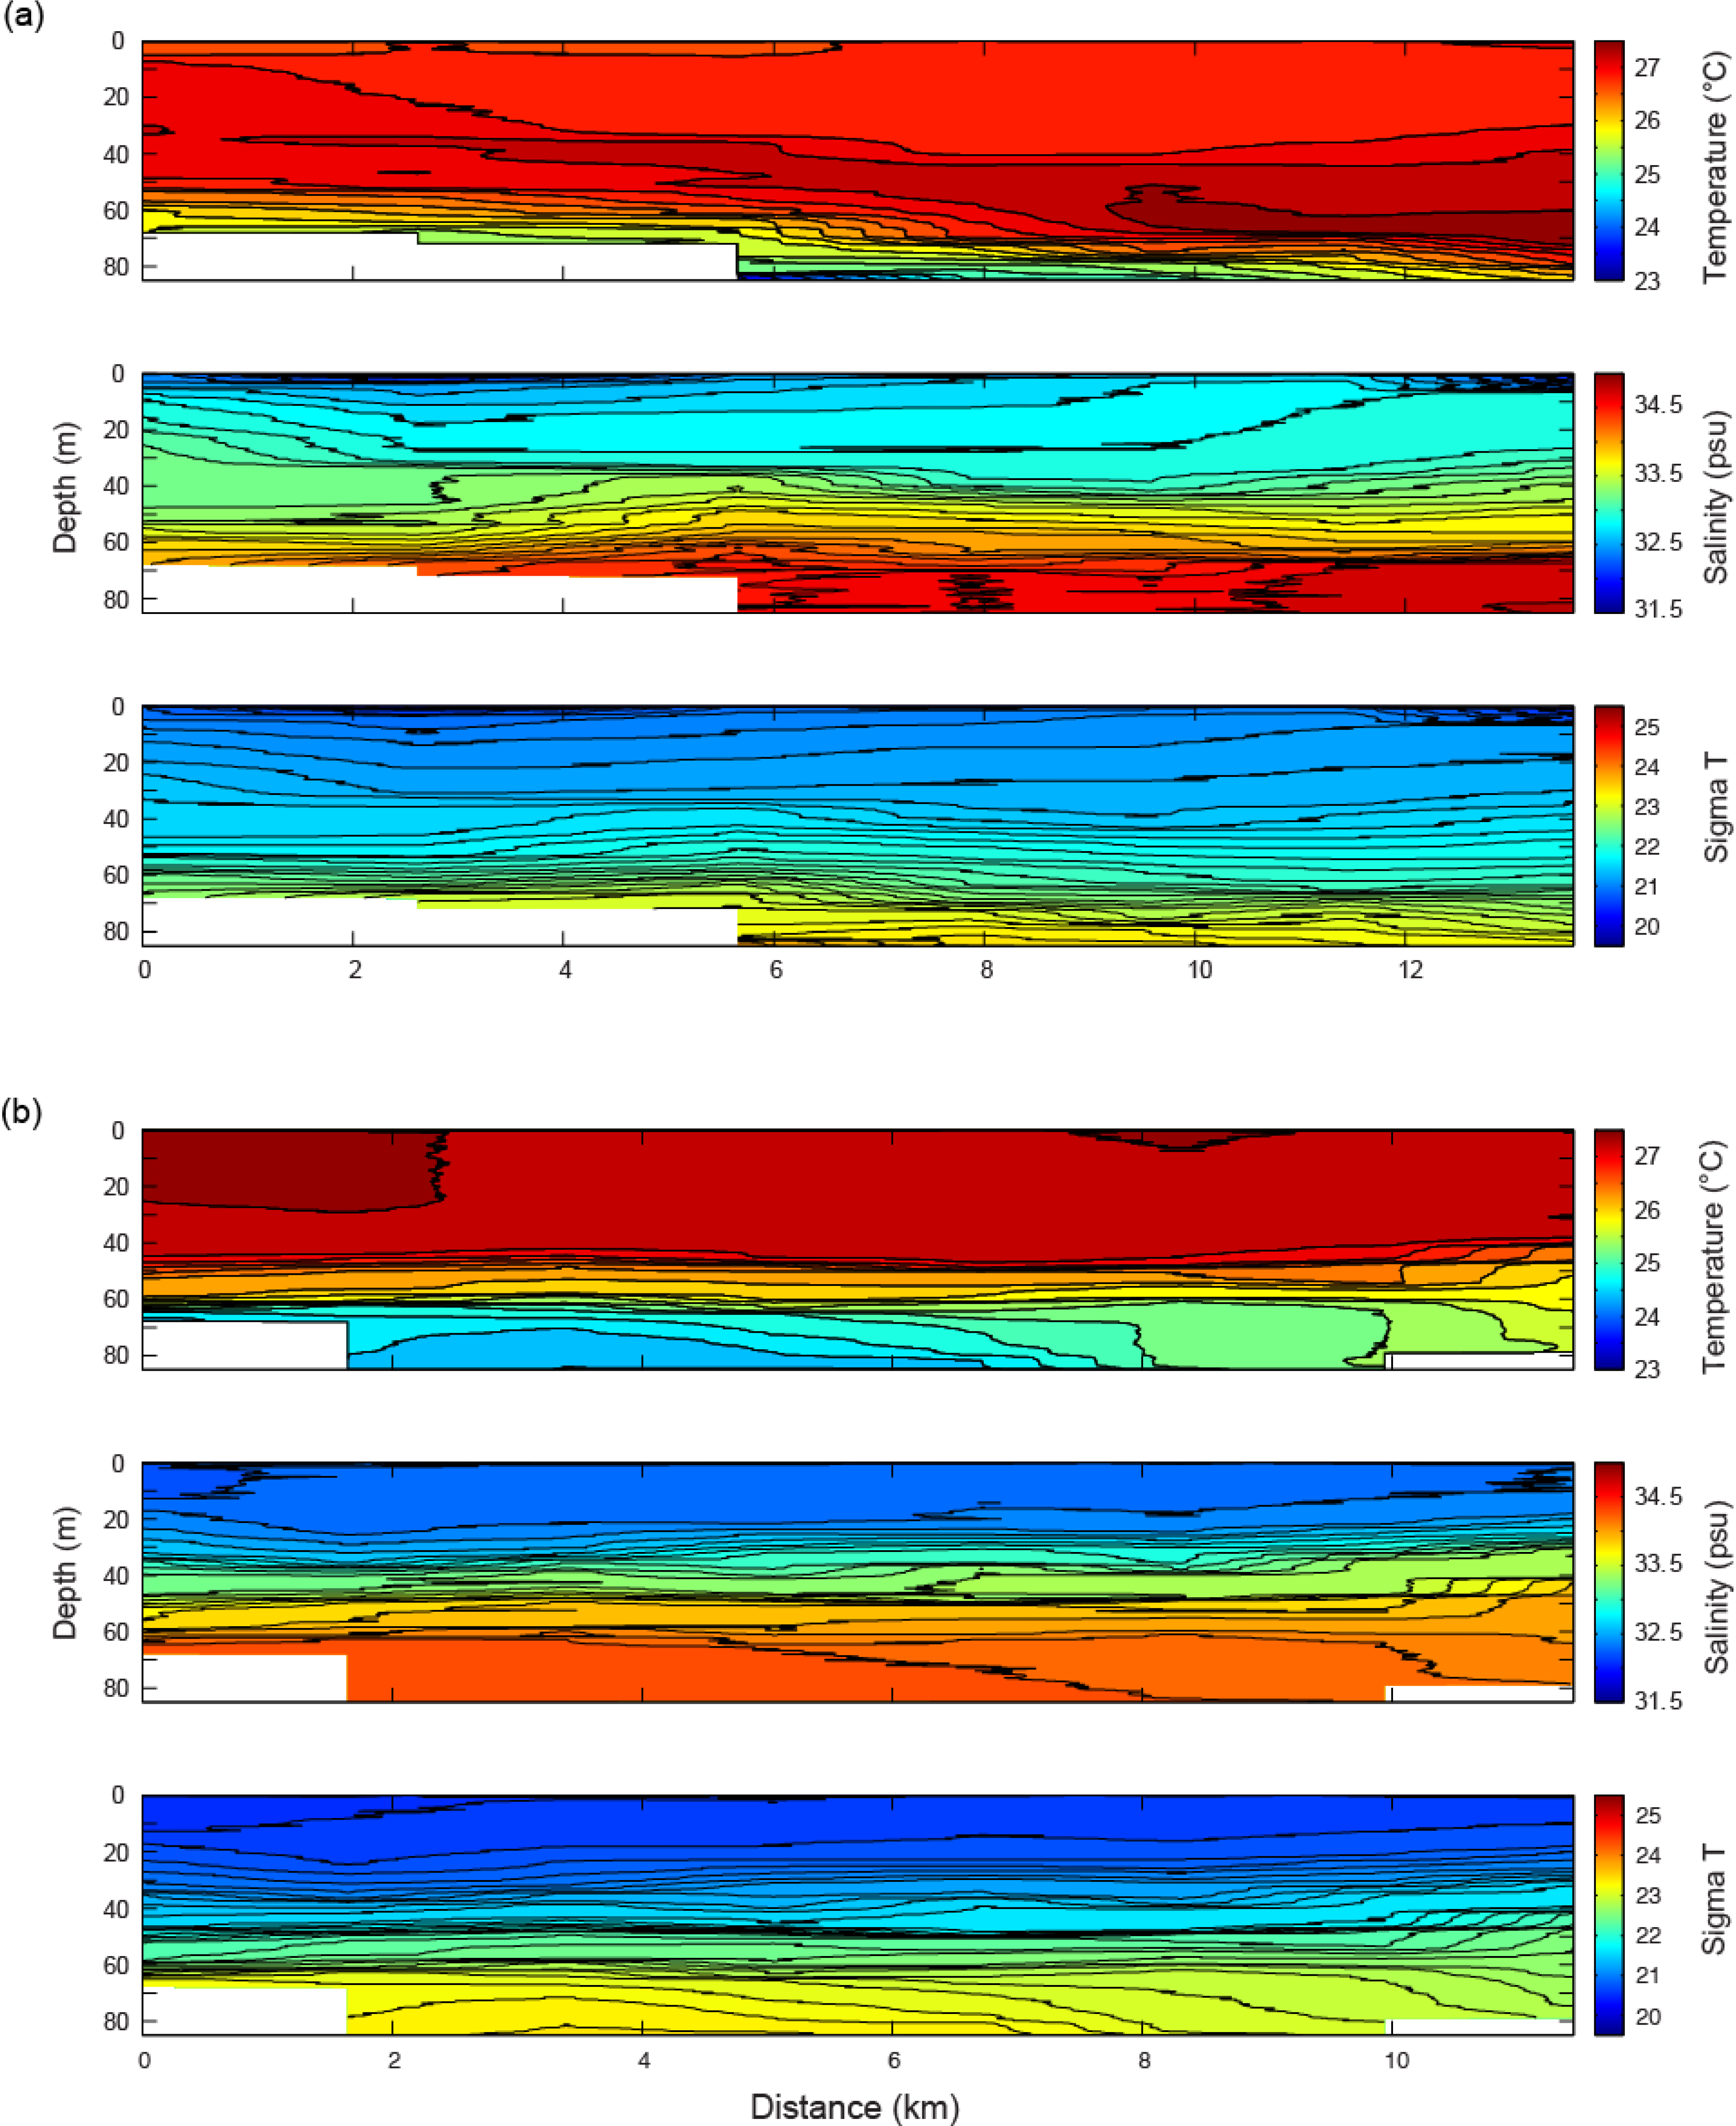
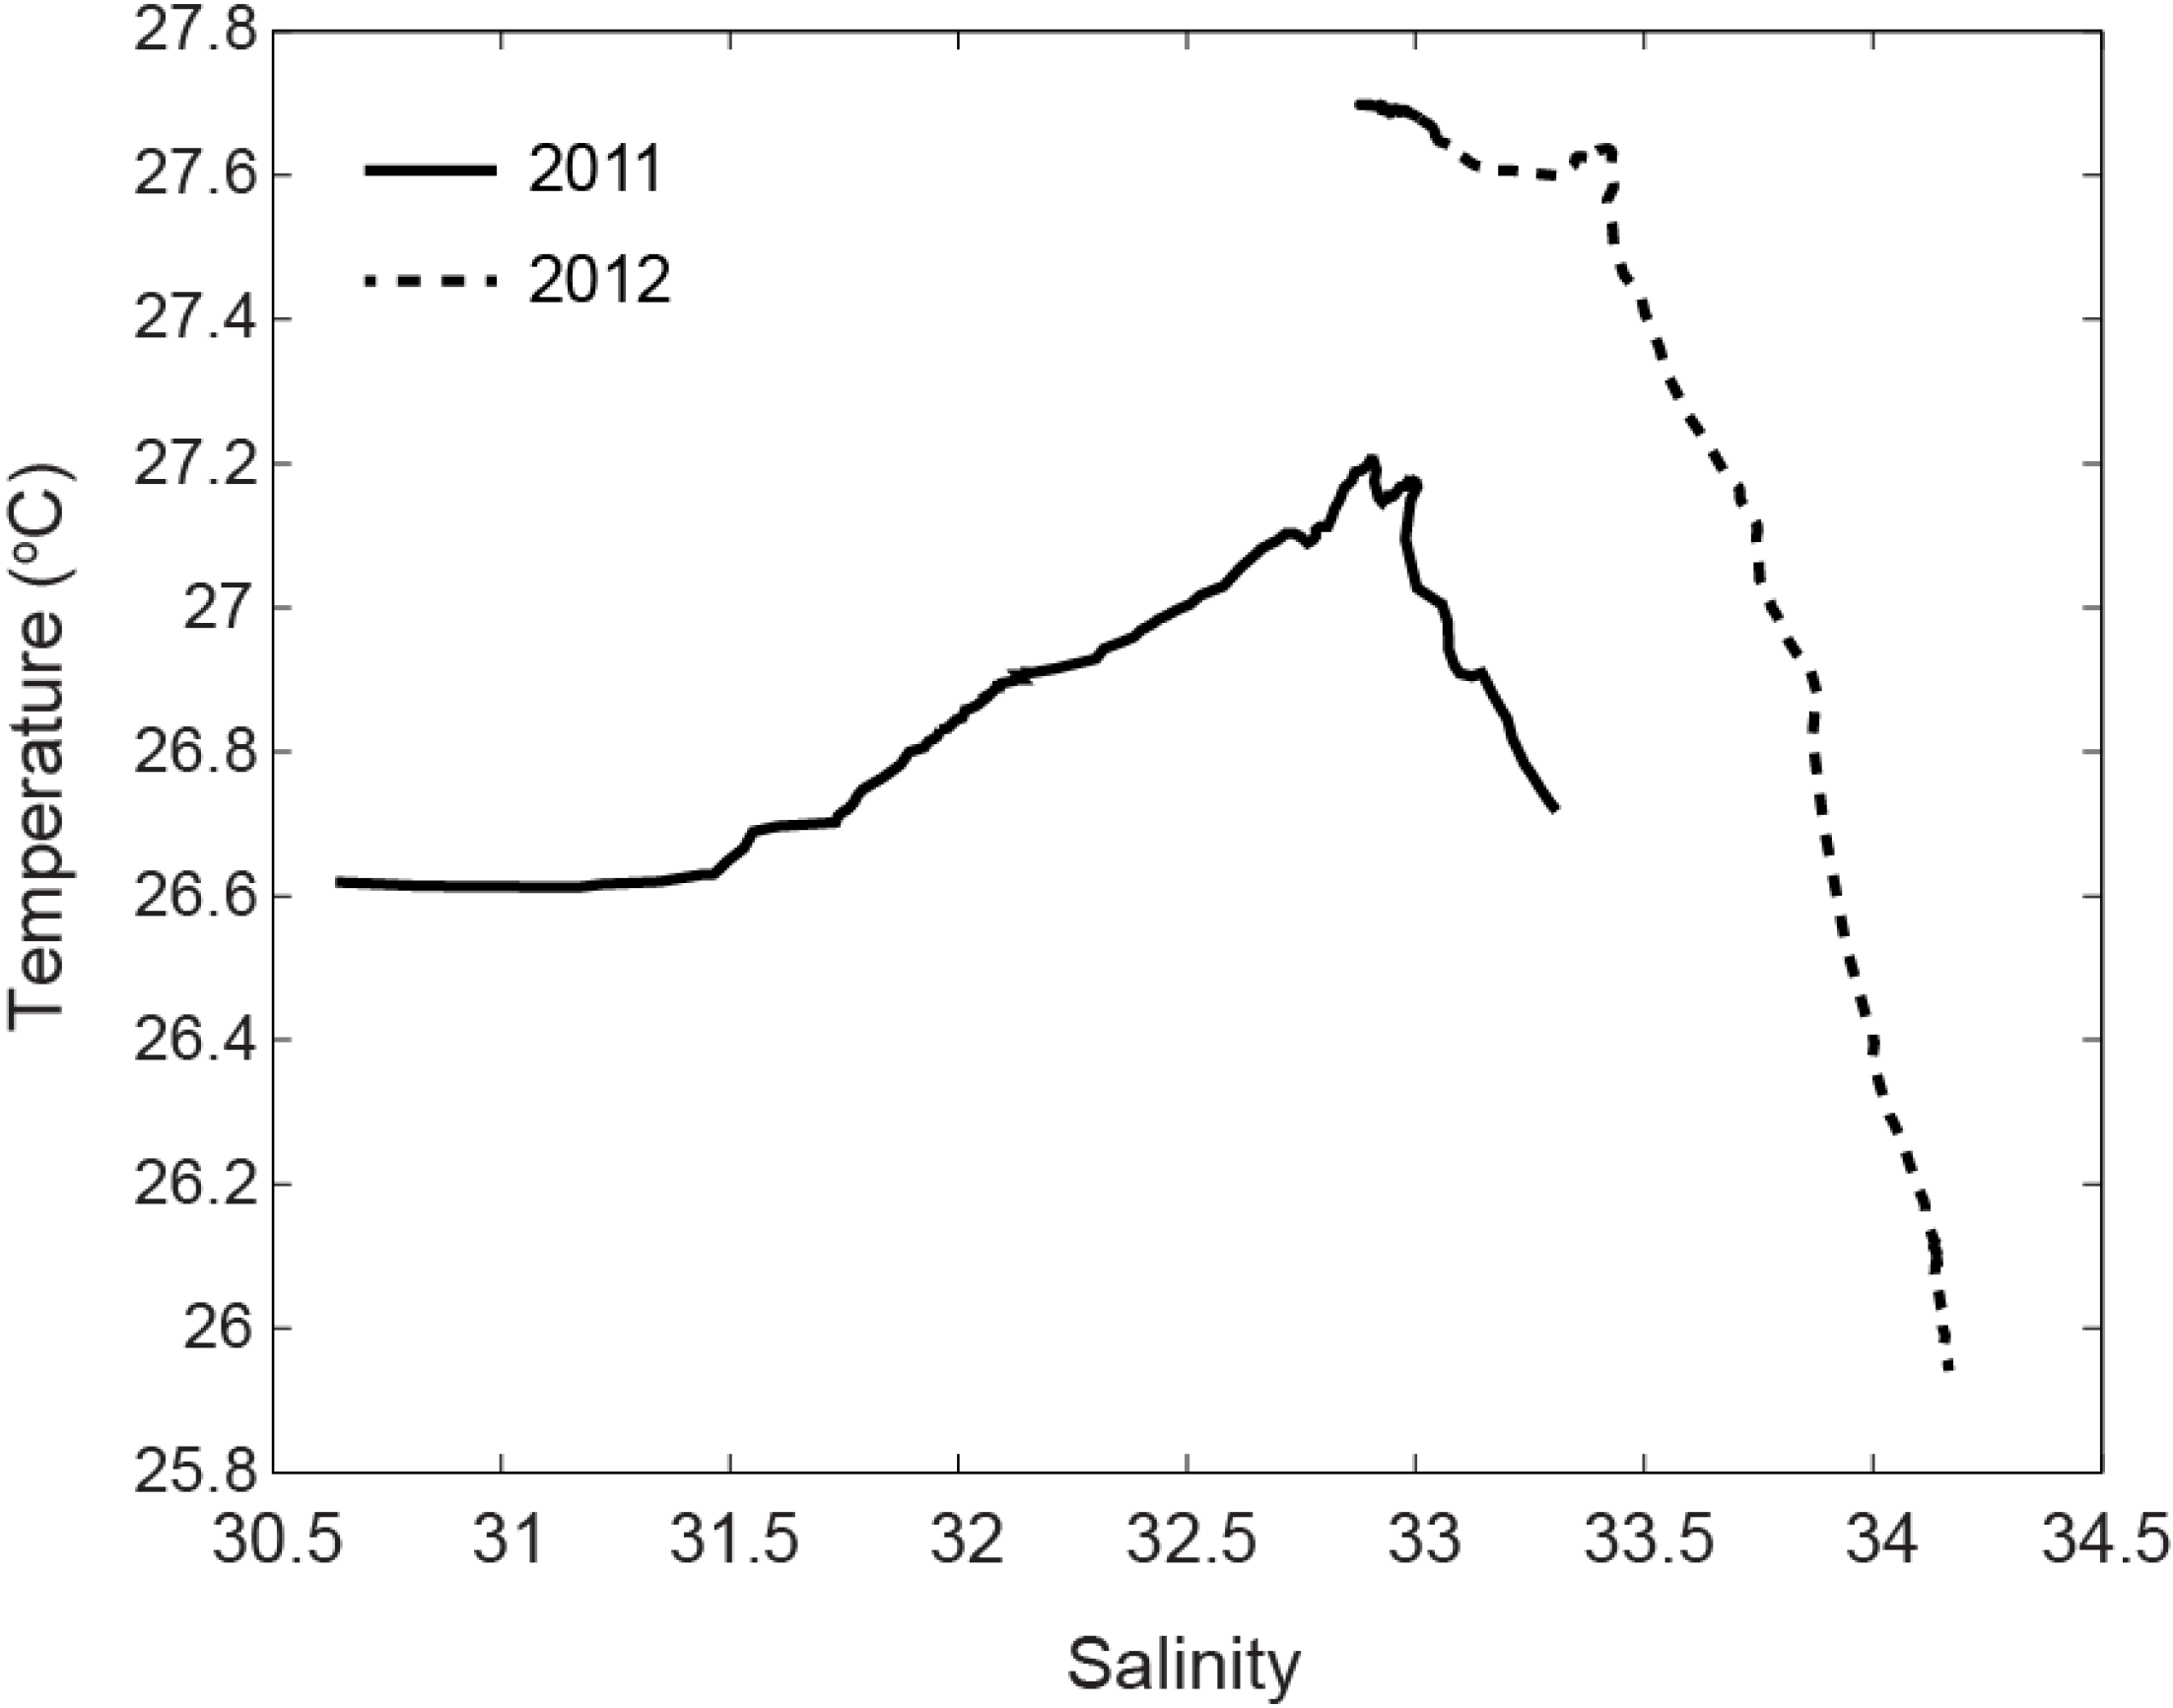
3.4. Temperature and Salinity Data


4. Discussion

5. Conclusions
Acknowledgments
Author Contributions
Conflicts of Interest
References
- Branch, T.A.; Stafford, K.M.; Palacios, D.M.; Allison, C.; Bannister, J.L.; Burton, C.L.K.; Cabrera, E.; Carlson, C.A.; Vernazzani, B.G.; Gill, P.C.; et al. Past and present distribution, densities and movements of blue whales Balaenoptera musculus in the Southern Hemisphere and northern Indian Ocean. Mammal Rev. 2007, 37, 116–175. [Google Scholar] [CrossRef]
- Goldbogen, J.A.; Calambokidis, J.; Oleson, E.; Potvin, J.; Pyenson, N.D.; Schorr, G.; Shadwick, R.E. Mechanics, hydrodynamics and energetics of blue whale lunge feeding: Efficiency dependence on krill density. J. Exp. Biol. 2011, 214, 131–146. [Google Scholar] [CrossRef]
- Fiedler, P.C.; Reilly, S.B.; Hewitt, S.B.; Demer, D.; Philbrick, V.A.; Smith, S.; Armstrong, W.; Croll, D.A.; Tershy, B.R.; Mate, B.R. Blue whale habitat and prey in the California Channel Islands. Deep Sea Res. Part II: Top. Stud. Oceanogr. 1998, 45, 1781–1801. [Google Scholar]
- Boucher, J.; Ibanez, F.; Prieur, L. Diel and seasonal variations in the spatial distribution of zooplankton populations in relation to the physical structure of the Ligurian Sea front. J. Mar. Res. 1987, 45, 133–173. [Google Scholar] [CrossRef]
- Guinet, C.; Dubroca, L.; Lea, M.A.; Goldsworthy, S.; Cherel, Y.; Duhamel, G.; Bonadonna, F.; Donnay, J.P. Spatial distribution of foraging in female Antarctic fur seals Arctocephalus gazella in relation to oceanographic variables: A scale-dependent approach using geographic information systems. Mar. Ecol. Prog. Ser. 2001, 219, 251–264. [Google Scholar] [CrossRef]
- Reid, K. An initial examination of relationships between the distribution of whales and Antarctic krill, Euphausia superba at South Georgia. J. Cetacean Res. Manag. 2000, 2, 143–149. [Google Scholar]
- Murase, H.; Matsuoka, K.; Ichii, T.; Nishiwaki, S. Relationship between the distribution of euphausiids and baleen whales in the Antarctic (35° E–145° W). Polar Biol. 2002, 25, 135–145. [Google Scholar] [CrossRef]
- Ballance, L.T.; Pitman, R.L.; Fiedler, P.C. Oceanographic influences on seabirds and cetaceans of the eastern tropical Pacific: A review. Prog. Oceanogr. 2006, 69, 360–390. [Google Scholar] [CrossRef]
- Friedlaender, A.; Halpin, P.H.; Qian, S.S.; Wiebe, P.H.; Thiele, D.; Read, A.J. Whale distribution in relation to prey abundance and oceanographic processes in the Western Antarctic Peninsula shelf waters. Mar. Ecol. Prog. Ser. 2006, 317, 297–310. [Google Scholar] [CrossRef]
- Alerstam, T.; Hedenstrom, A.; Akesson, S. Long-distance migration: Evolution and determinants. Oikos 2003, 103, 247–260. [Google Scholar]
- Dingle, H. Migration: The Biology of Life on the Move; Oxford University Press: Oxford, UK, 1996. [Google Scholar]
- Corkeron, P.J.; Connor, R.C. Why do baleen whales migrate? Mar. Mammal Sci. 1999, 15, 1228–1245. [Google Scholar] [CrossRef]
- Brodie, P.F. Cetacean energetics, an overview of intraspecific size variation. Ecology 1975, 56, 152–161. [Google Scholar] [CrossRef]
- Silva, M.A.; Prieto, R.; Jonsen, I.; Baumgartner, M.F.; Santos, R.S. North Atlantic blue and fin whales suspend their spring migration to forage in middle latitudes: Building up energy reserves for the journey? PLoS One 2013, 8, e76507. [Google Scholar]
- Reilly, S.B.; Thayer, V.G. Blue whale (Balaenoptera musculus) distribution in the eastern tropical Pacific. Mar. Mammal Sci. 1990, 6, 265–277. [Google Scholar] [CrossRef]
- Samaran, F.; Stafford, K.M.; Branch, T.A.; Gedamke, J.; Royer, J.-Y.; Dziak, R.P.; Guinet, C. Seasonal and geographic variation of southern blue whale subspecies in the Indian Ocean. PLoS One 2013, 8, e71561. [Google Scholar]
- De Vos, A.; Pattiaratchi, C.B.; Wijeratne, E.M.S. Surface circulation and upwelling patterns around Sri Lanka. Biogeosci. Discuss. 2013, 10, 14953–14998. [Google Scholar]
- Pawlowicz, R. M_Map: A mapping package for Matlab. Available online: http://www.eos.ubc.ca/~rich/map.html (accessed on 1 July 2013).
- Janowiak, J.E.; Xie, P. CAMS_OPI: A global satellite-rain gauge merged product for real-time precipitation monitoring applications. J. Clim. 1999, 12, 3335–3342. [Google Scholar] [CrossRef]
- Dias, P.P.G. Hydrometric network and flood mitigation. In Proceedings of the ITU Workshop on Emergency Telecommunication for Disaster Management, Colombo, Sri Lanka, 23 March 2006.
- Allan, R.P. Climate change: Human influence on rainfall. Nature 2011, 470, 344–345. [Google Scholar] [CrossRef]
- Boening, C.; Willis, J.K.; Landerer, F.W.; Steven Nerem, R.; Fasullo, J. The 2011 La Niña: So strong, the oceans fell. Geophys. Res. Lett. 2012, 39. [Google Scholar] [CrossRef]
- Schott, F.A.; McCreary, J.P., Jr. The monsoon circulation of the Indian Ocean. Prog. Oceanogr. 2001, 51, 1–123. [Google Scholar] [CrossRef]
- Schott, F.; Reppin, J.; Fischer, J.; Quadfasel, D. Currents and transports of the monsoon current south of Sri Lanka. J. Geophys. Res.-Oceans 1994, 99, 25127–25141. [Google Scholar]
- Alling, A.K.; Dorsey, E.M.; Gordon, J.C.D. Blue whales (Balaenoptera musculus) off the Northeast coast of Sri Lanka: Distribution, feeding and individual identification. In Cetaceans and Cetacean Research in the Indian Ocean Sanctuary: Marine Mammal Technical Report 3; Leatherwood, S., Donovan, G.P., Eds.; United Nations Environment Programme Oceans and Coastal Areas Programme Activity Centre: Nairobi, Kenya, 1991; pp. 247–258. [Google Scholar]
- Farmer, D.M.; Freeland, H.J. The physical oceanography of fjords. Prog. Oceanogr. 1983, 12, 147–219. [Google Scholar] [CrossRef]
- Smetacek, V.S. Impact of freshwater discharge on production and transfer of materials in the marine environment. NATO ASI Ser. 1986, 7, 85–106. [Google Scholar]
- Learmonth, J.A.; Macleod, C.D.; Santos, M.B.; Pierce, G.J.; Crick, H.Q.P.; Robinson, R.A. Potential effects of climate change on marine mammals. In Oceanography and Marine Biology: An Annual Review; Gibson, R.N., Atkinson, R.J.A., Gordon, J.D.M., Eds.; Taylor and Francis: Boca Raton, FL, USA, 2006; Volume 44. [Google Scholar]
- Rutherford, S.; D’Hondt, S.; Prell, W. Environmental controls on the geographic distribution of zooplankton diversity. Nature 1999, 400, 749–753. [Google Scholar] [CrossRef]
- Letessier, T.B.; Cox, M.J.; Brierley, A.S. Drivers of variability in Euphausiid species abundnace throughout the Pacfic Ocean. J. Plankton Res. 2011, 33, 1342–1357. [Google Scholar] [CrossRef]
- Calliari, D.; Andersen Borg, M.C.; Thor, P.; Gorokhova, E.; Tiselius, P. Instantaneous salinity reductions affect the survival and feeding rates of the co-occurring copepods Acartia tonsa Dana and A. clausi Giesbrecht differently. J. Exp. Mar. Biol. Ecol. 2008, 362, 18–25. [Google Scholar] [CrossRef]
- Ilangakoon, A. Exploring anthropogenic activities that threaten endangered blue whales (Balaenoptera musculus) off Sri Lanka. J. Mar. Anim. Ecol. 2012, 5, 3–7. [Google Scholar]
- Senigaglia, V.; Bejder, L.; Christiansen, F.; Gendron, D.; Lundquist, D.; Noren, D.; Schaffar, A.; Smith, J.C.; Williams, R.; Lusseau, D. Meta-analasyes of whalewatching impact studies: Differences and similarities in disturbance responses among species. In Proceedings of the 20th Biennial Conference on the Biology of Marine Mammals, Dunedin, New Zealand, 9–13 December 2013.
- De Vos, A.; Christiansen, F.; Harcourt, R.G.; Pattiaratchi, C.B. Surfacing characteristics and diving behaviour of blue whales in Sri Lankan waters. J. Exp. Mar. Biol. Ecol. 2013, 449, 149–153. [Google Scholar] [CrossRef]
- de Vos, A.; The Sri Lankan Blue Whale Project, Colombo, Sri Lanka. 2014; Unpublished work.
- Kaluza, P.; Kolzsch, A.; Gastner, M.T.; Blasius, B. The complex network of global cargo ship movements. J. R. Soc. Interface 2010, 7, 1093–1103. [Google Scholar] [CrossRef]
- De Vos, A.; Wu, T.; Brownell, R.L., Jr. Recent Blue Whale Deaths due to Ship Strike around Sri Lanka; Report of the IWC Conservation Committee 2013, SC/65a/HIM03; International Whaling Commission: Cambridge, UK.
- Drinkwater, K.F.; Belgrano, A.; Borja, A.; Conversi, A.; Edwards, M.; Greene, C.H.; Ottersen, G.; Pershing, A.J.; Walker, H. The response of marine ecosystems to climate variability associated with the North Atlantic Oscillation. In The North Atlantic Oscillation: Climatic Significance and Environmental Impact; Geophysical Monograph Series 2002; American Geophysical Union: Washington, DC, USA; pp. 211–234.
- Barber, R.T.; Chavez, F.P. Biological consequences of El Niño. Science 1983, 222, 1203–1210. [Google Scholar]
- Beaugrand, G.; Reid, P.C.; Ibanez, F.; Lindley, J.A.; Edwards, M. Reorganisation of North Atlantic marine copepod biodiveristy and climate. Science 2002, 296, 1692–1694. [Google Scholar] [CrossRef]
- Benson, S.R.; Croll, D.A.; Marinovic, B.B.; Chavez, F.P.; Harvey, J.T. Changes in the cetacean assemblage of a coastal upwelling ecosystem during El Niño 1997–98 and La Niña 1999. Prog. Oceanogr. 2002, 54, 279–291. [Google Scholar] [CrossRef]
- Burtenshaw, J.C.; Oleson, E.M.; Hildebrand, J.A.; McDonald, M.A.; Andrew, R.K.; Howe, B.M.; Mercer, J.A. Acoustic and satellite remote sensing of blue whale seasonality and habitat in the Northeast Pacific. Deep-Sea Res. Part II-Top. Stud. Oceanogr. 2004, 51, 967–986. [Google Scholar]
- Worm, B.; Sandow, M.; Oschlies, A.; Lotze, H.K.; Myers, R.A. Global patterns of predator diversity in the open oceans. Science 2005, 309, 1365–1369. [Google Scholar] [CrossRef]
- Hooff, R.C.; Peterson, W.T. Copepod biodiversity as an indicator of changes in ocean and climate conditions of the northern California current ecosystem. Limnol. Oceanogr. 2006, 51, 2607–2620. [Google Scholar] [CrossRef]
- Reilly, S.B.; Fiedler, P.C. Interannual variability of dolphin habitats in the eastern tropical Pacific. I: Research vessel surveys, 1986–1990. Fish. Bull. 1994, 92, 434–450. [Google Scholar]
- Friday, N.A.; Waite, J.M.; Zerbini, A.N.; Moore, S.E. Cetacean distribution and abundance in relation to oceanographic domains on the eastern Bering Sea shelf: 1999–2004. Deep Sea Res. Part II: Top. Stud. Oceanogr. 2012, 65–70, 260–272. [Google Scholar] [CrossRef]
- Littaye, A.; Gannier, A.; Laran, S.; Wilson, J.P.F. The relationship between summer aggregation of fin whales and satellite-derived environmental conditions in the northwestern Mediterranean Sea. Remote Sens. Environ. 2004, 90, 44–52. [Google Scholar] [CrossRef]
- Burrows, J.A.; Harvey, J.T.; Newton, K.M.; Croll, D.A.; Benson, S.R. Marine mammal response to interannual variability in Monterey Bay, California. Mar. Ecol. Prog. Ser. 2012, 461, 257–271. [Google Scholar] [CrossRef]
© 2014 by the authors; licensee MDPI, Basel, Switzerland. This article is an open access article distributed under the terms and conditions of the Creative Commons Attribution license (http://creativecommons.org/licenses/by/3.0/).
Share and Cite
De Vos, A.; Pattiaratchi, C.B.; Harcourt, R.G. Inter-Annual Variability in Blue Whale Distribution off Southern Sri Lanka between 2011 and 2012. J. Mar. Sci. Eng. 2014, 2, 534-550. https://doi.org/10.3390/jmse2030534
De Vos A, Pattiaratchi CB, Harcourt RG. Inter-Annual Variability in Blue Whale Distribution off Southern Sri Lanka between 2011 and 2012. Journal of Marine Science and Engineering. 2014; 2(3):534-550. https://doi.org/10.3390/jmse2030534
Chicago/Turabian StyleDe Vos, Asha, Charitha B. Pattiaratchi, and Robert G. Harcourt. 2014. "Inter-Annual Variability in Blue Whale Distribution off Southern Sri Lanka between 2011 and 2012" Journal of Marine Science and Engineering 2, no. 3: 534-550. https://doi.org/10.3390/jmse2030534
APA StyleDe Vos, A., Pattiaratchi, C. B., & Harcourt, R. G. (2014). Inter-Annual Variability in Blue Whale Distribution off Southern Sri Lanka between 2011 and 2012. Journal of Marine Science and Engineering, 2(3), 534-550. https://doi.org/10.3390/jmse2030534