Article

Enhancing Container Vessel Arrival Time Prediction through Past Voyage Route Modeling: A Case Study of Busan New Port

1
Department of Intelligent Mechatronics Engineering, Sejong University, Seoul 05006, Republic of Korea
2
Korea Research Institute of Ship and Ocean Engineering, Daejeon 34103, Republic of Korea
*
Author to whom correspondence should be addressed.
J. Mar. Sci. Eng. 2023, 11(6), 1234; https://doi.org/10.3390/jmse11061234
Submission received: 12 May 2023 / Revised: 10 June 2023 / Accepted: 12 June 2023 / Published: 15 June 2023
(This article belongs to the Special Issue Data Analytics in Maritime Research)

Abstract

:
Container terminals are at the center of global logistics, and are highly dependent on the schedule of vessels arriving. Conventional ETA records from ships, utilized for terminal berth planning, lack sufficient accuracy for effective plan implementation. Thus, there is a pressing need for improved ETA prediction methods. In this research, we propose a novel approach that leverages past voyage route patterns to predict the ETA of container vessels arriving at a container terminal at Busan New Port, South Korea. By modeling representative paths based on previous ports of call, the method employs real-time position and speed data from the Automatic Identification System (AIS) to predict vessel arrival times. By inputting AIS data into segmented representative routes, optimal parameters yielding minimal ETA errors for each vessel are determined. The algorithm’s performance evaluation during the modeling period demonstrates its effectiveness, achieving an average Mean Absolute Error (MAE) of approximately 3 h and 14 min. These results surpass the accuracy of existing ETA data, such as ETA in the Terminal Operating System and ETA in the AIS of a vessel, indicating the algorithm’s superiority in ETA estimation. Furthermore, the algorithm consistently outperforms the existing ETA benchmarks during the evaluation period, confirming its enhanced accuracy.

1. Introduction

1.1. Research Background

The global container fleet has experienced substantial growth over the past four decades, with container ships carrying over 80% of international trade in goods [1]. The deadweight tonnage of these ships, which indicates their cargo, fuel, crew, and other contents, has increased from around 11 million metric tons in 1980 to approximately 275 million metric tons in 2020 [2]. Container terminals play a vital role in handling this cargo, but they face challenges due to limited berthing capacity. Efficient scheduling of terminal operations relies on accurate arrival time predictions for ships. Delays in ship arrivals can disrupt terminal plans and operations. Therefore, obtaining precise ship arrival information is crucial for optimizing terminal efficiency.
Terminal operators in charge of berthing plans determine vessel arrangements based on factors such as estimated time of arrival (ETA), cargo volume, dimensions, and type [3]. Currently, terminals rely on updates from the ship’s agent via phone or email, but these updates are not real-time and are often received only 24 to 48 h in advance, contributing to the unreliable nature of ETAs [4]. Uncertain ETAs lead to the allocation of buffer times before and after the scheduled arrival, which reduces operational efficiency and can cause a ripple effect of delays and disruptions for subsequent vessels [5].
To address this issue, it is necessary to develop a model capable of predicting the time of arrival for vessels, providing terminal planners with accurate information to facilitate optimal berth planning. The utilization of the Automatic Identification System (AIS) proves highly effective in this regard, as it captures and stores essential ship trajectory data, such as position, course, and speed. By accumulating such data, the AIS can offer a diverse range of applications. The AIS serves as a navigation instrument located in the bridge of vessels, transmitting its information automatically to other vessels nearby, terrestrial receiving stations, and low-orbit satellites [6,7]. Extensive research has been conducted to tap into the potential of the AIS in various studies.

1.2. Literature Review

The literature review aims to explore the current state of research and advancements in AIS applications and vessel arrival time prediction. The following sections highlight key studies and methodologies related to route modeling, trajectory mining, virtual arrival, and ETA prediction.

1.2.1. Route Modeling for Path Prediction

In recent years, considerable efforts have been dedicated to enhancing the accuracy of vessel path prediction through the utilization of extensive historical AIS data. In Dobrkovic et al.’s review [8], many research studies were dedicated to route prediction using the AIS. Among many, Talavera et al. used historical AIS data to model the voyage and quantify the uncertainties in the near future by constructing Dempster–Shafer structure [9]. They focused on estimating similar individual trajectories by clustering past routes [9].
Another recent study by Wu et al. introduced a multi-scale Visibility Graph approach for efficient long-distance route planning [10]. They extracted obstacle polygons from electronic charts and constructed Visibility Graphs by connecting these polygons. The authors generated an initial path between the start and end points using the Great Circle Line and divided it into segments. To reduce complexity and computation time, they employed a Local Planning Window based on multiple map scales [10]. Another noteworthy study by Li et al. proposed a novel path planning strategy utilizing deep reinforcement learning and Artificial Potential Field with a Convention on the International Regulations for Preventing Collisions at Sea (COLREGS) collision avoidance function [11]. They addressed the limitations of path planning with Deep Q-Network, such as sparse reward, by incorporating the Artificial Potential Field. Experimental results demonstrated that their proposed approach successfully guided ships along the designated path without collisions with smaller vessels along the route [11]. Although both studies made significant contributions to path planning, Wu et al.’s work primarily focused on long-range route planning for autonomous surface ships [10], while Li et al.’s work addressed direction changes in the presence of other vessels [11]. However, these studies paid less attention to the dynamic voyage trajectory of the ships.
The following section will focus on vessel trajectory mining using the AIS and other data sources.

1.2.2. Ship Trajectory Mining

Trajectory mining refers to a subset of data mining that focuses on analyzing spatiotemporal data. It involves employing analytical techniques to identify specific patterns in the movement of objects, understand their movement characteristics, identify anomalies, and perform other related tasks. A critical review of AIS data applications was carried out by Yang et al. [12]. One notable application highlighted in the review is the use of historical trajectories from raw AIS data to predict a vessel’s future route, as demonstrated by Pallotta et al. [13]. Numerous studies have explored the analysis of AIS data using trajectory mining techniques. One study employed Electronic Chart System (ECS) and preprocessing methods to transform AIS data into ship trajectory patterns, providing insights into maritime traffic flow [14]. Kwon et al. preprocessed AIS data using a Trajectory Mining technique by finding cutting, noise, and stay points in AIS trajectory [15]. Bai et al. analyzed financial and operational risk management for global tramp shipping companies using AIS-driven trajectory data [16]. While they focused on tanker and dry bulk carriers and only used AIS data for ship trajectory, they gave little attention to global container vessels and terminals.

1.2.3. Virtual Arrival and Just-in-Time Arrival

Virtual Arrival, also referred to as Just-in-time arrival, is an operational process where a vessel’s speed is reduced to meet a Required Time of Arrival in the presence of known delays at the discharge port [17]. The Oil Companies International Marine Forum (OCIMF) and the International Association of Independent Tanker Owners (INTERANKO) consider it wasteful for vessels to travel at full speed to ports with identified cargo handling delays [17]. The International Maritime Organization (IMO) and the Digital Container Shipping Association (DSCA) also recognizes this concept as Just-in-time arrival [18,19]. This policy aims to mitigate excessive bunker consumption and emissions resulting from ships sailing at high speeds and consuming unnecessary fuel while waiting at port anchorages. The implementation of Virtual Arrival or Just-in-time policies is closely tied to effective berth scheduling for vessels and quay crane assignment at the terminal. Consequently, this gives rise to the Berth Allocation and Quay Crane Assignment Problem (BACAP), a complex optimization challenge that must be addressed to achieve successful implementation of the Virtual Arrival policy.
To achieve JIT arrival for container ships, Yu et al. used Random Forest (RF) to predict a vessel’s arrival time with the optimization of BACAP and vessel speed optimization [20]. Du et al. analyzed the impact of tides and Virtual Arrival policy on berth allocation [21]. To address the BACAP, Iris et al. proposed novel set partitioning models [22]. Those studies focused on optimizing berth allocation for Virtual Arrival or Just-in-time policies. Furthermore, accurate estimation of vessel arrival times using AIS data would greatly enhance the effectiveness of these policies.

1.2.4. ETA Prediction with Various Approaches

According to [23], approaches to ETA prediction can be categorized as static or dynamic. Static approaches provide a single prediction for each port call using historical maritime data, which includes static vessel and voyage features sourced from ports, such as Terminal Operating Systems or logistics companies. For example, Fancello et al. utilized Neural Network models to predict vessel arrival times to optimize resource allocation in a container terminal [24]. Building upon their work, Pani et al. incorporated additional variables and a larger dataset, employing Classification and Regression Tree methods [25]. Pani et al. extended their previous study and included weather data and critical trajectory points, using Classification and Regression Trees, Logistic Regression, and Random Forests for classification tasks [26]. These studies revealed variations in prediction accuracy and the relative importance of variables across different ports. Although these studies are notable, static approaches have limitations in their failure to account for dynamic vessel behaviors and real-time situations. Without knowledge of the vessel’s current circumstances, accurately determining the vessel’s time of arrival at the destination terminal becomes challenging.
In the dynamic category, models utilize real-time dynamic features derived from the AIS, such as vessel position and speed, to predict ETA at different stages of the voyage. For instance, Kim et al. applied a case-based reasoning method to determine real-time delay classes during a vessel’s journey [27]. Wu et al. conducted a study on the estimation of travel time for vessels navigating narrow channels in Houston using terrestrial AIS data [28]. They determined the ship’s behavior and movement direction to make estimations. While their estimation approach is commendable, it primarily focused on vessels within the channel. Consequently, tracking and analyzing out-of-channel vessels were limited, making it challenging to gather comprehensive voyage information and understand the characteristics of ships when departing from their previous port of call and predicting their arrival time at the intended port.

1.2.5. Summary

To summarize, the literature review highlights a considerable emphasis on various applications of the AIS and predicting vessel arrival times, with notable progress made in route modeling, trajectory mining, virtual arrival policies, and ETA prediction approaches. Despite these advancements, there exists a gap in terminal-oriented estimation of vessel arrival time. Limited research has specifically focused on modeling vessels’ historical routes using Satellite AIS data to establish representative paths for ETA predictions and analyzing current inaccurate ETA metrics, which terminals still rely on for berth planning purposes.

1.3. Contributions

This research stands out from others due to its unique contribution in the following three areas.
  • Terminal-focused ETA predictions: This study focuses specifically on estimating vessel arrival times at a container terminal at Busan New Port, South Korea by collecting and analyzing AIS data of vessels entering the terminal, as shown in Figure 1. The authors relied on the Terminal Operating System (TOS) of the terminal to gather information about the vessels’ scheduled arrivals. Although these studies were mainly focused on solving berth allocation problems [21,22] and analyzing the trajectories of tanker and bulk carriers [16], it is limited to the assumption that vessels in the experiment are punctual to the berthing schedule. Yu et al. attempted to combine the Berth Allocation and Crane Allocation Problem with prediction models of vessel arrival time using the Random Forest technique [20]. However, the input parameters used in their study were relatively insufficient. Furthermore, their algorithm only took into account the ship’s estimated time of arrival (ETA) 24 h before arrival, disregarding the high volatility of ship ETAs, thus demonstrating its limitations. The findings of this study have practical implications for berth allocation and terminal operation tasks at the specific terminal under examination.
  • Novel detection method for determining vessel departure and arrival: This research introduces a novel method for determining when vessels depart from their previous port of call and arrive at their destination port, Busan. By confining the prediction boundary to the short leg between these two ports, the complexity of the prediction process is reduced. The authors created location polygons in the vicinity of the previous ports to monitor vessel departures and arrivals using AIS data, allowing them to closely track these movements.
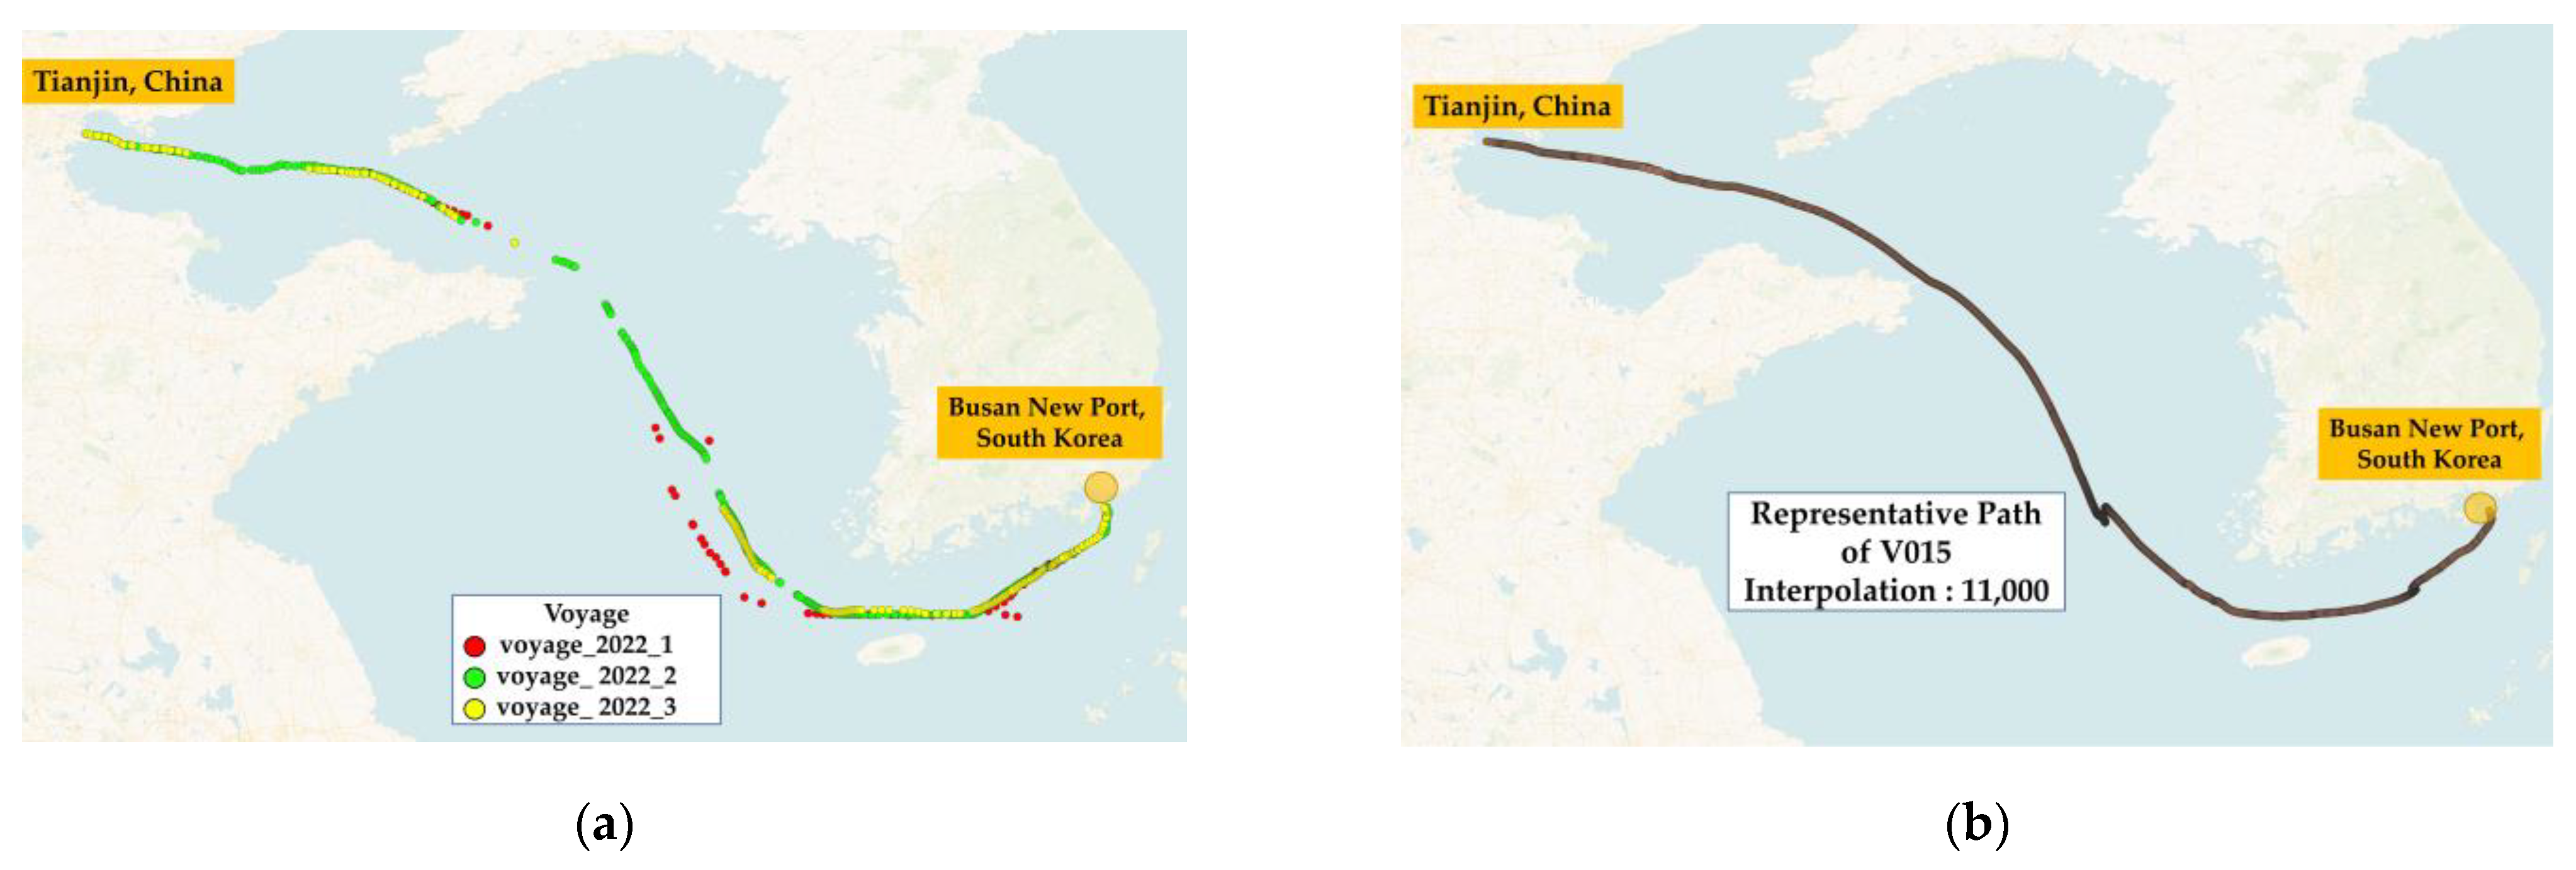
  • Consideration of implicit navigational features: This research incorporates implicit navigational features by examining representative paths of individual ships and recognizing their influence on vessel trajectories. Talavera et al. also used historical AIS data to construct representative paths, but their work focused more on traffic prediction on a waterway, not the arrival time of container vessels [9]. These representative paths were constructed from historical AIS trajectories using spline interpolation and a segmentation method, refining the trajectory data. By integrating both implicit navigational characteristics and representative paths into the prediction model, ETA predictions are improved.
Section 2 provides an overview of the research object, followed by the data used in this research and the methodologies employed, such as route modeling, representative path, ETA prediction algorithm, and searching for optimal parameters. Section 3 presents the results, while Section 4 provides a discussion of the results. Finally, Section 5 presents the conclusions drawn from the study.

2. Materials and Methodology

2.1. Research Object

The primary object of this research is to develop a robust model that can accurately predict ETAs in terminal operations planning. Currently, the traditional method of providing ETAs involves shipping agents communicating via phone or email, which is then stored in the TOS. In this paper, the ETAs recorded in the TOS are referred to as E T A T O S , which can be compared with predicted ETA from our methodology. Furthermore, ETA information in AIS data has recently been publicly available on websites such as MarineTraffic.com (accessed on 10 May 2023), where ships’ current and past positions, ETA, and other information are offered. Since terminal operators also get access to such AIS data for source of terminal berth planning, ETA in the AIS is referred to as E T A A I S in this research. The research aim is to facilitate efficient planning of ship arrivals by enhancing the accuracy of ETA predictions, surpassing the existing metrics employed in berth planning.
E T A p r e d , v i , w j R P P o p t i m a l , Q o p t i m a l , v i , w j ,   V v i , w j
M A E p r e d , v i , w j = | E T A p r e d , v i , w j A T A v i , w j | n
M A E T O S , v i , w j = | E T A T O S , v i , w j A T A v i , w j | n
M A E A I S , v i , w j = | E T A A I S , v i , w j A T A v i , w j | n
M A E p r e d   T o t a l = j = 1 8 i = 1 81 M A E p r e d , v i , w j N
M A E T O S   T o t a l = j = 1 8 i = 1 81 M A E T O S , v i , w j N
M A E A I S   T o t a l = j = 1 8 i = 1 81 M A E A I S , v i , w j N
Equation (1) represents the process of predicting ETAs for vessel v i from the previous port w j . This prediction is based on the representative path R P P o p t i m a l , Q o p t i m a l , v i , w j and the processed AIS data voyage for performance evaluation V v i , w j . In Equations (2)–(4), the Mean Absolute Errors (MAEs) of the predicted ETA ( E T A p r e d ), E T A T O S , and E T A A I S , respectively, are calculated. This is achieved by subtracting each ETA from the Actual Time of Arrival (ATA) and dividing by the total number of data points in a voyage.
To evaluate the performance of the ETA model, MAEs from Equations (2)–(4) were summed for all 81 vessels and 8 previous ports, as shown in Equations (5)–(7). The resulting MAEs, the total mean absolute error of the E T A p r e d ( M A E p r e d   T o t a l ), the total mean absolute error of E T A T O S , ( M A E T O S   T o t a l ), and the total mean absolute error of E T A A I S ( M A E A I S   T o t a l ), respectively, were then compared.
This research aims to predict an M A E p r e d   T o t a l that is lower than both the M A E T O S   T o t a l and the M A E A I S   T o t a l , respectively. This comparison aims to demonstrate the superior accuracy of the developed model in predicting ETAs compared with the existing methods utilized in berth planning.

2.2. Schematic Diagram

The present study outlines a research approach that involves two distinct stages, as depicted in Figure 2. The first stage of the research was about voyage modeling for ETA prediction and optimal parameter search. This stage commenced with the voyage splitting process, wherein AIS data of ships was collected and preprocessed. The arrival and departure data of ships was classified, and each voyage was modeled by classifying them by vessel and by previous port. Representative routes for each vessel were derived using spline interpolation and segment. When AIS data was updated anew, ETA of the modeled voyage was predicted, and the optimal parameters, P o p t i m a l and Q o p t i m a l , were explored for each voyage, considering the number of interpolations, segments, and the difference between actual time of arrival and the ETAs calculated as Mean Absolute Error (MAE).
The second stage of the research involved the evaluation of modeled voyages and optimal parameters P o p t i m a l and Q o p t i m a l obtained in Stage 1. ETAs were predicted using the new voyage data of the modeled vessel, and the results were compared with the existing ETA metrics, E T A A I S and E T A T O S , for MAE.

2.3. Data Preparation

2.3.1. Data Description

This study utilized three types of data, namely AIS data, Ship Arrival and Departure Declaration system data, and berth plan data. The berth plan data contained berth allocation plans in the TOS, which provided information regarding the scheduled ships’ entry into the terminal, detailed berthing/unberthing datetime, and other relevant data. AIS data was utilized to obtain the actual voyage and navigation information of the monitored vessels, using the vessel list in the berth plan data. The historical arrival and departure time and previous port information of the vessels were collected through Ship Arrival and Departure Declaration system data and used for voyage separation.

AIS(S-AIS)

The AIS signals had a horizontal range of about 40 nautical miles (74 km), meaning that AIS traffic information was only available around coastal zones or in a ship-to-ship zone [7]. A terrestrial AIS is a short-range coastal tracking system that provides identification and positioning information to vessels and shore stations. Conversely, Satellite-AIS (S-AIS) is an extension of AIS that allows for wider coverage and longer range [7]. In order to model the overall route of vessels in open waters, S-AIS was mainly used in the research. AIS data comprises static, dynamic, voyage-related, and safety-related information, as documented in [7].
Table 1 represents AIS data sent by ship side. Table 2 shows raw S-AIS data of the ‘vessel GLO**’. In Table 1, static information was typically fixed and modified only when AIS equipment was first installed on board or when ship specifications changed. Dynamic information was automatically transmitted by AIS equipment and updated dependent on speed and course alteration, while voyage-related information was manually updated by navigators, including ETA information for the next port of call [7]. Authors preprocessed the raw data to have it in dataframe datatype using the Python library Pandas 1.3.5, and accumulated during the research period. Among many fields, certain columns, including vessel name, vessel position, position timestamp, API call timestamp, heading, ETA, Destination, and SOG, were used for the research. This research did not tap into voyage-related information because there was unreliability of voyage-related information. During the data preprocessing, it was found that voyage-related information, such as ETA and Destination, had been updated infrequently, due to negligence of some bridge officers in charge or technical glitch of AIS equipment. According to [29], about half of the navigational information in the AIS, such as ETA and destination, transmitted showing obvious errors. That means it is hard for berth planners in the terminal to look to ETA in AISs for berth planning.

Ship Arrival and Departure Declaration System from Port-MIS System

Port Management Information System (Port-MIS) is an electronic information system related to port operations managed and operated by the Ministry of Oceans and Fisheries of the Republic of Korea. Among its many functions, the data used in this paper are Ship Arrival and Departure Declaration systems. Since this information is publicly available online, it was used to categorize AIS voyages by vessel. Table 3 represents the Ship Arrival and Departure Declaration system data sample of Vessel V010.

TOS Berth Plan

A Terminal Operating System (TOS) is an essential component of the supply chain that plays a crucial role in managing the transportation and storage of different types of cargo within a port or marine terminal [30]. In this study, the berth plan in TOS of the container terminal testbed, which contains the schedules of vessels arriving, was utilized to identify which vessels were to be monitored for AIS data collection, as the research focused on vessels arriving at the terminal at Busan New Port.

2.3.2. Data Gathering Description

The present study utilized S-AIS, Ship Arrival and Departure Declaration system, and TOS berth plan data to predict ETAs of vessels expected to arrive at the terminal in focus. As Table 4 shows, AIS data was collected from 20 September 2022 to 13 January 2023, for a duration of approximately four months. A separate evaluation dataset was also collected, covering a period of two months from 14 January to 14 March 2023, which included 27 out of the 81 ships utilized in the model.
By calling S-AIS API through a subscription to a low-orbit satellite service, the collection of vessels was updated every 5 min. The resulting raw data consisted of 1,255,387 rows. The collected data were saved in comma separated values (csv) files. Additionally, the berth plan and Ship Arrival and Departure Declaration system data were also collected cumulatively during the AIS collection period. Table 5 briefly offers vessel principal particulars used in this research.

2.4. Past Voyage Route Modeling

2.4.1. Previous Port of Call Categorization

Figure 3 provides a map of the previous ports of call of ships collected during the study period. A total of 152 ships were collected, yielding 358 routes and 39 previous ports of call. Based on the number of previous ports of call and the number of routes, we identified eight ports with the highest number of samples for subsequent modeling, as shown in Table 6. Since a lack of voyage data may hamper the modeling performance, the authors decided to exclude vessels with less than 50 AIS data rows per voyage.
As a result, the voyage data of ships with a history of departure from the identified eight previous ports of call were used for voyage modeling. This resulted in the selection of 157 voyages from 81 ships during the modeling period.
v e s s e l   v i ( v 1 ,   v 2 ,   v 3 ,   ,   v 81 )
p r e v i o u s   p o r t   w j ( w 1 ,   w 2 ,   ,   w 8 )
V v i ¯ = ( D 1 ,   ^ D 2 ^ ,   )
V v i , w j , T ¯ = ( D T , 1 ,   ^ D T , 2 ^ ,   ,   D T , k ,   ^ ,   D T , F ^ )
A vessel on focus is denoted as v i and a previous port is as w j , as shown in Equations (8) and (9). In Equation (10), V v i ¯ represents a raw AIS dataset of vessel v i . D 1 ^ corresponds to the AIS data of index 1 of v i , which has been sorted by its timestamp. In Equation (11), V v i , w j , T ¯ refers to the split AIS data of v i from previous port w j over a specified timespan T. The value of T can be obtained from the ship’s departure time and arrival time history recorded in the Ship Arrival and Departure Declaration system. V v i , w j , T ¯ comprises a set of F indices.

2.4.2. Location Polygon for Voyage Splitting

In this study, the primary goal was to accurately predict the estimated time of arrival for vessels during their voyages. To achieve this, a preprocessing technique was employed to segment raw voyage into legs, which represent specific segments from the vessel’s departure from the previous port to its arrival at Busan port. This segmentation was crucial because it allowed for a more precise analysis of each leg, taking into account the unique characteristics and variables associated with different segments of the voyage. However, obtaining accurate departure and arrival times from available data sources, such as the AIS, TOS, and the Ship Arrival and Departure Declaration, was challenging due to the lack of detailed information. To address this issue, a novel method utilizing location polygons is proposed in this study. Location polygons are geospatial shapes projected around port areas and composed of connected points of interest. By monitoring AIS location points within the location polygons, the departure and arrival times of voyages can be accurately determined, enabling more precise ETA predictions.
P o l y g o n w j = ( P o l y g o n l a t 1 , l o n 1 , l a t 2 , l o n 2 , , h e a d i n g w j , t h r e s h o l d )
Each P o l y g o n w j comprises location polygons associated with the previous port and a heading criterion, like Equation (12). The authors manually selected the points of interest to construct the shape of the location polygons by closely monitoring the traffic flow of AIS trajectories. The shape of connected points in the location polygons could be either convex or non-convex, depending on the geometry of the previous port region. However, whether the polygon was convex or not, its primary purpose was to determine if the vessel’s position was within the polygon or not.
Algorithm 1 is a method that splits raw voyage data of vessels using location polygons. Further detailed descriptions of the aforementioned concepts are provided in the subsequent sections of Finding the starting point of the voyage (ATD) and Finding the Last Point of the Voyage (ATA).
Algorithm 1: Voyage splitting using location polygons
Jmse 11 01234 i001

Finding the Starting Point of the Voyage

To determine if a ship was departing, three conditions were all checked.
  • The voyage data must fall within or nearby the location polygon, indicating that the ship was either on the verge of leaving or had already left the polygon.
  • The heading of the ship must meet the specified criteria.
  • The average starting sailing speed must be equal to or greater than 11 knots.
As previously discussed, location polygons were utilized to track the AIS locations of vessels. When a vessel fell within the polygon associated with the previous port, it signified that the vessel had arrived at the port. Subsequently, after the completion of cargo operations at the terminal, the ship was ready to depart. The moment when the AIS data crossed the boundary of the location polygon marked the ship’s departure. However, during our observation and preprocessing, we encountered instances where vessels left the location polygon due to reasons such as shifting berths or remaining at anchorage near the port. This finding highlights the need to consider additional conditions to avoid making naïve determinations of the departure time. Figure 4 presents an overview of the location polygons for the eight ports to detect the ATD. Each polygon, denoted as P o l y g o n w j , represents the geospatial region of a previous port w j . To identify the departure location and time, the authors employed the P o l y g o n w j to analyze the raw voyage data. The raw voyage dataset V v i , w j , T ¯ was sorted based on timestamp and subsequently evaluated to detect coordinates that fell within the polygon. This was achieved using the Point.within function of shapely 1.8.2, one of Python’s libraries.
The heading criteria were established to determine whether the departing vessel was moving away from the port, with its heading in the opposite direction. We analyzed the heading angles of vessels at the time of departure and identified specific ranges of angles for each port. These ranges represented the boundary angles within which vessels typically followed the departing route.
To determine these boundaries, we calculated the average heading angles based on the voyages collected during the research period. For instance, we examined 37 voyages that departed from Tianjin port to Busan. After departure, we averaged the heading angles for each voyage and determined the minimum and maximum average heading angles across all 37 voyages. In the case of Tianjin, the minimum heading angle was 93.2 degrees, and the maximum heading angle was 121.2 degrees. We applied the same methodology to the other ports as well. The heading angle criteria corresponding to the previous ports are illustrated in Figure 5 and summarized in Table 7. Table 7 presents the overall results of the method, while Figure 5 displays the heading angle polar plot organized by port. Each colored sector represents the boundary angles for the heading. By implementing this method, we successfully applied it to all 157 voyages, allowing us to accurately determine the actual departure time.
Lastly, the average starting sailing speed in the initial voyage was taken into consideration. When vessels depart, they may encounter other vessels along their route or allow the pilot to disembark after passing the port area, resulting in a potential decrease in speed. However, once all obstacles have been cleared, they accelerate for normal navigation. According to [31], the lowest speed of most vessels across all sailing legs is 14 knots. Authors referred to this speed for validation purposes and found that the majority of monitored vessels commenced their voyage at speeds around 11 knots or even higher. Consequently, a threshold of an average of 11 knots was set to determine the actual start of the voyage based on three consecutive AIS data points.
All conditions considered, the actual time of departure point (ATD) was determined and denoted as D 1 (ATD).

Finding the Last Point of the Voyage

As in the absence of actual time of departure in data sources such as AIS or TOS, Actual Time of Arrival information was also unavailable. In TOS, there is an Actual Time of Berth (ATB) field for when the vessel actually berthed at the terminal berth, but the actual time of arrival is not maintained. To find the actual time of arrival, it was necessary to determine the actual time of arrival in the same way as the actual time of departure.
Figure 6 depicts a location polygon used to determine the actual time of arrival of ships entering Busan New Port. The polygon, P o l y g o n B u s a n , was created by combining the polygons of the pilot boarding place (PBP) and the anchorage near Busan New Port. A pilot boarding place is a designated zone where a pilot boards a ship to assist with navigation when entering a port. In the Busan New port, due to its narrow channels and traffic congestion, vessels are mandated to have a pilot on board when berthing. The pilot boarding place is typically located near the port entrance and can be a pier, buoy, or other suitable location where the pilot can safely board the ship.
Additionally, an anchorage is a designated area in a harbor or port where ships can anchor and wait for their turn to enter the port. The coordinates of the Busan New Port anchorage area, designated by the government, and the pilot boarding points, disclosed by the Busan Harbor Pilot’s Association, were utilized to construct the polygon. To account for the update interval and error of the AIS data, an additional error radius of approximately 5 km was incorporated into the actual polygon. Since vessels often deviate from the designated areas when arriving, we experimentally set an error radius of 5 km to improve the determination of actual arrival.
To find the end point (ATA), we defined ATA as the time when the first point in V v i , w j , T ¯ by timestamp entered the P o l y g o n B u s a n . Once a vessel’s position was found in a given polygon, the corresponding AIS point was selected as D E (ATA). In this study, the ETA was calculated using the ATA as the ground truth because it is a prediction of when the vessel will arrive at the arrival point regardless of the actual berthing time.
The result of algorithm 1 is the processed voyage V v i , w j , T of vessel v i from previous port w j over timespan T. V v i , w j , T contains discrete AIS data starting from D 1 to D E .

2.5. Generating Representative Paths

The purpose of creating a representative path is to model the navigation of a specific ship by reflecting its navigation characteristics. A representative path is a single path that represents the voyages of ships departing from the same previous port of call. Since the number of data points for each route may differ, it was necessary to first equalize the number of data points. To achieve this, interpolation was used to create a uniform number of data points for each voyage. Subsequently, the indices of each voyage were grouped, and the average values of latitude, longitude, and speed were computed to generate a representative path.

2.5.1. Spline Interpolation for Integrating Voyages

During the voyage modeling period, raw voyages were cut to the core as a result of Algorithm 1. Processed voyages were then combined by the same vessel v i and same previous port of call w j to generate a representative path using spline interpolation. Interpolation is a mathematical technique used to estimate values between known data points. In Wu et al.’s previous work [28], interpolation was utilized to fill in the gaps within discrete AIS points, enabling the determination of vessel movement direction. Similarly, Hintzen et al. employed spline interpolation to reconstruct trajectories of fishing vessels [32]. Building upon their approach, we adopted spline interpolation in this study to enhance the smoothness of predictions for intermediate values. This was particularly crucial for long-distance voyages, which tend to exhibit complexity and non-linearity, making it desirable to obtain a smooth curve representation of the routes.
V v i , w j , c o m = ( V v i , w j , T 1 ,   V v i , w j , T 2 ,   ,   V v i , w j , T k ,   ,   V v i , w j , T R )
R P P , Q , v i , w j = k = 1 R S p l i n e V v i , w j , T k x , y , z R
R P P , Q , v i , w j = ( p 1 ,   p 2 ,   ,   p n ,   ,   p P )
p n = ( x n ,   y n ,   z n )
Equation (13) consists of several V v i , w j , T k . Each is a group of R numbers of processed voyages, where R is the number of voyages of v i from w j . The set of data p n of the representative path of vessel v i departing from the previous port w j is referred to as the Representative Path, denoted by R P P , Q , v i , w j , where P represents the number of interpolations and Q represents the number of segments. In Equations (14) and (16), x denotes longitude, y denotes latitude, and z denotes ship’s actual speed. After being interpolated to P, each x, y, and z of the processed voyages were added and divided by R, generating a representative path of v i from w j . Additionally, the authors define p n as the position and velocity vector of the nth index of the representative path, as shown in Equation (15).
In this study, we used the interpolate.interp1d (kind = ‘cubic’) function from the Python library scipy 1.4.1 to perform spline cubic interpolation. Table 8 shows a sample of a representative path generated using this interpolation method

2.5.2. Segmenting Representative Path

Figure 7 shows an example of a segmented representative path, where each segment has data equal to P divided by Q, and there are Q total segments in the path.
After representative paths were derived from the processed voyages of v i from w j , segmenting the path into several segments was needed. This is because computing ETAs for each interpolated path takes a lot of time and resources. We suggest that segmentation can reduce the time and resources by obtaining the average speed of segments and applying them to calculate ETA predictions. In an experiment by the authors, an average computation time of ETA prediction without segmentation took about 3 min and 52 s per voyage of a vessel, while by using segmentation, the time taken was significantly reduced to 1 min and 10 s. The experiments were conducted on a computer with an Intel Core i7-10700F processor, 32 GB of RAM, and a solid-state drive. Additionally, the programming tasks were performed using Python 3.7 on a Windows 11 machine.
R P P , Q , v i , w j = p 1 ,   p 2 ,   ,   p n ,   ,   p P = ( S e g 1 ,   S e g 2 ,   ,   S e g m ,   S e g Q )
S e g m = ( p P Q m 1 + 1 ,   p P Q m 1 + 2 ,   ,   p P Q m 1 ,   p P Q m )
1 n P , 1 m Q
Representative Path, R P P , Q , v i , w j , can also be represented by a series of Segs, like Equation (17). Each segment was constructed using a range of indices of P and Q, shown in Equation (18). In Equations (19), the index of the AIS data n is greater than 1 and cannot exceed number of interpolations P, and the index of segment m also cannot exceed the number of segments Q. A larger number of segments generally performs better, as the interpolated representation of the route becomes more normalized and can better follow speed trends. In our experiments, we varied two parameters, namely the number of segments and the interpolation number, to select the optimal parameters for each ship.
In Figure 8a, there are three voyages of v i . Each of those voyages was firstly interpolated equally, such as the number of 11,000. The data lengths of each voyage then became equal, ready for integration. Subsequently, the longitude, latitude, and speed values for each column of the three voyages were averaged to determine the representative path of v i from the previous port, Tianjin. The representative path of v i from the previous port is shown in Figure 8b. Figure 9a shows the overview of the previous port of call and the beginning parts of the representative path, and Figure 8b represents the last part of the voyage. In Figure 9b, the green colored blots are the normal path, and the red colored dots are excluded for implementing representative path, as the P o l y g o n B u s a n filters the last point of the voyage.

2.6. Prediction of ETA

Let V v i , w j , T denote the AIS voyage data of ship v i departing from port w j over a timespan T, which is a set of multiple AIS voyage data arranged in chronological order, presented in Equation (20). Let D t denote the AIS data at time index t, where D 1 is the data at the time of departure from the previous port j, and D E is the data at the time of arrival in Busan, as shown in Equations (21) and (22). The time index t is always greater than 1 and cannot exceed E, in Equation (23).
V v i , w j , T = ( D 1 ,   D 2 ,   ,   D t ,   ,   D E )
T i m e s t a m p   o f   D 1 = A T D   o f   p r e v i o u s   p o r t   j
T i m e s t a m p   o f   D E = A T A   o f   B u s a n   N e w   P o r t
1 t E
The algorithm for predicting a ship’s ETA at each timestep using a representative path as a model based on interpolation and segmentation, with AIS data for each ship as input, can be described in following Algorithm 2.
Algorithm 2: ETA prediction using interpolation and segmentation
Jmse 11 01234 i002
The point P a in the representative path was closest to the location coordinate C t of D t . We then identified the segment S e g b to which P a belonged. The algorithm calculated the duration D u r a t i o n i n i t i a l by dividing the distance from P a to C t by the speed S t of D t .
Next, the algorithm computed the duration D u r a t i o n b for segment S e g b by calculating the cumulative distance from point P a in S e g b to the last point inside S e g b , P P Q · b , and dividing it by the average speed from speed values in S e g j . It then proceeded to compute the duration for each subsequent segment up to the last segment S e g Q , by calculating the distance between the internal first point P P Q b 1 + 1 and the internal last point P P Q b , dividing it by the average speed inside the segment, and adding up these durations to obtain the cumulative duration D u r a t i o n r e m a i n i n g .
Finally, the algorithm computed the total duration D u r a t i o n t o t a l by summing up all the obtained durations, and added it to the timestamp t i m e t of D t to obtain the ETA at timestep t. The algorithm terminated when D t became D E .

2.7. Searching for Optimal Parameters

In order to optimize the ETA prediction algorithm for each ship, the number of interpolations and the number of segments must be carefully selected. To accomplish this, experimentation was conducted to observe the ETA prediction error, measured as the mean absolute error (MAE), for different combinations of these parameters. The optimal parameters that resulted in the lowest ETA error were then selected for each ship, based on vessel-specific navigation characteristics. The ETA error was calculated by dividing the voyage data by previous ports of call, while varying the number of interpolations and segments. A total of 10 interpolation number parameters ranging from 2000 to 11,000 and 10 segment number parameters ranging from 20 to 110 were utilized in the experimentation process. To ensure that the optimization process was conducted on a vessel-specific basis, test cases with the same previous port of call for each vessel were grouped together. At least 100 tests were conducted for at least one route, and the results were stored on a local PC for further analysis. Ultimately, the optimal parameters for each vessel were determined based on their ETA prediction performance, with the goal of minimizing the ETA error.

Error Metrics

Mean Absolute Error (MAE) in Equation (24) is a metric that evaluates the accuracy of a predictive model by measuring the average difference between the ATA values and the predicted ETA values. MAE was calculated by taking the absolute value of the difference between the two values and averaging them across the data frame [33]. The resulting MAE value was expressed in timedelta datatype.
M A E = i n E T A i A T A 2 n
In Algorithm 3, the process to search optimal parameters is described. To search for the optimal parameters, the values of P and Q were varied for each ship, and the results of Algorithm 2 were saved in an empty dataframe form. Subsequently, the parameters P o p t i m a l , v i , w j and Q o p t i m a l , v i , w j with the lowest MAE were selected from the saved results for each ship.
Algorithm 3: Searching optimal parameters
Jmse 11 01234 i003

2.8. Model Performance Evaluation

2.8.1. Evaluation Data

Evaluation data refers to new data that were not used during the model training. In this study, as mentioned in Section 2.3.2. Data gathering description, the data collected after the model training were used for evaluation.

2.8.2. Evaluation Method

The optimal parameters determined in Section 2.7 were applied to estimate the ETA for each ship and port of call using Algorithm 2 with the evaluation data. The algorithm results were evaluated by comparing the MAEs with those of TOS ETA and AIS_ETA, which were the research objectives.

3. Results

3.1. Results of Modeling and Evaluation

The algorithm’s performance was evaluated by comparing the predicted ETA with other ETAs, which terminal operators tap into when planning berth schedule, obtained from the AIS and Terminal Operating System (TOS). The mean absolute error (MAE) was used as the evaluation metric to access the accuracy of the algorithm’s predictions.
The MAE comparison between Modeling and Evaluation is shown in the following Table 9. During the modeling period, which spanned 4 months, the algorithm achieved an MAE of approximately 3 h and 14 min for predicted ETAs. This indicates that, on average over a whole voyage period, the algorithm’s predicted ETA deviated from ATA by 3 h and 14 min. In comparison, the MAE for AIS ETAs was 16 h and 37 min, and for TOS ETA, it was 5 h and 15 min. These results highlight the algorithm’s superior performance in ETA prediction compared with the AIS and receiving records of ETAs in TOS.
The average error of predicted ETA in the evaluation period was 7 h and 26 min. When comparing the MAEs between the modeling and evaluation periods, it was found that the MAEs of the predicted ETAs were higher during the evaluation period than during the modeling period. This suggests that the algorithm faced more challenges in accurately predicting ETAs compared with the modeling phase.
By the same token, the MAEs for both AIS ETA and TOS ETA were higher during the evaluation phase compared with the modeling period. The MAE value of AIS ETA during the period was over 20 h and that of TOS ETA was over 21 h. Although the result of predicted ETA during the evaluation period was worse than that during the modeling one, it still surpassed both AIS ETA and TOS ETA.

3.2. Optimal Parameter Result

Table 10 provides an overview of the optimal parameters obtained for various voyages. By tailoring the parameters to the specific characteristics of each voyage, the algorithm achieved improved ETA prediction results. The optimal parameters vary depending on the individual vessel’s route and conditions, allowing for more accurate predictions of ETA from previous ports of call. This customization ensures that the algorithm adapts to the unique characteristics and requirements of each voyage, enhancing its overall performance in estimating arrival times.

3.3. ETA Prediction Plots

3.3.1. Modeling

Figure 10 presents the error comparison plot for voyage 2022_6 of Vessel V015 during the modeling phase. The plot depicts the change in error over time, with the x-axis representing the timestamp. The blue line represents the algorithm’s predicted ETA error, while the red line represents the ETA of AIS, and the black line represents the ETA of TOS. This visualization allows for a clear comparison of the algorithm’s performance with the AIS and TOS in terms of ETA prediction accuracy. The figure shows a stark contrast between the predicted ETA error and the other two errors.
Errors of AIS’ ETA stay at over an average of 1200 min during the whole voyage. That means that the ETAs in the AIS were rarely updated. Meanwhile, the ETA of the Terminal Operating System was updated twice during the voyage. Yet, the latest update resulted in a higher error compared with the previous one. Conversely, the proposed method consistently demonstrated a stable result between an average error of 20 min. Terminals may find it challenging to manage the expected time of arrival of this vessel if they follow the received ETAs of the Terminal Operating System or AIS itself. The detailed data can be found in Appendix A.
Additionally, it was observed that the ETAs obtained from the AIS and TOS were infrequently updated throughout the voyage. In contrast, the proposed method was able to generate ETAs whenever there was an update in the AIS position. This highlights the advantage of the proposed method in providing more timely and updated ETAs compared with those of the AIS and TOS.

3.3.2. Performance Evaluation

Figure 11 illustrates the mean absolute error comparison plot for voyage 2023_1 of Vessel V010 during the evaluation phase. The plot shows the change in errors over time, with the blue line representing the algorithm’s predicted ETA error, the red line representing the ETA errors of the AIS, and the black line representing the ETA errors of TOS. Overall, the algorithm’s performance in both the modeling and evaluation phases demonstrated promising results, with lower errors and improved accuracy compared with the AIS and TOS metrics. Errors in the ETAs from the AIS showed a decreasing trend throughout the voyage, but even with the latest ETA update, the error still exceeded 500 min. In contrast, the errors in the ETAs from the Terminal Operating System were relatively lower, averaging around 400 min, and approximately a day before the ship arrived, the error reduced to approximately 50 min. The proposed method generally outperformed TOS_ETA in predicting ETAs. As in the modeling period, the evaluation period for the proposed method exhibited a similar trend of oscillation, but with higher volatility. The detailed data can also be found in Appendix A.

4. Discussion

This study makes three contributions: terminal-focused ETA predictions, a novel method for detecting vessel departure and arrival, and consideration of implicit navigational features. Terminal-oriented ETA predictions have practical implications for berth allocation and terminal operation tasks. The complexity of prediction tasks was reduced by dividing voyages into shorter legs. Additionally, this research implemented representative paths of vessels using historical AIS data and spline interpolation and segmentation.

4.1. Analysis of the Results

The performance of the predictive algorithm was assessed by calculating the MAE for a total of 115 modeled voyages. The MAE results obtained during the evaluation period were observed to be worse than the results obtained during the modeling period. Several factors contributed to this discrepancy between the modeling and evaluation results.
Firstly, there was a significant difference in the number of voyages between the two periods. The modeling period spanned 4 months with 115 voyages, while the evaluation period covered 2 months but only included 33 voyages. This disparity arose from the limited number of vessels returning to the terminal within the evaluation period. Despite the assumption that most ships would regularly call at Busan New Port, only 19% of the vessels returned within two months after entering the terminal.
Moreover, the evaluation phase exhibited greater variability compared with the modeling period. Onboard, bridge officers and the captain play a crucial role in calculating ETAs, taking into account various factors such as route selection and speed adjustments. These calculated ETAs are then communicated to the terminal operator via electronic mail or phone call, and recorded as TOS_ETA in the TOS. Similarly, officers onboard manually update the calculated ETAs in the AIS. However, during the evaluation period, errors in both AIS_ETA and TOS_ETA were still larger compared with the modeling period. The MAE of AIS_ETA increased by approximately 24%, while the MAE of TOS_ETA more than tripled. This increase in error rate can be attributed to the higher level of voyage variability observed during the evaluation period. Although the precise cause of this increase in variability is not immediately apparent, it is reasonable to assume that changes in these factors contributed to the higher error rates observed in ETA predictions during the evaluation period.
Lastly, the optimal parameters for some vessels were less robustly obtained. The modeling phase allowed for the identification and optimization of parameters, such as the number of interpolations and segmentations, to achieve accurate ETA predictions. However, as mentioned earlier, the actual number of times a vessel visited the terminal was only about 19% of the total. Therefore, for some of the vessels used in the model, a single voyage was modeled as a representative path, rather than a representative path with multiple numbers of voyages. This limitation may have affected the algorithm’s absolute performance.
Table 11 provides a comparison of the effects of the number of modeled voyages on performance results. Vessel V063 had 11 visits during the modeling period. In the evaluation period, the algorithm accurately predicted V063′s voyages, with an MAE of 3 h and 11 min, outperforming both TOS_ETA and AIS_ETA. In contrast, Vessel V051 and V026, which had only one and two visits during the modeling period, respectively, displayed higher MAE values than that of V063. This indicates that modeling a higher number of voyages leads to lower MAE values in ETA predictions.
Despite the observed increase in MAE values during the evaluation period, it is important to highlight that the overall accuracy of the algorithm’s predictions remained satisfactory. The algorithm still outperformed existing AIS and TOS systems in terms of ETA estimation accuracy. These results indicate the algorithm’s potential to provide reliable and precise ETA predictions for maritime voyages.

4.2. Relationship between Interpolation and Segment and ETA Estimation Accuracy

The relationship between the number of interpolations and segmentations was examined in this study. The authors introduced two categories: detailed and fluctuated voyage, based on the number of interpolations and segments. The detailed category referred to cases where a larger number of interpolations and segments were used, leading to more accurate ETA estimations. Conversely, the fluctuated voyage encompassed cases where fewer interpolations and segmentations were employed, resulting in improved ETA estimation accuracy.
Increasing the number of interpolations and segmentations allowed for a more detailed and precise representation of the voyage. Fine interpolation of the historical path accounted for the nearly constant velocity within each modeled segment, contributing to more accurate representative paths for ETA prediction. This approach proved effective for voyages with relatively stable conditions and predictable factors. To demonstrate the robustness of the results of detailed voyages, we conducted a sensitivity analysis using different input parameters, and the results and further discussions are provided in Appendix B for readability purposes.
On the other hand, fluctuated voyages presented challenges due to significant variations in speed caused by external factors. These factors included rapid changes in port schedules, adverse weather conditions, and mechanical issues affecting the vessel’s performance. Modeling these fluctuated routes with a high number of interpolations and segments increased the variability in the representative path, leading to increased errors in ETA calculations. To address this issue, the number of interpolations and segmentations were reduced to widen the speed modeling range, resulting in improved ETA estimation accuracy.
Voyages were categorized as fluctuated when speed data reached 10 knots below and the decreased speed stayed for at least 30 min during the voyage. This analysis revealed that fluctuated voyages accounted for approximately 28% of the total modeled voyages, and it was also found that reducing the number of interpolations and segments improved the algorithm’s performance for these specific cases. Future research efforts will focus on modeling fluctuated voyages in greater detail to further enhance the accuracy of ETA predictions.

5. Conclusions

5.1. Summary

Accurate ETA estimation is vital for effective terminal and maritime operations, enabling efficient planning and decision-making. This study presents a predictive algorithm for ETA estimation based on historical voyage data. The algorithm utilizes a combination of interpolation, segmentation, and optimal parameter selection techniques to predict vessel arrival times. By dividing the historical voyage data into representative paths and applying spline interpolation, the algorithm generates accurate and detailed routes for ETA prediction. The segmentation of representative paths further enhances computation efficiency. The evaluation of the algorithm’s performance demonstrates its effectiveness during the modeling period, with an average MAE of approximately 3 h and 14 min. These results surpass the accuracy of existing ETA records, such as TOS_ETA and AIS_ETA. By the same token, during the evaluation period, the algorithm still outperforms the accuracy of other ETAs, indicating the algorithm’s superiority in ETA estimation.

5.2. Future Works

Although the proposed algorithm exhibits promising performance, further research is necessary to enhance its accuracy and applicability. Future studies should focus on collecting additional data to improve the model’s robustness and account for fluctuations that occur during voyages. Specifically, investigating modeling techniques that can effectively mitigate the effects of fluctuations, such as changes in weather conditions, terminal congestion, waiting vessels, and cargo volumes, will be crucial in minimizing ETA prediction errors. Furthermore, collaboration with industry stakeholders, including terminal operators, vessel operators, and navigational experts, can provide valuable insights and domain-specific knowledge to further enhance the algorithm’s performance. By integrating practical expertise and continuous feedback from the maritime community, the algorithm can be refined to meet the specific needs and challenges of ETA estimation in real-world scenarios.
Additionally, the heading criteria were determined by calculating the average angle boundary of historical trajectories when vessels departed from their previous port of call. However, obstacles such as islands and straits may exist along their departing route, making it challenging to accurately determine departure solely by following the averaged heading angle boundary. To cope with this, we plan to incorporate geometry data within the port area. By doing so, we aim to enable more detailed and informed determination of the departure, considering the specific geographical features and potential obstacles encountered along the departing route.

Author Contributions

Conceptualization, methodology, software, data curation, writing—original draft preparation, J.-H.Y.; visualization, D.-H.K.; resources, S.-W.Y.; validation, funding acquisition, H.-J.K.; writing—review and editing, supervision, S.K. All authors have read and agreed to the published version of the manuscript.

Funding

This research was supported by a grant from the National R&D Project “Development of Smart Port-Autonomous Ships Linkage Technology” funded by the Ministry of Oceans and Fisheries, Korea (1525012520).

Data Availability Statement

Data sharing is not applicable to this article due to privacy and security issues.

Conflicts of Interest

The authors declare no conflict of interest.

Abbreviations

(S)AIS(Satellite) Automatic Identification System
TOSTerminal Operating System
Port-MISPort Management Information System
MAEMean Absolute Error
ETAEstimated Time of Arrival
ETDEstimated Time of Departure
RTARequired Time of Arrival
PBPPilot Boarding Place
ATAActual Time of Arrival
ATDActual Time of Departure
TOS_ETAEstimated Time of Arrival in Terminal Operating System
AIS_ETAEstimated Time of Arrival in Automatic Identification System
RPRepresentative Path
APIApplication Programming Interface
CSVComma-Separated Values

Appendix A. ETA Prediction Results

Table A1. Modeling ETA prediction result for voyage 2022_6 of Vessel V015.
TimestampVessel NamePrevious PortATAPredicted
ETA
AIS_ETATOS_ETAPredicted_ETA
Error
AIS_ETA
Error
TOS_ETA
Error
12022-10-13 06:46:45V015Tianjin2022-10-15 02:14:342022-10-15 01:54:512022-10-14 06:00:002022-10-15 03:00:000 days
00:19:43
0 days
20:14:34
0 days
00:45:25
22022-10-13 07:16:512022-10-15 02:24:572022-10-14 06:00:002022-10-15 03:00:000 days
00:10:22.
0 days
20:14:34
0 days
00:45:25
32022-10-13 07:47:252022-10-15 02:55:312022-10-14 06:00:002022-10-15 03:00:000 days
00:40:56
0 days
20:14:34
0 days
00:45:25
692022-10-15 01:14:272022-10-15 01:36:482022-10-14 06:00:002022-10-14 23:00:000 days
00:37:46
0 days
20:14:34
0 days
03:14:34
702022-10-15 01:44:302022-10-15 02:06:512022-10-14 05:45:002022-10-14 23:00:000 days
00:07:43
0 days
20:29:34
0 days
03:14:34
712022-10-15 02:14:342022-10-15 02:36:552022-10-14 05:45:002022-10-14 23:00:000 days
00:22:20
0 days
20:29:34
0 days
03:14:34
Table A2. Evaluation ETA prediction result for voyage 2023_1 of Vessel V010.
TimestampVessel NamePrevious PortATAPredicted
ETA
AIS_ETATOS_ETAPredicted_ETA
Error
AIS_ETA
Error
TOS_ETA
Error
12023-01-20 11:49:29V010Yokohama2023-01-24 18:17:122023-01-24 10:43:582023-01-22 01:00:002023-01-25 01:00:000 days
07:33:14
2 days
17:17:12
0 days
06:42:47
22023-01-20 11:54:302023-01-24 10:48:582023-01-22 01:00:002023-01-25 01:00:000 days
07:28:13
2 days
17:17:12
0 days
06:42:47
32023-01-20 11:59:312023-01-24 10:53:592023-01-22 01:00:002023-01-25 01:00:000 days
07:23:13
2 days
17:17:12
0 days
06:42:47
3132023-01-24 17:27:042023-01-24 17:27:042023-01-24 09:50:002023-01-24 19:00:000 days
00:50:08
0 days
08:27:12
0 days
00:42:47
3142023-01-24 17:32:042023-01-24 17:32:042023-01-24 09:50:002023-01-24 19:00:000 days
00:45:07
0 days
08:27:12
0 days
00:42:47
3152023-01-24 17:42:062023-01-24 17:42:062023-01-24 09:50:002023-01-24 19:00:000 days
00:35:06
0 days
08:27:12
0 days
00:42:47

Appendix B. Sensitivity Analysis for Detailed Voyages

To assess the robustness of our results, a sensitivity analysis was conducted to focus on the relationship between the number of interpolations and segmentations. The results in Figure A1 revealed valuable insights into the influence of different parameter values on the robustness. Figure A1a,b presents the outcomes of this analysis by varying parameter settings on the model’s accuracy. As shown in Figure A1, increasing the number of interpolations and segmentations allowed for a more detailed and precise representation of the voyage. Fine interpolation of the historical path accounted for the nearly constant velocity within each modeled segment, resulting in more accurate representative paths for ETA prediction. This approach proved effective for voyages with relatively stable conditions and predictable factors.
Figure A1. Sensitivity analysis (a) by segmentation number, (b) by interpolation number.
Jmse 11 01234 g0a1aJmse 11 01234 g0a1b

References

  1. UNCTAD. Review of Maritime Transport 2021; UN: New York, NY, USA, 2021. [Google Scholar]
  2. Statista. International Seaborne Trade Carried by Container Ships from 1980 to 2020; Statista Inc.: Hamburg, Germany, 2021. [Google Scholar]
  3. Moorthy, R.; Teo, C.-P. Berth management in container terminal: The template design problem. OR Spectr. 2006, 28, 495–518. [Google Scholar] [CrossRef]
  4. Jahn, C.; Scheidweiler, T. Port Call Optimization by Estimating Ships’ Time of Arrival. In Dynamics in Logistics; Springer International Publishing: Cham, Switzerland, 2018; pp. 172–177. [Google Scholar]
  5. Park, H.J.; Cho, S.W.; Lee, C. Particle swarm optimization algorithm with time buffer insertion for robust berth scheduling. Comput. Ind. Eng. 2021, 160, 107585. [Google Scholar] [CrossRef]
  6. Carson-Jackson, J. Satellite AIS—Developing Technology or Existing Capability? J. Navig. 2012, 65, 303–321. [Google Scholar] [CrossRef] [Green Version]
  7. International Maritime Organization. Revised Guidelines for the Onboard Operational Use of Shipborne Automatic Identification Systems (AIS); IMO: London, UK, 2015. [Google Scholar]
  8. Dobrkovic, A.; Iacob, M.-E.; van Hillegersberg, J.; Mes, M.R.K.; Glandrup, M. Towards an Approach for Long Term AIS-Based Prediction of Vessel Arrival Times. In Logistics and Supply Chain Innovation: Bridging the Gap between Theory and Practice; Zijm, H., Klumpp, M., Clausen, U., Hompel, M.T., Eds.; Springer International Publishing: Cham, Switzerland, 2016; pp. 281–294. [Google Scholar] [CrossRef]
  9. Talavera, A.; Aguasca, R.; Galván, B.; Cacereño, A. Application of Dempster–Shafer theory for the quantification and propagation of the uncertainty caused by the use of AIS data. Reliab. Eng. Syst. Saf. 2013, 111, 95–105. [Google Scholar] [CrossRef]
  10. Wu, G.; Atilla, I.; Tahsin, T.; Terziev, M.; Wang, L. Long-voyage route planning method based on multi-scale visibility graph for autonomous ships. Ocean Eng. 2021, 219, 108242. [Google Scholar] [CrossRef]
  11. Li, L.; Wu, D.; Huang, Y.; Yuan, Z.-M. A path planning strategy unified with a COLREGS collision avoidance function based on deep reinforcement learning and artificial potential field. Appl. Ocean Res. 2021, 113, 102759. [Google Scholar] [CrossRef]
  12. Yang, D.; Wu, L.; Wang, S.; Jia, H.; Li, K.X. How big data enriches maritime research—A critical review of Automatic Identification System (AIS) data applications. Transp. Rev. 2019, 39, 755–773. [Google Scholar] [CrossRef]
  13. Pallotta, G.; Horn, S.; Braca, P.; Bryan, K. Context-enhanced vessel prediction based on Ornstein-Uhlenbeck processes using historical AIS traffic patterns: Real-world experimental results. In Proceedings of the 17th International Conference on Information Fusion (FUSION), Salamanca, Spain, 7–10 July 2014; pp. 1–7. [Google Scholar]
  14. Zhu, F. Mining ship spatial trajectory patterns from AIS database for maritime surveillance. In Proceedings of the 2nd IEEE International Conference on Emergency Management and Management Sciences, Beijing, China, 10 August 2011; pp. 772–775. [Google Scholar]
  15. Hyeonho, K.H.B. Prediction of vessel arrival time using auto identification system data. Int. J. Innov. Comput. Inf. Control 2021, 17, 725–734. [Google Scholar] [CrossRef]
  16. Bai, X.; Cheng, L.; Iris, Ç. Data-driven financial and operational risk management: Empirical evidence from the global tramp shipping industry. Transp. Res. Part E Logist. Transp. Rev. 2022, 158, 102617. [Google Scholar] [CrossRef]
  17. Jia, H.; Adland, R.; Prakash, V.; Smith, T. Energy efficiency with the application of Virtual Arrival policy. Transp. Res. Part D Transp. Environ. 2017, 54, 50–60. [Google Scholar] [CrossRef]
  18. GEF-UNDP-IMO GloMEEP Project and Members of the GIA Just in Time Arrival Guide—Barriers and Potential Solutions. Available online: https://wwwcdn.imo.org/localresources/en/OurWork/PartnershipsProjects/Documents/GIA-just-in-time-hires.pdf (accessed on 30 May 2023).
  19. DCSA. Just-in-Time Port Call. Available online: https://dcsa.org/standards/jit-port-call/ (accessed on 30 May 2023).
  20. Yu, J.; Voß, S. Towards Just-In-Time Arrival for Container Ships by the Integration of Prediction Models. In Proceedings of the 56th Hawaii International Conference on System Sciences, Maui, HI, USA, 3–6 January 2023. [Google Scholar]
  21. Du, Y.; Chen, Q.; Lam, J.S.L.; Xu, Y.; Cao, J.X. Modeling the Impacts of Tides and the Virtual Arrival Policy in Berth Allocation. Transp. Sci. 2015, 49, 939–956. [Google Scholar] [CrossRef]
  22. Iris, Ç.; Pacino, D.; Ropke, S.; Larsen, A. Integrated Berth Allocation and Quay Crane Assignment Problem: Set partitioning models and computational results. Transp. Res. Part E Logist. Transp. Rev. 2015, 81, 75–97. [Google Scholar] [CrossRef] [Green Version]
  23. El Mekkaoui, S.; Benabbou, L.; Berrado, A. Deep learning models for vessel’s ETA prediction: Bulk ports perspective. Flex. Serv. Manuf. J. 2023, 35, 5–28. [Google Scholar] [CrossRef]
  24. Fancello, G.; Pani, C.; Pisano, M.; Serra, P.; Zuddas, P.; Fadda, P. Prediction of arrival times and human resources allocation for container terminal. Marit. Econ. Logist. 2011, 13, 142–173. [Google Scholar] [CrossRef]
  25. Pani, C.; Fadda, P.; Fancello, G.; Frigau, L.; Mola, F. A Data mining approach to forecast late arrivals in a transhipment container terminal. Transport 2014, 29, 175–184. [Google Scholar] [CrossRef] [Green Version]
  26. Pani, C.; Vanelslander, T.; Fancello, G.; Cannas, M. Prediction of late/early arrivals in container terminals—A qualitative approach. Eur. J. Transp. Infrastruct. Res. 2015, 15, 536–550. [Google Scholar] [CrossRef]
  27. Kim, S.; Kim, H.; Park, Y. Early detection of vessel delays using combined historical and real-time information. J. Oper. Res. Soc. 2017, 68, 182–191. [Google Scholar] [CrossRef]
  28. Wu, X.; Roy, U.; Hamidi, M.; Craig, B.N. Estimate travel time of ships in narrow channel based on AIS data. Ocean Eng. 2020, 202, 106790. [Google Scholar] [CrossRef]
  29. Harati-Mokhtari, A.; Wall, A.; Brooks, P.; Wang, J. Automatic Identification System (AIS): Data Reliability and Human Error Implications. J. Navig. 2007, 60, 373–389. [Google Scholar] [CrossRef]
  30. Min, H.; Ahn, S.-B.; Lee, H.-S.; Park, H. An integrated terminal operating system for enhancing the efficiency of seaport terminal operators. Marit. Econ. Logist. 2017, 19, 428–450. [Google Scholar] [CrossRef]
  31. Venturini, G.; Iris, Ç.; Kontovas, C.A.; Larsen, A. The multi-port berth allocation problem with speed optimization and emission considerations. Transp. Res. Part D Transp. Environ. 2017, 54, 142–159. [Google Scholar] [CrossRef] [Green Version]
  32. Hintzen, N.T.; Piet, G.J.; Brunel, T. Improved estimation of trawling tracks using cubic Hermite spline interpolation of position registration data. Fish. Res. 2010, 101, 108–115. [Google Scholar] [CrossRef]
  33. Willmott, C.J.; Matsuura, K. Advantages of the mean absolute error (MAE) over the root mean square error (RMSE) in assessing average model performance. Clim. Res. 2005, 30, 79–82. [Google Scholar] [CrossRef]
Figure 1. Map overview of the container terminal testbed located in Busan New Port.
Jmse 11 01234 g001
Figure 2. Schematic diagram for overall research.
Jmse 11 01234 g002
Figure 3. (a) Previous ports worldwide, (b) previous ports in the East Asia region.
Jmse 11 01234 g003
Figure 4. ATD location polygon for previous ports (in mustard color) (a) northern China (Tianjin and Qingdao), (b) eastern coast China (Ningbo and Zhoushan), (c) east Japan (Yokohama), (d) Japan Kyushu (Hakata), (e) South China Sea (Tanjung Malaysia and Singapore). Mentioning specific names of terminals is avoided.
Jmse 11 01234 g004
Figure 5. Heading angle criteria polar plot by previous port.
Jmse 11 01234 g005
Figure 6. ATA polygon (in mustard color) of Busan New Port anchorage and Pilot Boarding Place.
Jmse 11 01234 g006
Figure 7. Graphical image of segmentation in the representative path.
Jmse 11 01234 g007
Figure 8. (a) Three processed voyages of v i from port of Tianjin. (b) Representative path of v i from port of Tianjin.
Jmse 11 01234 g008
Figure 9. (a) ATD area of representative path of Figure 8b. (b) ATA area of representative path of Figure 8b.
Jmse 11 01234 g009
Figure 10. Modeling MAE comparison plot for voyage 2022_6 of Vessel V015.
Jmse 11 01234 g010
Figure 11. Evaluation MAE comparison plot for voyage 2023_1 of Vessel V010.
Jmse 11 01234 g011
Table 1. AIS data sent by ship [7].
StaticDynamicVoyage-RelatedSafety-Related
MMSI 1Vessel positionDraughtShort safety-related messages
Call-SignPosition TimestampDestination
NameCOG 2ETA
IMO No.SOG 3
Length and beamHeading
Vessel typeNavigational status 4
1 Maritime Mobile Service Identity; 2 Course Over Ground; 3 Speed Over Ground; 4 e.g., ‘underway by engines’, ‘at anchor’, ‘moored’….
Table 2. S-AIS raw data sample.
FieldValue
MMSI(concealed)
imo(concealed)
callsign(concealed)
vessel_name(concealed)
type_info(code: 70,
description: ‘Cargo, all ships of this type’)
dimension_info(a:18, b:181, c:12, d:20)
voyage_info(eta: ‘09211045′,
max_draught: 10.0,
destination: ‘SADMM’,
navigation_info: (code: 0, description: ‘under way using engine’},
received: ‘2022-09-13T04:30:38Z’)
Position_info(‘lat’: 17.2595,
‘lon’: 72.4836,
‘turn’: 44.0,
‘speed’: 12.2,
‘course’: 196.1,
‘true_heading’: 140,
‘received’: 2022-09-13T04:35:58Z’),
API call Timestamp2022-09-13 04:41:10 GMT+9
Specific information about the ship is concealed.
Table 3. Ship arrival and departure declaration history data sample.
Port NameCallsignVessel NameCall YearSer No.Gross TonnagePort in TimePort out TimeCIQ TimeBerth PlacePrevious PortNext PortVessel Type
Busan(concealed)V01020221240,4472023-03-30 03:222023-04-01 01:002023-03-30 03:22Gam-man pier Berth 3TIANJIN XINGANG PTTIANJIN XINGANG PTFull Container
Specific information about the ship is concealed.
Table 4. Data gathering specifics.
For ModelingFor Evaluation
Collecting period20 September 2022~13 January 2023 (app’ 4 months)14 January 2023~14 March 2023
(2 months)
API call intervalEvery 5 min
Data formatComma-separated values (csv)
Voyages15736
Vessels8127
Table 5. Target vessel principal particulars.
Vessel CodeMMSIIMOTypeGross TonnageLOA
(m)
Breath
(m)
Year BuiltCapacity
1V001(concealed)(concealed)Full Container54,214294.0632.220045060
2V002(concealed)(concealed)93,685299.948.220149300
3V003(concealed)(concealed)113,04233748.3201510,000
79V079(concealed)(concealed)93,685299.948.220159300
80V080(concealed)(concealed)153,115365.7951.3201114,000
81V081(concealed)(concealed)113,04233748.31201510,000
Specific information about the ship is concealed.
Table 6. Previous port groups used in modeling.
RegionPrevious Ports
(Voyages Counted by Port)
Total Voyages Counted
Northern coast, ChinaQINGDAO (34),
TIANJIN (37)
71
Eastern coast, ChinaNINGBO (31),
ZHOUSHAN (10)
41
South China SeaSINGAPORE (14),
TANJUNG, Malaysia (4)
18
Southern Japan (Kyushu)HAKATA (19)19
Eastern Japan (Honshu)YOKOHAMA (13)13
Table 7. Heading angle criteria boundary by previous port.
PortMin HeadingMax Heading
Yokohama149.9°232.7°
Hakata285.3°311.2°
Ningbo43°129.25°
Zhoushan72.7°121°
Singapore39.4°183.3°
Tanjung Pelepas171.8°183.4°
Qingdao84.7°123.2°
Tianjin93.2°121.2°
Table 8. Representative path sample using spline interpolation.
LongitudeLatitudeSOG
1117.963338.9259311
2117.968338.9252511.00596
3117.973138.9245811.01029
10,998128.863734.914067.276178
10,999128.863834.914967.302102
11,000128.863834.915837.333333
Table 9. Overall MAE by modeling and evaluation.
PeriodPredicted ETA MAEAIS ETA MAETOS ETA MAE
Modeling4 months0 days 03:14:480 days 16:37:110 days 05:15:57
Evaluation2 months0 days 07:26:470 days 20:35:030 days 21:44:20
Table 10. Optimal parameter result.
Previous PortVessel CodeVoyage NumberOptimal
Interpolation
Optimal
Segment
MAE
1YokohamaV004V004_2022_511,0001000 days 00:39:12.
2TianjinV018V018_2022_79000900 days 01:43:19
3TianjinV019V019_2022_620001000 days 00:48:53
110QingdaoV010V010_2022_611,0001100 days 02:51:28
114SingaporeV060V060_2022_611,000900 days 03:25:00
115ZhoushanV052V052_2022_111,0001100 days 02:49:29
Table 11. Comparison of the effectiveness of modeling voyage number on performance results.
Vessel NameModeling Voyage NumberEvaluation Result
M A E p r e d   T o t a l M A E T O S   T o t a l M A E A I S   T o t a l
1V063110 days 03:11:590 days 09:59:130 days 10:51:18
2V05110 days 10:40:370 days 23:24:390 days 10:11:52
3V02620 days 08:57:231 days 09:52:000 days 12:19:02
Disclaimer/Publisher’s Note: The statements, opinions and data contained in all publications are solely those of the individual author(s) and contributor(s) and not of MDPI and/or the editor(s). MDPI and/or the editor(s) disclaim responsibility for any injury to people or property resulting from any ideas, methods, instructions or products referred to in the content.

