
Performance of a Propeller Coated with Hydrophobic Material


1
School of Mechanical Engineering, Hangzhou Dianzi University, Hangzhou 310018, China
2
Ocean College, Zhejiang University, Zhoushan 316021, China
*
Author to whom correspondence should be addressed.
J. Mar. Sci. Eng. 2022, 10(2), 236; https://doi.org/10.3390/jmse10020236
Submission received: 5 January 2022
/
Revised: 2 February 2022
/
Accepted: 7 February 2022
/
Published: 10 February 2022
(This article belongs to the Section Ocean Engineering)
Abstract
:Computational and experimental methods were used to study a propeller coated with hydrophobic material and a propeller with a conventional surface for comparison. In CFD simulations, the blade surface mesh was arranged in a way to set non-slip or free slip wall boundary conditions with different proportions to define the level of surface slip. The conventional and the hydrophobic material propellers defined by different surface slip rates were simulated under different advance speed coefficients and different rotational speeds. Propeller performance results, blade pressure, and the Liutex vorticity distribution were studied. An experimental platform was established to study the velocity field around the propeller using a Particle Image Velocimetry (PIV) device. The CFD calculation results were compared with the PIV results. It was found that the calculation results using a 75% surface slip rate were closer to the experimental results. The calculation results show that the propeller coated with hydrophobic material has improved thrust and efficiency compared with the propeller with conventional material. The hydrophobic material can significantly reduce the low-speed region downstream of the propeller hub. The hub and the tip vortices shown by the Liutex are also significantly reduced. Those changes help to improve the propulsion efficiency.
1. Introduction
As one of the most important propulsion devices of ships, propellers are extensively studied by many researchers for different scenarios. For example, Knight and Maki [1] developed a semi-empirical body-force model to utilize existing CFD data of propellers for ship dynamics modelling. Wang et al. [2] performed experimental and numerical investigations on a propeller behind a submarine, which is near the free surface. Ebrahimi et al. [3] studied the influence of geometric parameters such as number of blades, propeller diameter, expanded area ratio, geometric pitch, forward tilt angle, and skew angle on noise, proposing a new algorithm that considers fluid dynamics and acoustics to optimize the design of the propeller. Kim and Leong [4] made a numerical prediction of a propeller’s open water performance, which was consistent with experimental data. Kapuria and Das [5] used SMA actuators, which produced enough twists to improve the hydrodynamic performance of full-scale ship propellers in a wide range of advance coefficients. Liu and Vanierschot [6] conducted comparative research on the hydrodynamic performances of the Rim-Driven thruster (RDT) and the Ducted Propeller (DP). The CFD results showed that the overall efficiency of the RDT was significantly lower than that of the ducted propeller. Cui et al. [7] studied velocity distribution and attenuation of the turbulence intensity in a twin-propeller jet and found that they were quite different from those of a single propeller. Lungu [8] studied the performance of propellers, which have axes not aligned with the horizontal direction. Lee et al. [9] conducted a study on selecting cavitation models for CFD prediction of propeller flows. They found that although the cavitation simulation had limitations, the simulation results of foam cavitation and sheet cavitation around the tip were good compared with experiment. Wei et al. [10] developed a numerical noise prediction method based on CFD results to predict the flow noise from a five-blade small submarine propeller. Helal et al. [11] improved the CFD turbulence model of flow on ship propellers.
In recent years, drag reduction using hydrophobic materials has become a research direction that has attracted much attention. Li et al. [12] developed a micro/nano-level superhydrophobic material to study the electrohydrodynamic behavior of water droplets on the hydrophobic surface. Taghvaei et al. [13] measured two superhydrophobic flat plates and found that the two hydrophobic plates had lower surface drag compared with that of a conventional material plate. Bullee et al. [14] combined a hydrophobic surface with air film injection technique to reduce hydrodynamic drag on a rotating cylinder surface. Lyu et al. [15] studied the friction reduction effect of a superhydrophilic and a superhydrophobic surfaces and found that, when Re < 200,000, the superhydrophobic plate had a significant friction reduction effect. Nouri et al. [16] computed the drag reduction effect of some superhydrophobic surfaces in turbulent flow channels by using a slip length concept in the wall shear stress expression. Wang et al. [17] conducted an extensive review of the current research on hydrodynamic drag reduction on surfaces with air injection or using a hydrophobic surface made by micro-surface caves filled with air.
So far, there has been very little research on applying hydrophobic coating to propellers. Choi et al. [18] used a commercial super-hydrophobic coating on the surface of a 42 mm diameter double-blade propeller and found that the super-hydrophobic coating could reduce the turbulent kinetic energy of the propeller’s wake by about 20%. Katsuno et al. [19] conducted CFD research on a super-hydrophobic coated propeller and used the concept of boundary layer slip length to simulate the effect of hydrophobic slip. The results showed that the propeller efficiency calculated by this boundary layer hydrophobic model did not increase significantly. Farkas et al. [20] analyzed the benefits of applying lower roughness antifouling coatings in terms of ship energy efficiency. Farkas et al. [21] also developed a method of using CFD simulations to show the impact of biofouling on the propeller performance and stressed the importance of antifouling application on propellers for ship energy savings.
In this paper, a concept of surface slip rate is used for setting surface boundary conditions in numerical simulation for flow of the propeller coated with a hydrophobic material. The results show that the hydrophobic material propeller can improve thrust and efficiency. The strength of the tip vortex and the hub vortex of the propellers coated with the hydrophobic material were significantly reduced. A reasonable value of the surface slip rate used in the calculation was determined by comparing calculated flow field with the measured flow field.
2. Numerical Simulation
2.1. The Propeller
The propeller studied is an outboard motor propeller. In order to allow measurement by Particle Image Velocimetry (PIV), the size of the original propeller model was reduced to 100 mm in diameter. The geometric parameters of the propeller are shown in Table 1.
The propeller geometry is shown in Figure 1.
2.2. Meshing and Boundary Conditions
The mesh near the propeller blades is shown in Figure 2. To achieve accurate results, structural grids were carefully generated around the surface of the blades. Surface mesh is dense at the edge of the blade, because large velocity and pressure gradients are formed around blade edges. The 3-D grid around the blades were extruded from the surface to make sure boundary layer flow was properly simulated.
ANSYS CFX was used in this study. The SST (shear stress transport) turbulence model was chosen. In the wall treatment of the boundary condition settings, a hydrophobic surface is assumed to be something between a non-slip wall and a free slip wall. The non-slip wall is defined as follows:
while the free slip wall is defined as follows:
where is the velocity on wall, is the normal velocity on wall, and is the wall shear stress.
To give a partially slippery wall condition for a propeller surface coated with the hydrophobic material, the blade surface mesh was divided into four regions (S1, S2, S3, and S4) periodically, as shown in Figure 3. By setting non-slip wall or free slip wall boundary conditions on those wall regions with different alternatives, a concept of “surface slip ratio” can be defined by the wall condition settings shown in Table 2.
In order to save computing resources for the propeller, which has rotational periodicity, a volume that had one third of a cylinder was selected as the computational domain, as shown in Figure 4. The computational domain is composed of an inner rotating domain and an outer stationary domain [22]. The radius of the stationary domain is 5D, where D is the nominal diameter of the propeller. The outlet boundary is 13D away from the propeller, while the inlet boundary is 5D away from the propeller. The radius of the rotating domain surrounding the propeller is 1.5D and its axial length is 0.5D.
3. Numerical Calculation Results and Analysis
3.1. Hydrodynamic Performance of the Propeller
The hydrodynamic performance of the propeller [23] can be expressed by the following non-dimensional parameters, namely the advance coefficient , the thrust coefficient , and the torque coefficient .
where is the speed of advance; is the thrust; is the torque; is the density of water; is the propeller’s rotating speed; and is the propeller diameter.
The efficiency expression is shown below.
For five different surface slip rates, the following 16 working conditions were set, as shown in Table 3. In total, 80 simulations were performed.
The propeller performance results are shown in Figure 5. Hydrodynamic parameters of the conventional propeller using non-slip wall condition and the propellers coated with the hydrophobic material using wall boundary conditions with different surface slip rates are compared.
By comparing the results of the propeller coated with the hydrophobic material with those of the conventional propeller in Figure 5, it can be found that the surface slip rate had a significant effect on propeller performance. When the surface slip rate was 25% or 50%, the thrust and torque were almost the same as those of the propeller with a non-slip wall. When the surface slip rate increased to 75%, the thrust and torque increased to an observable level. When the surface slip rate reached 100%, the thrust and torque increased significantly.
Looking at efficiency in Figure 5, and in Table 4, it can be seen that efficiency increased as the advance coefficient increased. Table 5 shows that the efficiency improvement caused by the hydrophobic effects also increased as the advance coefficient increased.
Table 5 shows that efficiency improvement changed in a complicated way as the surface slip rate increased. For example, at a large advance coefficient of 0.9, the efficiency improvement increased as the surface slip rate increased. However, this trend held true for the advance coefficient at 0.7 only when the rotational speed was 600 r/min or less. When the rotational speed was 900 r/min or more, the maximum improvement of efficiency occurred when the surface slip rate was 75%.
Table 5 also shows that the efficiency improvement increased as the rotational speed increased for most of the surface slip rates except for the 100% surface slip rate, where the efficiency improvement tended to drop when the rotational speed increased.
Although the propeller with a surface slip rate of 100% had the largest improvement in efficiency, the 100% surface slip rate cannot be achieved in practical hydrophobic surfaces. The PIV experiment at the end of this article shows that for the coating of polyvinylidene fluoride (PVDF) material, it is reasonable to assume 75% of the surface slip rate in the calculations.
Assuming a 75% surface slip rate and advance coefficient of 0.9, the CFD results showed that the propeller coated with a hydrophobic material can have an efficiency improvement of 2.74%, 3.88%, 4.42%, and 4.70% at rotational speed at 300, 600, 900, and 1200 r/min, respectively.
3.2. Analysis of the Results of Propeller Blade Pressure
In Figure 6, the pressure distributions of the conventional propeller and the propeller with a surface slip rate of 75% are compared. The rotational speed was 1200 r/min and the speed coefficient was 0.9 [24].
Comparing the pressure on both surfaces of the two propellers, the pressure distributions had no obvious difference.
To explore the subtle change of pressure distributions caused by the hydrophobic coating, the surface pressure values at five selected points shown in Figure 7 were examined on both pressure and suction surfaces. The results are listed in Table 6 and Table 7.
The Tables show that, except for sampling point 1, the pressure difference of the propeller coated with the hydrophobic material with a surface slip rate of 75% was larger than that of the conventional propeller, indicating that the thrust of the propeller coated with the hydrophobic material with a surface slip rate of 75% was larger than that of the conventional propeller.
3.3. Analysis of Propeller Wake and Vortex
The computed results of the conventional propeller and the propeller coated with the hydrophobic material with a surface slip rate of 75% were further postprocessed to show the vorticity defined by the Liutex [25]. The working conditions of = 0.9 and = 1200 r/min were selected. The vorticity of the Liutex = 70 rad/s was used as the iso-surface to observe the tip vortices and wake vortices. The results are shown in Figure 8.
It is well known that the stronger the tip vortex and wake vortex of the propeller are, the more energy the propeller loses in the wake, causing a reduced efficiency [26]. Figure 8 shows the wake vortex and tip vortex strengths behind the propeller coated with the hydrophobic material were reduced, implying that the propeller with the hydrophobic coating has a better efficiency.
4. Experimental Study
4.1. Test Propellers
The propeller models selected in the experiment are shown in Figure 9. The models were 3D-printed from 8200 resin. The coating of the hydrophobic propeller model was polyvinylidene fluoride (PVDF) dissolved in dimethylformamide.
4.2. Experimental Platform and Experimental Method
The experimental platform shown in Figure 10 and Figure 11 was used to measure the flow characteristics of the propellers. The platform was mainly composed of a circulating tank, a honeycomb filter plate, a propeller, an outboard motor with an adjustable DC power supply, and a Particle Image Velocimetry system (PIV) [27,28]. The tank was mainly made of plexiglass material, with a size of 2100 mm × 420 mm × 500 mm. A honeycomb filter plate was installed to make a uniform water flow.
The PIV test system’s image capturing area was 200 mm × 200 mm. The capturing area was on a laser light sheet parallel to the central axis of the propeller. The rotational speed of the propeller was controlled by an adjustable DC power supply and measured by an optical rotation meter. The velocity field of the trace particles was taken by a camera and postprocessed by the PIV system.
4.3. Experimental Results and Analysis
Taking the working condition where the propeller speed was 1200 r/min and the speed coefficient was 0, the PIV was used to test and compare the velocity fields of the conventional propeller and the hydrophobic material propeller. The results are shown in Figure 12.
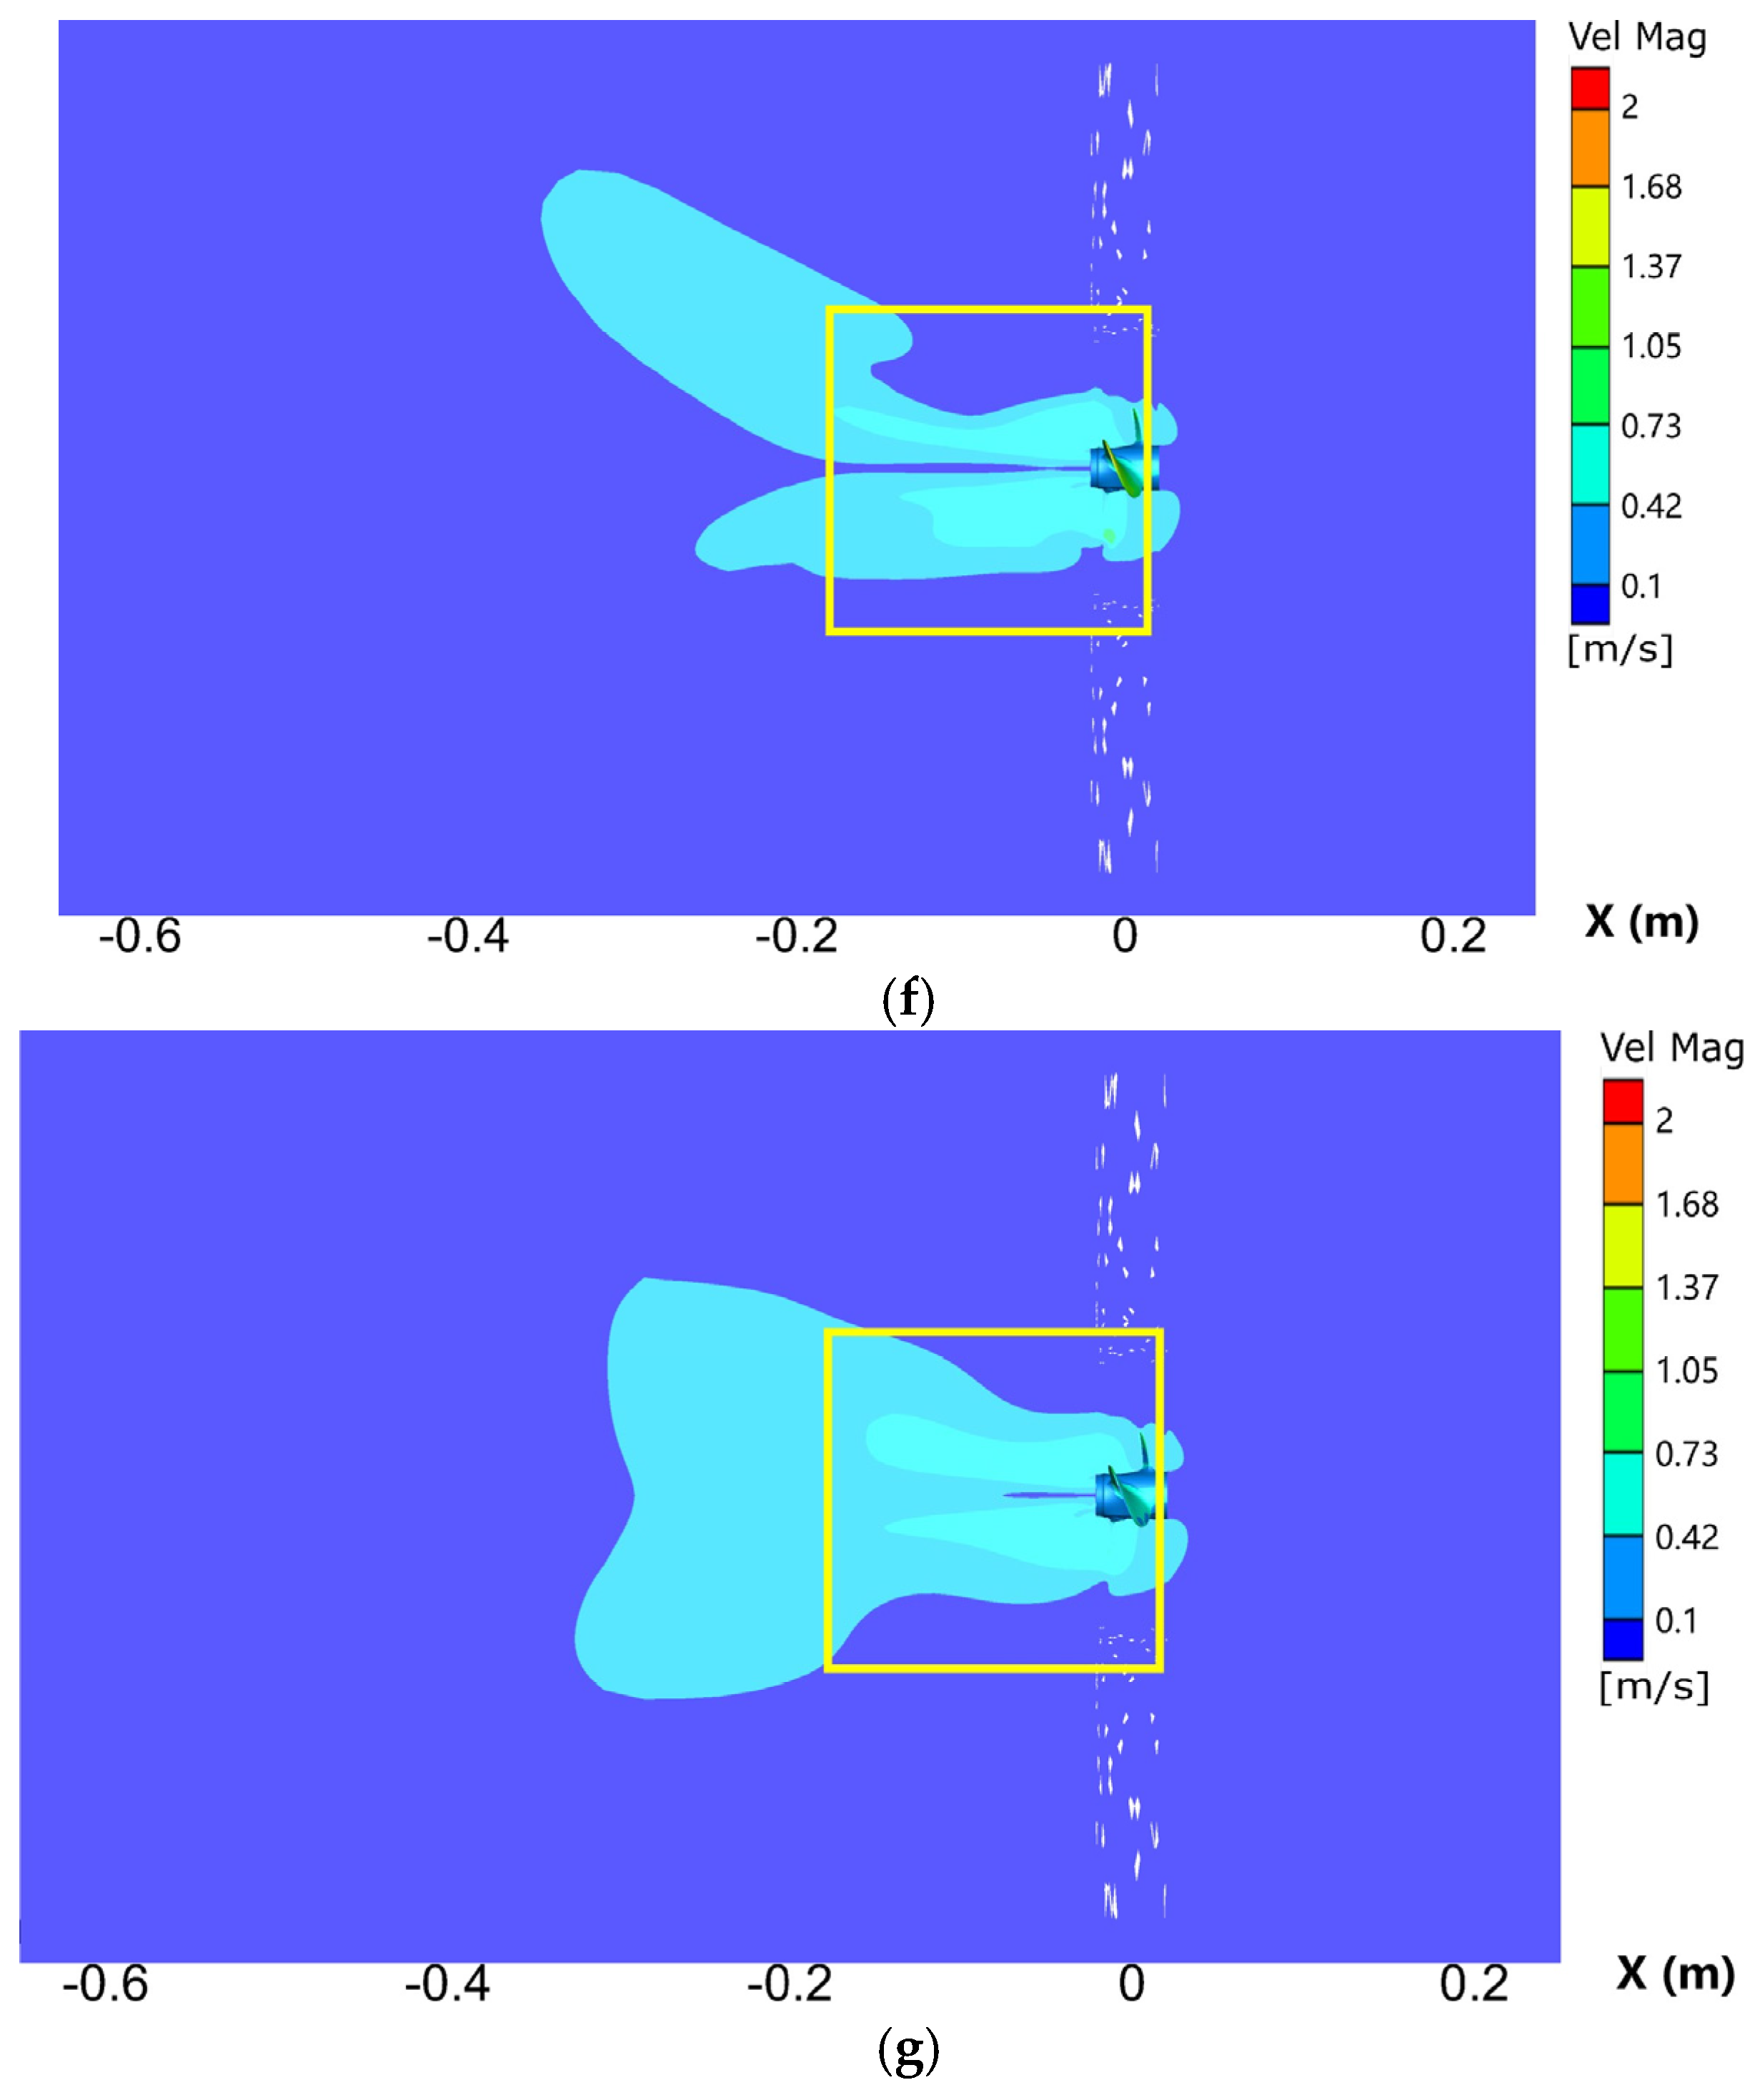
Figure 12 shows the velocity magnitude on the plane located at the rotating axis of the propellers. For the conventional propeller, both the PIV result in Figure 12a and CFD result in Figure 12b show that there was a significant low-speed wake region downstream of the propeller hub represented by the dark blue color, which extends from the propeller hub to the surrounding low speed region. However, for the propeller coated with the hydrophobic material, both the PIV result shown in Figure 12c and CFD result assuming a 75% slip rate shown in Figure 12d show clearly a shortened low-speed region downstream of the propeller hub, represented by the dark blue region with a length of about 0.15 m, on the left part of the propeller hub. The CFD results, assuming a 25% surface slip rate shown in Figure 12e and a 50% surface slip rate shown in Figure 12f, show that the low-speed region behind the hub has not been shortened, extending into the surrounding low speed region with a pattern similar to the flow of the conventional propeller. Figure 12g shows the CFD results assuming a 100% surface slip rate, indicating that the low-speed region downstream of the propeller hub disappears within a very short distance, represented by the dark blue area with a length of only about 0.07 m behind propeller hub. Based on the above mentioned comparisons, the CFD result assuming 75% surface slip rate was the closest to the experimental result of the propeller coated with the hydrophobic material.
In Figure 12, the PIV velocity fields were more symmetrical than CFD results. That can be explained as a so-called frozen-rotor interface was used to describe the interface condition between rotor domain and surrounding stationary domain, so the “frozen” propeller had an influence on flow field symmetry. Since the propeller was a three-blade one, the propeller’s influence on flow in the cutting plane of Figure 12 was asymmetrical.
5. Conclusions
- (1)
- Comparing the CFD results of the conventional propeller and the propellers coated with the hydrophobic material assuming different surface slip rates, it can be concluded that the propellers coated with the hydrophobic material were more efficient. The increased efficiency of the propellers coated with the hydrophobic material was dependent on the surface slip rate, advance coefficient, and rotational speed. For most of the situations, efficiency improvement increased as the surface slip rate, advance coefficient, and rotational speed increased.
- (2)
- The comparisons of the PIV experiment results and CFD numerical simulation results showed that the calculated flow field of the propeller with a surface slip rate of 75% was closer to the test results of the propeller coated with the PVDF dimethylformamide solvent. The results showed that the propeller coated with the hydrophobic material reduced the size of the low-speed wake zone behind the hub.
- (3)
- Blade surface pressure distributions showed that the pressure difference between the pressure surface and suction surface of the propellers coated with the hydrophobic material was larger than that of the conventional propeller, helping to increase the thrust of the propeller.
- (4)
- Compared with the conventional propellers, the strength of the tip vortex and the hub vortex of the propellers coated with the hydrophobic material were significantly reduced.
- (5)
- The CFD results showed that the propeller coated with hydrophobic propeller increased its thrust and efficiency. This finding was not reported within our literature search. Using the surface boundary condition of non-slip and free slip boundary conditions at different parts of the surface area with different area proportions defined as different surface slip rates is a novel method to use CFD software to study flow with hydrophobic walls.
- (6)
- New wall models could be developed for wall boundary conditions suited for walls coated with hydrophobic materials. Since there exist many types of hydrophobic materials, the future development in this topic is quite open. Another obvious future task is to produce a large propeller coated with hydrophobic materials to measure its hydrodynamic performance.
Author Contributions
Conceptualization, H.P.; methodology, X.T. and E.T.; software, H.P. and R.Z.; validation, H.P., X.T. and R.Z.; formal analysis, M.L.; investigation, R.Z.; resources, X.T.; data curation, R.Z.; writing—original draft preparation, H.P. and R.Z.; writing—review and editing, Z.Z. and X.T.; visualization, R.Z.; supervision, Z.Z.; project administration, X.T.; funding acquisition, Z.Z. All authors have read and agreed to the published version of the manuscript.
Funding
This research was funded by the Zhejiang Province Key R&D Program (grant number 2018C04002 and 2021C03013), and by Basic Scientific Research Operation Fund for Universities in Zhejiang Province (grant number GK199900299012-026).
Institutional Review Board Statement
Not applicable.
Informed Consent Statement
Not applicable.
Data Availability Statement
Not applicable.
Conflicts of Interest
The authors declare no conflict of interest.
References
- Knight, B.G.; Maki, K.J. A semi-empirical multi-degree of freedom body force propeller model. Ocean. Eng. 2019, 178, 270–282. [Google Scholar] [CrossRef]
- Wang, L.; Martin, J.E.; Felli, M.; Carrica, P.M. Experiments and CFD for the propeller wake of a generic submarine operating near the surface. Ocean. Eng. 2020, 206, 107304. [Google Scholar] [CrossRef]
- Ebrahimi, A.; Razaghian, A.H.; Seif, M.S.; Zahedi, F.; Nouri-Borujerdi, A. A comprehensive study on noise reduction methods of marine propellers and design procedures. Appl. Acoust. 2019, 150, 55–69. [Google Scholar] [CrossRef]
- Kim, H.; Leong, Z.Q. Numerical testing and verification of a marine propeller operating in a uniform flow field. Ships Offshore Struct. 2021, 162, 120–126. [Google Scholar] [CrossRef]
- Kapuria, S.; Das, H.N. Improving hydrodynamic efficiency of composite marine propellers in off-design conditions using shape memory alloy composite actuators. Ocean. Eng. 2018, 168, 185–203. [Google Scholar] [CrossRef]
- Liu, B.; Vanierschot, M. Numerical study of the hydrodynamic characteristics comparison between a ducted propeller and a rim-driven thruster. Appl. Sci. 2021, 11, 4919. [Google Scholar] [CrossRef]
- Cui, Y.; Lam, W.H.; Puay, H.T.; Ibrahim, M.S.; Robinson, D.; Hamill, G. Component velocities and turbulence intensities within ship twin-propeller jet using CFD and ADV. J. Mar. Sci. Eng. 2020, 8, 1025. [Google Scholar] [CrossRef]
- Lungu, A. Hydrodynamic loads and wake dynamics of a propeller working in oblique flow. In Proceedings of the ModTech International Conference-Modern Technologies in Industrial Engineering VIII, Iasi, Romania, 23–27 June 2020. [Google Scholar]
- Lee, I.; Park, S.; Seok, W.; Rhee, S.H. A study on the cavitation model for the cavitating flow analysis around the marine propeller. Math. Probl. Eng. 2021, 2021. [Google Scholar] [CrossRef]
- Wei, Y.; Wang, Y.; Ding, K.; Fu, J. Submarine underwater structure-borne noise and flow noise due to propeller exitation. Acoust. Aust. 2012, 402, 122–127. [Google Scholar]
- Helal, M.M.; Ahmed, T.M.; Banawan, A.A.; Kotb, M.A. Numerical prediction of the performance of marine propellers using computational fluid dynamics simulation with transition-sensitive turbulence model. Proc. Inst. Mech. Eng. Part M J. Eng. Marit. Environ. 2019, 2332, 515–527. [Google Scholar] [CrossRef]
- Li, J.; Wei, Y.; Huang, Z.; Wang, F.; Yan, X.; Wu, Z. Electrohydrodynamic behavior of water droplets on a horizontal super hydrophobic surface and its self-cleaning application. Appl. Surf. Sci. 2017, 403, 133–140. [Google Scholar] [CrossRef] [Green Version]
- Taghvaei, E.; Moosavi, A.; Nouri-Borujerdi, A.; Daeian, M.; Vafaeinejad, S. Superhydrophobic surfaces with a dual-layer micro-and nanoparticle coating for drag reduction. Energy 2017, 125, 1–10. [Google Scholar] [CrossRef]
- Bullee, P.A.; Verschoof, R.A.; Bakhuis, D.; Huisman, S.G.; Sun, C.; Lammertink, R.G.; Lohse, D. Bubbly drag reduction using a hydrophobic inner cylinder in Taylor–Couette turbulence. J. Fluid Mech. 2020, 883. [Google Scholar] [CrossRef] [Green Version]
- Lyu, S.; Nguyen, D.C.; Kim, D.; Hwang, W.; Yoon, B. Experimental drag reduction study of super-hydrophobic surface with dual-scale structures. Appl. Surf. Sci. 2013, 286, 206–211. [Google Scholar] [CrossRef]
- Nouri, N.M.; Sekhavat, S.; Mofidi, A. Drag reduction in a turbulent channel flow with hydrophobic wall. J. Hydrodyn. Ser. B 2012, 243, 458–466. [Google Scholar] [CrossRef]
- Wang, J.; Wang, B.; Chen, D. Underwater drag reduction by gas. Friction 2014, 24, 295–309. [Google Scholar] [CrossRef] [Green Version]
- Choi, H.; Lee, J.; Park, H. Wake structures behind a rotor with superhydrophobic-coated blades at low Reynolds number. Phys. Fluids 2019, 311, 015102. [Google Scholar] [CrossRef]
- Katsuno, E.T.; Dozzi Dantas, J.L.; Nelli Silva, E.C. Analysis of hydrophobic painting in model-scale marine propeller. In Proceedings of the Offshore Mechanics and Arctic Engineering, Madrid, Spain, 17–22 June 2018. [Google Scholar]
- Farkas, A.; Degiuli, N.; Martić, I.; Vujanović, M. Greenhouse gas emissions reduction potential by using antifouling coatings in a maritime transport industry. J. Clean. Prod. 2021, 295, 126428. [Google Scholar] [CrossRef]
- Farkas, A.; Degiuli, N.; Martić, I. The impact of biofouling on the propeller performance. Ocean. Eng. 2021, 219, 108376. [Google Scholar] [CrossRef]
- Sung, H.-G.; Jeong, K.; Heo, J. Performance characteristics of a pintle nozzle using the conformal sliding mesh technique. Aerosp. Sci. Technol. 2017, 61, 85–94. [Google Scholar] [CrossRef]
- Cai, R.-Q.; Chen, F.-M.; Feng, X.-M. Calculation and analysis of the open water performance of propeller by CFD software Fluent. Chuanbo Lixue (J. Ship Mech.) 2006, 105, 41–48. [Google Scholar]
- Yeo, K.B.; Choong, W.H.; Hau, W.Y. Prediction of propeller blade stress distribution through FEA. Appl. Sci 2014, 14, 3054. [Google Scholar]
- Liu, C.; Gao, Y.-S.; Dong, X.-R.; Wang, Y.-Q.; Liu, J.-M.; Zhang, Y.-N.; Cai, X.-S.; Gui, N. Third generation of vortex identification methods: Omega and Liutex/Rortex based systems. J. Hydrodyn. 2019, 312, 205–223. [Google Scholar] [CrossRef]
- Hu, J.; Wang, Y.; Zhang, W.; Chang, X.; Zhao, W. Tip vortex prediction for contra-rotating propeller using large eddy simulation. Ocean. Eng. 2019, 194, 106410. [Google Scholar] [CrossRef]
- Ragni, D.; Van Oudheusden, B.; Scarano, F. 3D pressure imaging of an aircraft propeller blade-tip flow by phase-locked stereoscopic PIV. Exp. Fluids 2012, 522, 463–477. [Google Scholar] [CrossRef] [Green Version]
- Li, G.; Chen, Q.; Liu, Y. Experimental study on dynamic structure of propeller tip vortex. Pol. Marit. Res. 2020, 27, 11–18. [Google Scholar] [CrossRef]
Figure 1.
Propeller geometry.
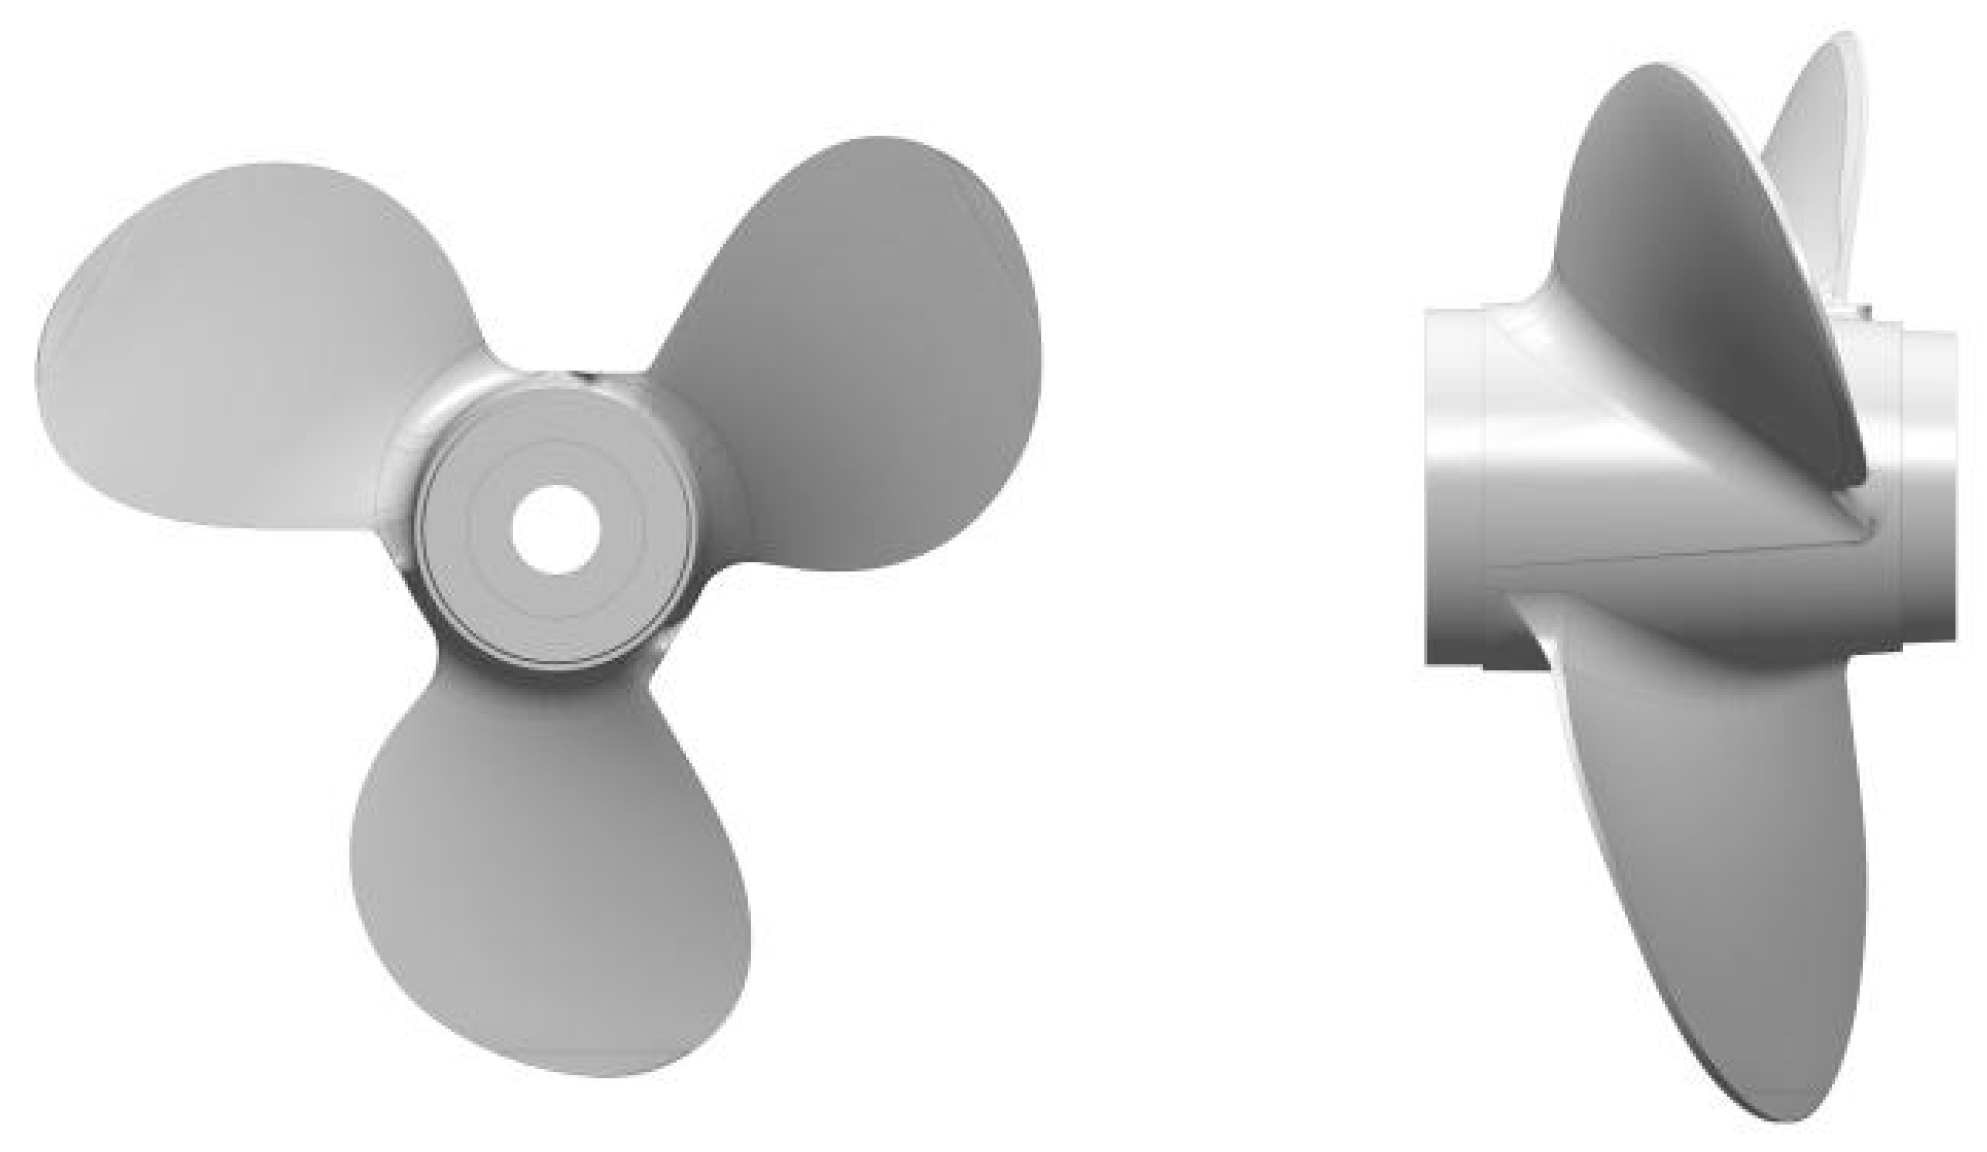
Figure 2.
Propeller grid. (a) Front view, (b) side view.

Figure 3.
Surface wall regions.
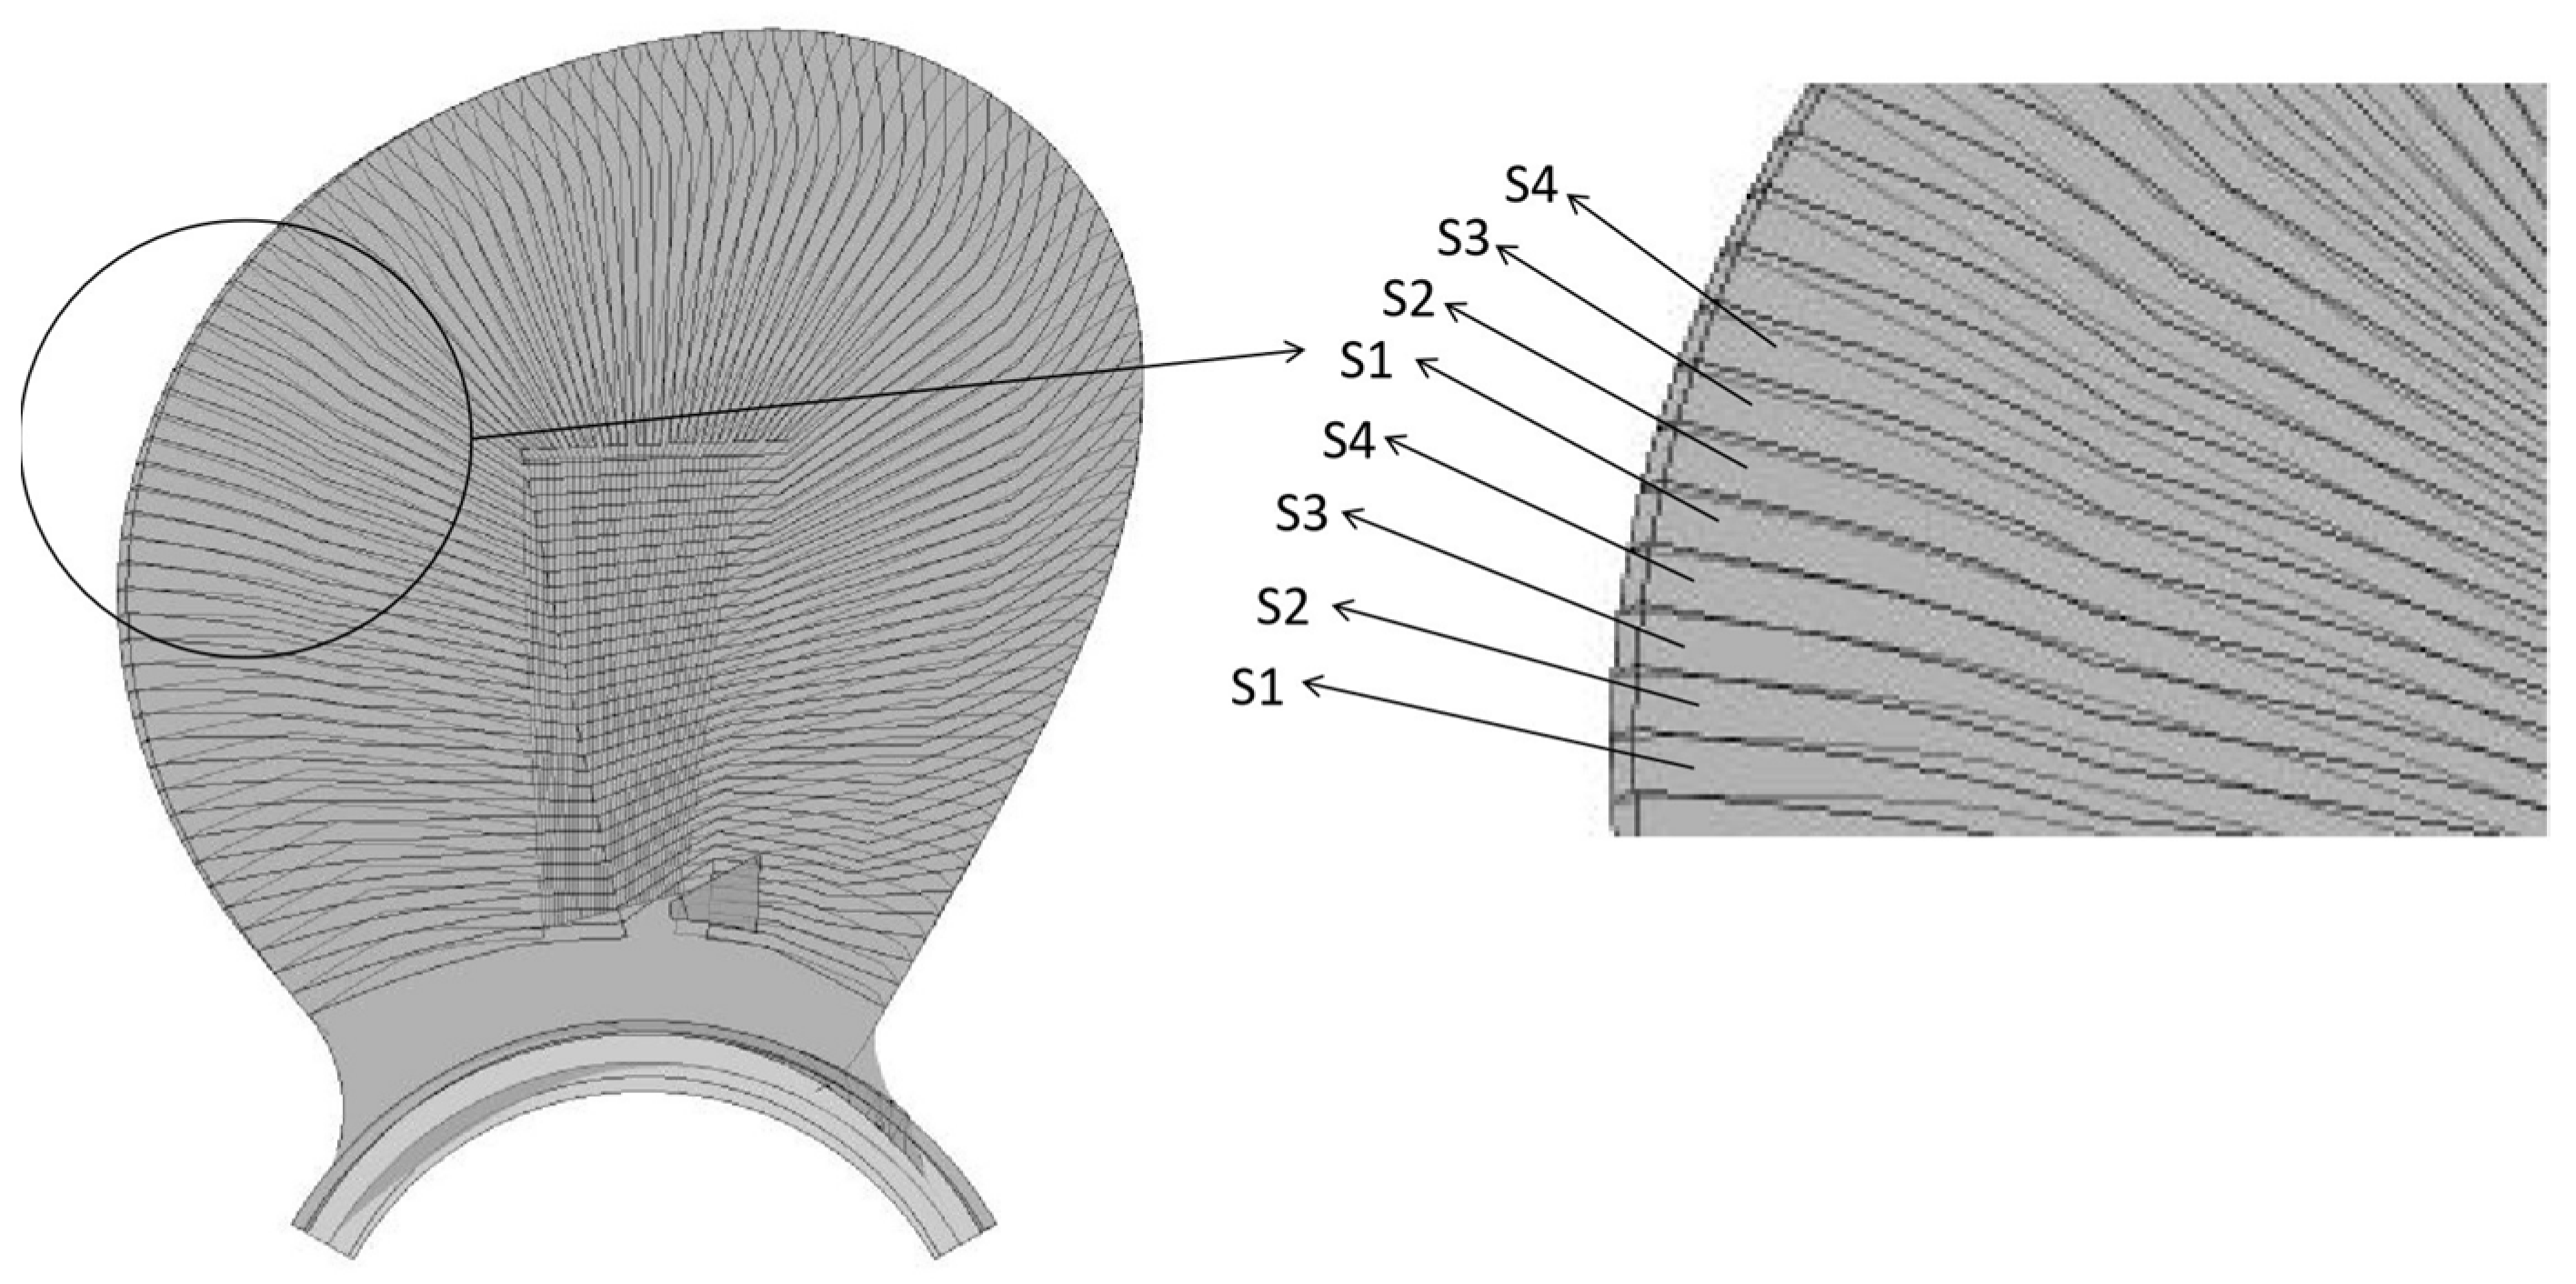
Figure 4.
Schematic diagram of computational domain.
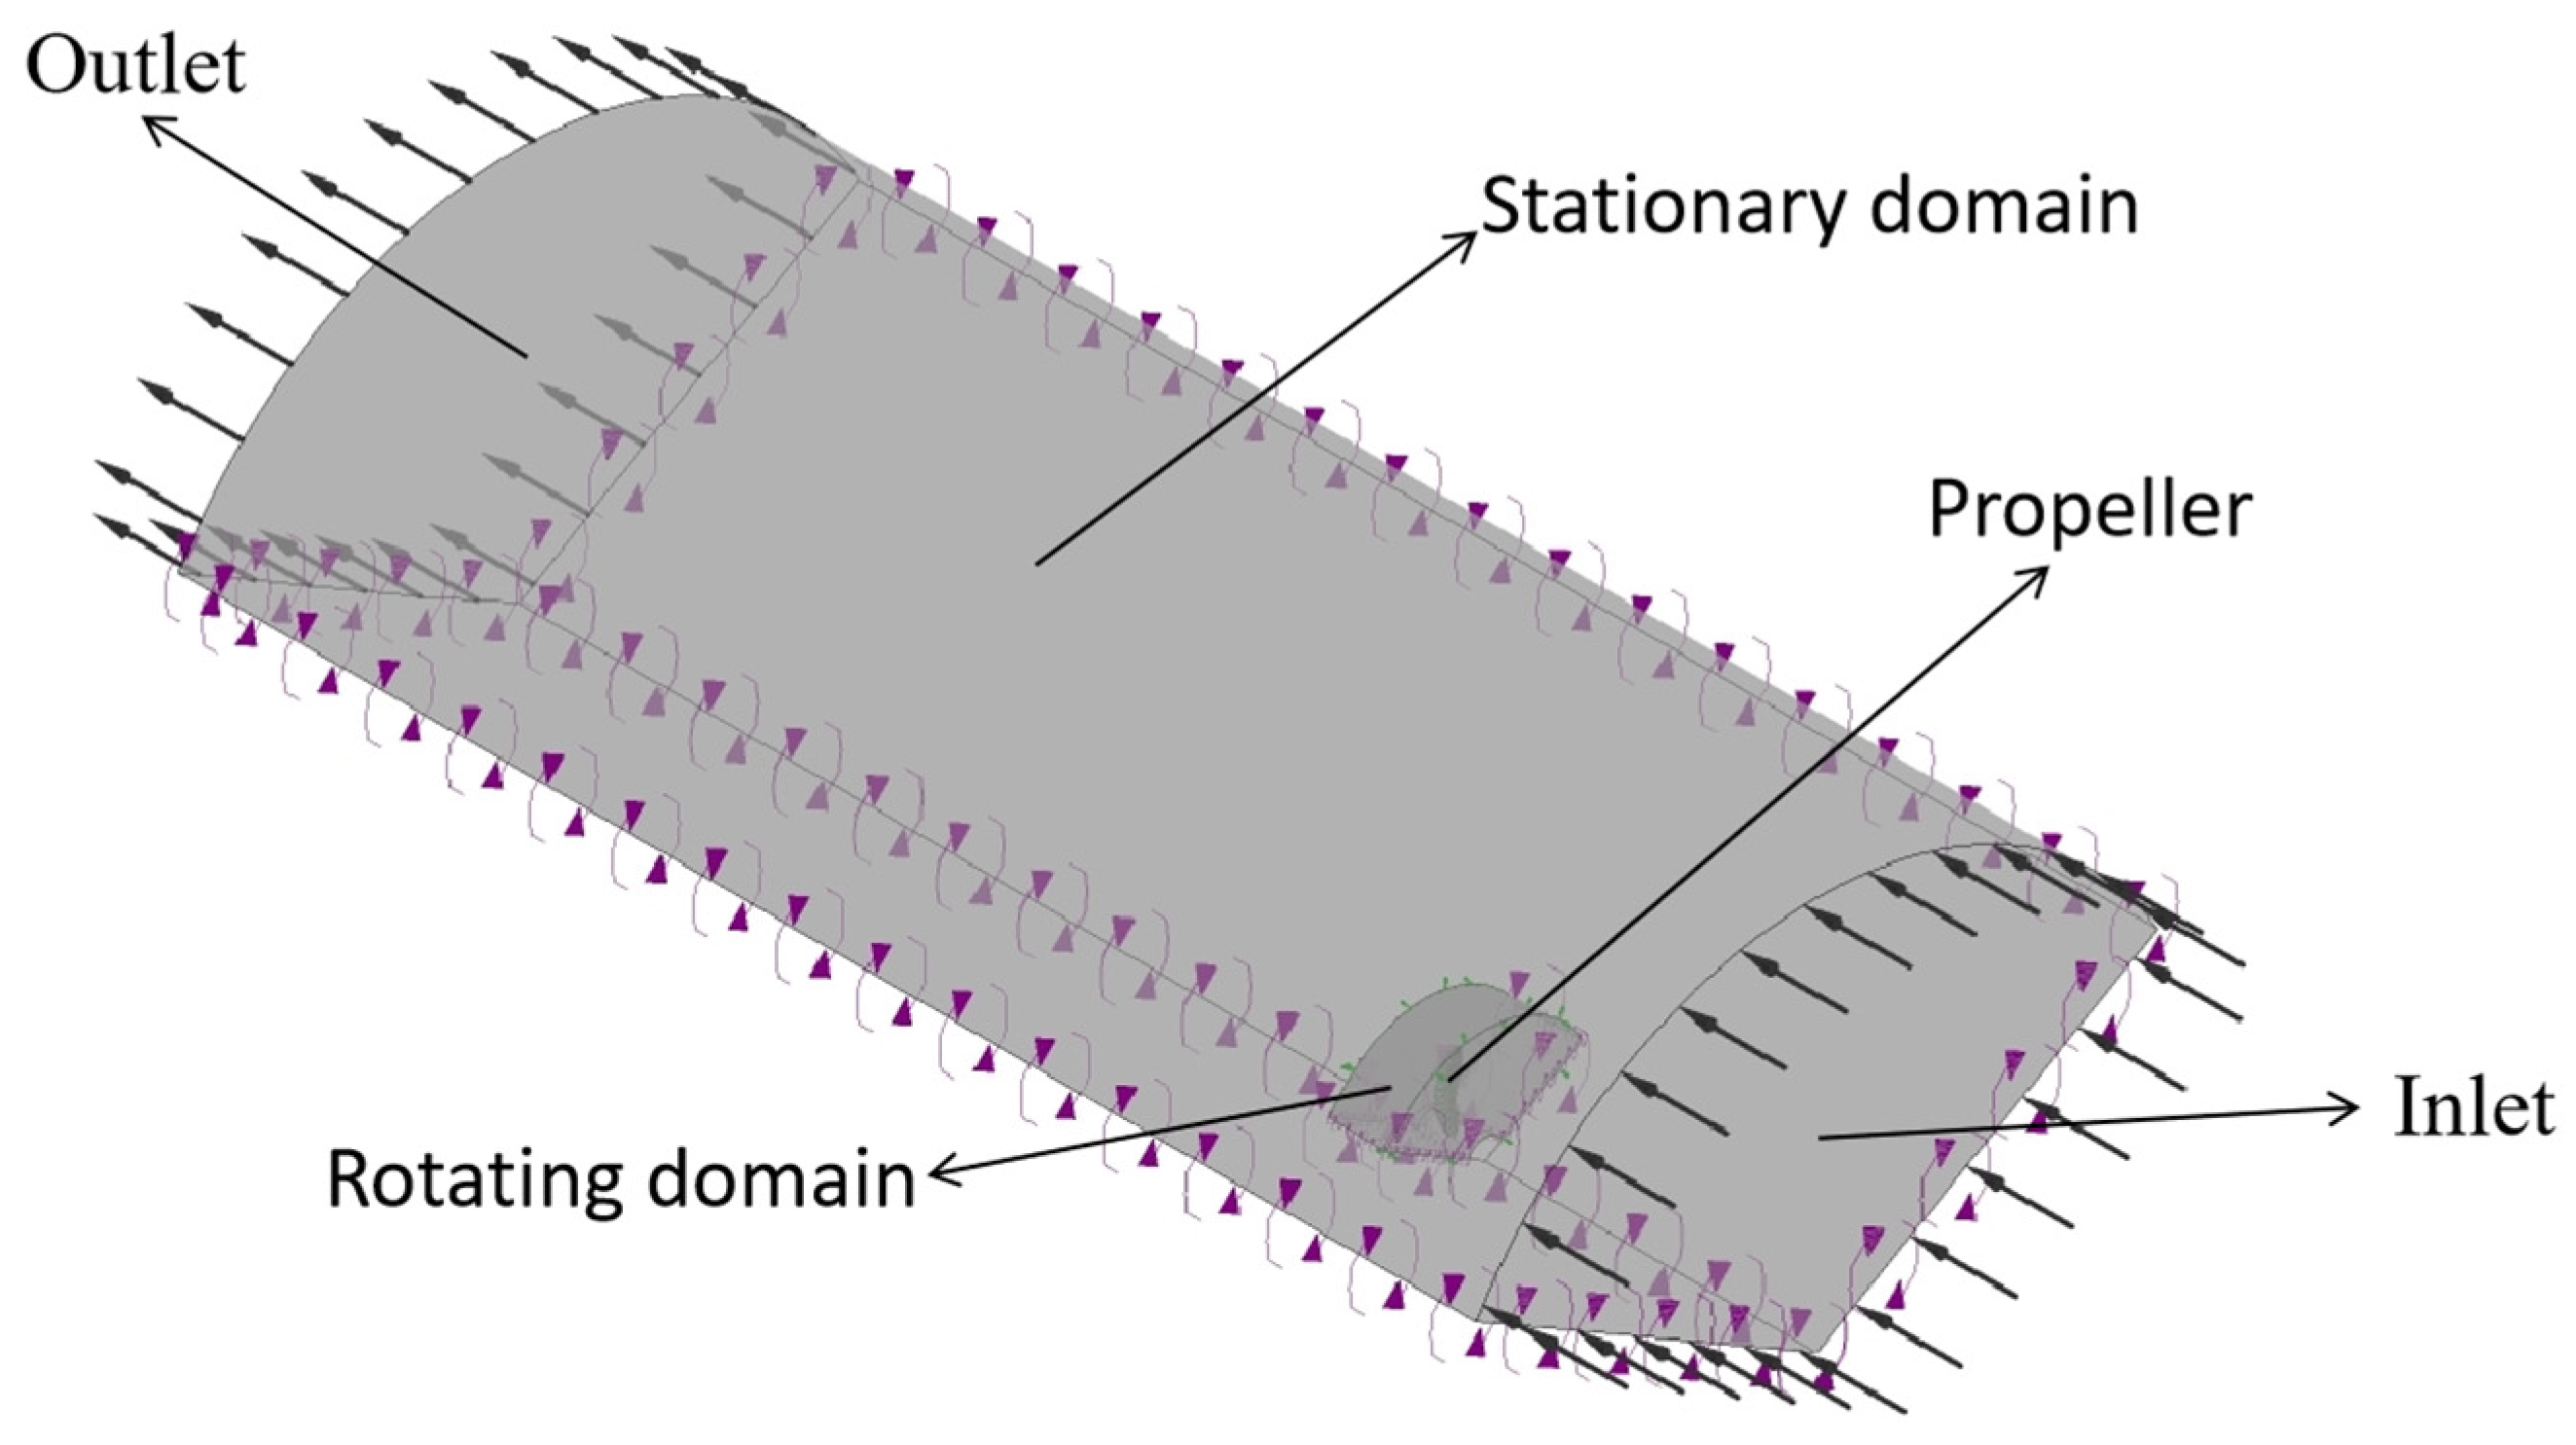
Figure 5.
Hydrodynamic performance curve. (a) n = 300 r/min, (b) n = 600 r/min, (c) n = 900 r/min, and (d) n = 1200 r/min.
Figure 5.
Hydrodynamic performance curve. (a) n = 300 r/min, (b) n = 600 r/min, (c) n = 900 r/min, and (d) n = 1200 r/min.
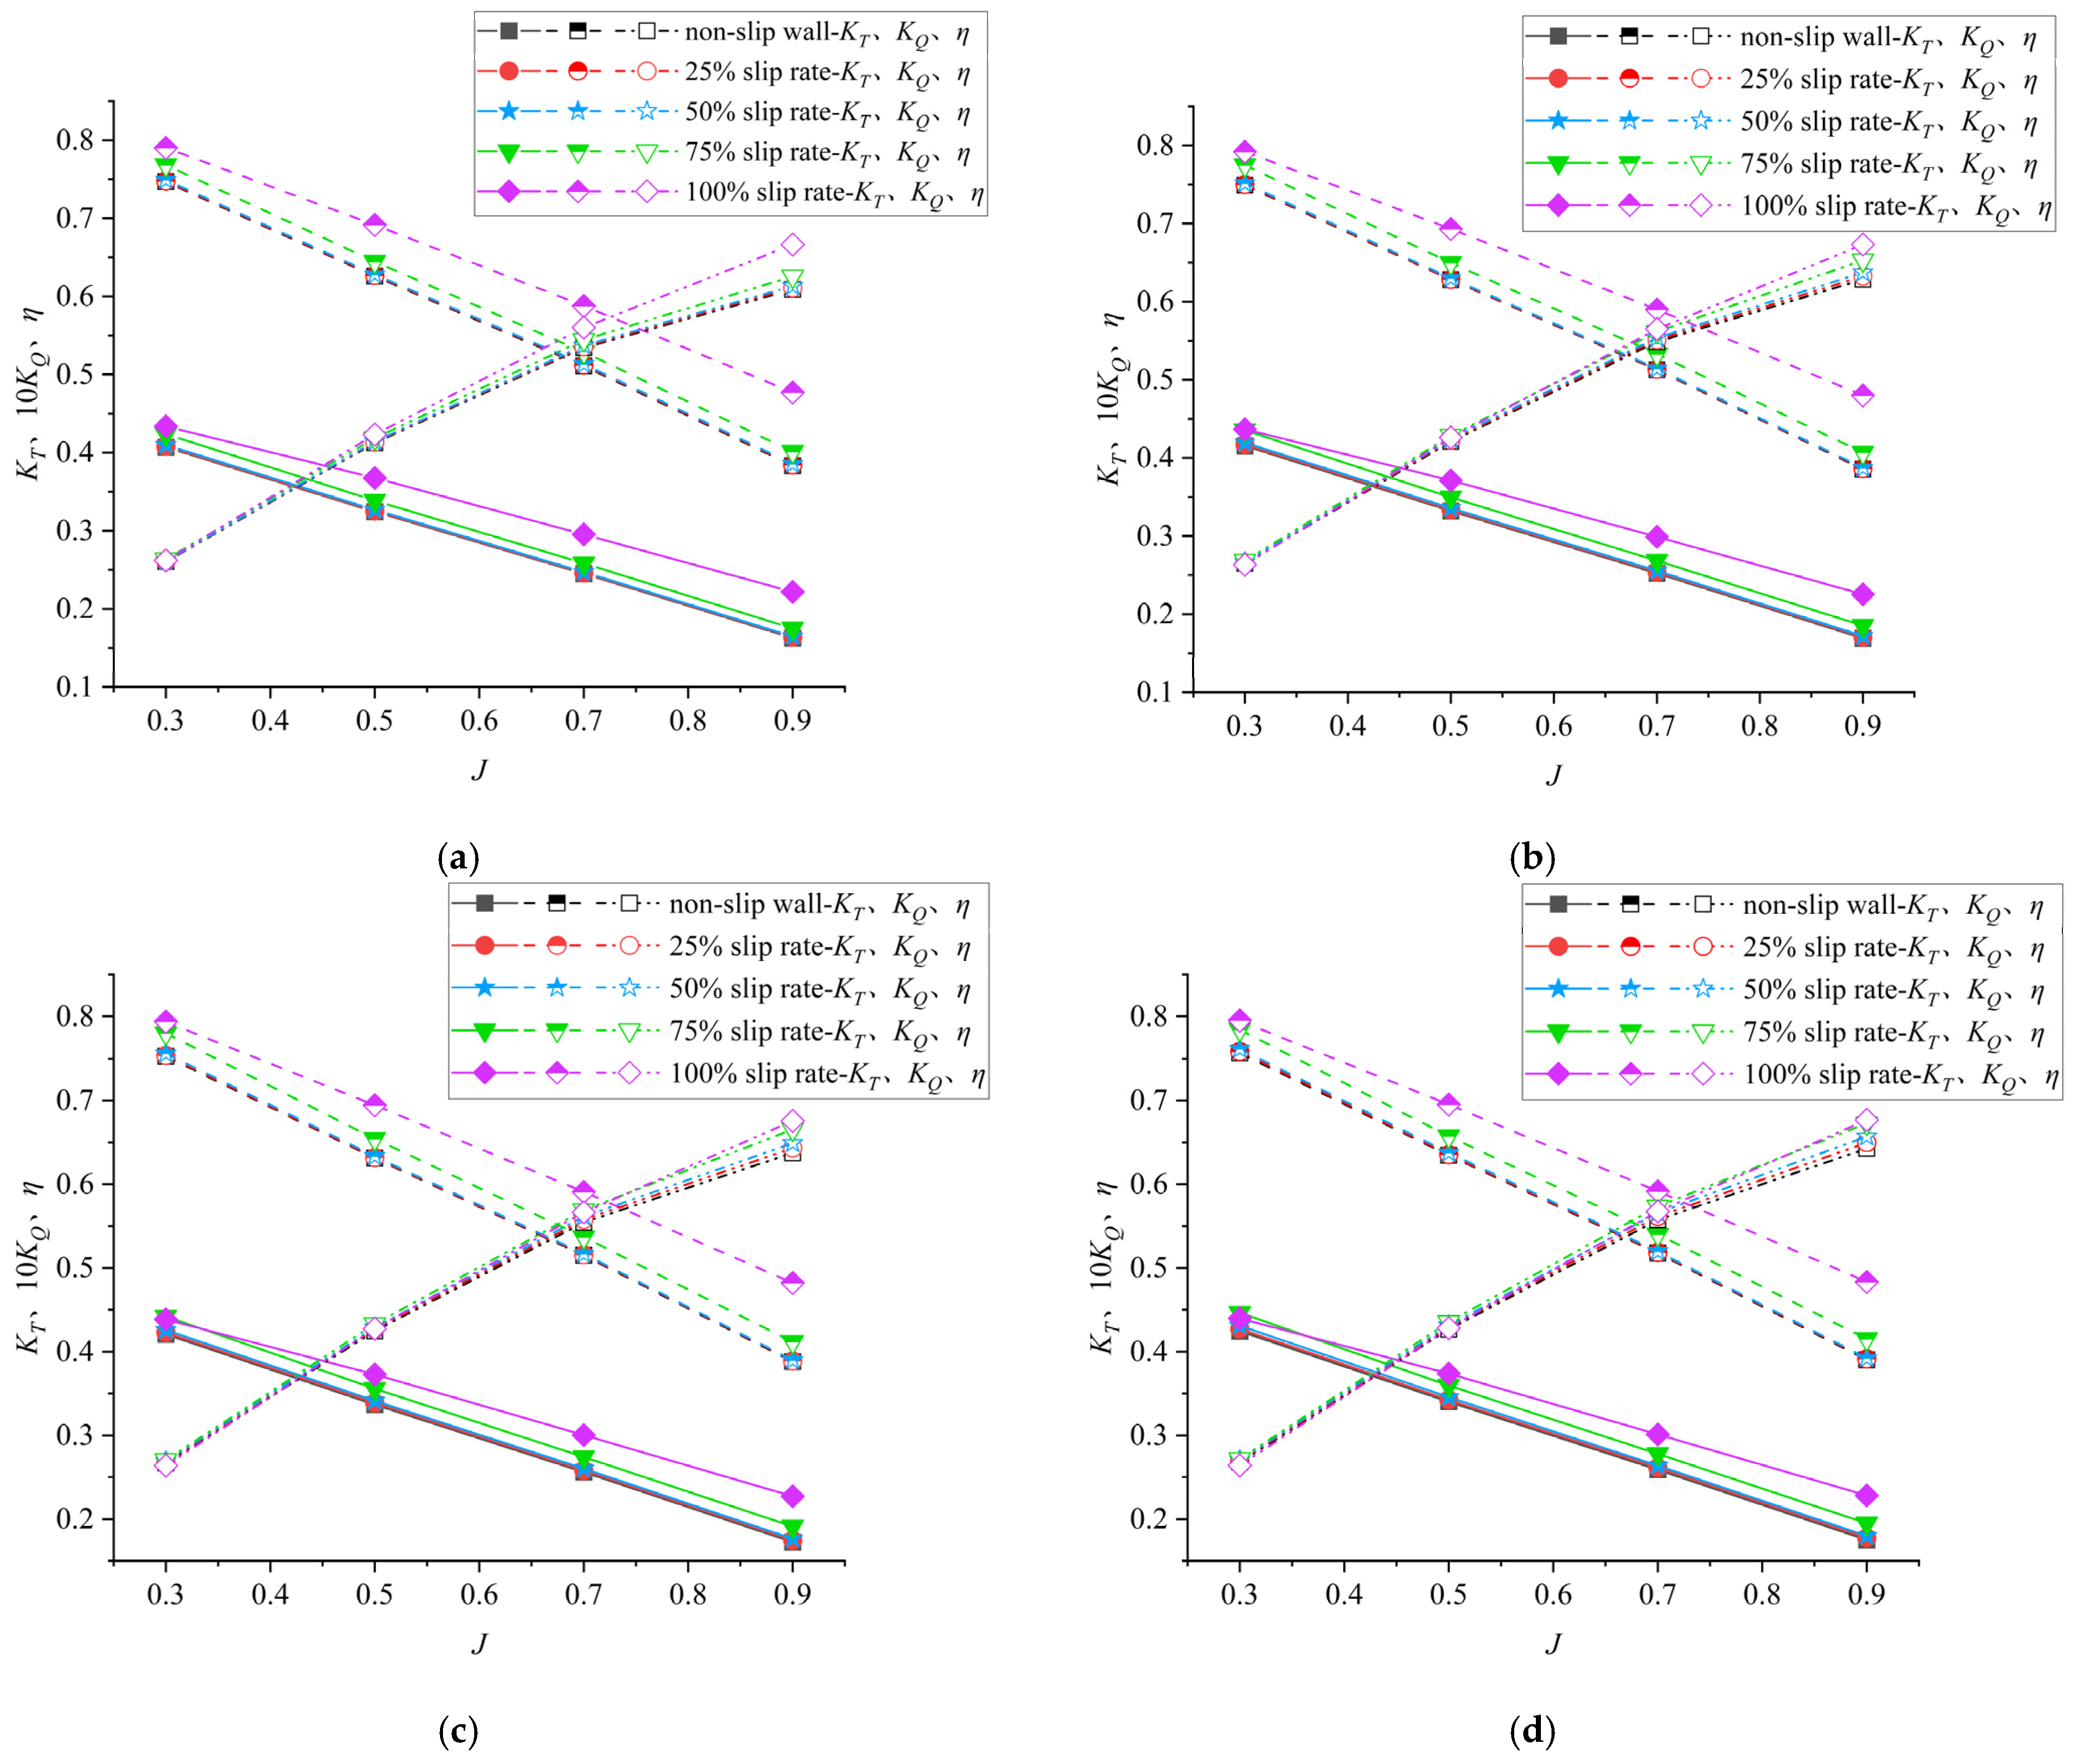
Figure 6.
Propeller blade pressure. (a) Conventional propeller, suction surface. (b) Propeller coated with the hydrophobic material, suction surface. (c) Conventional propeller, pressure surface. (d) Propeller coated with the hydrophobic material, pressure surface.
Figure 6.
Propeller blade pressure. (a) Conventional propeller, suction surface. (b) Propeller coated with the hydrophobic material, suction surface. (c) Conventional propeller, pressure surface. (d) Propeller coated with the hydrophobic material, pressure surface.
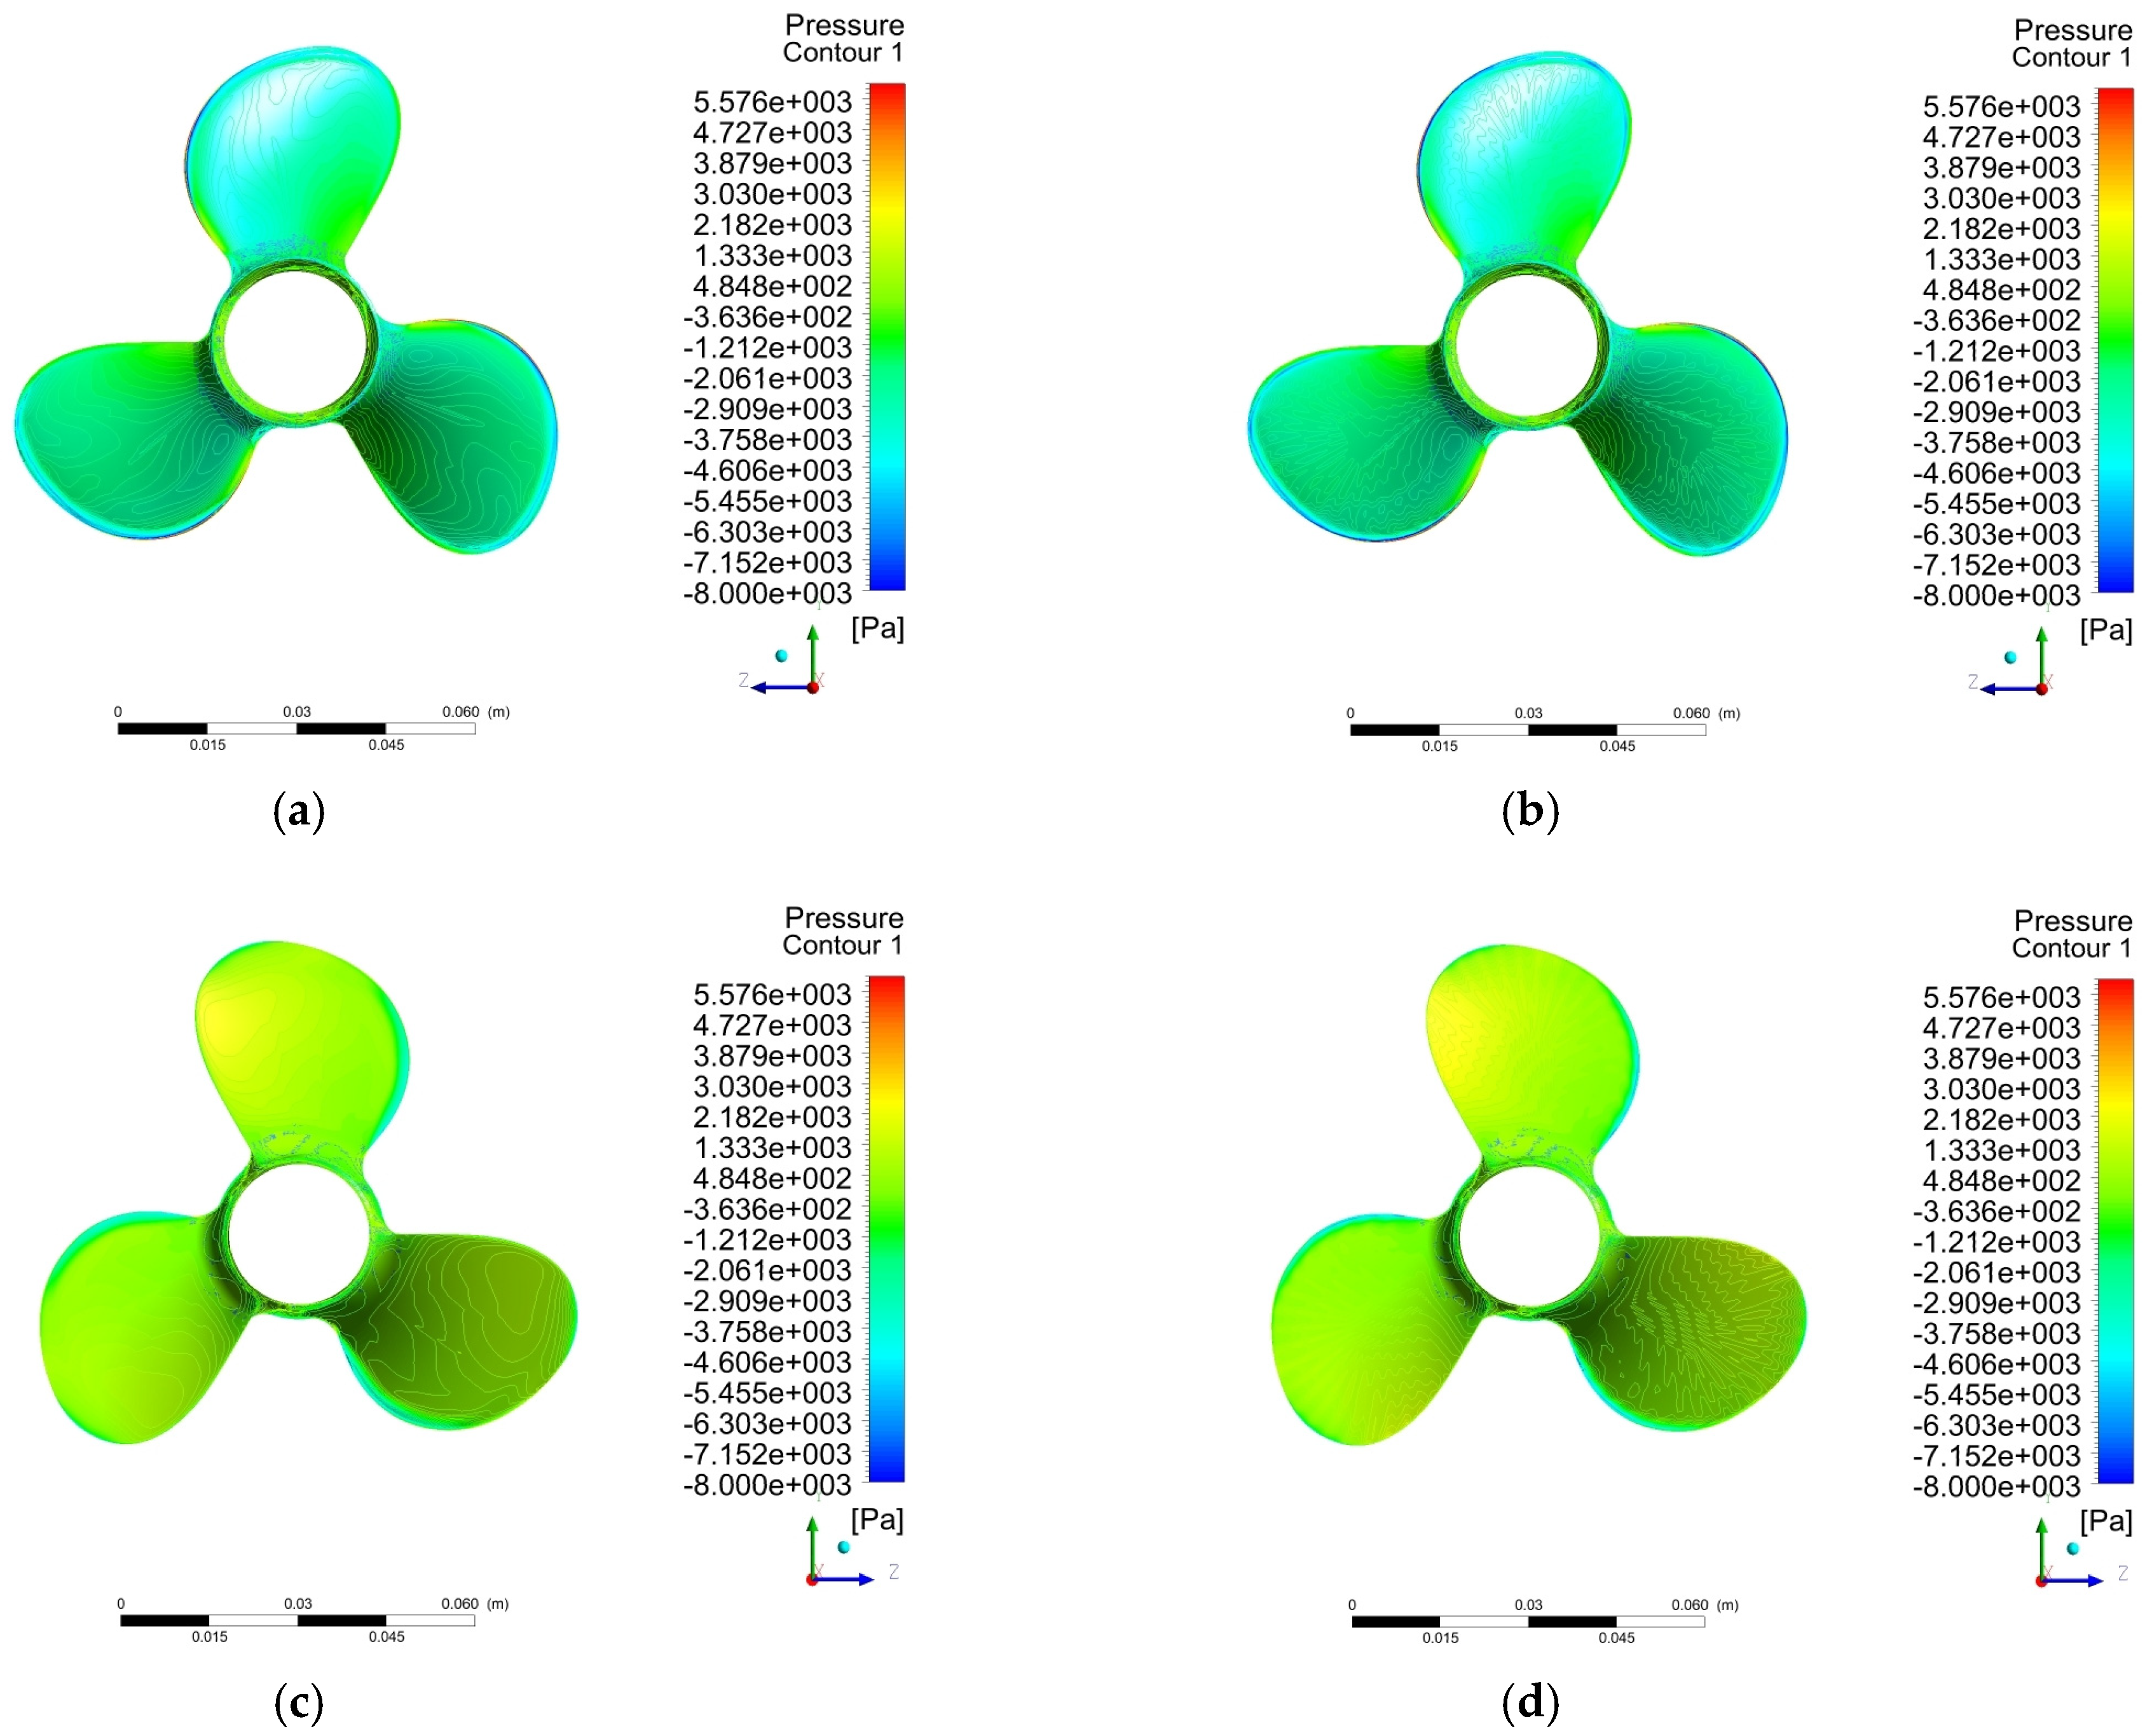
Figure 7.
Sampling points on the suction side and pressure side. (a) Suction surface. (b) Pressure surface.
Figure 7.
Sampling points on the suction side and pressure side. (a) Suction surface. (b) Pressure surface.
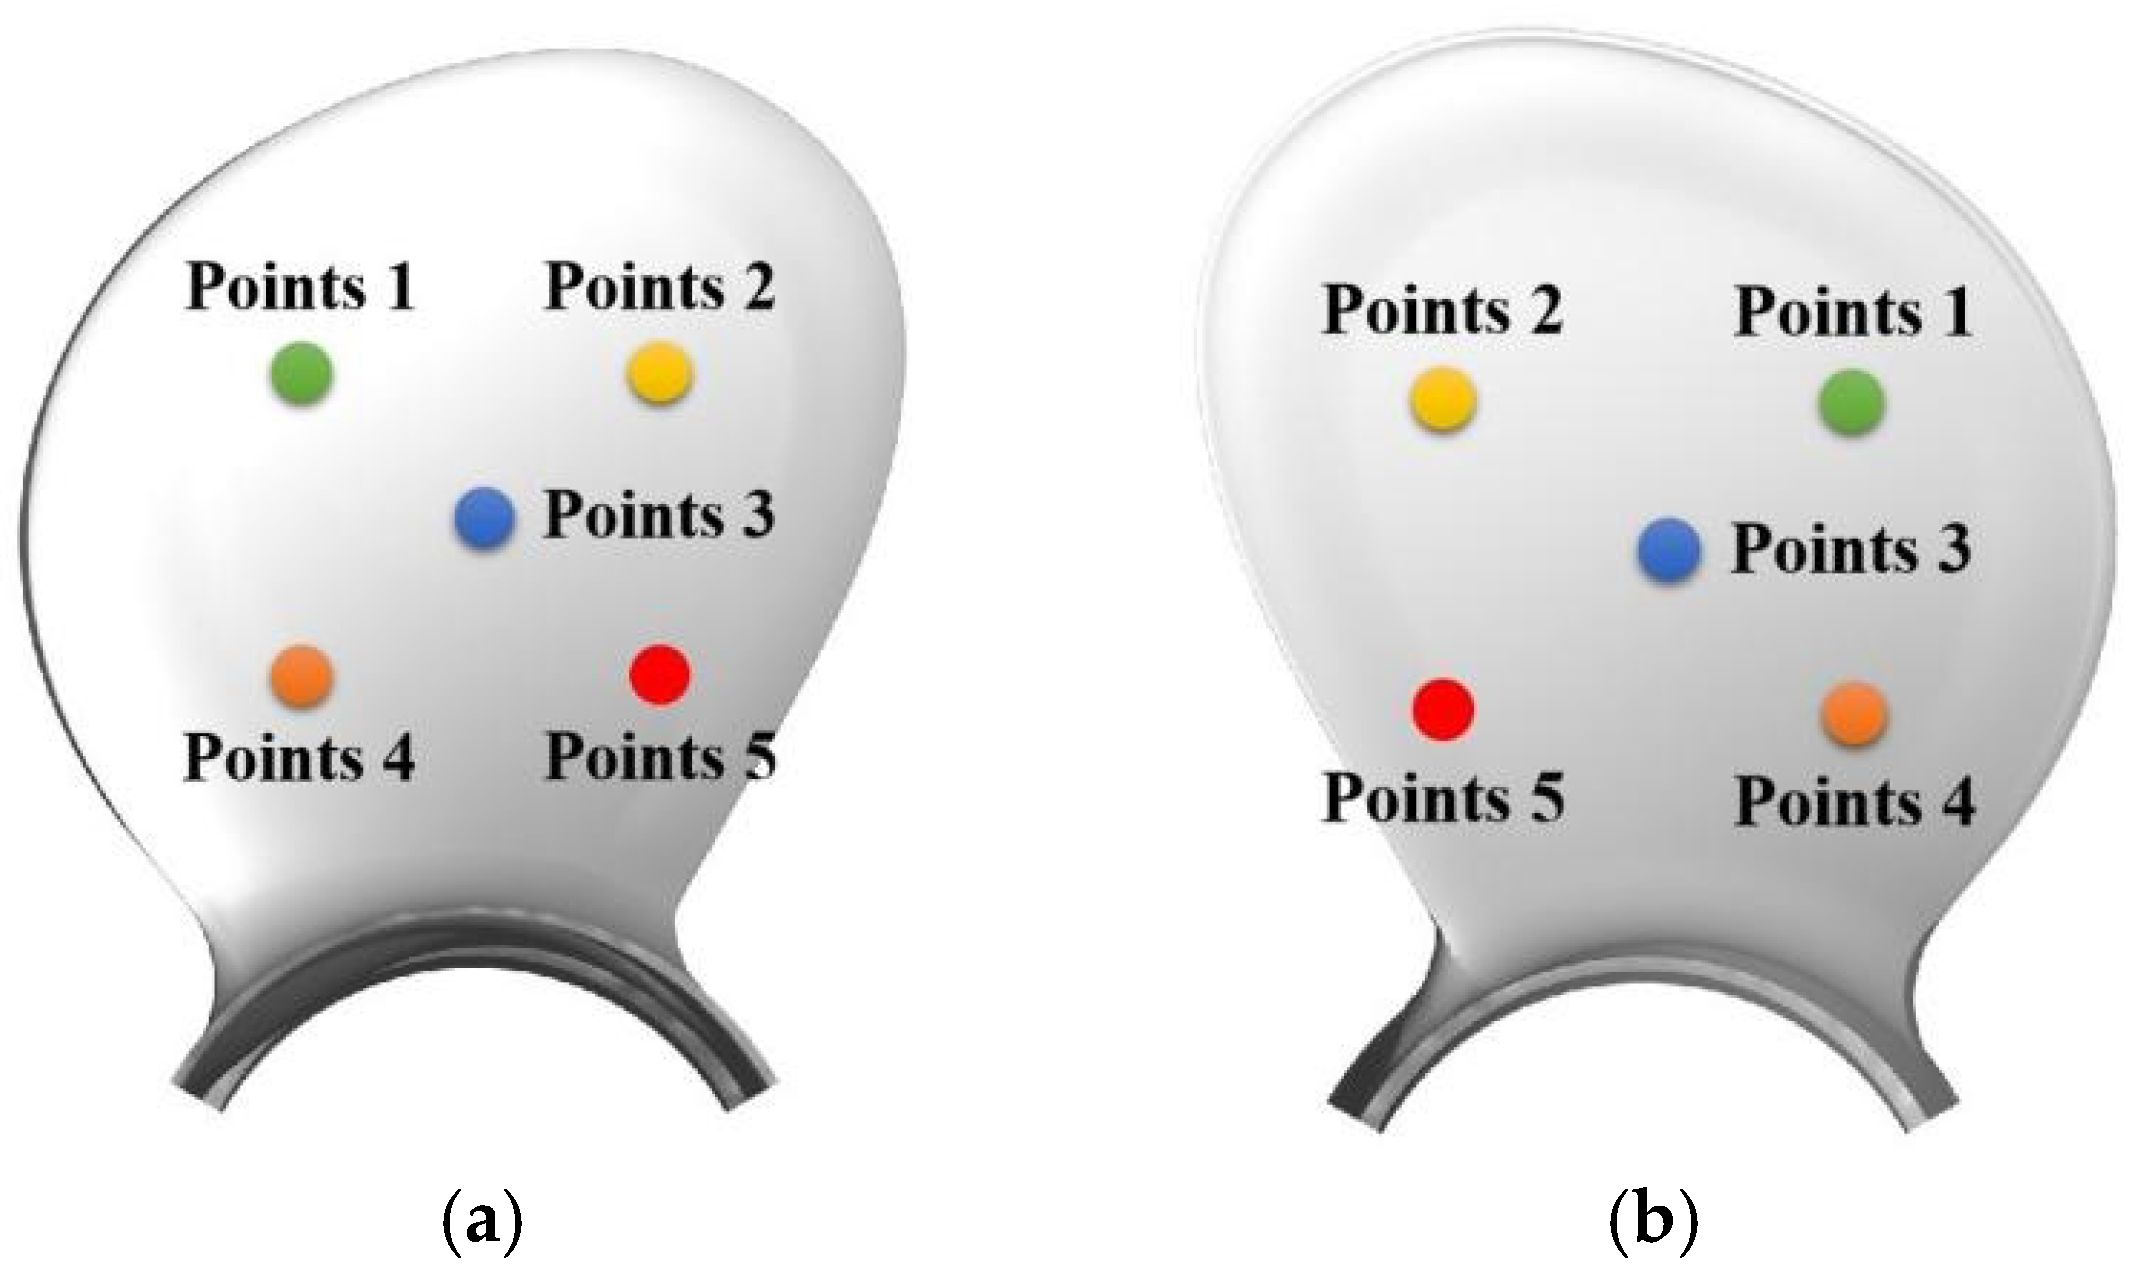
Figure 8.
Analysis of the Liutex vorticity and the turbulent kinetic energy of the propellers. (a) Conventional propeller, tip vortices. (b) Propeller coated with the hydrophobic material, tip vortices. (c) Conventional propeller, wake vortices. (d) Propeller coated with the hydrophobic material, wake vortices. (e) Conventional propeller. (f) Propeller coated with the hydrophobic material.
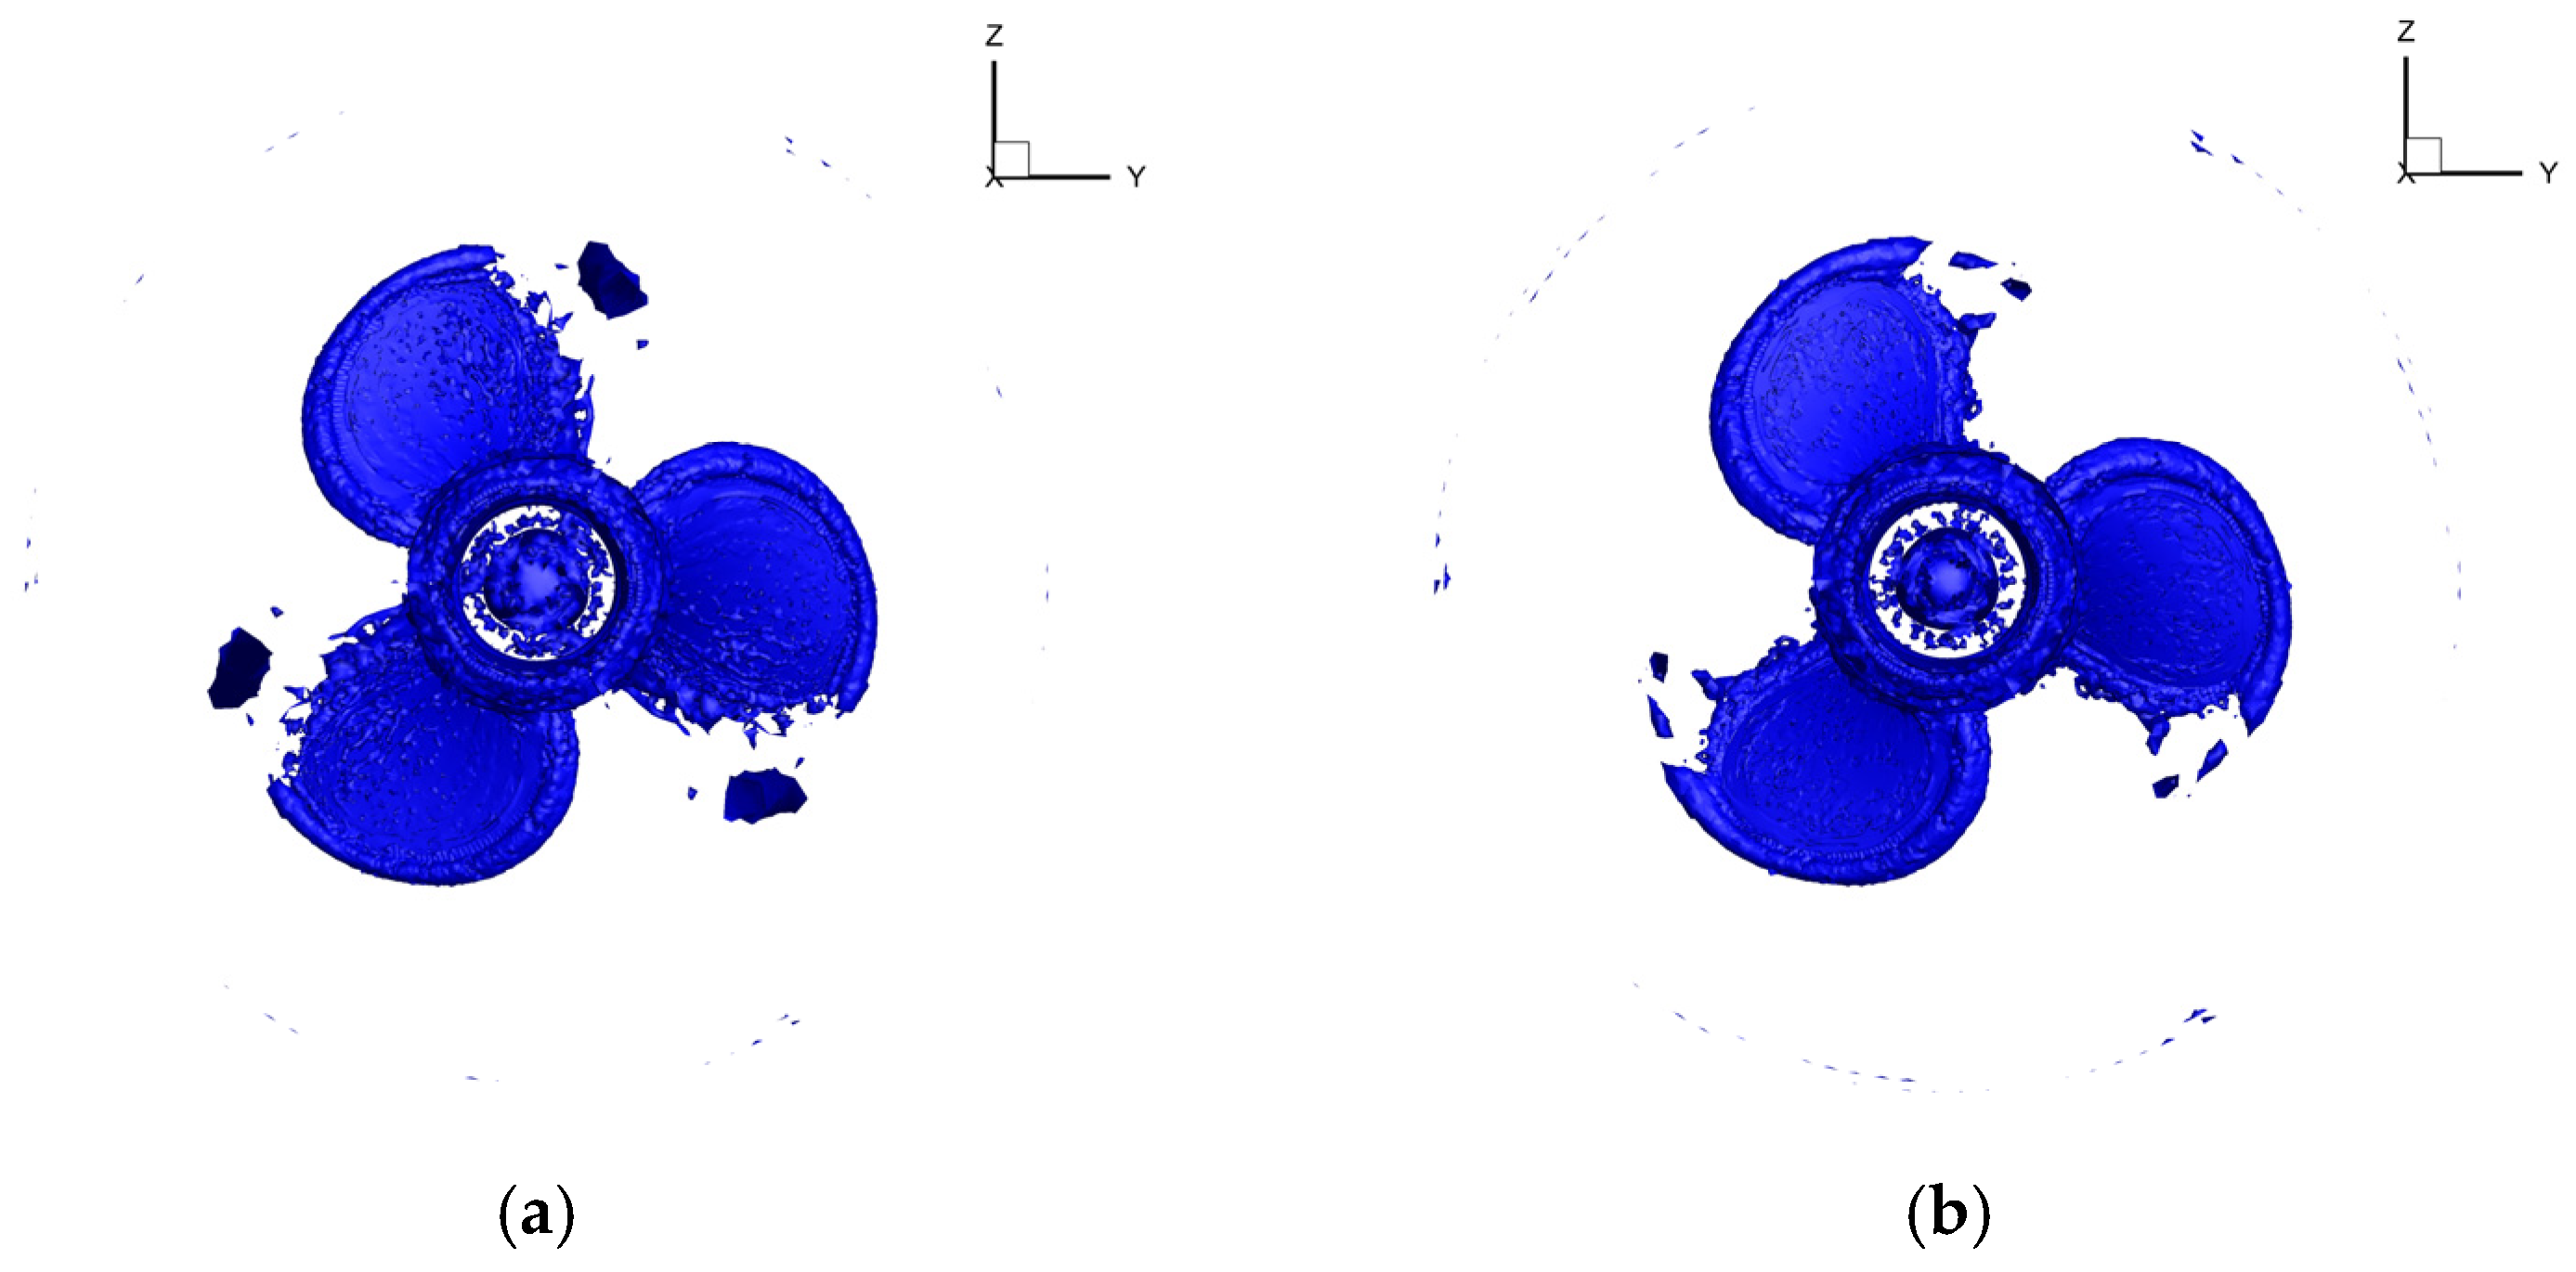
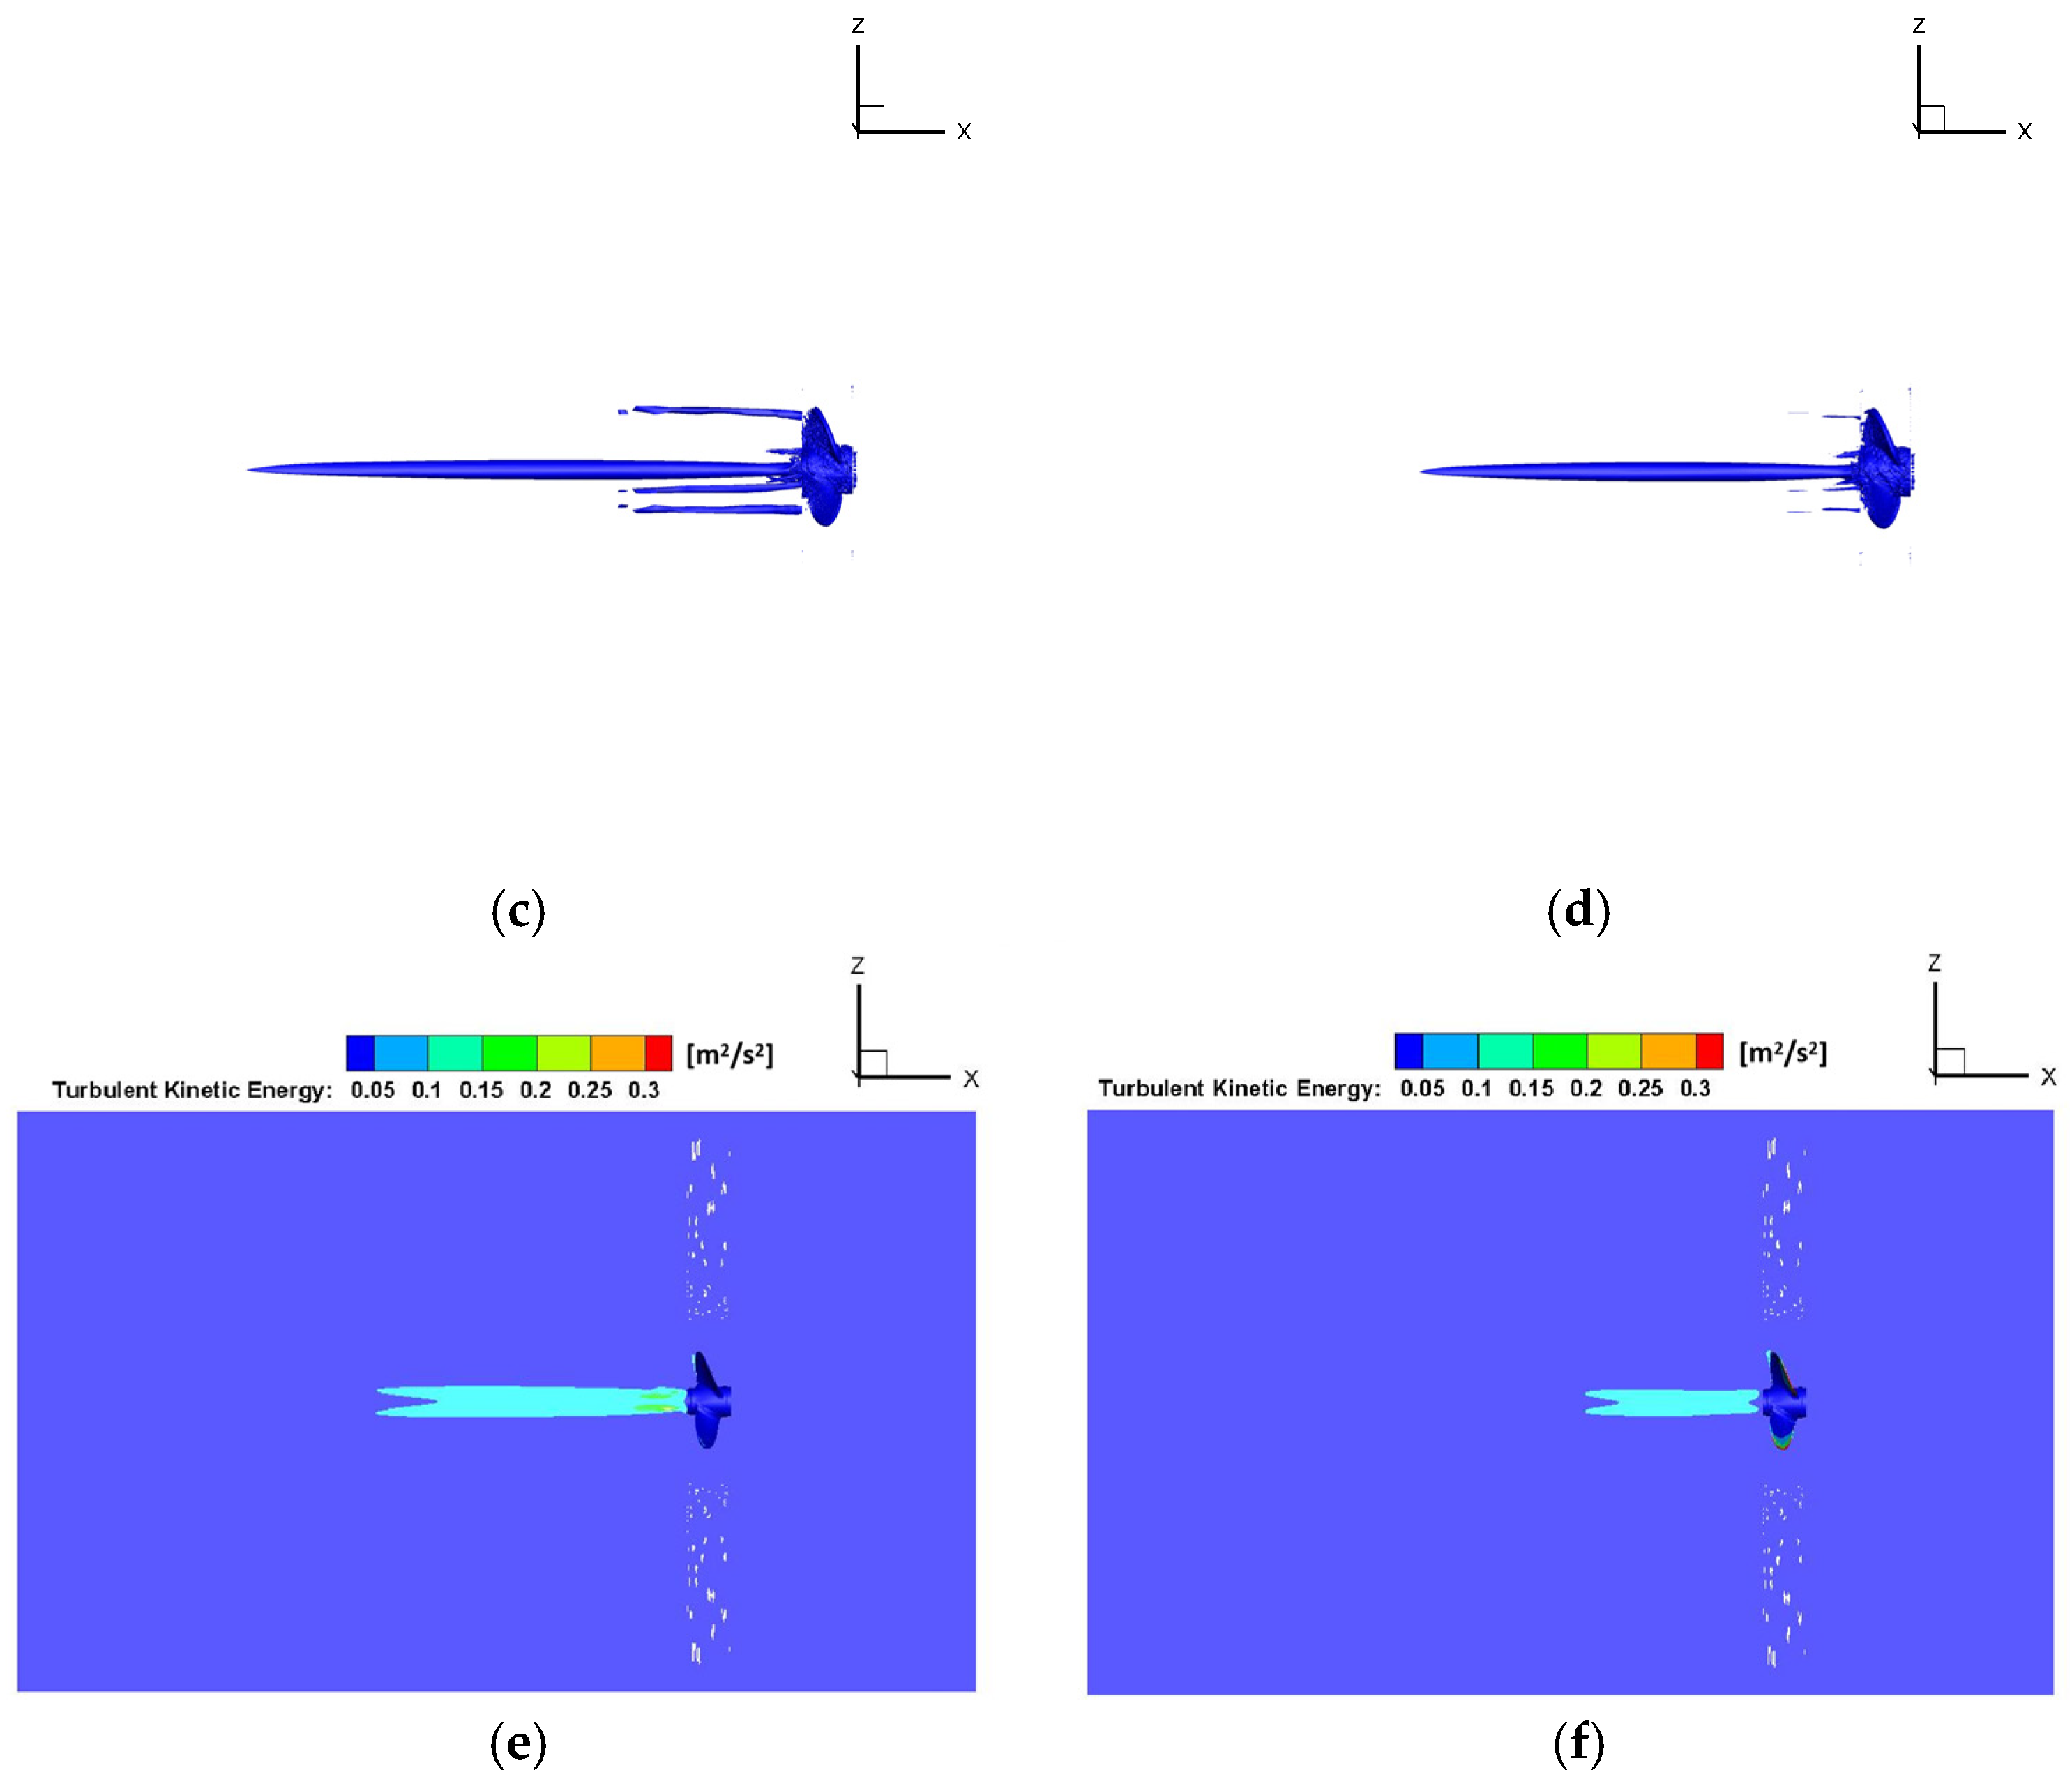
Figure 9.
Propeller model for experiment. (a) Test propellers (left: uncoated; right: PVDF coated). (b) Closer view of PVDF coating.
Figure 9.
Propeller model for experiment. (a) Test propellers (left: uncoated; right: PVDF coated). (b) Closer view of PVDF coating.
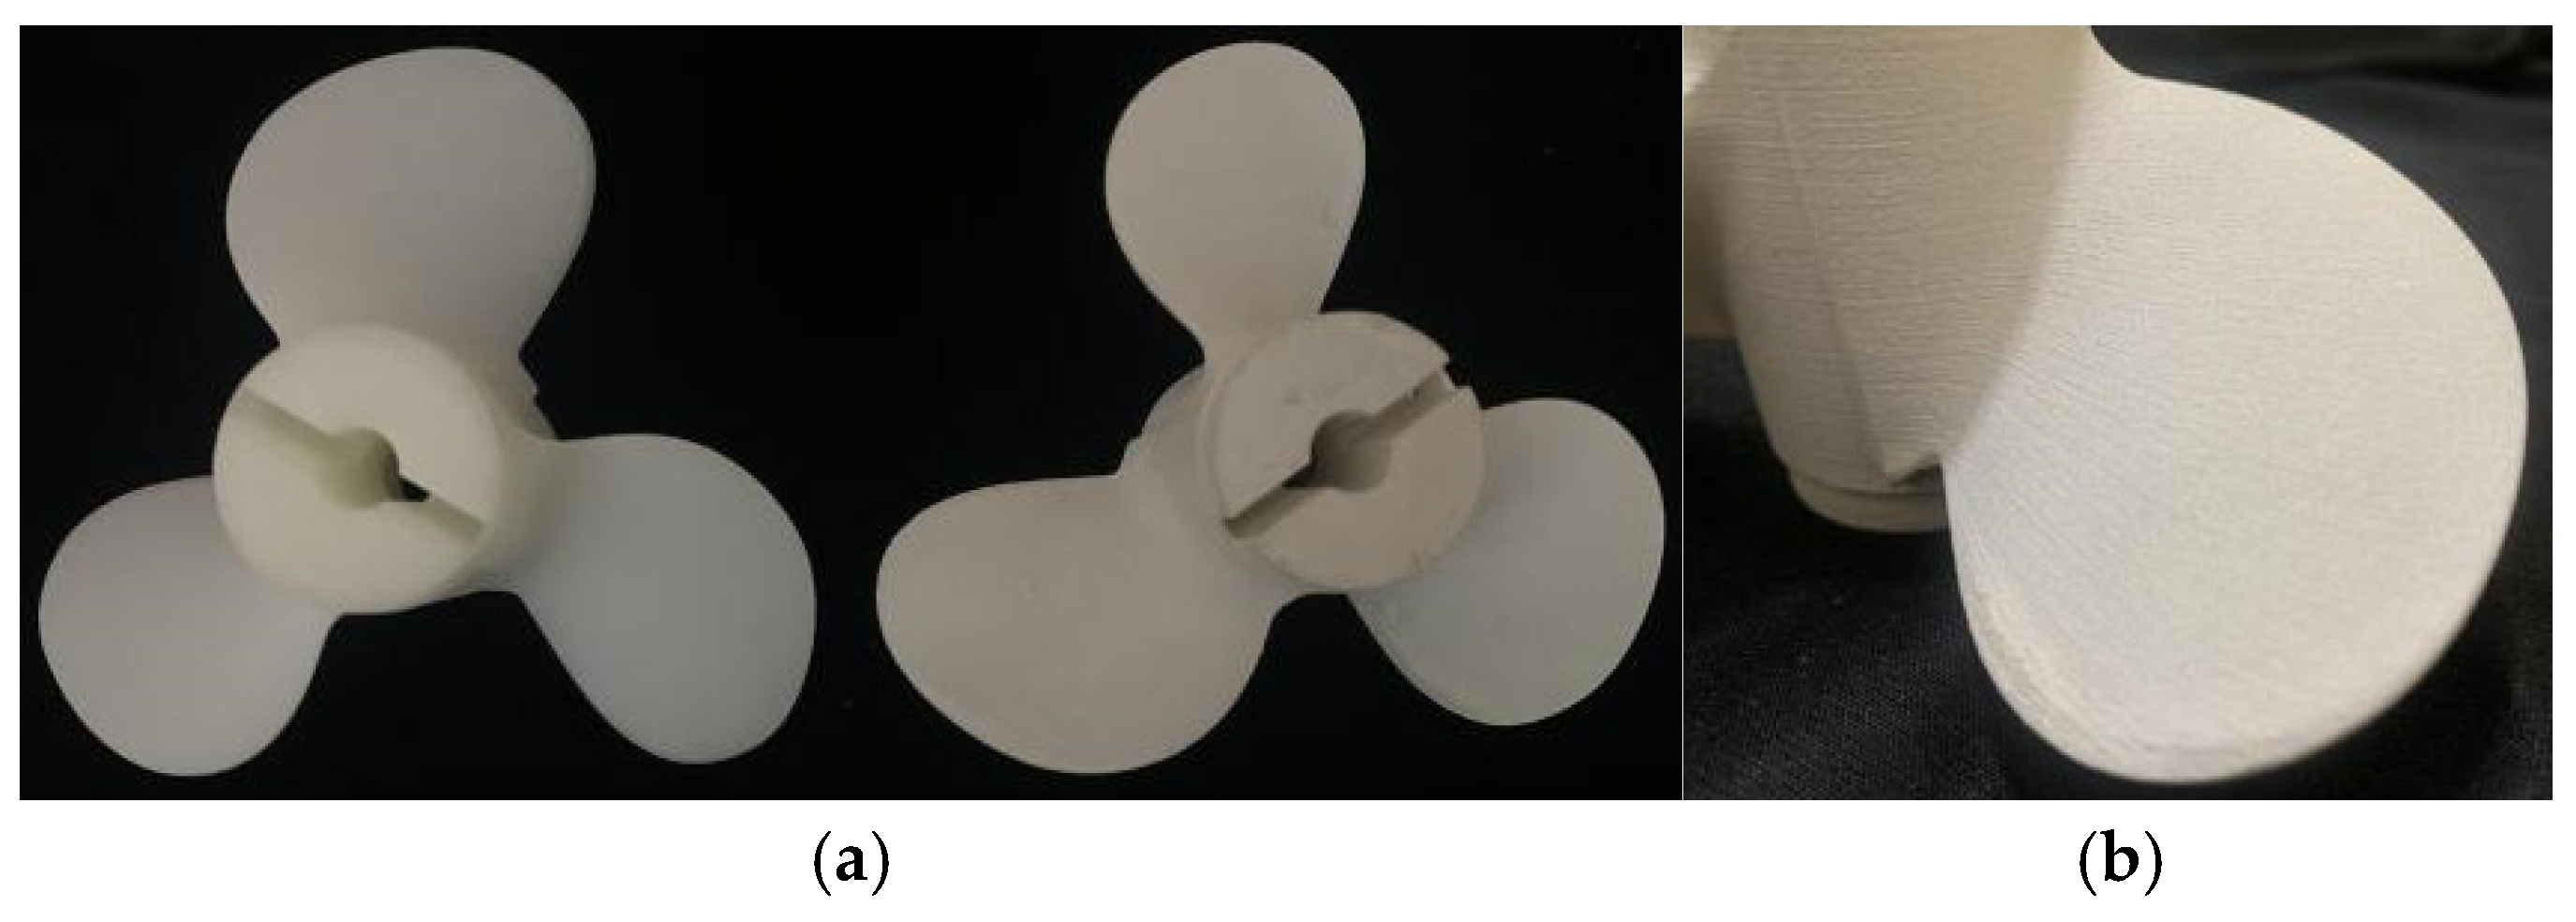
Figure 10.
Schematic diagram of the experimental platform.
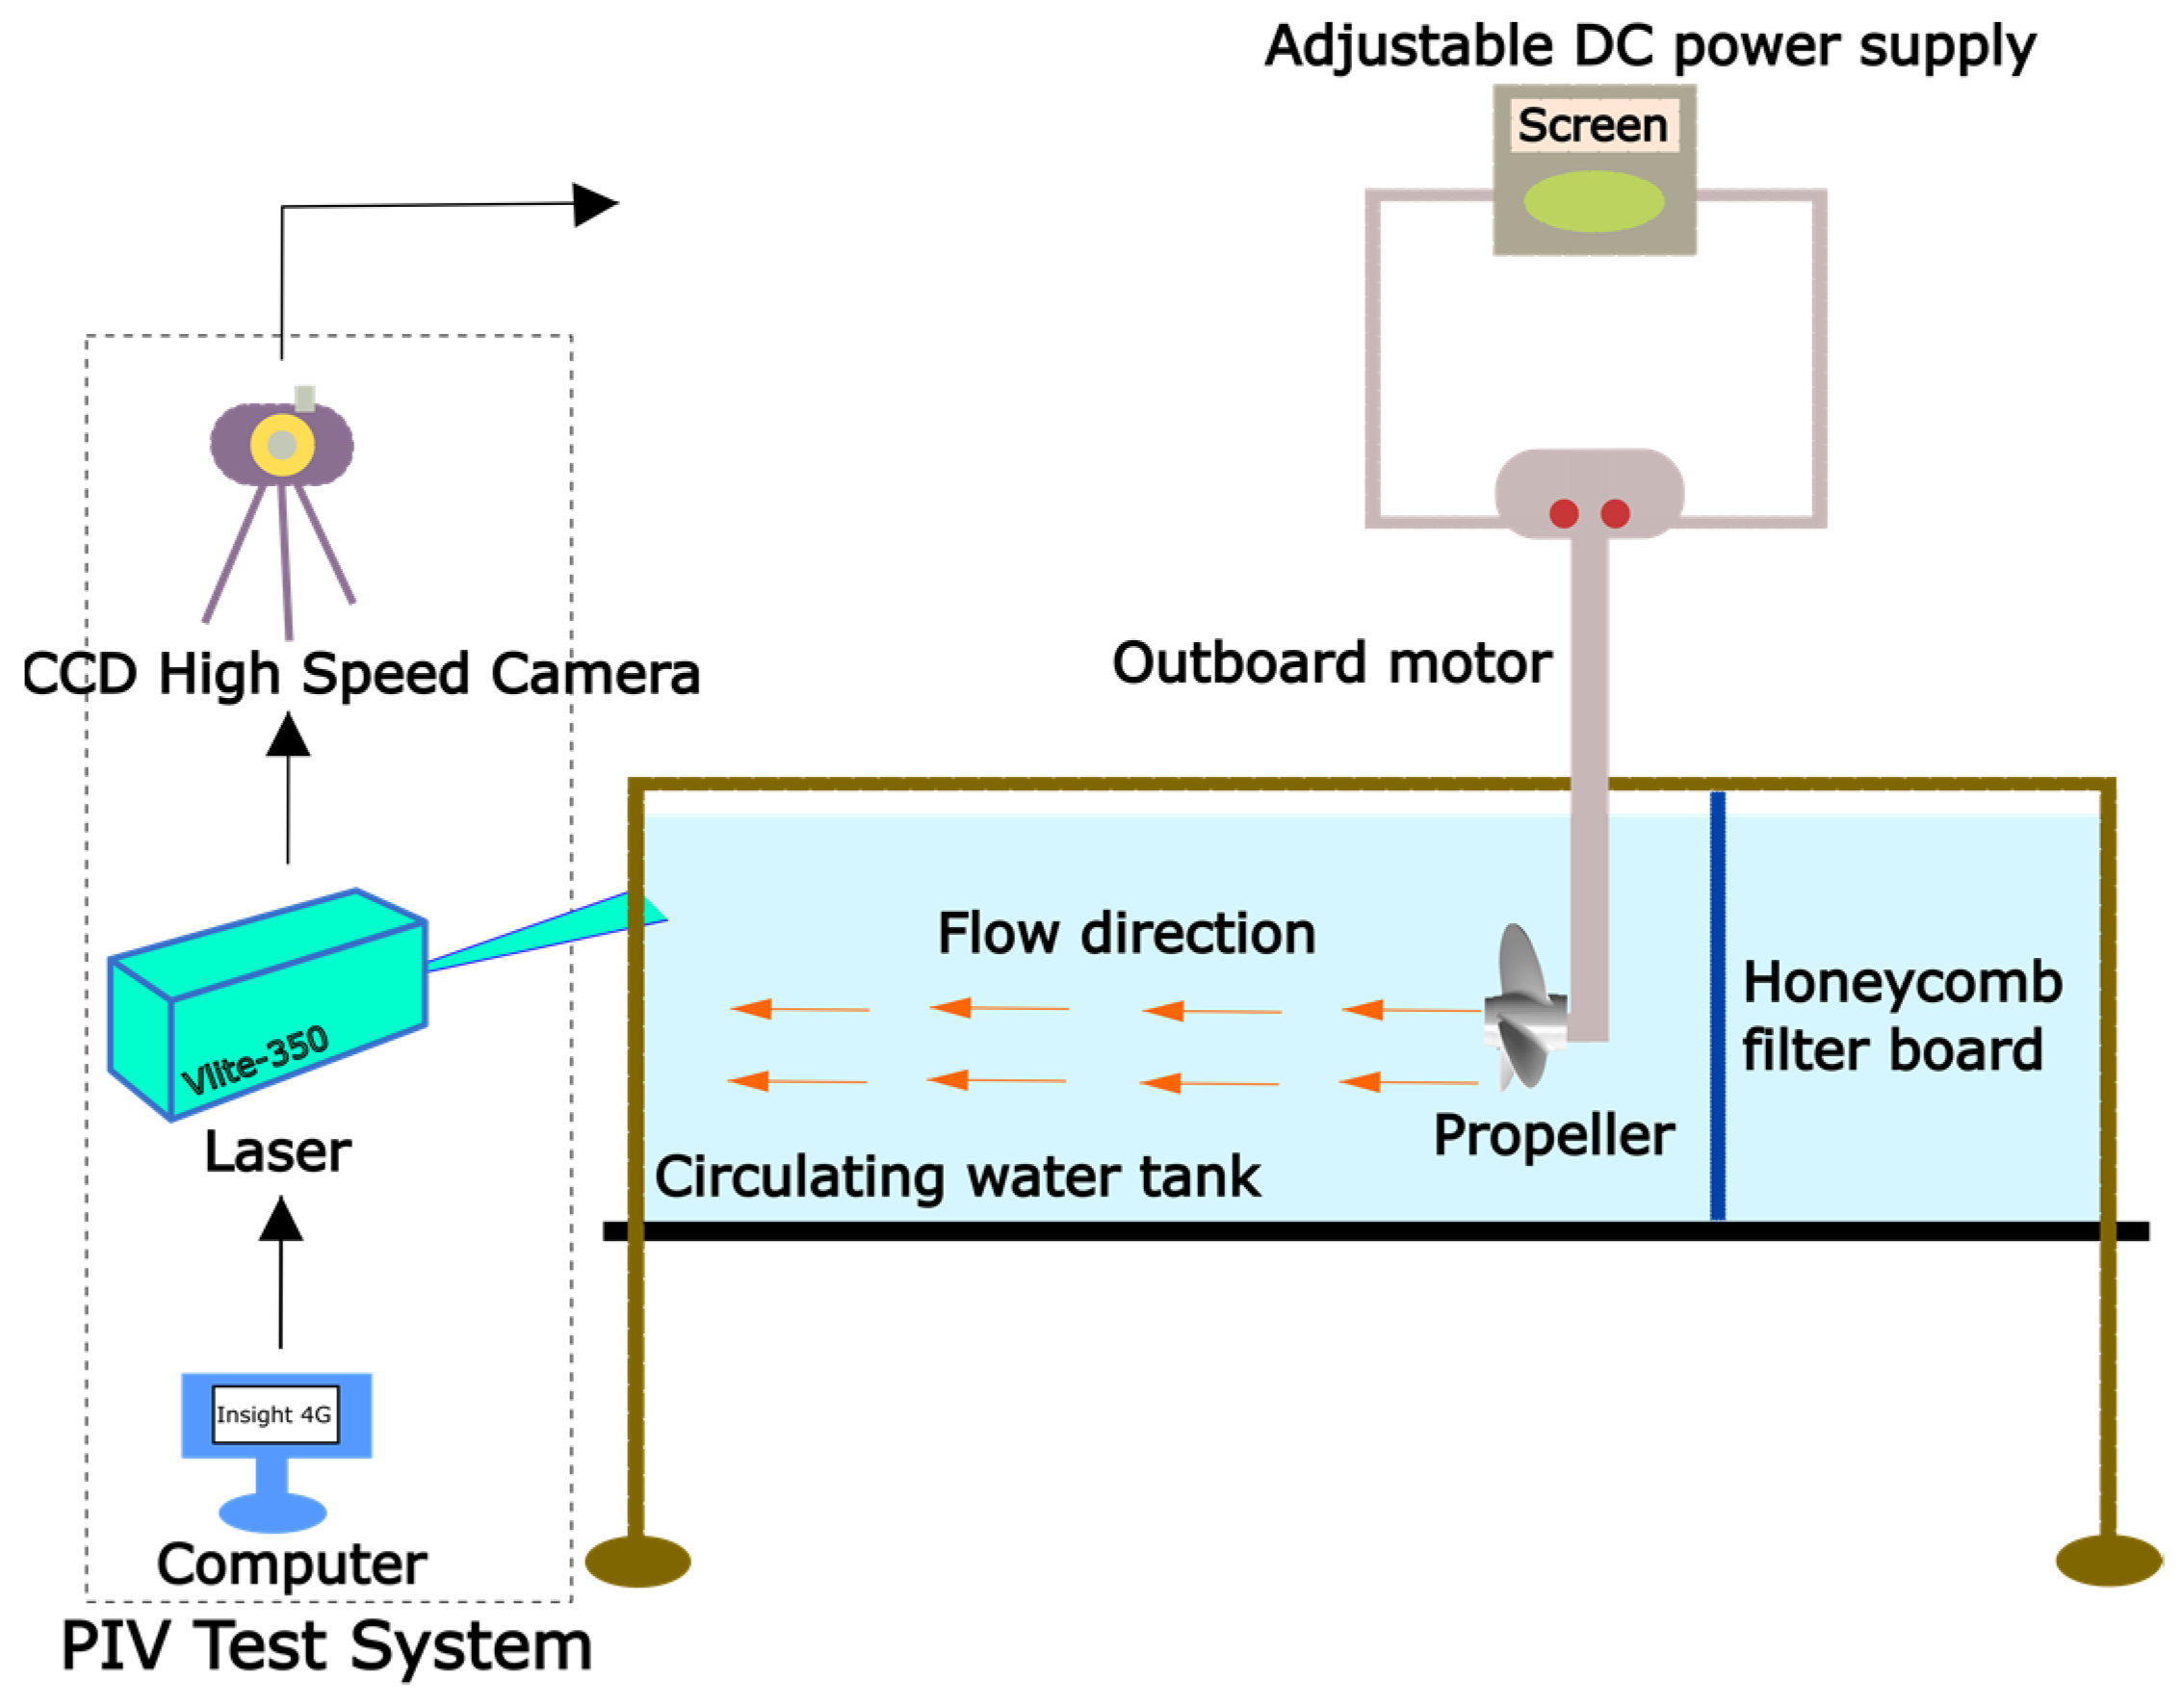
Figure 11.
The experimental platform.
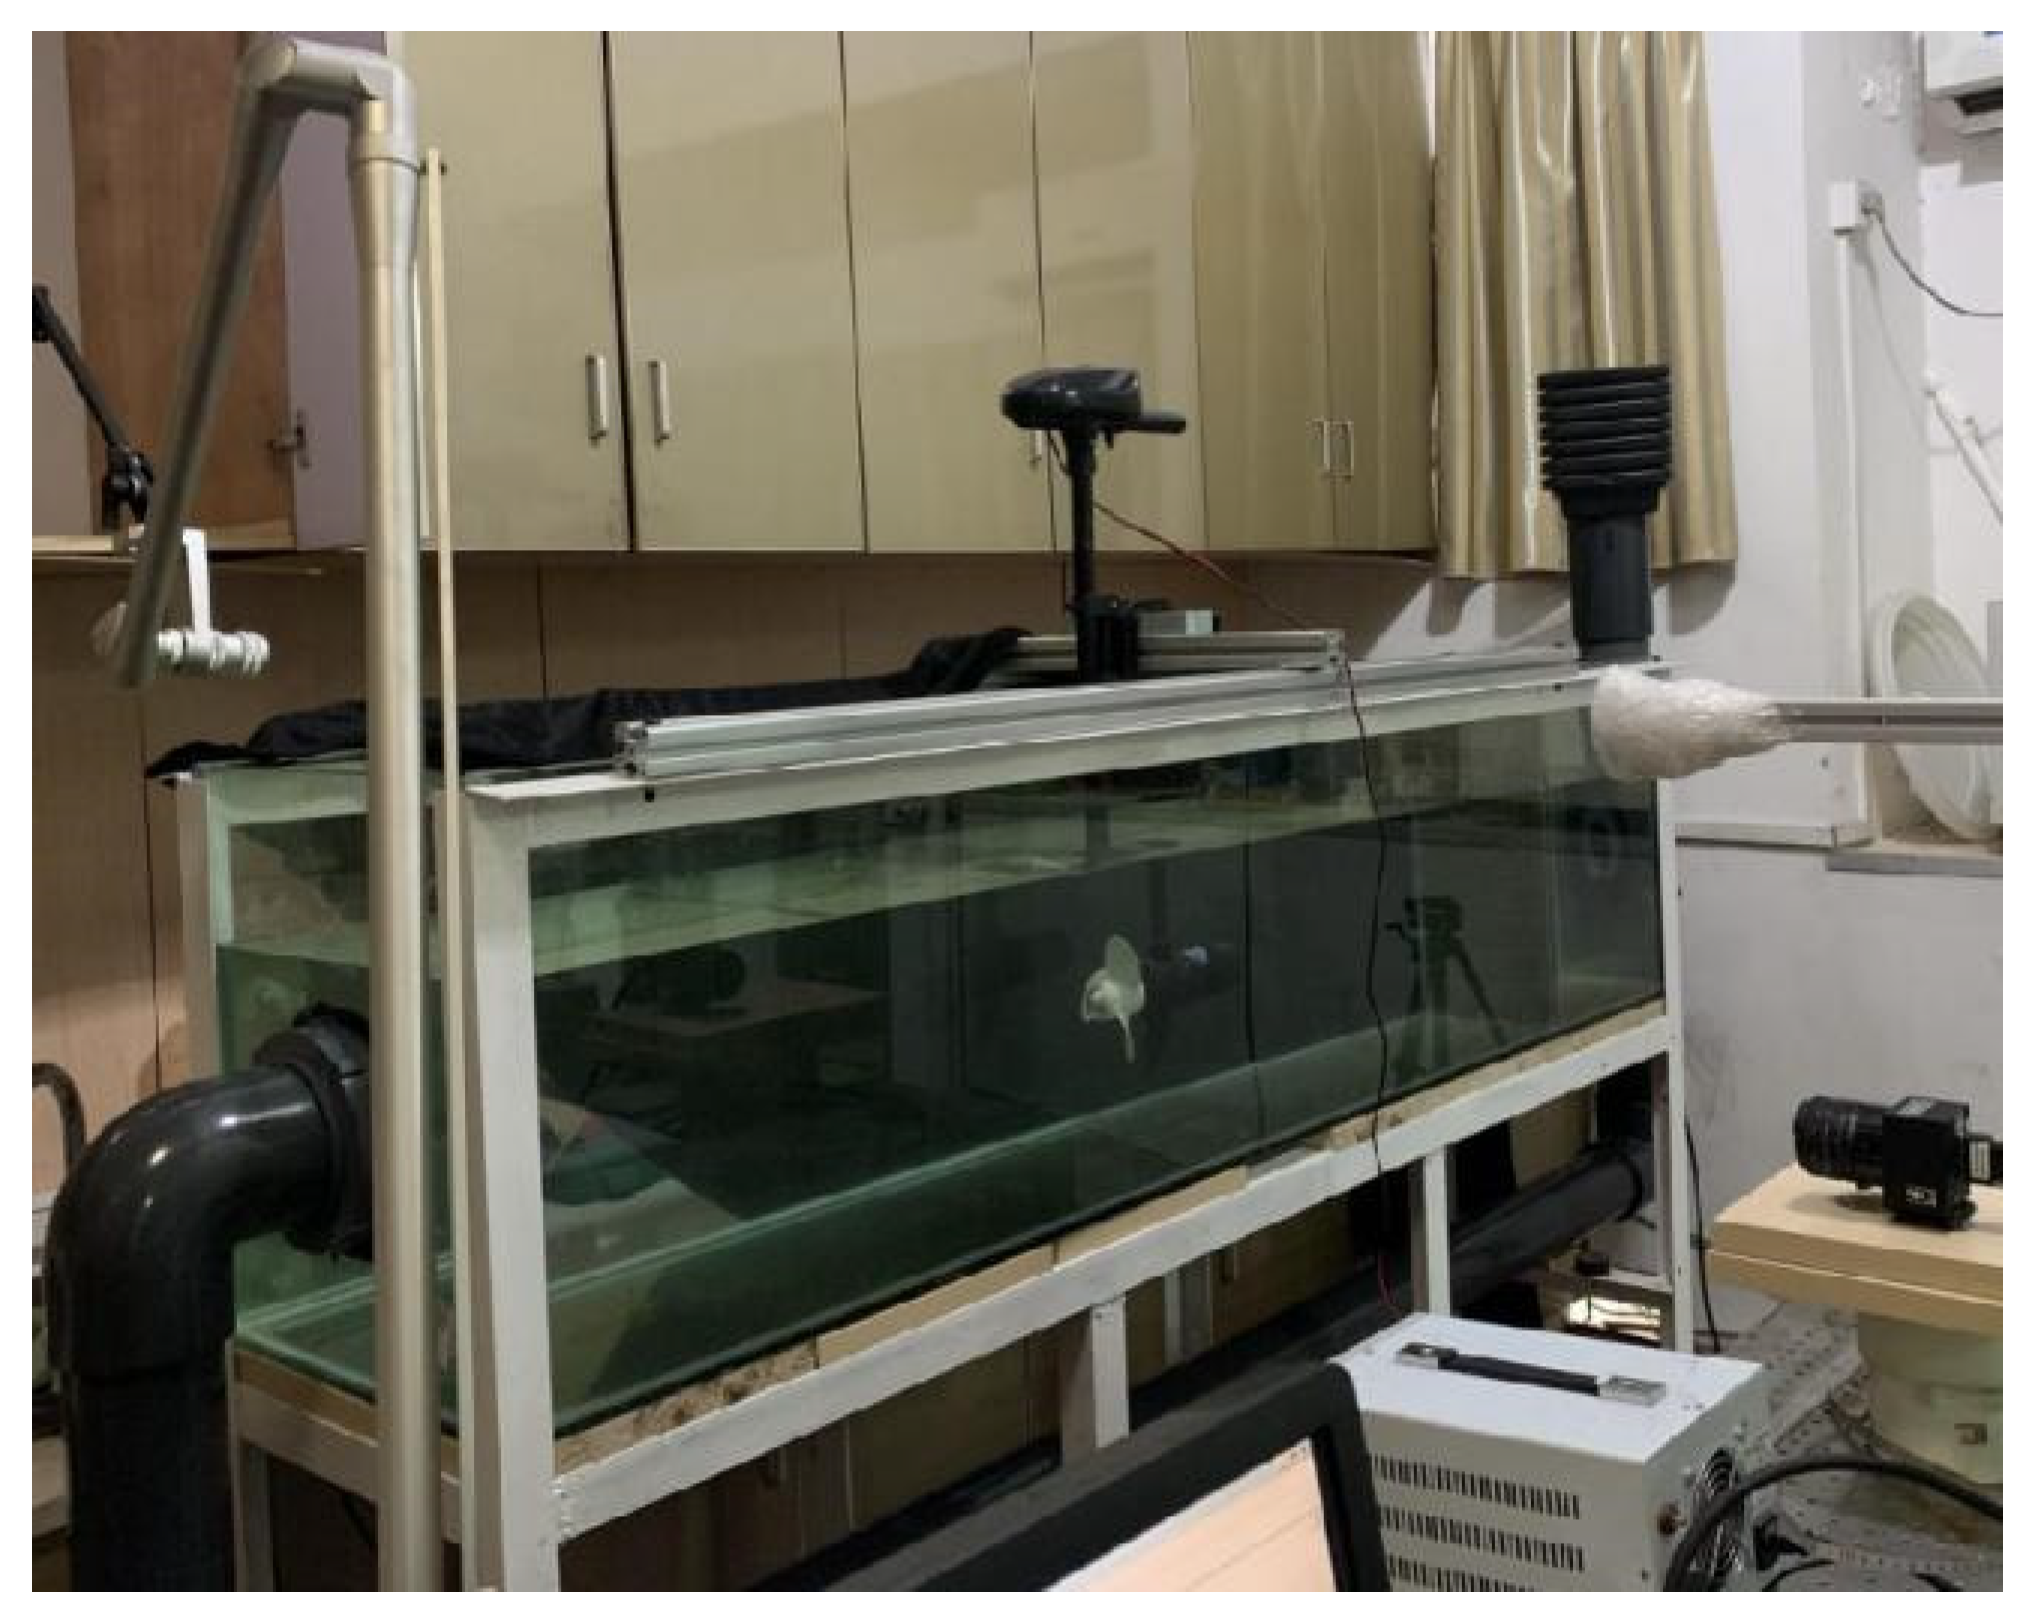
Figure 12.
Comparison between experimental results and simulation results. (a) Conventional propeller, PIV. (b) Conventional propeller, CFD. (c) Propeller coated with the hydrophobic material, PIV. (d) Propeller coated with the hydrophobic material, CFD using 75% surface slip rate. (e) Propeller coated with the hydrophobic material, CFD using 25% surface slip rate. (f) Propeller coated with the hydrophobic material, CFD using 50% surface slip rate. (g) Propeller coated with the hydrophobic material, CFD using 100% surface slip rate.


Table 1.
Propeller geometric parameters.
| Number of Blades | Diameter, m | Solidity | Hub Ratio |
|---|---|---|---|
| 3 | 0.1 | 0.2141 | 0.113 |
Table 2.
Boundary conditions of walls with different surface slip rates.
| Propeller Surface Slip Rate | Surface Slip Condition Setting |
|---|---|
| 0% or non-slip | S1, S2, S3, S4 non-slip |
| 25% | S1 free slip; S2, S3, S4 non-slip |
| 50% | S1, S3 non-slip; S2, S4 free slip |
| 75% | S1 non-slip; S2, S3, S4 free slip |
| 100% | S1, S2, S3, S4 free slip |
Table 3.
Working conditions of numerical simulations.
| Working Condition | Speed Coefficient | Rotating Speed, r/min |
|---|---|---|
| Case 1 | 0.3 | 300 |
| Case 2 | 0.3 | 600 |
| Case 3 | 0.3 | 900 |
| Case 4 | 0.3 | 1200 |
| Case 5 | 0.5 | 300 |
| Case 6 | 0.5 | 600 |
| Case 7 | 0.5 | 900 |
| Case 8 | 0.5 | 1200 |
| Case 9 | 0.7 | 300 |
| Case 10 | 0.7 | 600 |
| Case 11 | 0.7 | 900 |
| Case 12 | 0.7 | 1200 |
| Case 13 | 0.9 | 300 |
| Case 14 | 0.9 | 600 |
| Case 15 | 0.9 | 900 |
| Case 16 | 0.9 | 1200 |
Table 4.
Propeller efficiency obtained from CFD results.
| Propeller Rotating Speed n, (r/min) | Advance Coefficient J | Efficiency, % | ||||
|---|---|---|---|---|---|---|
| Surface Slip Rate | ||||||
| Non-Slip | 25% | 50% | 75% | 100% | ||
| 300 | 0.3 | 26.04 | 26.08 | 26.13 | 26.35 | 26.22 |
| 300 | 0.5 | 41.27 | 41.35 | 41.44 | 41.86 | 42.32 |
| 300 | 0.7 | 53.44 | 53.56 | 53.71 | 54.44 | 56.01 |
| 300 | 0.9 | 60.89 | 61.08 | 61.33 | 62.56 | 66.64 |
| 600 | 0.3 | 26.50 | 26.58 | 26.67 | 26.85 | 26.35 |
| 600 | 0.5 | 42.11 | 42.26 | 42.42 | 42.86 | 42.63 |
| 600 | 0.7 | 54.86 | 55.11 | 55.38 | 56.16 | 56.49 |
| 600 | 0.9 | 62.86 | 63.27 | 63.73 | 65.30 | 67.31 |
| 900 | 0.3 | 26.69 | 26.80 | 26.90 | 27.06 | 26.39 |
| 900 | 0.5 | 42.47 | 42.68 | 42.89 | 43.30 | 42.75 |
| 900 | 0.7 | 55.44 | 55.77 | 56.13 | 56.92 | 56.66 |
| 900 | 0.9 | 63.74 | 64.31 | 64.92 | 66.56 | 67.56 |
| 1200 | 0.3 | 26.79 | 26.91 | 27.03 | 27.18 | 26.41 |
| 1200 | 0.5 | 42.67 | 42.91 | 43.15 | 43.55 | 42.82 |
| 1200 | 0.7 | 55.74 | 56.15 | 56.58 | 57.34 | 56.75 |
| 1200 | 0.9 | 64.27 | 64.97 | 65.71 | 67.29 | 67.70 |
Table 5.
Efficiency improvement of the propellers assuming different surface slip rates from efficiency of the conventional propeller.
Table 5.
Efficiency improvement of the propellers assuming different surface slip rates from efficiency of the conventional propeller.
| Propeller Rotating Speed n, (r/min) | Advance Coefficient J | Efficiency Improvement, % | |||
|---|---|---|---|---|---|
| Surface Slip Rate | |||||
| 25% | 50% | 75% | 100% | ||
| 300 | 0.3 | 0.15 | 0.35 | 1.19 | 0.69 |
| 300 | 0.5 | 0.19 | 0.41 | 1.43 | 2.54 |
| 300 | 0.7 | 0.22 | 0.51 | 1.87 | 4.81 |
| 300 | 0.9 | 0.31 | 0.72 | 2.74 | 9.44 |
| 600 | 0.3 | 0.30 | 0.64 | 1.32 | −0.57 |
| 600 | 0.5 | 0.36 | 0.74 | 1.78 | 1.23 |
| 600 | 0.7 | 0.46 | 0.95 | 2.37 | 2.97 |
| 600 | 0.9 | 0.65 | 1.38 | 3.88 | 7.08 |
| 900 | 0.3 | 0.41 | 0.79 | 1.39 | −1.12 |
| 900 | 0.5 | 0.49 | 0.99 | 1.95 | 0.66 |
| 900 | 0.7 | 0.60 | 1.24 | 2.67 | 2.20 |
| 900 | 0.9 | 0.89 | 1.85 | 4.42 | 5.99 |
| 1200 | 0.3 | 0.45 | 0.90 | 1.46 | −1.42 |
| 1200 | 0.5 | 0.56 | 1.12 | 2.06 | 0.35 |
| 1200 | 0.7 | 0.74 | 1.51 | 2.87 | 1.81 |
| 1200 | 0.9 | 1.09 | 2.24 | 4.70 | 5.34 |
Table 6.
Pressure at sampling points on the conventional propeller blade.
| Suction, Pa | Pressure, Pa | Difference, Pa | |
|---|---|---|---|
| Point 1 | −2020.73 | 402.01 | 2422.74 |
| Point 2 | −2050.32 | 401.95 | 2452.27 |
| Point 3 | −2008.10 | 427.34 | 2435.44 |
| Point 4 | −2344.98 | 56.36 | 2401.34 |
| Point 5 | −1537.71 | 535.24 | 2072.95 |
Table 7.
Pressure at sampling points on the propeller blade coated with the hydrophobic material with 75% slip rate.
Table 7.
Pressure at sampling points on the propeller blade coated with the hydrophobic material with 75% slip rate.
| Suction, Pa | Pressure, Pa | Difference, Pa | |
|---|---|---|---|
| Point 1 | −1989.61 | 381.26 | 2370.87 |
| Point 2 | −2189.98 | 381.36 | 2571.34 |
| Point 3 | −2066.22 | 466.38 | 2532.60 |
| Point 4 | −2403.11 | 59.62 | 2462.73 |
| Point 5 | −1613.03 | 621.44 | 2234.47 |
Publisher’s Note: MDPI stays neutral with regard to jurisdictional claims in published maps and institutional affiliations. |
© 2022 by the authors. Licensee MDPI, Basel, Switzerland. This article is an open access article distributed under the terms and conditions of the Creative Commons Attribution (CC BY) license (https://creativecommons.org/licenses/by/4.0/).
Share and Cite
MDPI and ACS Style
Pan, H.; Zeng, R.; Tian, X.; Taalab, E.; Lv, M.; Zhu, Z. Performance of a Propeller Coated with Hydrophobic Material. J. Mar. Sci. Eng. 2022, 10, 236. https://doi.org/10.3390/jmse10020236
AMA Style
Pan H, Zeng R, Tian X, Taalab E, Lv M, Zhu Z. Performance of a Propeller Coated with Hydrophobic Material. Journal of Marine Science and Engineering. 2022; 10(2):236. https://doi.org/10.3390/jmse10020236
Chicago/Turabian StylePan, Huachen, Ran Zeng, Xiaoqing Tian, Elias Taalab, Ming Lv, and Zefei Zhu. 2022. "Performance of a Propeller Coated with Hydrophobic Material" Journal of Marine Science and Engineering 10, no. 2: 236. https://doi.org/10.3390/jmse10020236
Note that from the first issue of 2016, this journal uses article numbers instead of page numbers. See further details here.