Using Colony Monitoring Devices to Evaluate the Impacts of Land Use and Nutritional Value of Forage on Honey Bee Health


1
U.S. Geological Survey Northern Prairie Wildlife Research Center, Jamestown, ND 58401, USA
2
U.S. Geological Survey Fort Collins Science Center, Fort Collins, CO 80526, USA
3
U.S. Geological Survey Leetown Science Center, Kearneysville, WV 25430, USA
*
Author to whom correspondence should be addressed.
Agriculture 2018, 8(1), 2; https://doi.org/10.3390/agriculture8010002
Submission received: 30 October 2017
/
Revised: 1 December 2017
/
Accepted: 18 December 2017
/
Published: 25 December 2017
(This article belongs to the Special Issue Pollination and Agriculture)
Abstract
:Colony monitoring devices used to track and assess the health status of honey bees are becoming more widely available and used by both beekeepers and researchers. These devices monitor parameters relevant to colony health at frequent intervals, often approximating real time. The fine-scale record of hive condition can be further related to static or dynamic features of the landscape, such as weather, climate, colony density, land use, pesticide use, vegetation class, and forage quality. In this study, we fit commercial honey bee colonies in two apiaries with pollen traps and digital scales to monitor floral resource use, pollen quality, and honey production. One apiary was situated in low-intensity agriculture; the other in high-intensity agriculture. Pollen traps were open for 72 h every two weeks while scales recorded weight every 15 min throughout the growing season. From collected pollen, we determined forage quantity per day, species identity using DNA sequencing, pesticide residues, amino acid content, and total protein content. From scales, we determined the accumulated hive weight change over the growing season, relating to honey production and final colony weight going into winter. Hive scales may also be used to identify the occurrence of environmental pollen and nectar dearth, and track phenological changes in plant communities. We provide comparisons of device-derived data between two apiaries over the growing season and discuss the potential for employing apiary monitoring devices to infer colony health in the context of divergent agricultural land use conditions.
Keywords:
honey bee; agriculture; pollen trap; hive scale; Northern Great Plains; grassland; Apis mellifera1. Introduction
Commercial honey bee colonies responsible for the majority of honey production and pollination services are irrevocably embedded in agricultural landscapes across the US during the growing season. Such landscapes may provide benefits and costs for beekeepers and their honey bees, potentially providing ample nutritional provisions to support colony growth and health [1,2,3], while also posing risk via pesticide exposure and the impacts of ongoing habitat change and loss [2,4,5,6]. Clarification of the impacts of land use on the health of honey bees is needed to determine the mechanistic links between existing land use, potential benefits of pollinator habitat enhancement and establishment, and impacts on the resulting ecosystem services provided by pollinators. Discerning these links will provide policy makers and land managers with improved information on which to base policy and management decisions in the field.
The availability of abundant and quality nutritional resources [7,8,9] and overall landscape quality [2,10,11,12] has been demonstrated to differentially impact the health of individual bees and honey bee colonies. Furthermore, large-scale land use patterns occurring among agro-ecosystems in the Northern Great Plains (NGP) region of the US, a critical region for beekeeping affecting national crop production, differentially influence the survival, honey production and health of honey bee colonies [2,10]. Beekeepers in this region cue into, and deploy apiaries near, landscape features shown to lead to better colony performance and survival [6]. Specific metrics related to health, and influenced by overall land use and resource availability, include food (pollen and nectar) collection [2,10], diversity of honey bee-collected pollen [8,13], the amount and expression of nutritional and immune related markers (e.g., protein, lipids, vitellogenin, anti-microbial peptides) [2,7,8,9,11,12,14], oxidative stress and life expectancy of individual bees [8,15], and differential pesticide exposure profiles [4,5,13].
Studies using colony monitoring devices to estimate and assess in-colony parameters have focused on documenting and describing what can be captured with such devices: weight change, temperature, humidity, vibration, acoustics, and forager traffic in and out of colonies (e.g., [16,17,18,19]). Previous work has provided proof-of-concept for the utility of the devices as management tools, and to indirectly assess the impacts of some environmental factors such as timing of nectar [20] and pollen flows [21], the identity of main foraged plant taxa [22,23], and most recently in relation to environmental pesticide exposure and colony health parameters [24]. Some caution should be exercised, though, when considering the wide-scale utilization of pollen traps, as recent work has shown that the traps themselves may impact the occurrence of viral disease among colonies [25]. Taken together, such studies effectively demonstrate the potential utility of the technology and devices, but little work has yet been done to apply them in field settings toward addressing pertinent ecological questions.
Here, we compare how data derived solely from passive colony monitoring devices relates to differential land use, using apiaries sited on opposite ends of an agroecosystem spectrum; one dominated by corn, soy, and wheat crops, and the other dominated by grassland habitat. Because abundant high-quality pollen and nectar are essential for colony population growth, health, and survival, we hypothesized that differences in the availability of nutritional resources and pesticide exposure profiles within the context of divergent land use would be observable and quantifiable using passive monitoring devices, even when located within the same general ecoregion.
2. Methods
2.1. Apiary Locations
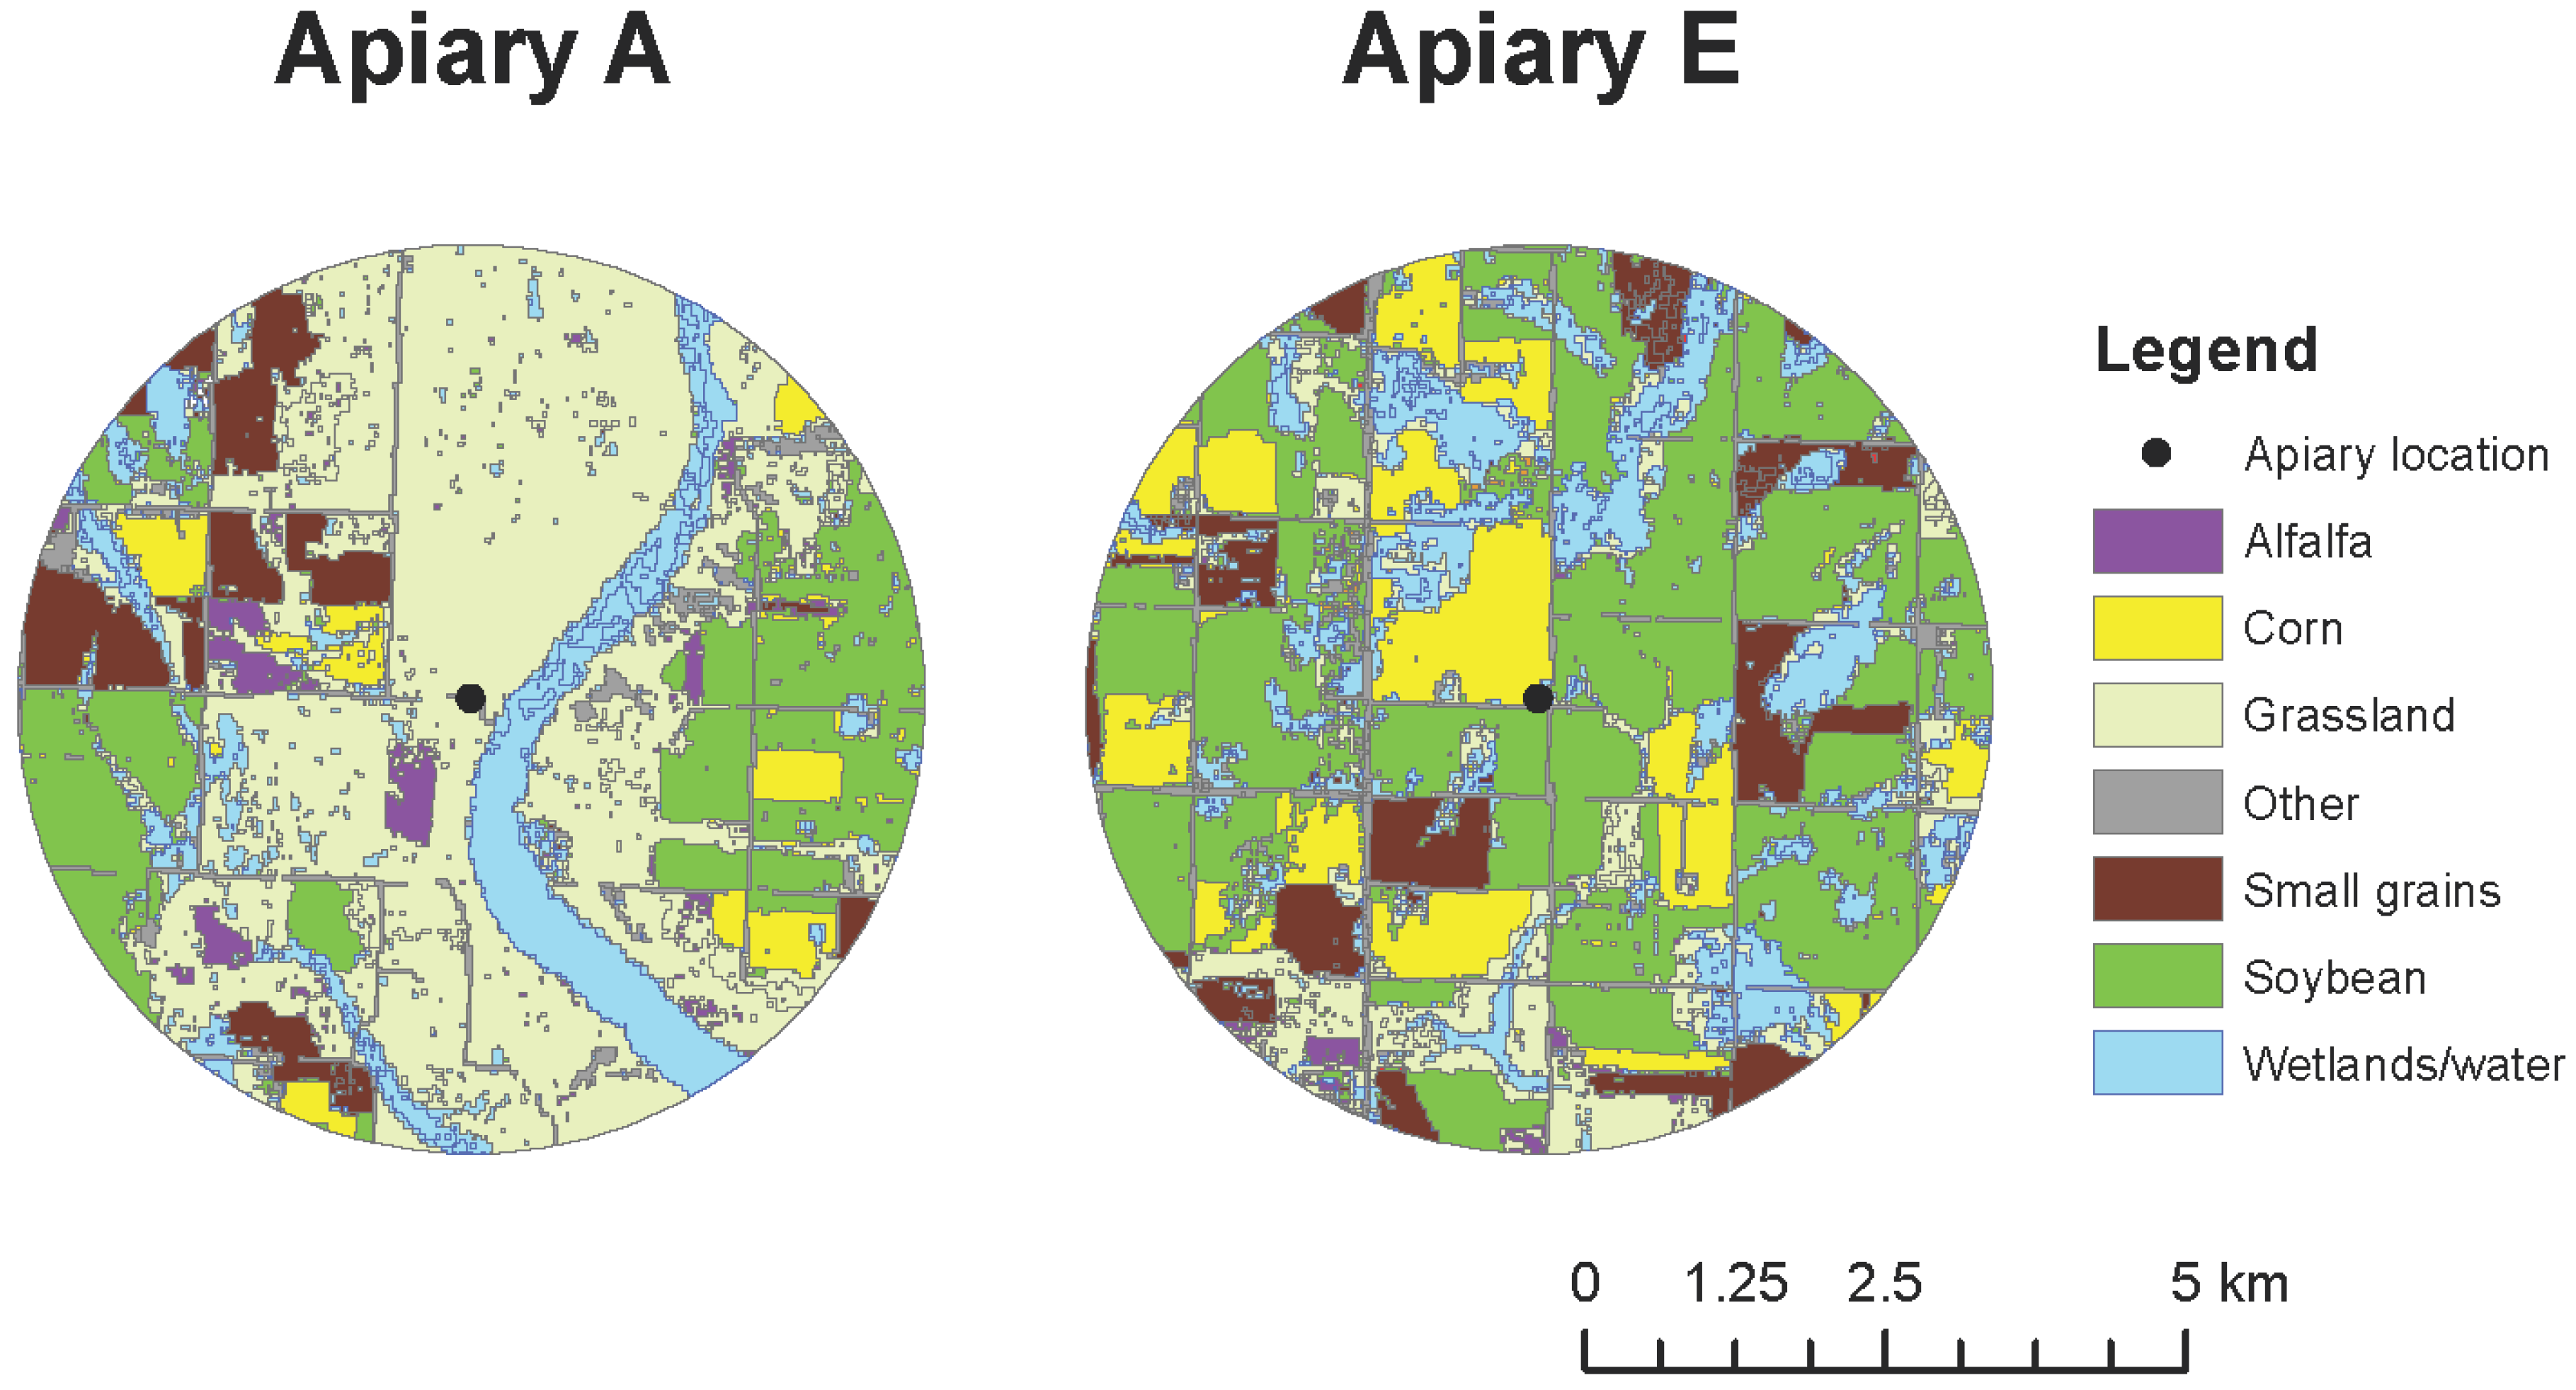
The study was conducted in two apiaries (Figure 1) in the Prairie Pothole Region (PPR) of North Dakota. Land-use conditions surrounding apiaries varied substantially (Figure 1). Land use was quantified within a 4-km radius around each apiary site using the Cropland Data Layer [26]. The two study apiaries (A and E) were previously part of a 2010–2012 large-scale landscape study examining the influence of agricultural land use on the health, productivity, and survival of honey bee colonies [2,10]; hence their legacy labels as Apiaries A and E. These two apiaries, embedded in an intensively cultivated agro-ecosystem, are characterized by dramatically divergent overall land use and habitat quality in their surrounding landscapes, despite their relatively close proximity in space.
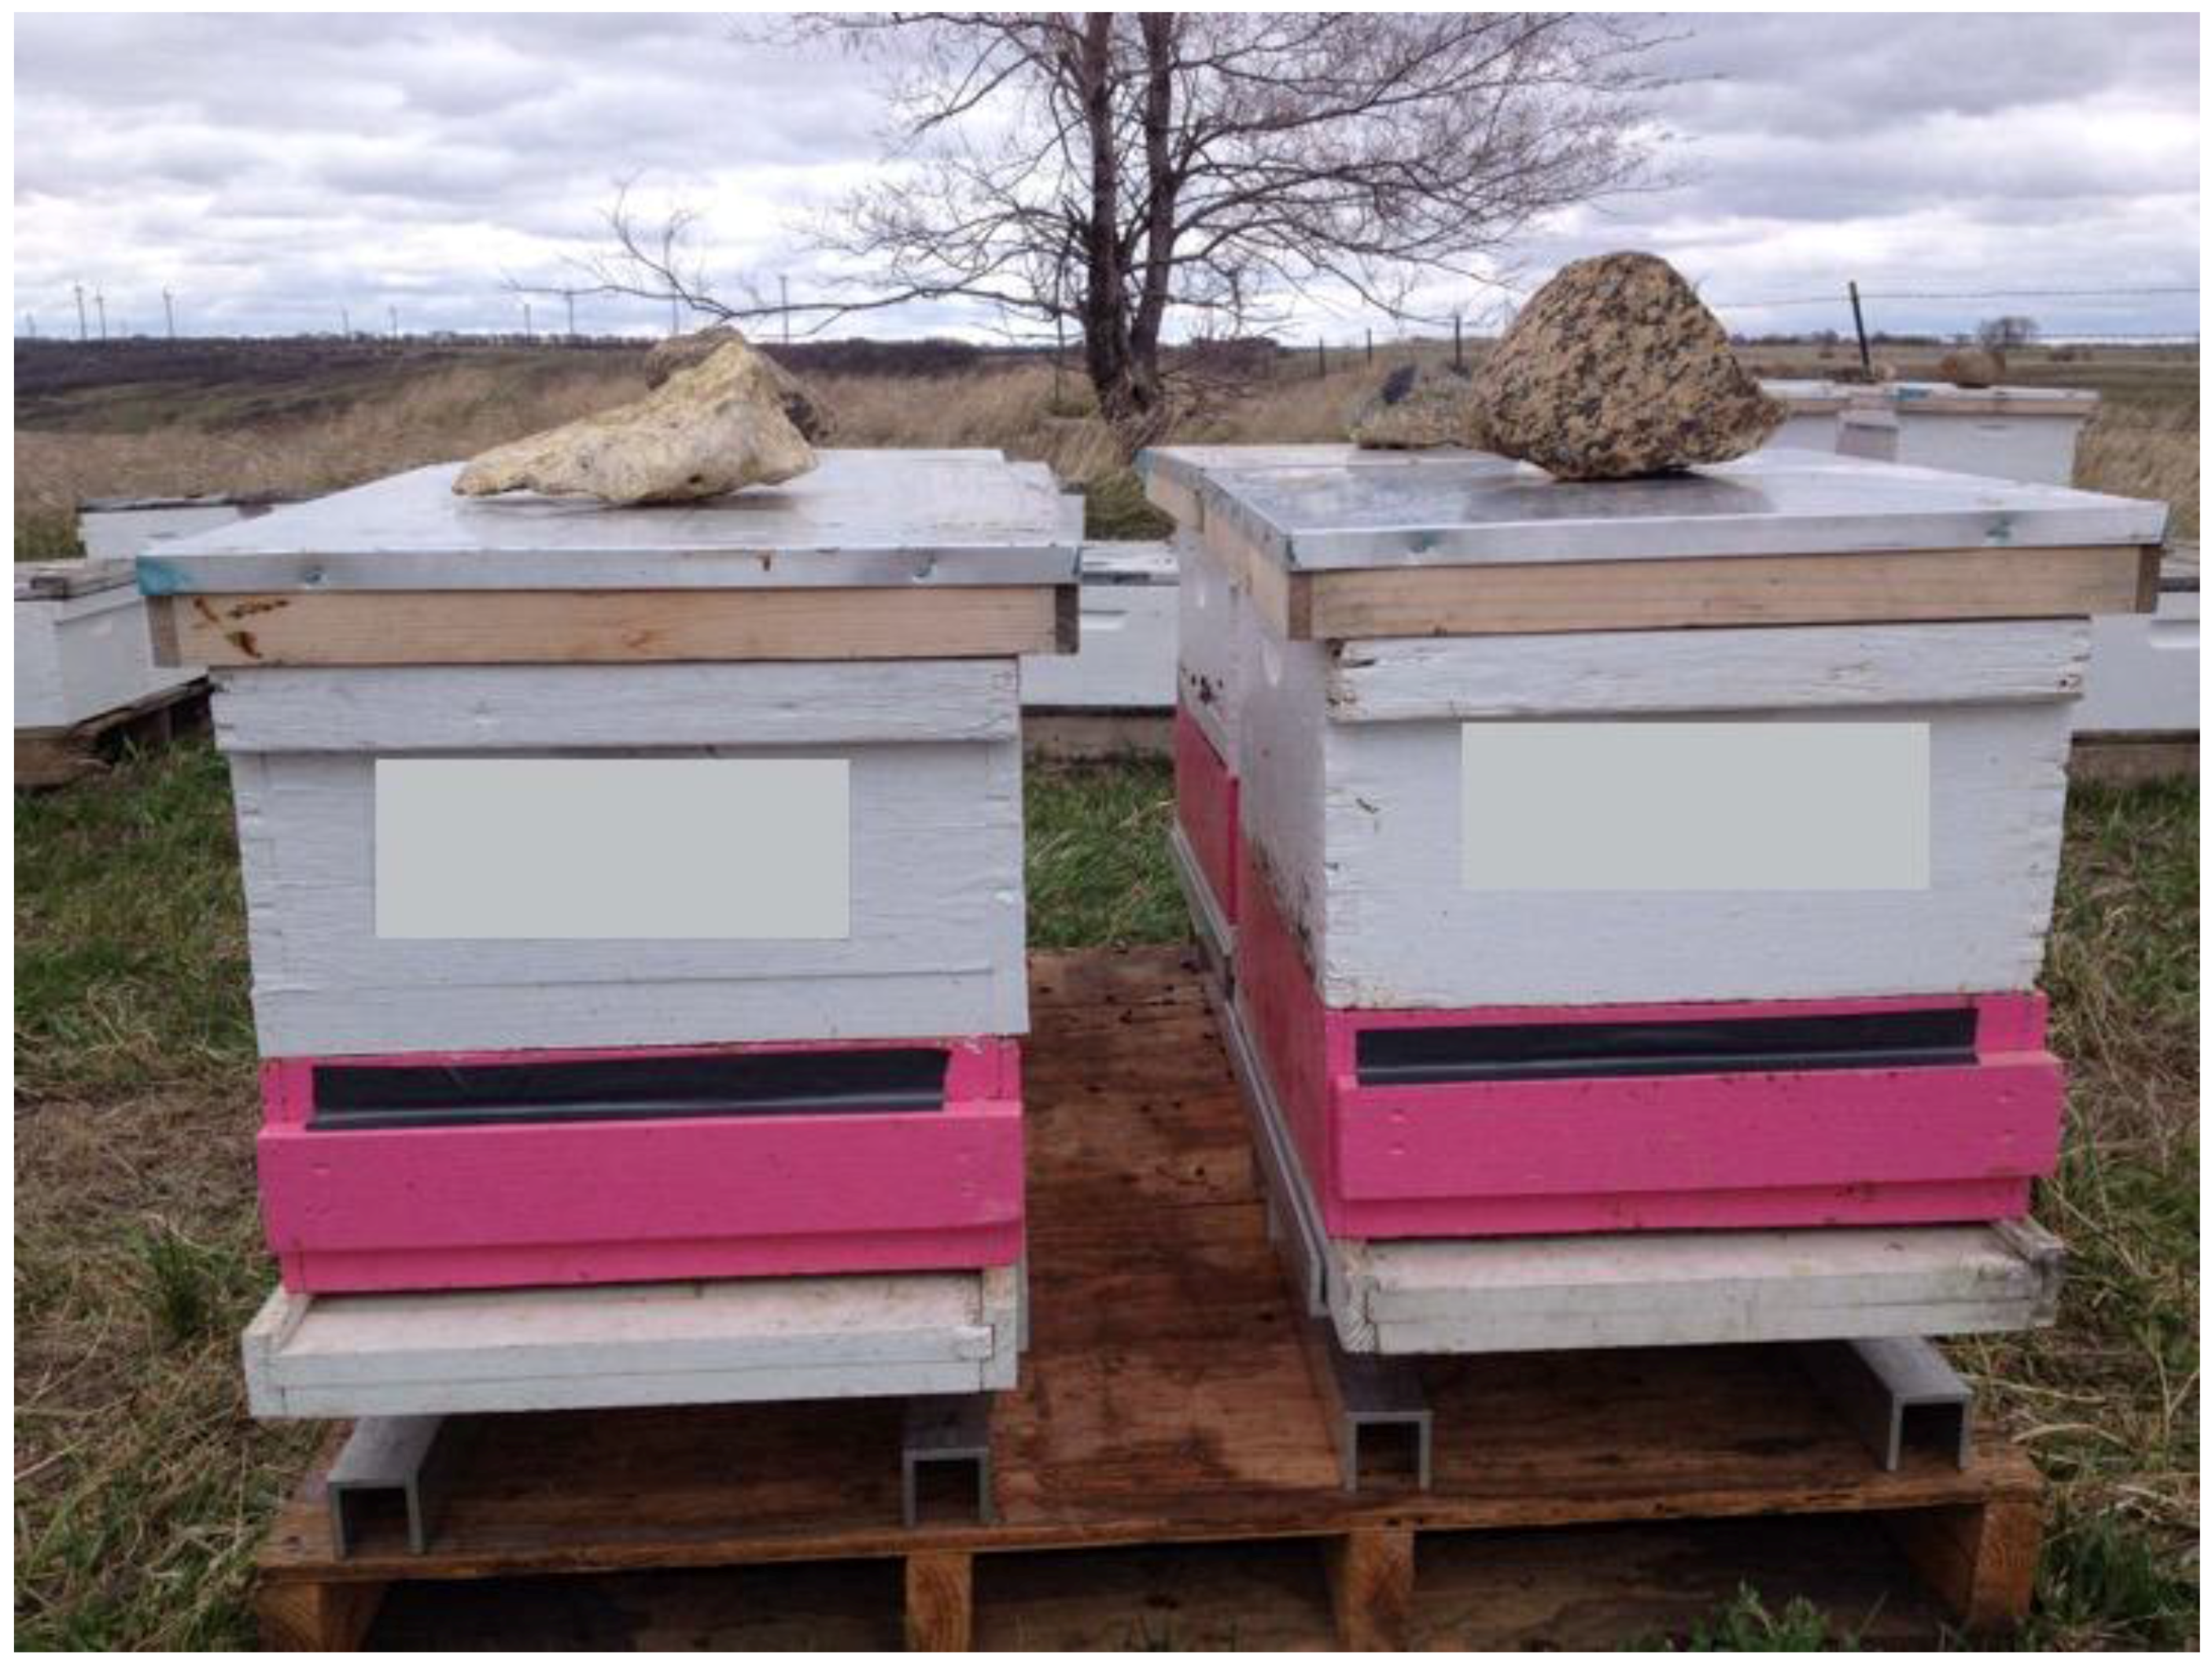
In 2014, colonies positioned in these two apiaries were subjected to an intensive monitoring and sampling effort (including being fitted with pollen traps and hive scales, described herein), and detailed analyses were conducted on the pollen (pollen quantity and quality, amino acid profiles, taxonomic identification of floral pollen sources, and analysis of pesticide residues) in association with hive-scale data collection. The collaborating beekeeper conducted his typical management practices with respect to disease and parasite control treatments and nutritional supplementation (sugar syrup and pollen substitute); wherein all research colonies were treated identically. In each apiary, eight colonies were fitted with pollen traps and pollen was collected every 1–2 weeks during May through September from four of those colonies to minimize the negative impacts of repeatedly robbing pollen from all eight colonies. Each colony’s trapped pollen was kept separate for analyses. The same eight colonies were also fitted with hive scales that automatically collected and stored hive weight every 15 min over the sampling period (Figure 2).
2.2. Pollen Collection and Protein Content Analyses
Pollen was collected in the field and stored at −20 °C until analyses occurred. For each colony and date within each apiary, the total fresh weight of collected pollen per unit time was determined. Subsequently, from this bulk pollen sample, 5 g pollen from each colony was crushed with a mortar and pestle, dried at 60 °C for 60 h, and sent to Midwest Labs in Omaha, NE for analysis to determine crude protein content (AOAC 990.03) and, for pollen from one colony and three sample dates at each apiary, amino acid content (AOAC 994.12). We only analyzed pollen from a subset of colonies and dates for amino acid composition due to the high cost of sample analysis. Crude protein and amino acid content are reported as the percent dry weight in the sample.
2.3. Floral Pollen Source Identification
We used DNA sequencing of the internal transcribed spacer region of the nuclear ribosomal locus to assign pollen operational taxonomic units (OTUs) to specific plant taxa. The methods have been previously detailed and published [23,27]. Briefly, approximately 2 g fresh pollen was crushed using a mortar and pestle and dried at 60 °C for 60 h, and extraction of pollen DNA was done using a modified Doyle’s method [27,28] at the USGS Leetown Science Center, Kearneysville, WV. Library preparation was completed following Illumina’s 16S Metagenomic Sequencing Library Preparation (CT #: 1504423 Rev. B). An Illumina MiSeq was used to amplify and sequence the ITS of nuclear ribosomal locus using the 2 × 300 bp paired-end run protocol. Operational taxonomic units (OTUs) were assigned with the lowest common ancestor (LCA) approach using Basic Local Alignment Search Tool (BLAST) bit score as the similarity metric and the National Center for Biotechnology Information (NCBI) nucleotide database as the taxonomic reference. An LCA threshold of 3% was used, i.e., the OTU was assigned to the lowest common ancestor of all matched taxa within 3% of the best bit score for that OTU. Abundances of OTUs with the same taxonomic assignment were combined, and then taxa with fewer total reads in a given sample were removed from that sample, as low-abundance taxonomic assignments are more likely to derive from environmental background or sequence/assignment errors. Results were expressed as the log-transformed counts-per-million (cpm), calculated by dividing each taxon’s read counts within a library (pollen from a colony on a date) by the total number of reads in the library and multiplying by 106.
2.4. Pollen Pesticide Residue Analysis
An additional 3 g of fresh pollen was sent to the Environmental Protection Agency (EPA) Biological and Economic Analysis Division in Fort George Meade, Maryland for pesticide residue analysis. Detailed methodology can be found in [29]. Pollen samples were screened for 23 common insecticides, herbicides, fungicides, and metabolites. Results were reported back in ppb (or not detected) for each pollen sample representative of a colony by date per pesticide residue.
2.5. Hive Weight Data Collection and Analysis
We deployed hive scales that captured colony weight throughout the growing season. Data were stored on a HOBO data logger connected to the hive scale load sensor. Data from each scale over the entire growing season were downloaded once in the field in October. Prior to final data analysis, sudden weight gains and losses (change of ≤−1 kg or ≥1 kg over a 15-min period) were identified and removed. Rapid changes in hive weight are often caused by beekeepers adding or removing honey super boxes or bricks on lids, and due to mass departure or return of foraging bees. Removal of these sudden weight changes provided a more accurate depiction of actual gains and losses primarily attributable to acquisition and consumption of nutritional resources. Further, due to the inherent hour-to-hour and day-to-day stochasticity associated with hive weight changes, for each colony one data point was extracted per day (weight at 0:00 h when all bees were inside the colony) to quantify the change in weight from the initial status on 1 June. Analyses examining the interaction between apiary and date were conducted by week, wherein the average cumulative weight among all hive scales within an apiary per day were used (i.e., there were seven cumulative weight values within an apiary per week, one for each day).
2.6. Statistical Analyses
All statistical analyses were carried out in R [30]. Prior to considering temporal effects, i.e., repeated measures, we examined the overarching differences in responses between apiaries. We conducted t-tests to parse the characteristic differences in total pollen collection, mean crude protein content, and pesticide residues between the two sampled apiaries. This approach was employed initially because the overall effects of land use and forage quality and quantity on colonies among apiaries over the entire growing season were biologically relevant, particularly since land use (exerting its influence constantly throughout the study) was the overarching effect examined.
Subsequently, we evaluated temporal effects by examining response interactions by apiary and date using two-way ANOVA and Tukey Honest Significant Differences (HSD). For pollen taxonomic assignment data, we calculated two diversity indices (Shannon-Weiner diversity and Pielou’s evenness) to compare the overall diversity of pollen collected between the two apiaries (R, vegan package). Because of the non-normal distribution of the data (i.e., heavily zero-inflated due to a lack of detection of most taxa on any given date) we conducted a spearman ranked correlation analysis (R pspearman package) to compare the ranked distribution of detected taxa between apiaries on each date. This enabled us to examine whether dissimilar taxa were collected between apiaries over the season.
3. Results
3.1. Pollen-Derived Metrics between Apiary Locales
3.1.1. Pollen Quantity and Quality
The overall mean quantity of pollen collected was not different between apiaries (t = 0.53, df = 121.69, p = 0.60, 95% CI: −22.97, 39.72), whereas crude protein content of pollen was significantly different between apiaries (t = 6.38, df = 106.6, p < 0.0001, 95% CI: 2.43, 4.62), with colonies from Apiary A (the low agricultural intensity apiary) collecting pollen with higher crude protein content.
We also examined the interaction between apiary and date on pollen collection and crude protein content (Figure 3). For each response, there was a significant interaction between apiary and date (pollen collection: F18,105 = 3.79, p < 0.0001; crude protein: F15,75 = 3.77, p < 0.0001). In general, we observed more pollen being collected by colonies at Apiary A in spring; however, the trend switched by mid-July (Figure 3a), while pollen protein content was generally higher at Apiary A throughout the growing season (Figure 3b).
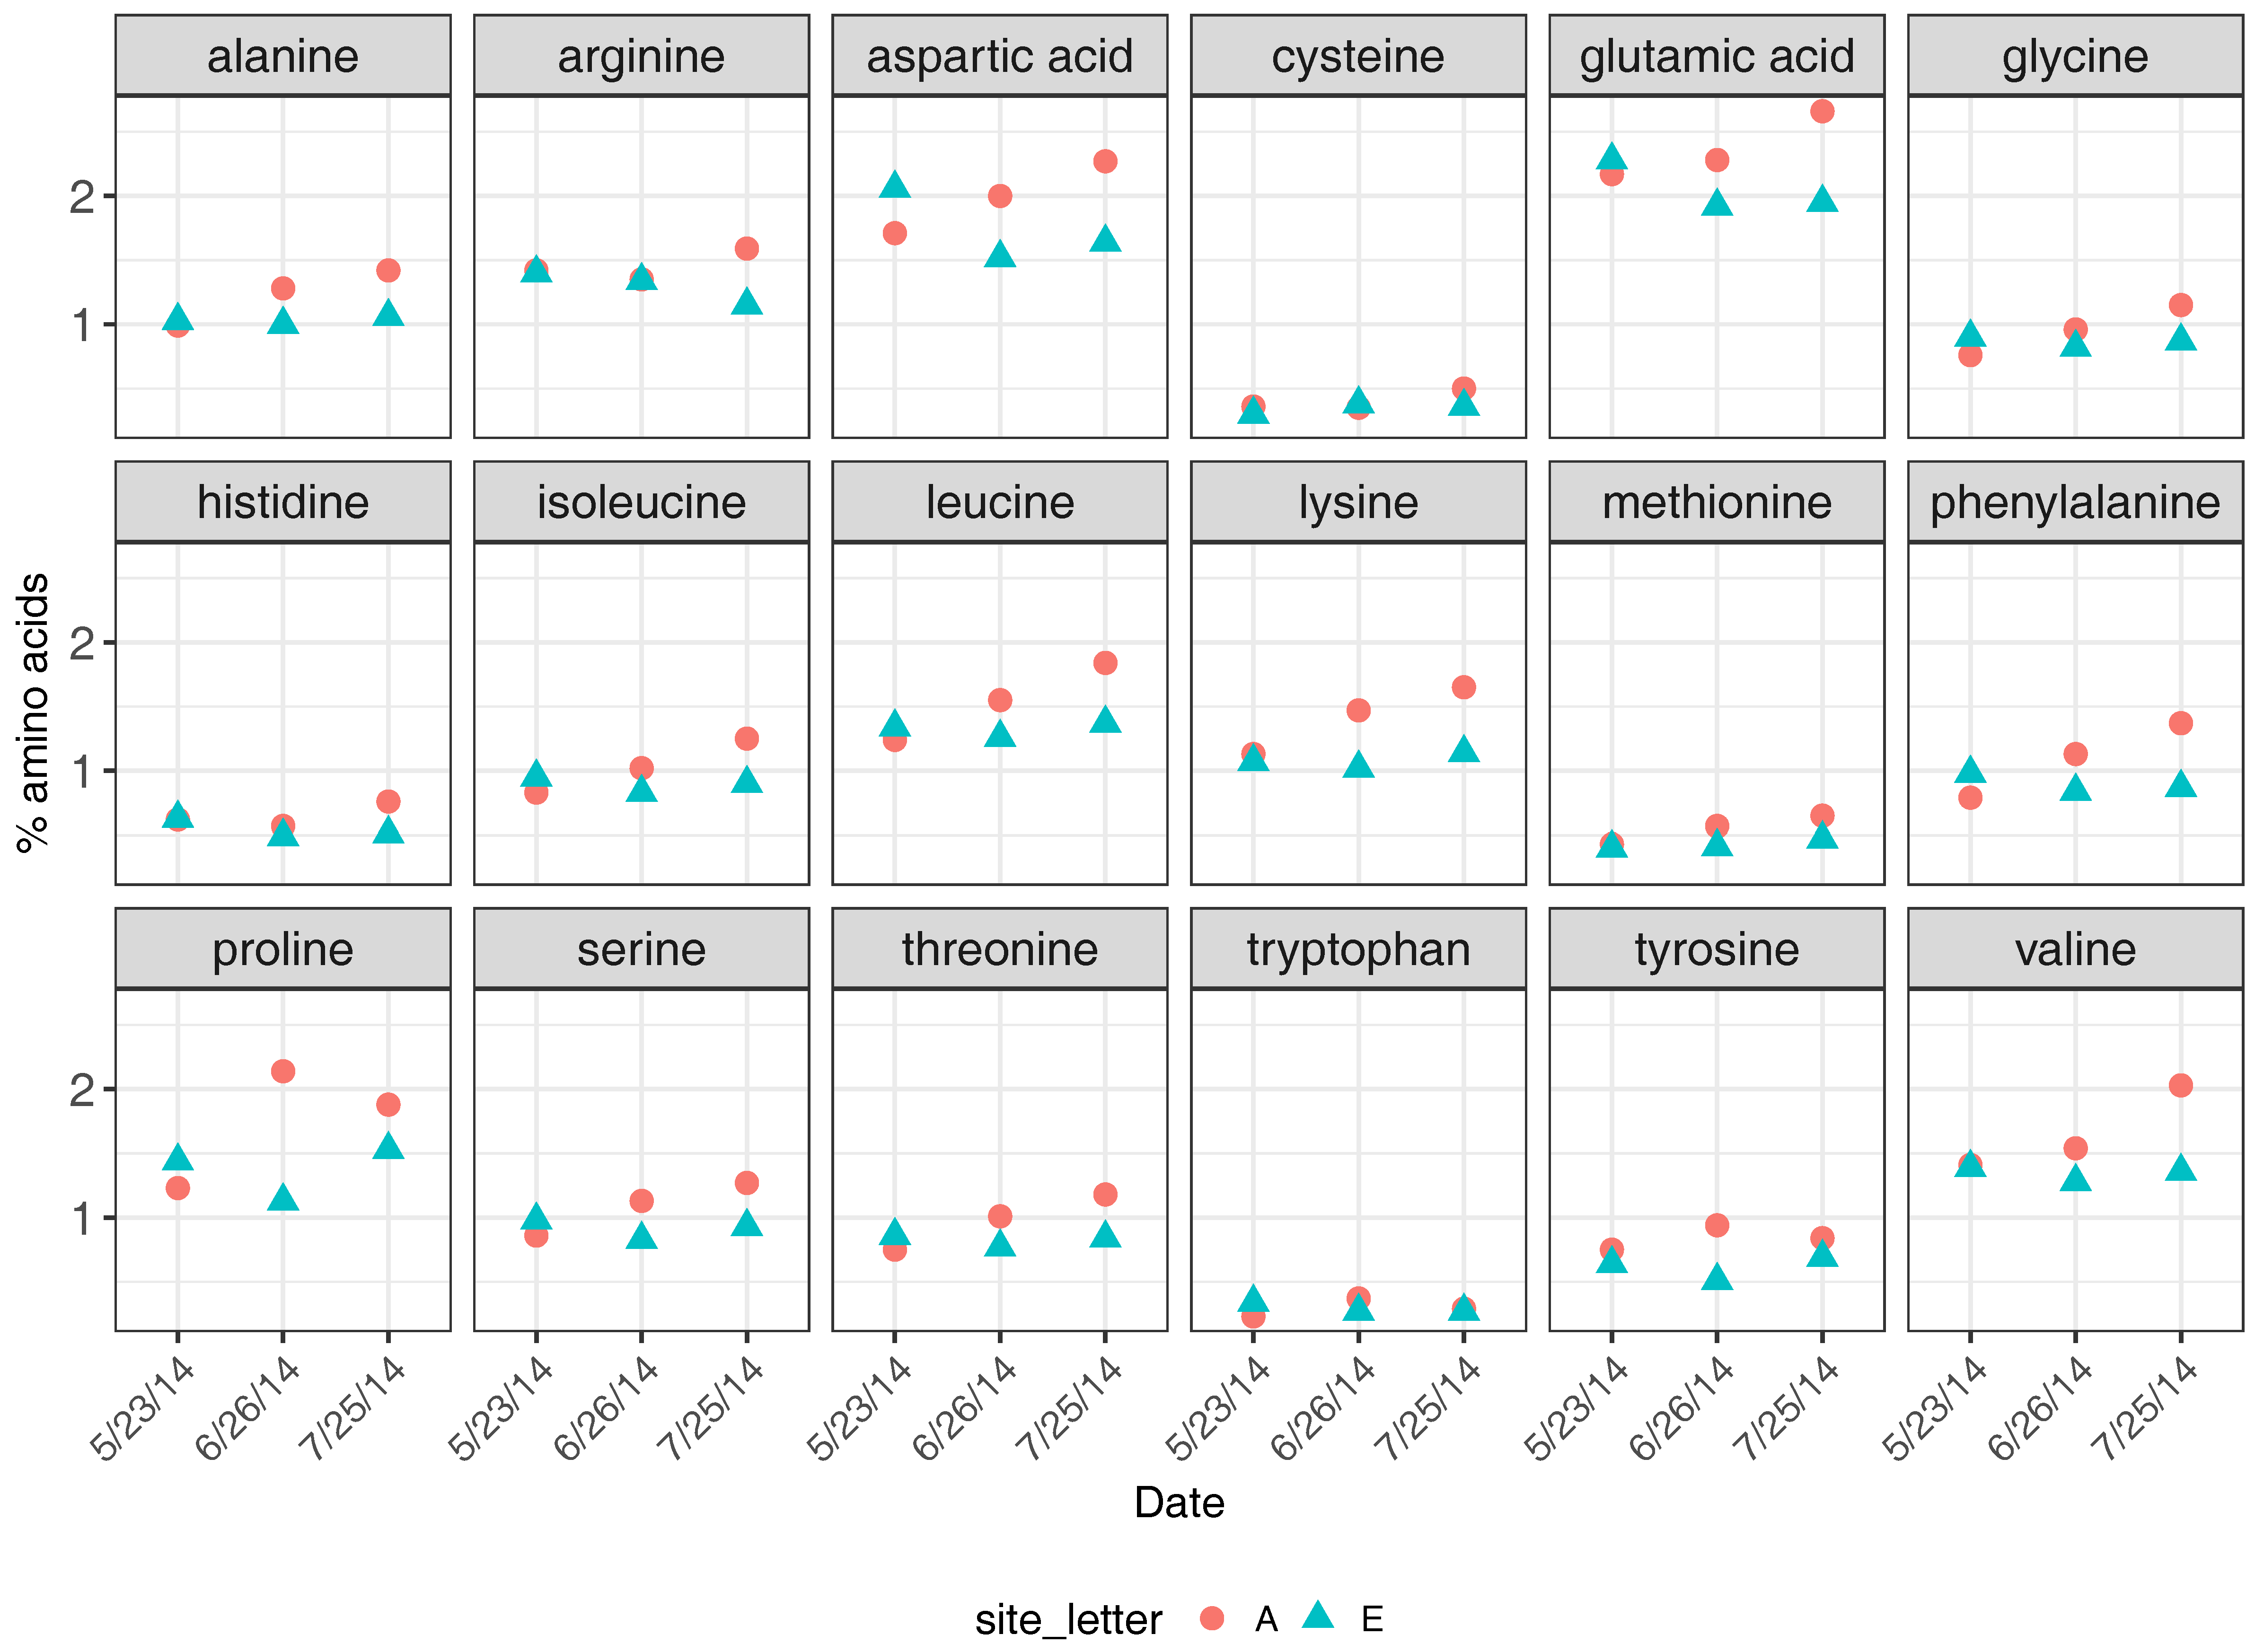
Amino acid profiles were determined on three dates from pollen samples recovered from each apiary (Figure 4). In addition to the higher crude protein content found in pollen collected by colonies at Apiary A, pollen from Apiary A also generally had higher percentage composition in the 18 amino acids analyzed. We were not able to statistically determine whether differences occurred in individual amino acid levels between apiary sites on specific dates because only one sample was analyzed from each apiary and date; however, trends suggest that little difference occurred between apiaries on each date, though perhaps levels were slightly higher in pollen collected from Apiary A (Figure 4). The overall percentage of amino acids were similar between apiaries across all sampling dates (May: t = −0.25, df = 18.8, p = 0.81; June: t = 1.31, df = 19, p = 0.21; July: t = 1.94, df = 18.1, p = 0.07).
3.1.2. Taxonomic Identification of Honey Bee-Collected Pollen
Between Apiaries A and E, 25 distinct families of plants were assigned in trapped pollen over the growing season (Table 1). At all taxonomic levels (family, genus, species) a greater total number of plant taxa were assigned from Apiary A compared to E. Pollen from the family Typhaceae was assigned from both apiary sites, but further taxonomic resolution was not determined.
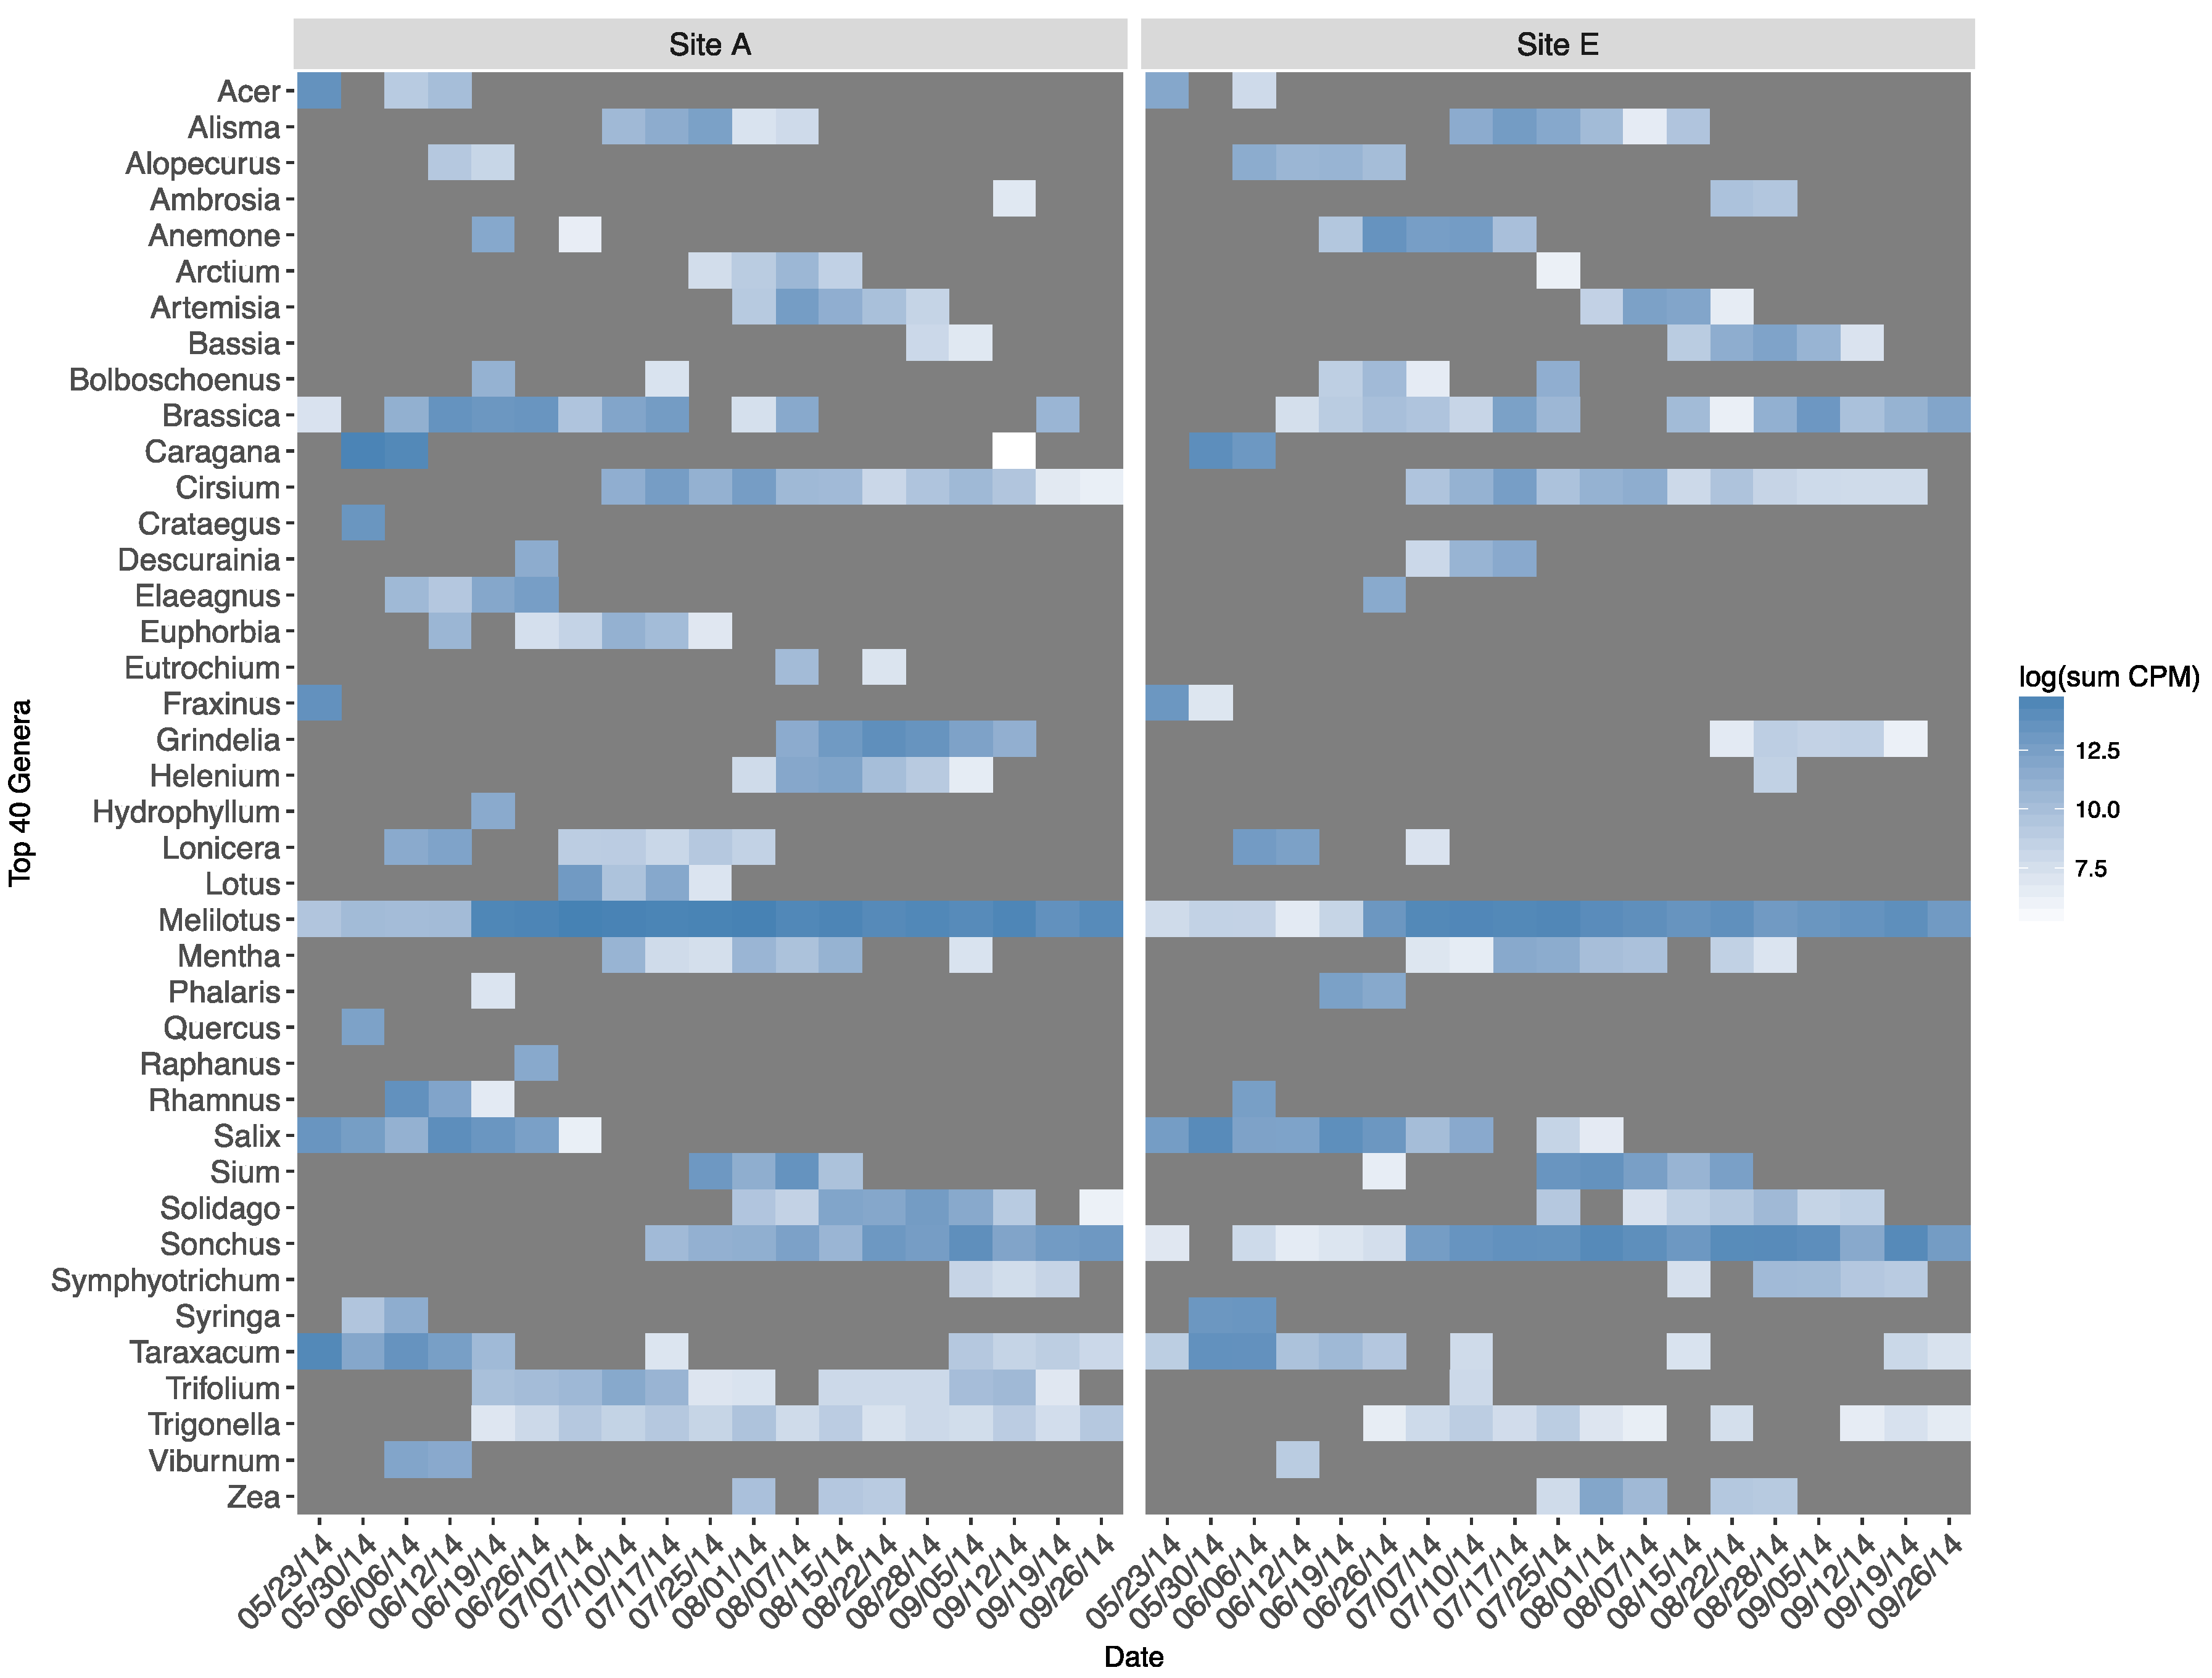
There was substantial overlap in the occurrence and phenological appearance of genera represented in forager-collected pollen between apiaries (Figure 5). This was the case, in particular, for the most ubiquitous volunteer taxa (e.g., Brassica, Cirsium, Melilotus, Solidago, Sonchus, Taraxacum, Trigonella). All assigned genera between apiaries by date can be found in Supplementary Materials Tables S1 and S2.
We also compared the overall diversity of forager-collected pollen by apiary. Taxonomic diversity of pollen was greatest from colonies at Apiary A compared to Apiary E (H: Apiary A = 4.00, Apiary E = 3.75). We also calculated Pielou’s evenness at each apiary and, despite differences in overall diversity, plant communities represented by pollen DNA read assignment were similarly even (Apiary A = 0.85, Apiary E = 0.86). Results of Spearman’s rank correlation analysis examining the ranked taxa in each apiary by date suggested that the ranked distribution of detected plant taxa between apiaries were consistently uncorrelated during the first half of the growing season (from approximately 23 May–17 July) but often correlated (p < 0.05) during the second half (Table 2).
3.1.3. Pesticide Residues in Honey Bee-Collected Pollen
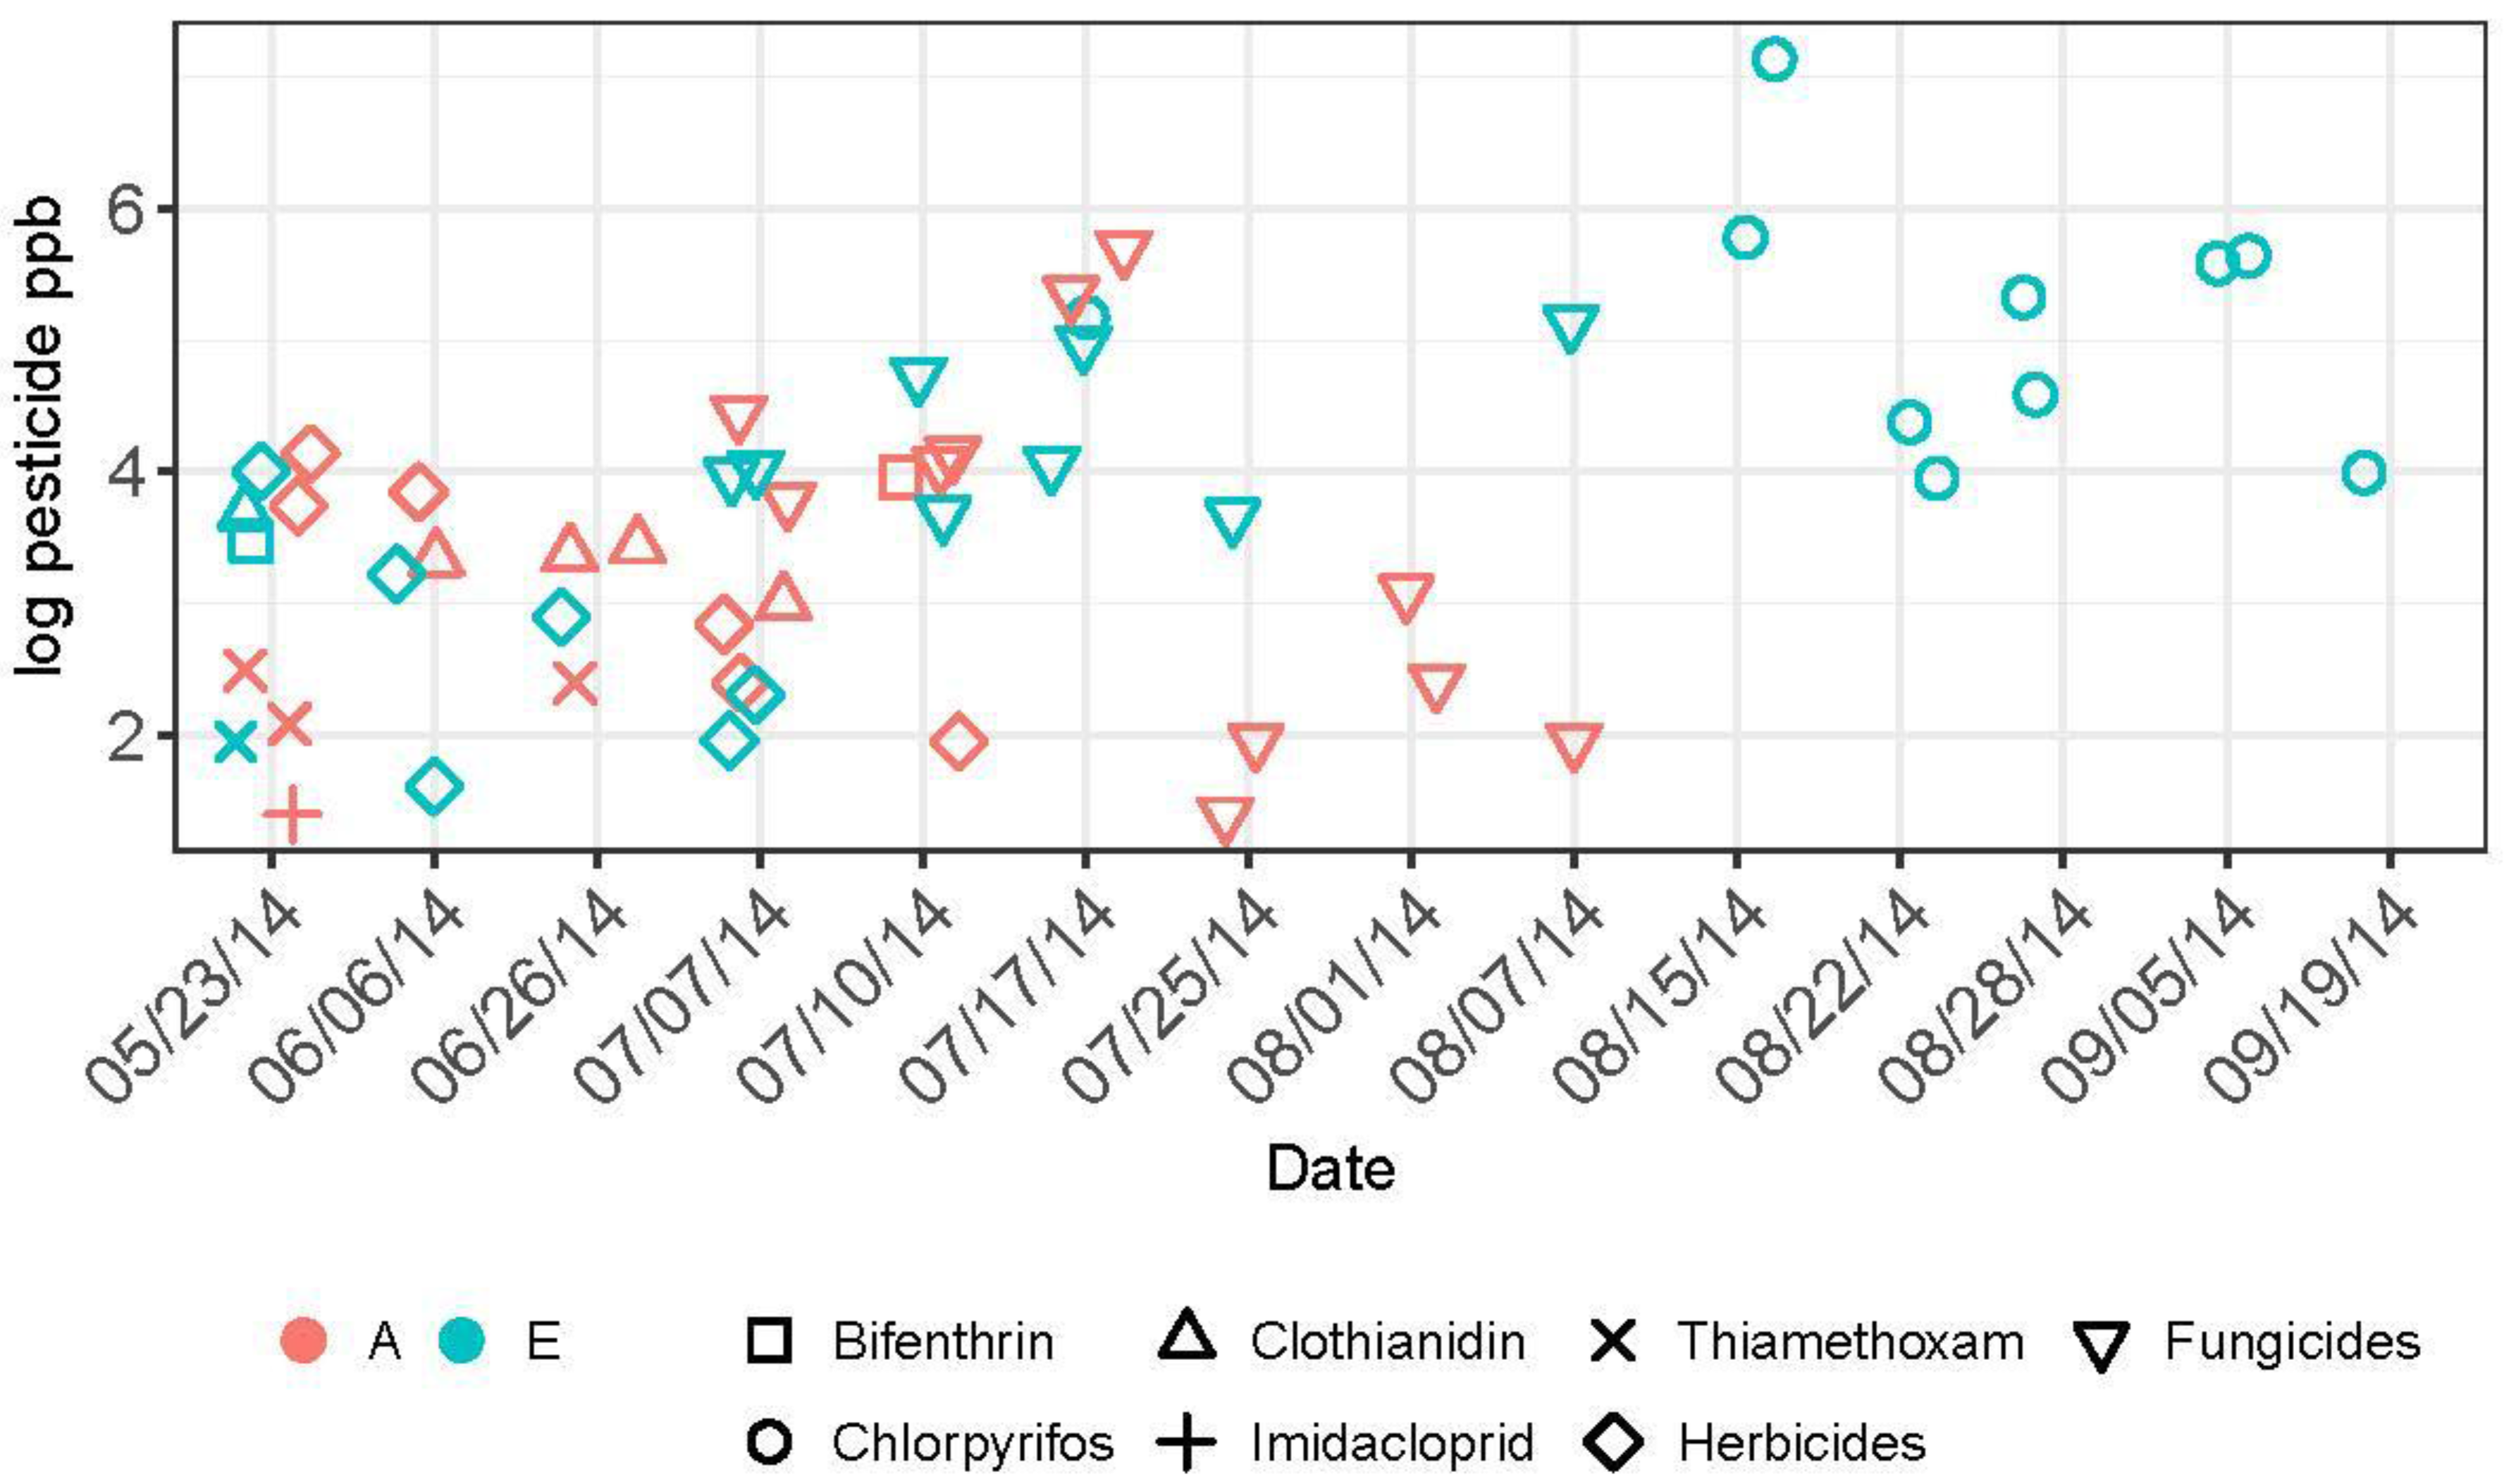
All pesticide residue data by site and date may be found in Supplementary Materials Table S3. Five insecticides in three classes (pyrethroid, organophosphate, and neonicotinoid), eight fungicides, and five herbicides comprised 63%, 30%, and 6% respectively, of the pesticide residues detected in honey bee-collected among the two study apiaries over the growing season. Overall, levels of these pesticides were significantly higher in pollen collected by honey bees at Apiary E (t = −2.11, df = 31.2, p = 0.04) compared to Apiary A. In particular, chlorpyrifos, an organophospate insecticide highly toxic to honey bees, was detected commonly and at elevated levels (sample range: 51–1260 ppb) in pollen from Apiary E, while not being found at detectable levels at all in pollen from Apiary A (Figure 6). Other insecticides included bifenthrin (detected once at each apiary), clothianidin (detected four times at A and once at E), imidacloprid (detected once at A), and thiamethoxam (detected 3 times at A and once at E). Temporal detection of insecticide residues varied between apiaries and among chemicals. Neonicotinoids were detected only between May and early July, and primarily occurred in pollen from Apiary A. Bifenthrin was detected in May and July from each apiary. Chlorpyrifos residues were first detected in early July and continued through the end of the sampling period. Herbicides were detected in May through early July, while fungicides began to be detected in early July through early August.
3.1.4. Colony Weight Change Measured by Hive Scales
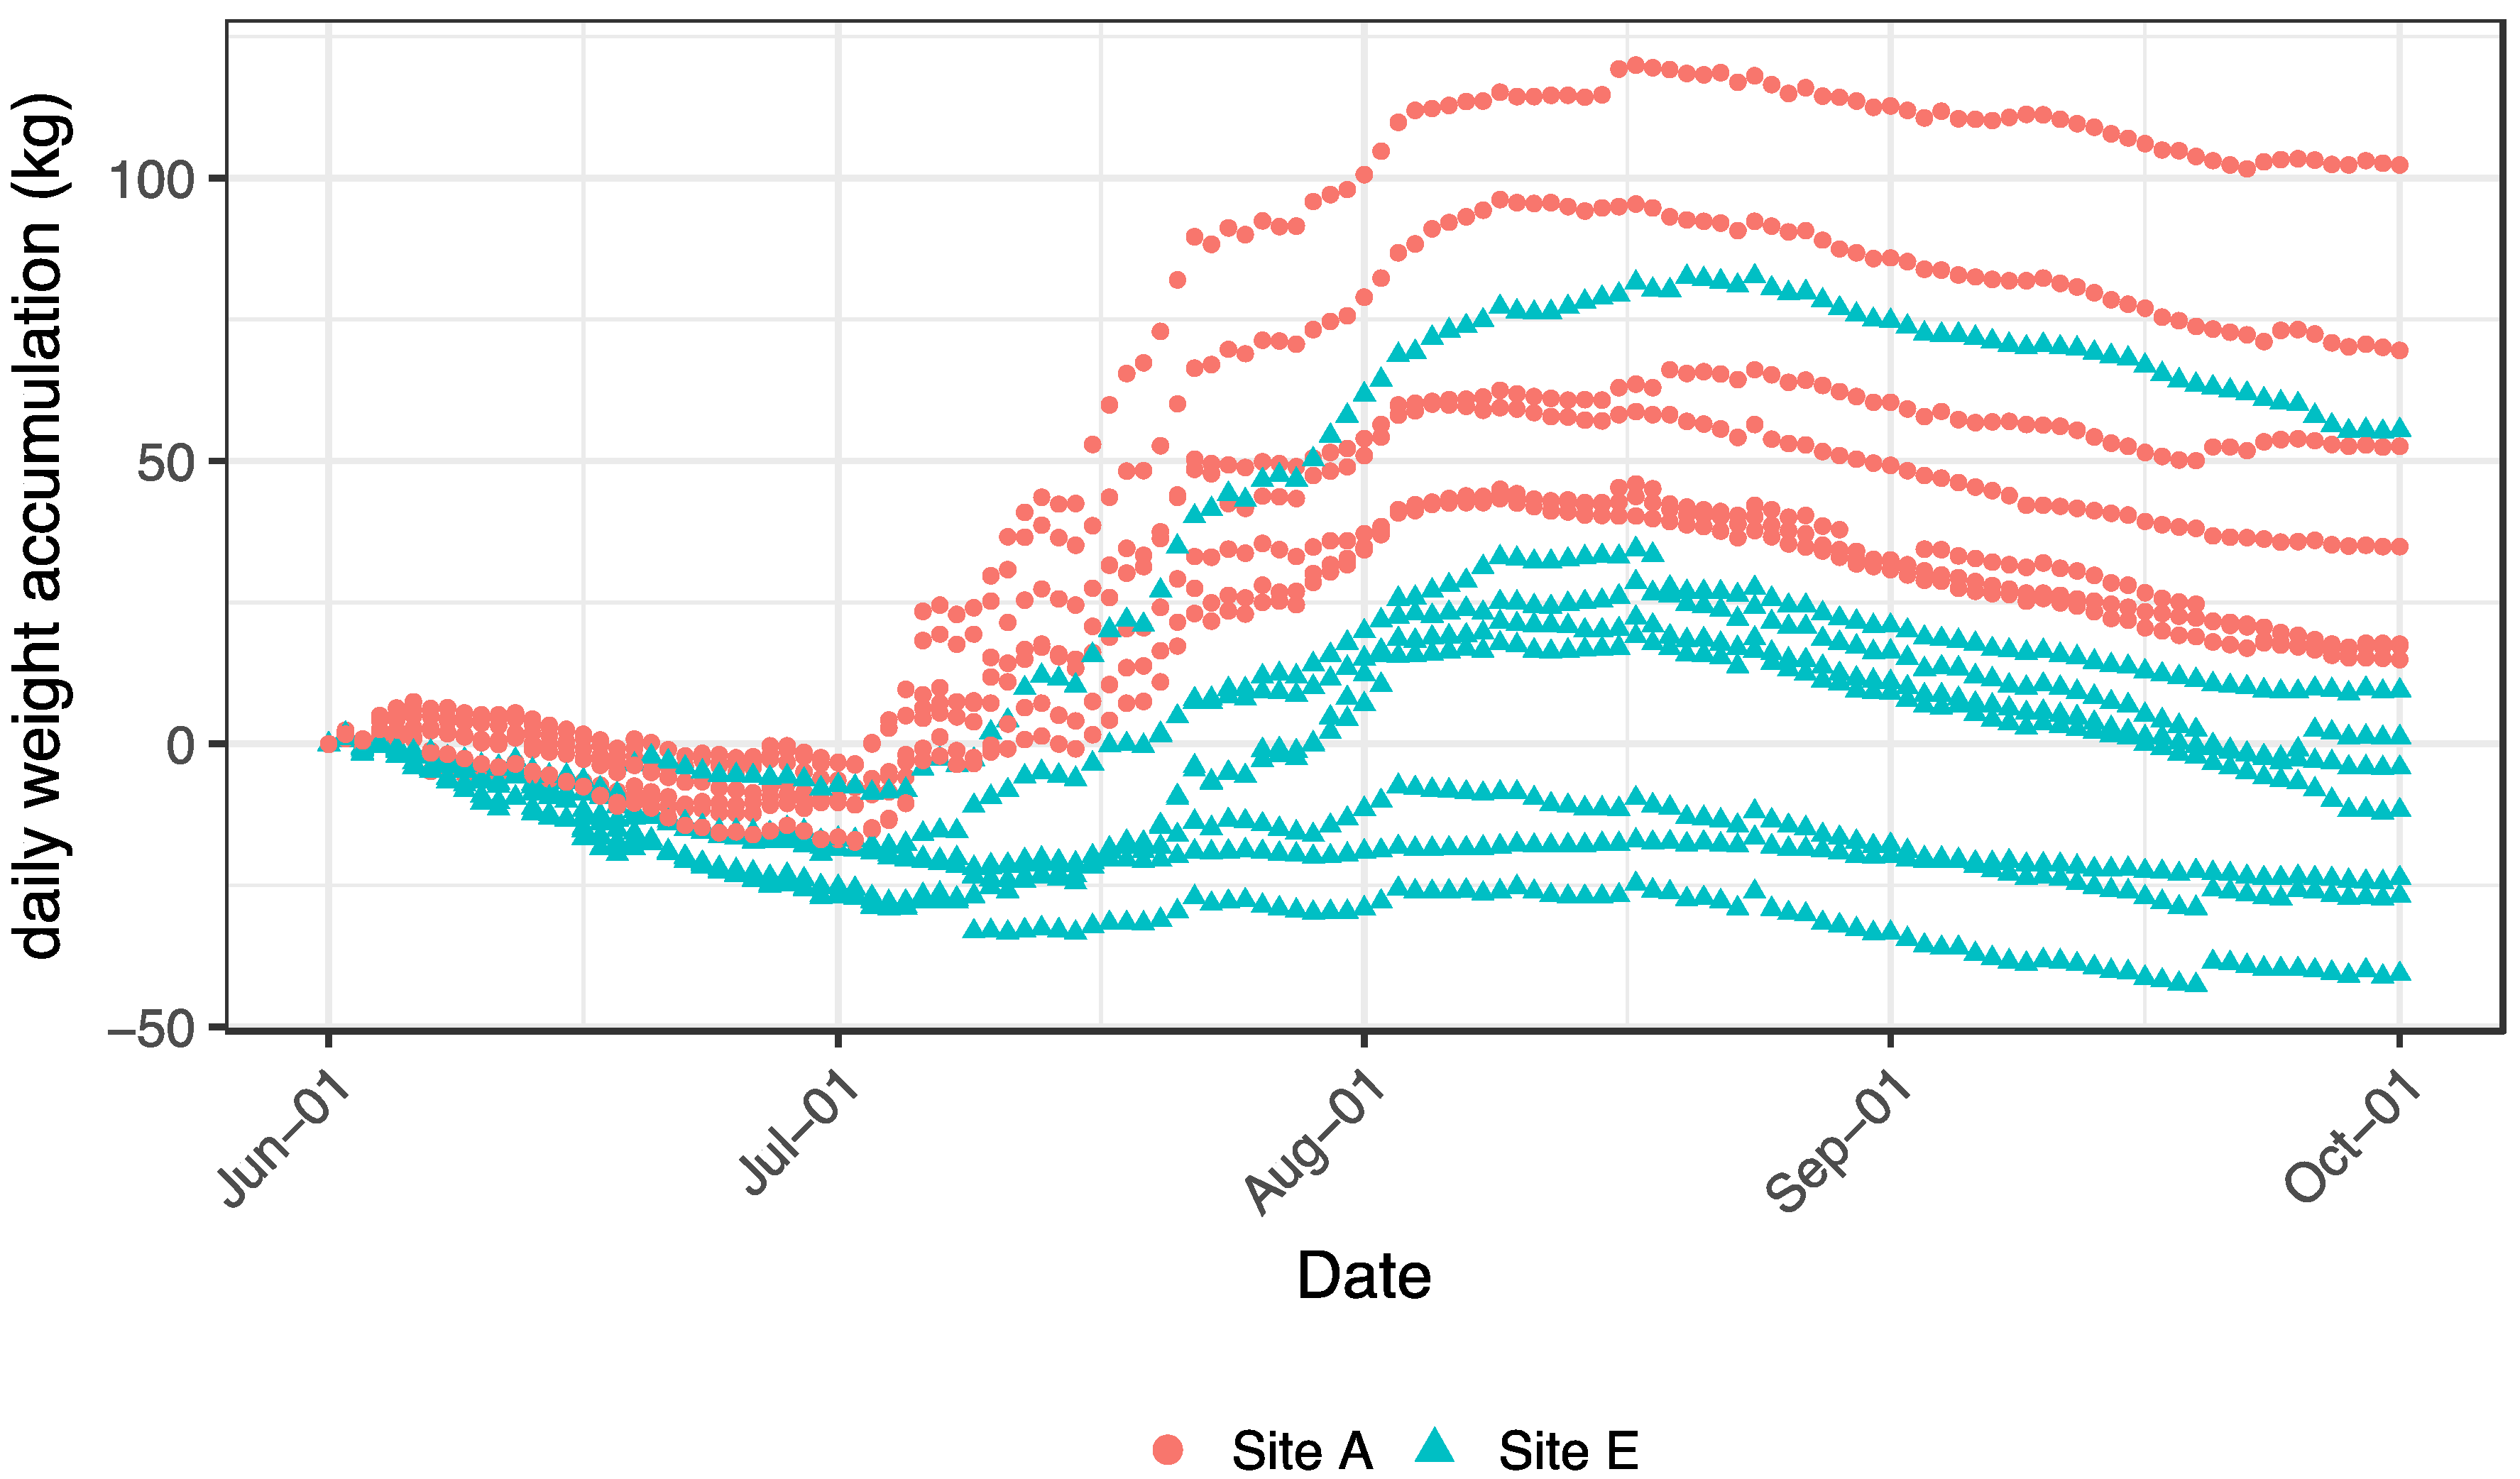
The overall cumulative weight change (comprised as the mean of all scales per apiary and day) over the growing season for colonies at Apiary A was significantly greater than for colonies at Apiary E (F1,244 = 184.1, p < 0.0001). The overall average final weight accumulation at Apiary A was 34 kg, whereas at Apiary E the average was −2 kg, i.e., the average colony at Apiary E lost weight over the growing season.
There was also a significant interaction between apiary and week (Figure 7: F17,216 = 274.7, p < 0.0001), wherein accumulated colony weight was not different between apiaries during Week one, but by Week two (beginning 8 June), colonies at Apiary A diverged from those at Apiary E and this separation continued throughout the remainder of the season. Colonies from Apiary E (save one colony) gained minimally, or lost, weight over the growing season (Figure 7). Peak colony weight occurred around 15 August, followed by modest declines throughout the remainder of the growing season at both apiaries. For four of the eight colonies at Apiary E, the average cumulative weight change was negative, while only 1 colony from Apiary A had an overall negative average weight gain (of −0.92 kg).
4. Discussion
We hypothesized there would be differences in forage quality, quantity, taxonomic origin of pollen, and pesticide exposure among colonies positioned in apiaries located at opposite ends of an intensive agroecosystem land-use gradient. Using fine-scale pollen forage and hive-weight data, we found that the apiary embedded in grassland obtained pollen with higher crude protein, gained more weight over the summer, and had reduced pesticide exposure than did its counterpart embedded in row crop monocultures. These findings suggest that the proportion of grassland in the local landscape may affect honey production, overwintering food stores, and access to floral resources containing higher protein pollen that has been shown to impact the health and survival of honey bees (e.g., [7,8]). The mechanisms for this effect remain unclear, and our study is limited by low sample size; however, our dataset does suggest divergent patterns in floral sources, pesticide exposure, and colony weight gain among the two apiaries. These patterns were also detected in bee health and land use studies conducted in the same region [10,23]. Other studies have likewise demonstrated temporal trends in resource utilization by honey bee colonies (e.g., [13,22]). We are currently conducting a multi-state research project to determine whether the land use patterns observed in this study can be detected across a larger region.
Nonetheless, colonies surrounded by more grassland (Apiary A) did not collect a consistently greater amount of pollen over the year, as colonies did in previous work [2]. We were not able to evaluate possible colony coping mechanism to overcome poor or nutritionally-depauperate landscapes, such as foraging more widely or deploying a greater number of pollen foragers, at the potential expense of colony resources and balanced division of labor, to collect a similar amount and diversity of pollen to that of colonies in a higher quality landscape. Honey bee colonies have a preferred in-hive pollen quota to support their population (approx. 1 kg stored at any time) which they may alter their foraging efforts accordingly to achieve [32]. Regardless, our findings highlight the plausible downstream effects of environments characterized as simplified, degraded, or otherwise lacking forage for pollinators: that of potential nutritional deficiency for honey bee colonies. Further, colonies located in the high grassland landscape rapidly increased and sustained weight throughout the growing season relative to the annual row crop-dominated apiary, wherein the average colony lost weight over the season. Beyond nutrition, reduced pesticide exposure was concurrently associated with more grassland habitat area, particularly for the most toxic insecticide detected in pollen (chlorpyrifos). These findings are consistent with previous reports of pesticide exposure to honey bee colonies in agricultural settings [4,5]. However, the presence of intensive agricultural land use does not necessarily translate to de facto negative outcomes for bees (e.g., [1,3,10,24]); highlighting that colony health outcomes in relation to land use may be relatively localized and landscape context-dependent. In this study, a profile of potential poor nutrition and environmental toxin exposure emerges for honey bee colonies located in landscapes such as that surrounding Apiary E, which could have implications on honey bee health, survival, pollination service delivery, and national pollinator-dependent crop production.
Data derived from monitoring devices show potential for tracking and quantifying interactions between land use quality, temporal variation in resource availability, and colony outcomes. A drawback to the widespread reliance on such devices in the field to infer colony health within a land use-context is the lag time between data collection and analysis and interpretation of results, particularly for pollen nutrition and pollen taxonomic identification derived from pollen traps (on the order of weeks to months). Further, the use of pollen traps may inadvertently lead to the occurrence of certain disease symptoms (e.g., [25]), and we have observed reduced colony size and an increased incidence of Chalkbrood (Ascosphaera apis) symptoms in colonies fitted with pollen traps all season long. With respect to hive scales, the lag time may be overcome by deploying any of several scales currently available that provide real-time, downloadable data for viewing on digital devices, thus making them useful for beekeeper management decisions in the field.
Over time, colony monitoring devices could be utilized to track long-term trends and shifts in plant phenology, forage availability, pesticide exposure events, and habitat quality in response to land use and climate change. On a related note, because of the limited sample size in our study, we were not able to statistically analyze the amino acid data by apiary, but our findings are intriguing and warrant further investigation due to potential differences between apiary sites. Temporal changes in atmospheric carbon have recently been shown to reduce the overall protein content of goldenrod (Solidago canadensis) pollen over time [33]. Whether impacts have occurred on the composition or balance of amino acids, and in other flowering plant species, is an important question to address going forward.
A common practice utilized by beekeepers to counteract the effects of absent, poor, or low environmental availability of nutrients is to supplement colonies with sugar and protein. This may be particularly important for colonies lacking an abundance or diversity of appropriate forage habitat and resources throughout the growing season in their surroundings, such as at apiaries similar to E in our study. Future studies should aim to elucidate the effects of variable amino acid composition and balance in honey bee-collected pollen and honey bee nutritional supplements. Data derived from monitoring devices may be particularly useful to identify and predict the temporal occurrence of widespread nectar or pollen dearth on the landscape, or particular apiaries where honey could be minimally harvested in order to provide colonies with enough overwintering food stores. Further, data provided by monitoring devices related to the occurrence of prolonged forage dearth could be fed back to land managers to assist in decisions regarding which specific plants to include in seed mixes that will provide forage resources during those dearth windows. The data we present here derived from passive monitoring devices have the potential to inform such management practices and allow for timely beekeeper management interventions.
Overall, our study expresses the increased quantity and quality of resources available to colonies located near more grassland habitat among intensive agroecosystems in the Northern Great Plains, albeit on a limited scale. Given the large proportion of the US commercial honey bee populations located in the Northern Great Plains region during the growing season [34], these findings highlight the need for continued efforts toward establishing, enhancing, and maintaining pollinator habitat across the region, as has been called for previously [35]. Monitoring devices show promise for informing beekeepers of certain aspects of the health status of their honey bee colonies and providing feedback on the quality of the surrounding environment to support honey bee colonies. These data, deployed on a larger scale, may begin to provide evidence for land managers and policy makers to begin to form better-informed decisions and policies that will go on to impact land use and how to best utilize multi-use agriculture-grassland ecosystems to support and promote both production agriculture and pollinators, and to secure the ecosystem services that they provide.
Supplementary Materials
The following are available online at https://www.mdpi.com/2077-0472/8/1/2/s1, Table S1: Counts-per-million of all taxa with greater than 50 assigned reads by apiary and date, Table S2: Meta data for Table S1, Table S3: Pesticide residues (ppb) detected in honey bee-collected pollen, harvested from pollen traps by apiary and date.
Acknowledgments
We thank Midwest Labs who provided pollen nutritional analyses and Alaa Kamel and the Environmental Protection Agency for leading the pollen pesticide residue analyses. We thank Wayne Esaias for developing the digital scales and assisting with deployment. We also thank three reviewers for their valuable feedback to improve the manuscript. Zac Browning provided the honey bee colonies used for this research and Alex Boyd assisted with GIS figure production. Funding for this research was provided in-part by the USDA-Farm Service Agency (14IAMRECRPTA6) and USDA-Natural Resources Conservation Service (673A7514178). The data and associated metadata reported in this paper are archived online [36]. Any use of trade, firm, or product names is for descriptive purposes only and does not imply endorsement by the U.S. Government.
Author Contributions
Clint Otto conceived and designed the experiment, Clint Otto, Scott Cornman, and Deb Iwanowicz performed the experiment and analyses, Matthew Smart analyzed the data, Matthew Smart, Clint Otto, Scottt Cornman, and Deb Iwanowicz wrote the paper.
Conflicts of Interest
The authors declare no conflict of interest. The funding sponsors had no role in the design of the study; in the collection, analyses, or interpretation of data; in the writing of the manuscript, and in the decision to publish the results.
References
- Sponsler, D.B.; Johnson, R.M. Honey bee success predicted by landscape composition in Ohio, USA. PeerJ 2015, 3, e838. [Google Scholar] [CrossRef] [PubMed]
- Smart, M.; Pettis, J.; Rice, N.; Browning, Z.; Spivak, M. Linking measures of colony and individual honey bee health to survival among apiaries exposed to varying agricultural land use. PLoS ONE 2016, 11, e0152685. [Google Scholar] [CrossRef] [PubMed]
- Alburaki, M.; Steckel, S.J.; Williams, M.T.; Skinner, J.A.; Tarpy, D.R.; Meikle, W.G.; Adamczyk, J.; Stewart, S.D. Agricultural landscape and pesticide effects on honey bee (Hymenoptera: Apidae) biological traits. J. Econ. Entomol. 2017, 110, 835–847. [Google Scholar] [CrossRef] [PubMed]
- Krupke, C.H.; Hunt, G.J.; Eitzer, B.D.; Andino, G.; Given, K. Multiple routes of pesticide exposure for honey bees living near agricultural fields. PLoS ONE 2012, 7, e29268. [Google Scholar] [CrossRef] [PubMed]
- Pettis, J.S.; Lichtenberg, E.M.; Andree, M.; Stitzinger, J.; Rose, R.; vanEngelsdorp, D. Crop pollination exposes honey bees to pesticides which alters their susceptibility to the gut pathogen Nosema ceranae. PLoS ONE 2013, 8, e70182. [Google Scholar] [CrossRef] [PubMed]
- Otto, C.R.V.; Roth, C.; Carlson, B.; Smart, M.D. Land use change reduces habitat suitability for supporting managed honey bee colonies in the Northern Great Plains. Proc. Natl. Acad. Sci. USA 2016, 113, 10430–10435. [Google Scholar] [CrossRef] [PubMed]
- Alaux, C.; Ducloz, F.; Crauser, D.; LeConte, Y. Diet effects on honeybee immunocompetence. Biol. Lett. 2010. [Google Scholar] [CrossRef] [PubMed]
- Di Pasquale, G.; Salignon, M.; LeConte, Y.; Belzunces, L.P.; Decourtye, A.; Kretzschmar, A.; Suchail, S.; Brunet, J.L.; Alaux, C. Influence of pollen nutrition on honey bee health: Do pollen quality and diversity matter? PLoS ONE 2013, 8, e72016. [Google Scholar] [CrossRef] [PubMed]
- Alaux, C.; Dantec, C.; Parrinello, H.; LeConte, Y. Nutrigenomics in honey bees: Digital gene expression analysis of pollen’s nutritive effects on healthy and varroa-parasitized bees. BMC Genom. 2011, 12, 496. [Google Scholar] [CrossRef] [PubMed]
- Smart, M.D.; Pettis, J.S.; Euliss, N.; Spivak, M.S. Land use in the Northern Great Plains region of the US influences the survival and productivity of honey bees. Agric. Ecosyst. Environ. 2016, 230, 139–149. [Google Scholar] [CrossRef]
- Dolezal, A.G.; Carrillo-Tripp, J.; Miller, W.A.; Bonning, B.C.; Toth, A.L. Intensively cultivated landscape and varroa mite infestation are associated with reduced honey bee nutritional state. PLoS ONE 2016, 11, e0153531. [Google Scholar] [CrossRef] [PubMed]
- Alaux, C.; Allier, F.; Decourtye, A.; Odoux, J.F.; Tamic, T.; Chabirand, M.; Delestra, E.; Decugis, F.; LeConte, Y.; Henry, M. A ‘landscape physiology’ approach for assessing bee health highlights the benefits of floral landscape enrichment and semi-natural habitats. Sci. Rep. 2017, 7, 40568. [Google Scholar] [CrossRef] [PubMed]
- Colwell, M.J.; Williams, G.R.; Evans, R.C.; Shutler, D. Honey bee-collected pollen in agro-ecosystems reveals diet diversity, diet quality, and pesticide exposure. Ecol. Evol. 2017, 7, 7243–7253. [Google Scholar] [CrossRef] [PubMed]
- Dainat, B.; Evans, J.D.; Chen, Y.P.; Gauthier, L.; Neumann, P. Predictive markers of honey bee colony collapse. PLoS ONE 2012, 7, e32151. [Google Scholar] [CrossRef] [PubMed]
- Simone-Finstrom, M.; Li-Byarlay, H.; Huang, M.H.; Strand, M.K.; Rueppell, O.; Tarpy, D.R. Migratory management and environmental conditions affect lifespan and oxidative stress in honey bees. Sci. Rep. 2016, 6, 32023. [Google Scholar] [CrossRef] [PubMed]
- Buchmann, S.L.; Thoenes, S.C. The electronic scale honey bee colony as a management and research tool. Bee Sci. 1990, 1, 40–47. [Google Scholar]
- Meikle, W.G.; Rector, B.G.; Mercadier, G.; Holst, N. Within-day variation in continuous hive weight data as a measure of honey bee colony activity. Apidologie 2008, 39, 694–707. [Google Scholar] [CrossRef]
- Meikle, W.G.; Holst, N. Application of continuous monitoring of honeybee colonies. Apidologie 2015, 46, 10–22. [Google Scholar] [CrossRef]
- Gil-Lebrero, S.; Quiles-Latorre, F.J.; Ortiz-Lopez, M.; Sanchez-Ruiz, V.; Gamiz-Lopez, V.; Luna-Rodriguez, J.J. Honey bee colonies remote monitoring system. Sensors 2017, 17, 55. [Google Scholar] [CrossRef] [PubMed]
- McLellan, A.R. Honey bee colony weight as an index of honey production and nectar flow: A critical evaluation. J. Appl. Ecol. 1977, 14, 401–408. [Google Scholar] [CrossRef]
- Todd, F.E.; Bishop, R.K. Trapping honeybee-gathered pollen and factors affecting yield. J. Econ. Entomol. 1940, 33, 866–870. [Google Scholar] [CrossRef]
- Richardson, R.T.; Lin, C.H.; Sponsler, D.B.; Quijia, J.O.; Goodell, K.; Johnson, R.M. Application of ITS2 metabarcoding to determine the provenance of pollen collected by honey bees in an agroecosystem. Appl. Plant Sci. 2015, 3. [Google Scholar] [CrossRef] [PubMed]
- Smart, M.D.; Cornman, R.S.; Iwanowicz, D.D.; McDermott-Kubeczko, M.; Pettis, J.S.; Spivak, M.S.; Otto, C.R.V. A comparison of honey bee-collected pollen from working agricultural lands using light microscopy and ITS metabarcoding. Environ. Entomol. 2017, 46, 38–49. [Google Scholar] [CrossRef] [PubMed]
- Meikle, W.G.; Weiss, M.; Maes, P.W.; Fitz, W.; Snyder, L.A.; Sheehan, T.; Mott, B.M.; Anderson, K.E. Internal hive temperature as a means of monitoring honey bee colony health in a migratory beekeeping operation before and during winter. Apidologie 2017, 48, 666–680. [Google Scholar] [CrossRef]
- Dubois, E.; Reis, C.; Schurr, F.; Cougoule, N.; Ribiere-Chabert, M. Effect of pollen traps on the relapse of chronic bee paralysis virus in honeybee (Apis mellifera) colonies. Apidologie 2017. [Google Scholar] [CrossRef]
- U.S. Department of Agriculture National Agricultural Statistics Service Cropland Data Layer. Published Crop-Specific Data Layer. 2014. Available online: https://nassgeodata.gmu.edu/CropScape/ (accessed on 1 May 2014).
- Cornman, R.S.; Otto, C.R.V.; Iwanowicz, D.; Pettis, J.S. Taxonomic characterization of honey bee (Apis mellifera) pollen foraging based on non-overlapping paired-end sequencing of nuclear ribosomal loci. PLoS ONE 2015, 10, e0145365. [Google Scholar] [CrossRef] [PubMed]
- Doyle, J. DNA protocols for plants. In Molecular Techniques in Taxonomy; Hewitt, G.M., Johnston, A.W.B., Wong, J.P.W., Eds.; Springer: Berlin, Germany, 1991; pp. 283–293. [Google Scholar]
- Kamel, A. Refined methodology for the determination of neonicotinoid pesticides and their metabolites in honey bee and bee products by liquid chromatography-tandem mass spectrometry (LC-MS/MS). J. Agric. Food Chem. 2010, 58, 5926–5931. [Google Scholar] [CrossRef] [PubMed]
- R Core Team. R: A Language and Environment for Statistical Computing; R Foundation for Statistical Computing: Vienna, Austria, 2017; Available online: https://www.R-project.org/ (accessed on 6 November 2017).
- DeGroot, A.P. Protein and amino acid requirements of the honeybee (Apis mellifica L.). Physiol. Comp. Oecol. 1953, 3, 197–285. [Google Scholar]
- Seeley, T.D. The Wisdom of the Hive: The Social Physiology of Honey Bee Colonies, 1st ed.; Harvard University Press: Cambridge, UK, 1995. [Google Scholar]
- Ziska, L.H.; Pettis, J.S.; Edwards, J.; Hancock, J.E.; Tomecek, M.B.; Clark, A.; Dukes, J.S.; Loladze, I.; Polley, H.W. Rising atmospheric CO2 is reducing the protein concentration of a floral pollen source essential for North American bees. Proc. R. Soc. B 2016, 283, 20160414. [Google Scholar] [CrossRef] [PubMed]
- U.S. Department of Agriculture National Agricultural Statistics Service. Honey Bee Colonies. 2016; ISSN 1949-1492. Available online: http://usda.mannlib.cornell.edu/MannUsda/viewDocumentInfo.do?documentID=1943 (accessed on 18 October 2017).
- Pollinator Health Task Force. National Strategy to Promote the Health of Honey Bees and Other Pollinators. 2015. Available online: https://obamawhitehouse.archives.gov/sites/default/files/microsites/ostp/Pollinator%20Health%20Strategy%202015.pdf (accessed on 26 January 2017).
- Smart, M.D.; Otto, C.R.V. Using colony monitoring devices to evaluate the impacts of land use and forage quality on honey bee health datasets. U.S. Geol. Surv. Data Release 2017. [Google Scholar] [CrossRef]
Figure 1.
Location and land use surrounding study apiaries, A and E, in 2014.

Figure 2.
Arrangement of colony monitoring devices. Each colony was fitted with both a pollen trap (pink, above bottom board) and scale (below bottom board). Photo: Clint Otto, USGS-NPWRC.
Figure 2.
Arrangement of colony monitoring devices. Each colony was fitted with both a pollen trap (pink, above bottom board) and scale (below bottom board). Photo: Clint Otto, USGS-NPWRC.

Figure 3.
Pollen collection (a) and crude protein (percent dry weight) content (b) by apiary site (A = circles, E = triangles) and date, 2014. Asterisks denote significant dates on which responses differed between apiaries as determined by analysis of variance (ANOVA) and Tukey's honest significant difference (HSD).
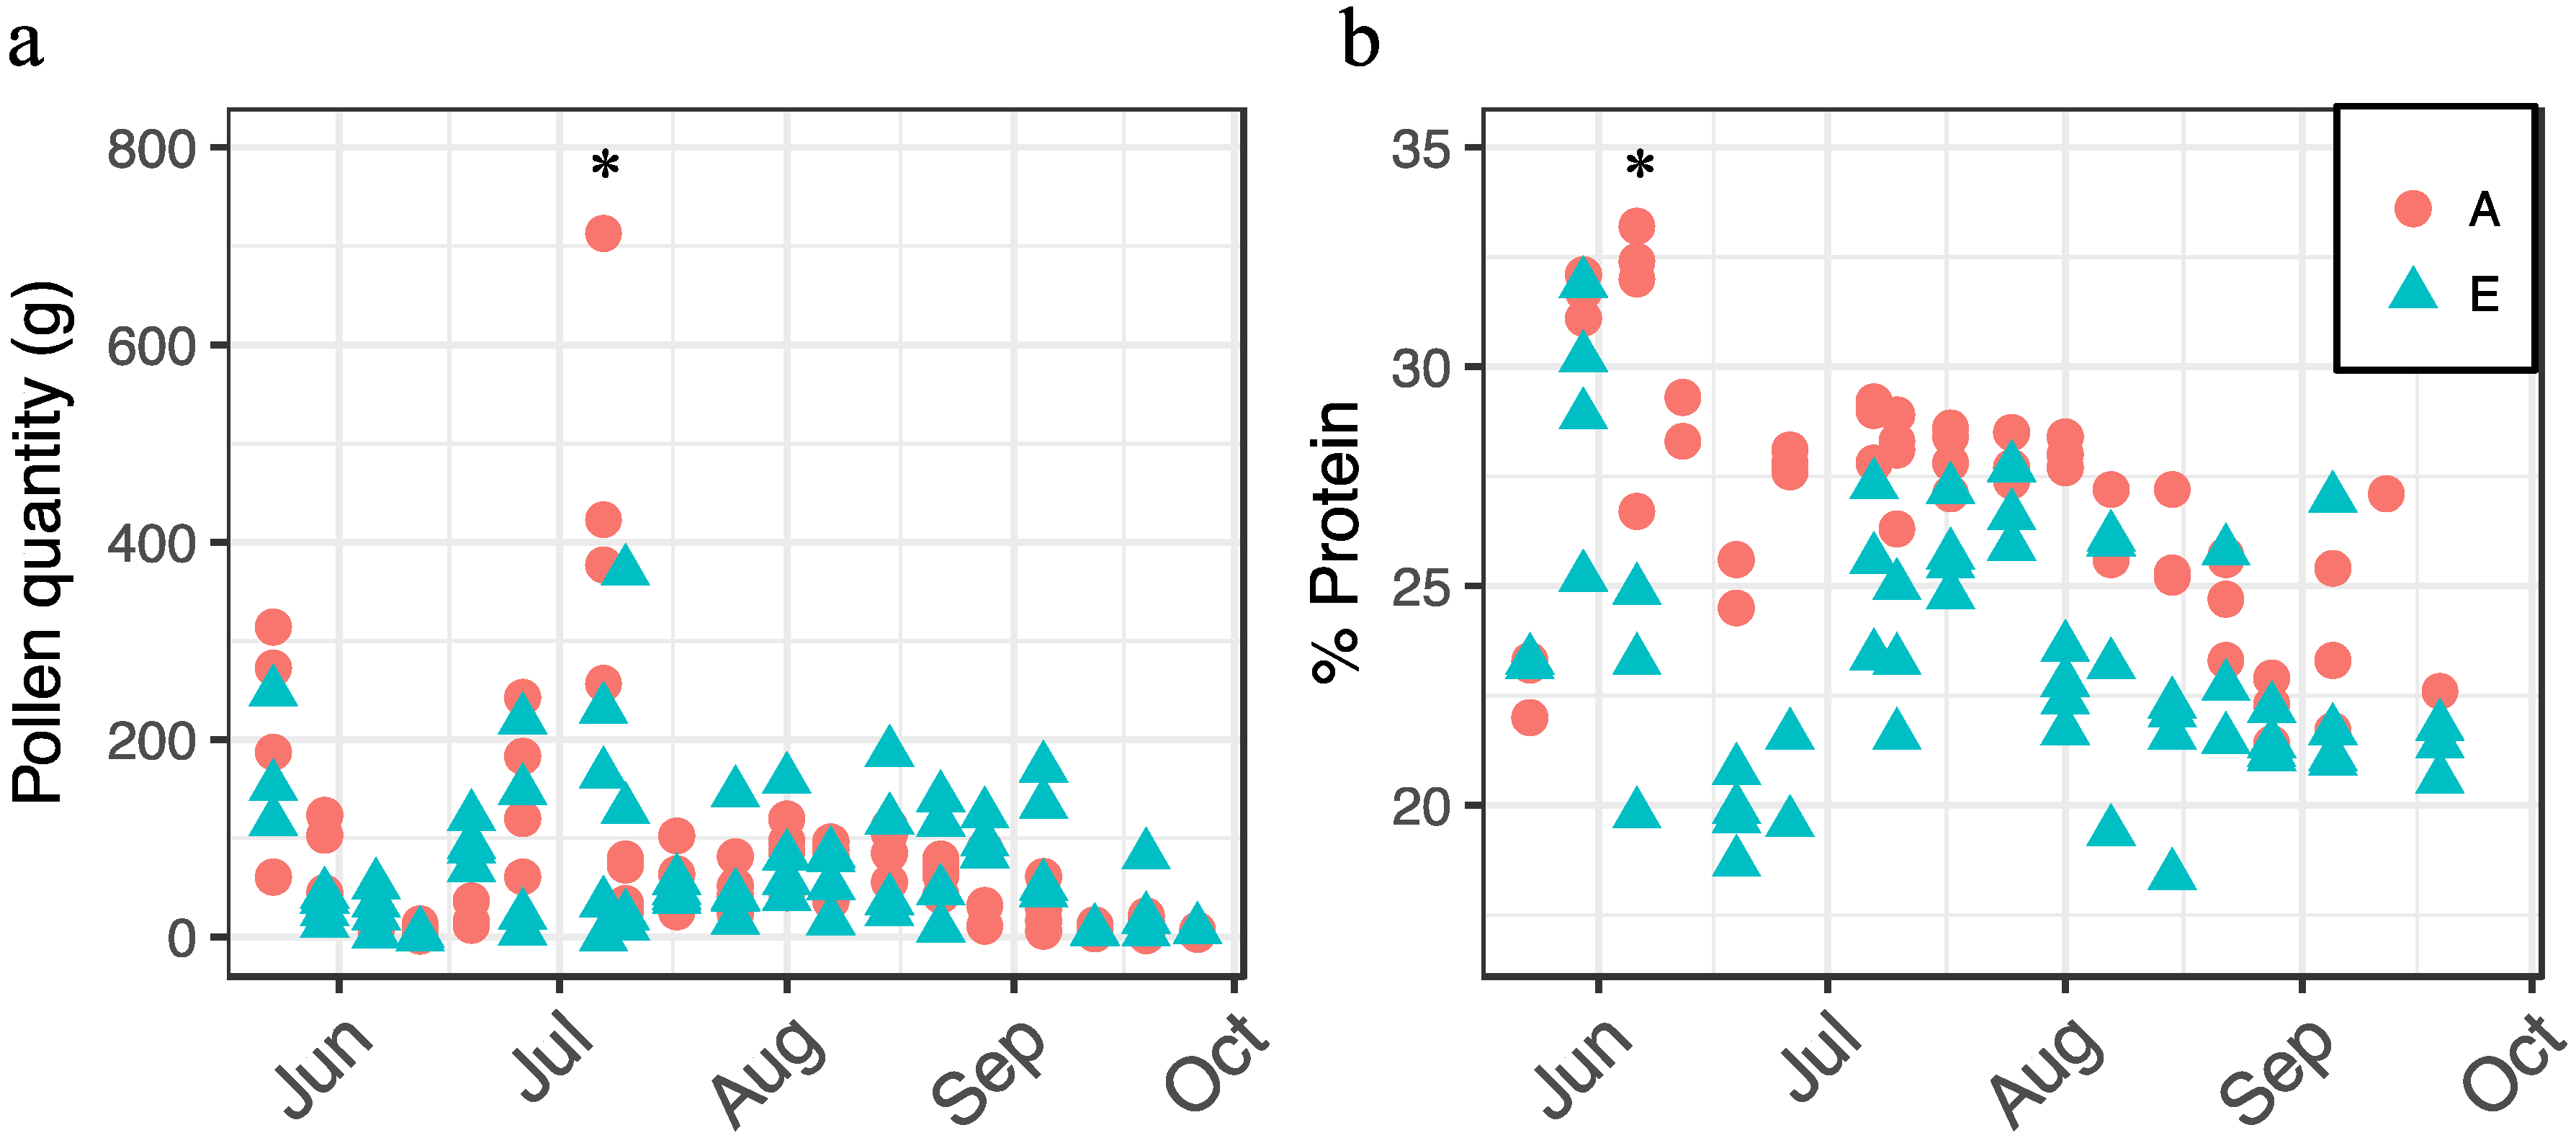
Figure 4.
Amino acid profiles (percent dry weight) of pollen collected by apiary and date, 2014. Reported minimum dietary requirements of 10 essential amino acids for worker honey bees can be found in [31].
Figure 4.
Amino acid profiles (percent dry weight) of pollen collected by apiary and date, 2014. Reported minimum dietary requirements of 10 essential amino acids for worker honey bees can be found in [31].

Figure 5.
Top 40 plant genera assigned (log sum counts-per-million from all colonies within an apiary and date), 2014.
Figure 5.
Top 40 plant genera assigned (log sum counts-per-million from all colonies within an apiary and date), 2014.

Figure 6.
Temporal occurrence of detected pesticide residues over the growing season in pollen collected by honey bee colonies at apiary sites A and E in 2014. The jitter function was applied to improve visual discernment of individual pesticide detections on each date.
Figure 6.
Temporal occurrence of detected pesticide residues over the growing season in pollen collected by honey bee colonies at apiary sites A and E in 2014. The jitter function was applied to improve visual discernment of individual pesticide detections on each date.

Figure 7.
Daily colony weight accumulation among the colonies fitted with hive scales at each of the study apiaries (A and E), 1 June–1 October 2014. Data were analyzed at the apiary level, but individual colony trajectories are depicted to highlight individual colony performance variability.
Figure 7.
Daily colony weight accumulation among the colonies fitted with hive scales at each of the study apiaries (A and E), 1 June–1 October 2014. Data were analyzed at the apiary level, but individual colony trajectories are depicted to highlight individual colony performance variability.


Table 1.
Plant families, and number of genera and species contained therein, ascribed in honey bee forager-collected pollen from apiaries A and E on 19 sample dates from May–September, 2014.
Table 1.
Plant families, and number of genera and species contained therein, ascribed in honey bee forager-collected pollen from apiaries A and E on 19 sample dates from May–September, 2014.
| Apiary A | Apiary E | |||
|---|---|---|---|---|
| Family | Genera | Species | Genera | Species |
| Alismataceae | 1 | - | 1 | - |
| Amaranthaceae | 3 | 2 | 2 | 1 |
| Apiaceae | 1 | 1 | 1 | 1 |
| Apocynaceae | 1 | - | 1 | - |
| Asteraceae | 17 | 14 | 17 | 11 |
| Brassicaceae | 5 | 10 | 2 | 4 |
| Caprifoliaceae | 3 | 3 | 2 | 1 |
| Celastraceae | 1 | 1 | - | - |
| Cyperaceae | 1 | 1 | 1 | 1 |
| Eleagnaceae | 1 | 1 | 1 | 1 |
| Euphorbiaceae | 1 | 1 | - | - |
| Fabaceae | 9 | 5 | 5 | 1 |
| Fagaceae | 1 | - | - | - |
| Hydrophyllaceae | 1 | 1 | - | - |
| Lamiaceae | 1 | - | 1 | - |
| Oleaceae | 2 | 2 | 2 | 1 |
| Onagraceae | 1 | 1 | - | - |
| Poaceae | 6 | 2 | 4 | 2 |
| Polygonaceae | 1 | 1 | 1 | 1 |
| Ranunculaceae | 1 | 1 | 1 | 1 |
| Rhamnaceae | 1 | - | 1 | - |
| Rosaceae | 2 | 1 | - | - |
| Salicaceae | 1 | 1 | 1 | 1 |
| Sapindaceae | 1 | 2 | 1 | 1 |
| Typhaceae * | - | - | - | - |
| Total | 63 | 51 | 45 | 28 |
* Sequencing reads were assigned at the family level only for Typhaceae.
Table 2.
Spearman’s rho ranked correlation of taxa assigned via DNA sequencing between apiaries over time. Pollen counts-per-million among all colonies within an apiary were ranked on each sample date.
Table 2.
Spearman’s rho ranked correlation of taxa assigned via DNA sequencing between apiaries over time. Pollen counts-per-million among all colonies within an apiary were ranked on each sample date.
| Sample Date | ρ | p-Value |
|---|---|---|
| 23 May 2014 | 0.61 | 0.17 |
| 30 May 2014 | 0.68 | 0.11 |
| 6 June 2014 | 0.58 | 0.04 |
| 12 June 2014 | 0.39 | 0.21 |
| 19 June 2014 | 0.28 | 0.32 |
| 26 June 2014 | 0.55 | 0.09 |
| 7 July 2014 | 0.09 | 0.80 |
| 10 July 2014 | 0.29 | 0.33 |
| 17 July 2014 | 0.35 | 0.21 |
| 25 July 2014 | 0.63 | 0.01 |
| 1 August 2014 | 0.44 | 0.08 |
| 7 August 2014 | 0.89 | <0.0001 |
| 15 August 2014 | 0.61 | 0.03 |
| 22 August 2014 | 0.34 | 0.17 |
| 28 August 2014 | 0.48 | 0.08 |
| 5 September 2014 | 0.60 | 0.01 |
| 12 September 2014 | 0.69 | 0.006 |
| 19 September 2014 | 0.90 | <0.0001 |
| 26 September 2014 | 0.91 | 0.0001 |
© 2017 by the authors. Licensee MDPI, Basel, Switzerland. This article is an open access article distributed under the terms and conditions of the Creative Commons Attribution (CC BY) license (http://creativecommons.org/licenses/by/4.0/).
Share and Cite
MDPI and ACS Style
Smart, M.; Otto, C.; Cornman, R.; Iwanowicz, D. Using Colony Monitoring Devices to Evaluate the Impacts of Land Use and Nutritional Value of Forage on Honey Bee Health. Agriculture 2018, 8, 2. https://doi.org/10.3390/agriculture8010002
AMA Style
Smart M, Otto C, Cornman R, Iwanowicz D. Using Colony Monitoring Devices to Evaluate the Impacts of Land Use and Nutritional Value of Forage on Honey Bee Health. Agriculture. 2018; 8(1):2. https://doi.org/10.3390/agriculture8010002
Chicago/Turabian StyleSmart, Matthew, Clint Otto, Robert Cornman, and Deborah Iwanowicz. 2018. "Using Colony Monitoring Devices to Evaluate the Impacts of Land Use and Nutritional Value of Forage on Honey Bee Health" Agriculture 8, no. 1: 2. https://doi.org/10.3390/agriculture8010002
Note that from the first issue of 2016, this journal uses article numbers instead of page numbers. See further details here.