1. Introduction
Precision Livestock Farming (PLF) is being developed in livestock farms to relieve the human workload and to help farmers to optimize production and management procedure. PLF consists in monitoring and measuring animal data in order to model the information gathered and then use this information to evaluate the on-going processes [
1]. The use of computerized sensors and online measurements are commonly adopted in modern milking parlors, in order to analyze several parameters in milk composition and to monitor the health status of cows. The bulk tank milk is than collected and delivered to cheese factory, where the milk is analyzed and used for cheese making and/or drinking milk.
The milk composition for drinking milk is well defined than that of milk intended for manufacturing cheese products. Accordingly, the protein level in drinking milk is often higher than the minimum level required by the legislations, in the other hand the cheese factory has to buy proteins for cheese making, with economic loss for the company. For this reason, the cheese factory may be interested to collect, directly from the farm, milk with different characteristics: in particular one with high coagulation properties (high level in protein and fat content) and the other one with low coagulation properties (standard milk).
The milk composition depends on breed, time in lactation and nutrition, as well as udder infections and hygiene in milking. At the moment, different animals and breeds may be selected to produce diverse products accordingly to standard desirable dairy goods [
2,
3]. The separation in real-time of individual cow’s milk, in accordance to its optical measured coagulation properties [
4,
5,
6,
7,
8], through the implementation of a new system (AfiMilk MCS) in milking parlors, allows to save process steps in milk chain. In fact, the two types of milk, that are collected and delivered separately with different milk tanker trucks, follow diverse production lines defined by the cheese factory (i.e., drinking milk or cheese making). The implementations of such equipment in milking parlors would enable milk producers and dairy industry, to separate and convey milk based on determined standards set by the operators, in order to increase both parties’ benefits from the use of that milk [
4]. Studies on AfiMilk MCS showed that the performance of this equipment installed in milking parlor provides an opportunity to divert 200 mL resolution pulses of milk into two different tanks, according to its suitability for cheese production [
9].
Each AfiLab uses near-infrared spectroscopy (NIR) for on-line milk analysis [
10]. The advantages of an NIR systems, over other systems, are related with a prompt and nondestructive on-line measurements [
11]. In general, the AfiMilk MCS has the potential to control and define the milk quality [
5].
Certainly, the implementation of such devices, would change the energy consumption and the related carbon impact in milk supply chain (from farm to factory). The main reasons are due to the introduction of a supplementary milkline, besides the new management of collection and delivery of milk with two different compositions. The optimization of milk collection routes is useful not only for reducing total energy consumptions and costs, but also to decrease the related environmental emissions [
12,
13,
14].
The on-farm activities that contribute most to the electricity requirements in dairy farms were milk cooling and milk harvesting, showing how important these activities are in the farm energy management [
15,
16]. The consumption of diesel fuel, electricity or gas is defined as direct energy, while the term indirect energy refers to the usage of inputs depleted in one production period [
17,
18,
19,
20].
In dairy farms, technological investments are related to the herd dimension; however, when the level of mechanization is reported to the number of raised heads as indices, larger farms were more efficient and utilized less power per unit [
21].
The objectives of this study were to evaluate the consequences in direct energy intensity and the related carbon impact, from dairy farm to cheese factory, due to the implementation of a real time milk analysis and separation in milking parlors.
2. Materials and Methods
The research carried out involved 3 conventional dairy farms (named A, B and C), the collection and delivery of milk from farms to cheese factory and the processing line of a traditional soft cheese into a dairy factory.
The boundaries of this study were set from dairy farm to cheese factory (first weight control, before cheese ageing) involving in particular: direct energy consumptions in dairy farms related to the milking and washing operations; direct energy use for collection and delivery of milk from dairy farm to cheese factory; electrical and thermal energy use in the production line of a traditional soft cheese, including the energy embodied in the ingredients used to standardized the milk formula.
An energy audit was carried out to collect the overall information related with energy and related carbon dioxide issues into the boundaries defined above. In this study other direct and indirect energy consumption and related emissions in dairy farms, in milk transportation and in dairy factory were not accounted since the objective of this study was to evaluate the consequence of a real-time milk analysis installation in milking parlors to avoid the standardization of the milk formula for the production of a traditional soft cheese.
The functional units were set as a 100 kg of milk processed and 1 kg of a traditional soft cheese produced.
2.1. Dairy Farms
The conventional dairy farms were located in the Oristano province, Sardinia (Italy). Farms were specialized in milk production, with a confinement management, on-farm feed production was based on grass hay and grass silage in spring and corn silage in late summer. The dairy farms were located in valley. All the equipment found in the milking parlor were inventoried, reporting the operational power and their usage time in order to calculate the annual energy consumption [
22,
23].
The characteristics of the investigated farms are reported as follow, farm “A” held 72 hectares of cultivated land, the farm was specialized in milk production rising 500 heads of Holstein and Brown cows and producing about 2140 tons of milk per year.
Farm “B” raised 600 heads of Holstein cows producing about 2453 tons of milk per year, the total cultivated area was about 85 of irrigated hectares.
Farm “C” was specialized in milk production (2317 t year−1) raising about 480 Holstein cows in 100 hectares of land extent of which 60 hectares were irrigated.
Real Time Milk Analysis
The Afimilk MCS system (on line milk classification service; Afikim, Israel), an innovative solution to improve milk value, was installed in the milking parlors of the dairy farms involved in this project. The equipment is able to separate in real time the milk in two fractions according to predetermined coagulation properties, obtaining higher cheese-milk quality with increased cheese yield.
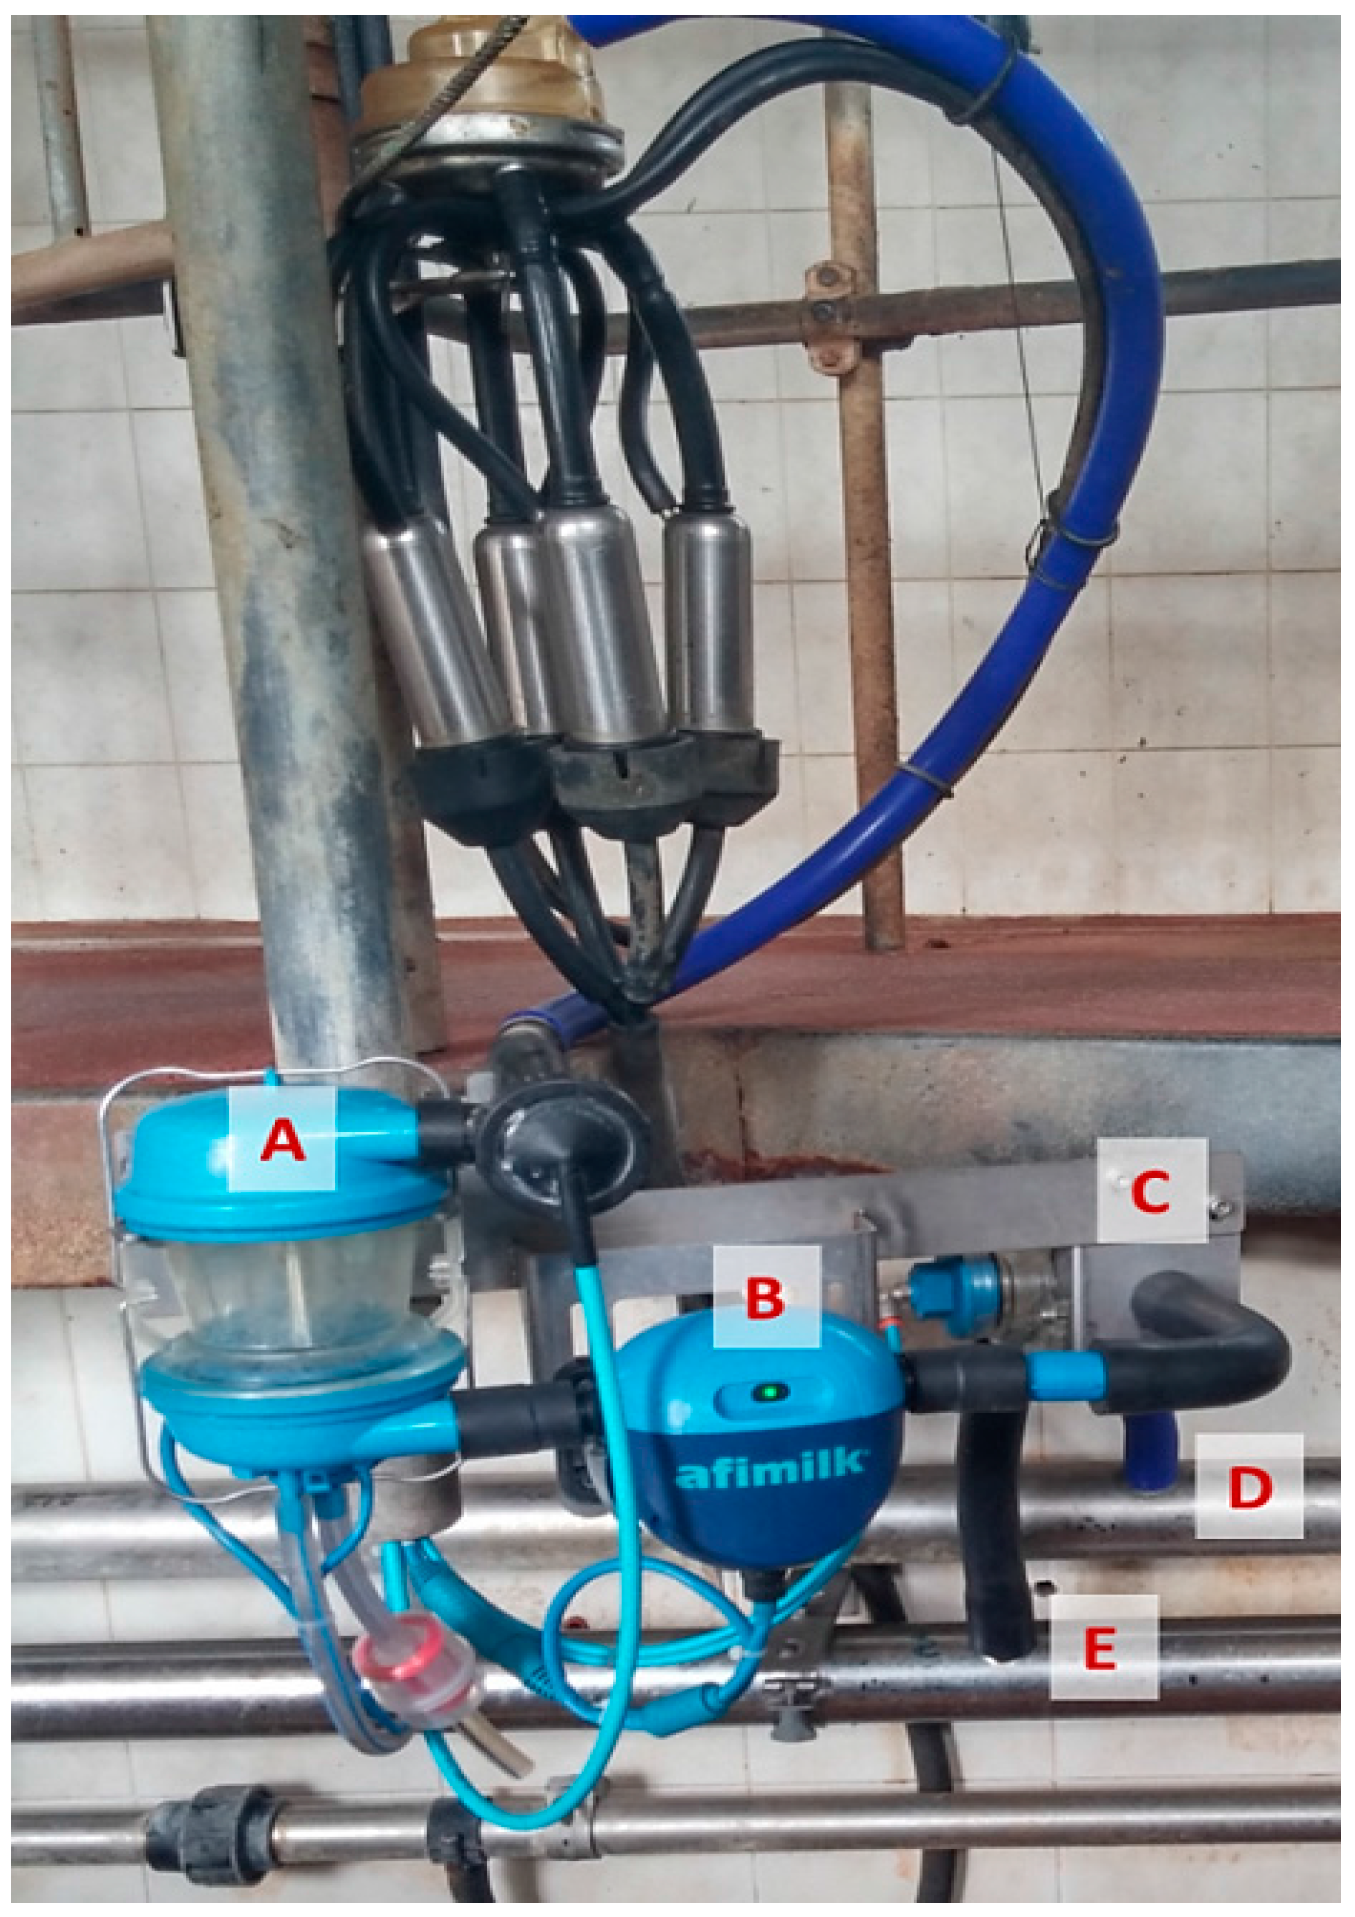
The milk analysis is performed by Afilab™ (S.A.E., Afikim, Israel), a spectrometer that works in real time and performs milk component measurements. Afilab is installed on the milking parlor, next to the milkmeter, in every stall and sorts milk into two milklines (
Figure 1). The instrument thus becomes an integral part of the system, allowing to analyze the milk of each animal at every milking session. Afilab’s analysis is based on spectroscopy in the near infrared: during milking, the cow’s milk (every 200 g) is crossed by a light beam and Afilab, reading the light refraction of milk, is capable to determine the content of fat, protein, lactose and somatic cells and separate it into two target milk tanks. In this study, the AfiMilk MCS system was set to separate milk with high coagulation properties and milk with low coagulation properties with a ratio of 50%.
2.2. Dairy Factory
The cheese making plant was located in the Oristano Province (Sardinia) Italy, where an energy audit was performed in order to identify the electrical and thermal energy usage through the production line of a traditional soft cheese. In addition, the amount of ingredients used to standardize the production formula were included as primary energy and related carbon dioxide emissions.
The Traditional Soft Cheese Production Line
The raw milk is stored in cooling tanks, after that, chemical analysis take place to confirm milk suitability for processing and to assess the amount and type of ingredient (on-factory milk cream, ultrafiltered milk, etc.) needed to standardize the production formula.
Milk standardization lead to increase the indirect energy requirement of the whole process due to the incorporated energy embodied in the ingredients, in particular for milk cream was found 50.5 MJ per kg of product used and 29.2 MJ per kg of ultrafiltered milk.
After thermal treatment (74 °C per 16 s) milk is conveyed to the processing line, where starter and rennet are added when milk reach the temperature of 39 °C. Once the cheese curd is ready, it is cut into small pieces to allow whey drainage. The whey and cheese curd are placed automatically into cheese moulds and conveyed in the warm chambers, where the cheese will be held for 3 h between 37 °C and 40 °C. After drainage, the cheese is placed into the brine solution for about 3.5 h at 10 °C, when the salting procedure is done, the moulds are removed automatically and the wheels of cheese are sent to the first weight control, where the production yield is assessed. The cheese yield, specifically for the production of the traditional soft cheese, is about 12.3%. The following step is represented by the ageing at 5–7 °C for about 15 days, followed by the packaging process.
Operational parameter of cheese production process per vat: 4000 kg of processed milk; 12.3% of cheese yield; 379 wheels of traditional soft cheese; 1.3 kg per cheese wheel; 492 kg of cheese.
2.3. Milk Collection and Delivery
Adopting these PLF technologies in dairy farms lead to reorganize the logistic of milk collection. We assessed the delivery of two types of milk obtained by quality separation (milk with high coagulation properties and standard milk) from dairy farms to cheese making plant, since each type of milk needs to be collected every day and transported independently. The calculation was effectuated by a tool for the optimization of collection routes of dairy farms (MilkTour), developed by the University of Sassari.
The MilkTour software allows optimizing the collection routes of milk collection and transport phases by a client–server architecture with the clients using HTML and JS, while the server used PHP and a MySQL database. The client software for the integrated management of the collection and transport phases of milk collection used an Internet browser, from which the HTML code of the server was downloaded through an HTTP request [
24]. Once the collection route has been defined, the user can calculate the distance between the different points of the map. Once the distance has been calculated, the user could then optimize the route by choosing and inserting certain parameters such us the time spent collecting milk, the start time of the route, daily collection amount and the costs (calculated by official parameters from the Ministry of Infrastructure and Transport or from the cheese factory data records). The MilkTour software allows to assess the minimum distance needed to visit all the collection points. Once the routes are optimized the software will estimate the best sequence for visiting the suppliers, the time taken, the cost of the route, the density of the collection points, and CO
2 emissions. The software takes also into account the information of suppliers (farm location and milk volume) and from cheese factory (maximum capacity of the milk truck tankers, number of trucks and time limitations). Fuel consumptions were assessed using as a benchmark minimum cost for road transport companies operating tankers, published and updated monthly on the website of the Italian Ministry of Infrastructure and Transport. The CO
2 emissions were calculated considering the fuel consumptions and the emission factor for diesel (3.15 kg CO
2–eq kg
−1; [
25]).
The 3 dairy farms investigated in this study, belonged to a collection route involving 21 dairy farms situated in nearby areas. In order to assess the energy and carbon impact due to milk collection and delivery, in the pre and post installation phase, a simulation has been performed for the whole collection route.
3. Results and Discussion
The results for each farm are shown in
Table 1, farm “A” was equipped with a herringbone type milking parlor holding 8 + 8 stalls, the single milkline measured 70 mm of diameter and was connected with two vacuum pumps of 4 kW each. Lactating cows were milked twice a day corresponding to 6 h a day of using time (milking and washing). The milking parlor was equipped with Variable Speed Drive (VSD) connected to the vacuum pumps, Water Heat Recovery (WHR) for water heating and a Milk Pre-Cooling (MPC). The milk was stocked into two milk tanks with a capacity of 5000 L each.
The milking parlor of farm “B” held 30 stalls and it was equipped with three vacuum pumps of 4 kW each one. Cows were milked three times a day corresponding to 8.5 h a day of operational use. The farm was provided with a water heating recovery system and two milk bulk tanks, containing respectively 5000 and 8000 L of milk.
Farm “C” held a milking parlor equipped with 18 stalls powered by two vacuum pumps of 4 kW each and was furnished whit VSD. The milking machine was used for 7 h a day and the milk was stocked into two cooling tanks with a capacity of 5000 L each.
The environmental and energy audit is a methodology adopted to assess energy consumptions and related emission of carbon dioxide (expressed as kg of CO2). These requirements were estimated based on the power of the equipment used through one year. The data considered at farm level was related to the use of the milking parlours, milk cooling and washing procedure, thus, to underline the effects, on direct energy requirements, due to the installation of the AfiMilk MCS system.
The electricity and diesel fuel consumptions, as well as the related primary energy and carbon indicators, were reported in
Table 2 per each farm during pre and post PLF technologies implementation (respectively ex-ante and ex-post phase). The ex-ante electricity requirement accounted from 51.3 to 116.8 kW·h per head (farm A and C, respectively), while diesel fuel consumption was found only in farm B using about 1.45 kg per head. The primary energy requirements and related carbon dioxide emissions showed farm B having the highest values (26.6 MJ and 1.24 kg CO
2 per 100 kg of milk). The availability of energy saving devices, installed in the milking facilities, allowed farm “A” to have lower energy utilization indices, then the other two dairy farms.
The implementation at the milking parlour level, of the AfiMilk MCS system, slight increased the requirements of electricity and diesel fuel in each dairy farm. Expressing this growth in terms of primary energy demand per unit of milk produced, a range among 1.1% and 4.4% was observed in the investigated farms. One of the activities that showed greater energy requirements in the ex-post phase was related to washing procedure, since the hot water volumes increased significantly due to the additional milkline and components. Even though herd size was very close among farms, the availability of saving devices in the milking facilities, allowed to contain energy consumption due to the installation of the AfiMilk MCS system. The ex-post direct energy consumptions in milking activities, increased the related emission of carbon dioxide for farm A, B and C, emitting respectively 0.504, 1.260 and 1.036 kg of CO2 per 100 kg of milk.
The energy and environmental audit carried out in the traditional soft cheese production line is reported in
Table 3. The milk storage and thermal treatment operations were the most direct energy demanding activities using about 2.71 MJ per 100 kg of processed milk, which represent the 58% of total consumptions. The indirect energy requirements derived from the use of ingredient adopted to standardize the traditional soft cheese formula, which accounted to 3.64 MJ per 100 kg of milk. Considering the direct and indirect energy emissions, the standardization of the cheese formula was the most pollutant source, emitting about the 86% of the total carbon dioxide emissions in the ex-ante phase.
The implementation of milking parlours with the AfiMilk MCS system, allowed to obtain two types of milk based on quality characteristics. The milk with high coagulation properties (greater in fat and protein content) was conveyed to the production line of the traditional soft cheese, while the standard milk was used for other products that do not require to be processed (i.e., drinking milk). Processing milk with high coagulation properties allowed to avoid the use of ingredients to standardized the production formula of the soft cheese and keep, at the same time, the other activities carried out during the production line, unaltered. This advantage reduced considerably the total emissions of carbon dioxide and increased the cheese yield. In particular, the use of milk with high coagulation properties for the traditional soft cheese, increased the production yield from 12.3% (ex-ante phase) to 13.1% (ex-post phase).
The MilkTour software creates the results for 21 suppliers of the original collection route (
Table 4) for the ex-ante phase. The cheese factory has 4 milk tanker trucks available, two trucks of 25.4 tons and two of 29.5 tons of a maximum volume capacity. To collect milk from the 21 dairy farms in the ex-ante phase, the software calculated 4 collection routes with a total travelled distance of 53.48 km. The total fuel consumption for the collection routes accounted to 13.76 kg of diesel, with a related emission of 43.35 kg CO
2 for the overall suppliers. Large differences in fuel consumption per collection route have been observed, from 1.75 to 5.76 kg of diesel, even though the quantity of milk collected was similar among routes, the main issues that affects diverse fuels consumptions was related with the distances travelled by trucks, thus the distance of farms from the cheese factory.
The reorganization of milk collection and delivery comported an increase of energy requirements and emissions of carbon dioxide, which accounted respectively to 24.53 kg of diesel fuel and 77.26 kg CO
2 for the overall collection routes (
Table 5). In fact, the two types of milk were collected every day from each supplier by means of two different milk tanker trucks which lead to increase the total distance travelled from 53.48 km to 93.60 km. Based on the data obtained from the MilkTour software, the collection of milk from dairy farms in the ex-ante phase required about 0.63 MJ and emitting 0.043 kg CO
2 per 100 kg of milk collected. The optimization of milk collection, in the ex-post phase, increased the energy demand and the related carbon dioxide emissions, which accounted respectively to 1.12 MJ and 0.08 kg per 100 kg of milk.
The final assessment of the energy demand and the related emissions of carbon dioxide, due to the implementation of PLF technologies in dairy farms, is shown in
Table 6. In the ex-ante phase energy requirements of dairy farms represent the most demanding activities corresponding to the 69% of total consumption and followed by the dairy production plant (29%), while milk collection and delivery represents only the 2% of the total assessment. Focusing on the emissions of carbon dioxide, in the ex-ante phase, the dairy plant held the higher value with about 3.75 kg CO
2 per 100 kg of milk processed, corresponding to the 80% of total carbon emissions.
Expressing the final results of the ex-ante phase per unit of traditional soft cheese produced, 2.23 MJ and 0.36 kg of carbon dioxide per kg of cheese have been assessed.
In the ex-post phase larger energy requirements resulted in the logistic of milk collection (+44%), followed by dairy farms (+2.4%), while in the cheese factory the energy demand was reduced by the 44%, due to the ingredients saved by the use of milk with high coagulation properties.
The implementation of PLF technologies in milking parlors led a considerable reduction of total energy requirements and related carbon impact in the production of the traditional soft cheese. The magnitude of those reductions accounted to 14% of primary energy demand, corresponding to 2.03 MJ per kg of soft cheese produced. The emissions of carbon dioxide through the entire production chain, from farm to factory in the ex-post phase, were reduced by the 69% going from 0.384 to 0.118 kg of carbon dioxide per kg of traditional soft cheese.
4. Conclusions
The application of PLF technologies in dairy sector help to improve the performances of the animals raised. Monitoring in real time the health status, the quality and quantity of the productions in dairy farms allowed to know and manage important aspects of the milk production chain. This study assessed how the milk separation by means of the AfiMilk MCS system affects the energy requirements and the related carbon impact throughout the milk chain, from dairy farms to cheese factory. The equipment installed in the milking parlors allowed to obtain a large number of information related to the quantity and quality of milk from each individual cow and to separate milk with two different composition (one with high coagulation properties and the other one with low coagulation properties), with a separation ratio of 50%. Due to the presence of an additional milkline and the AfiMilk MCS components, the energy requirements and the related environmental impact at farm level were slightly larger, among 1.1% and 4.4% in respect to the ex-ante phase. One of the most process that affects the energy consumption in dairy farms was related to the increase of hot water volume used to wash the milking parlors.
The logistic of milk collection was also significantly reorganized in view of the collection of two separate type of milk, hence, it leads an increment of 44% of the energy demand. The logistic of milk collection and delivery represents the process in which the highest incidence in energy consumption occurred in the ex-post phase.
Thanks to the availability of milk with high coagulation properties, the dairy factory, produced traditional soft cheese avoiding the standardization of the milk formula, as a result, the energy uses decreased about 44%, while considering the whole chain, the emissions of carbon dioxide was reduced by 69%. In this study, the application of advance technologies in milking parlors modified not only the on-farm management but mainly the procedure carried out in cheese making plant.
The implementation of PLF technologies increased energy requirement and carbon dioxide emissions in dairy farms and in the collection of milk, however, the large amount of energy saved in the cheese factory and the increase in cheese production yield make these technologies respectful to the natural resources and to the environment, avoiding about 2.65 MJ of primary energy every 100 kg of processed milk.


