1. Introduction
Potassium is an essential element for plants and its importance in agriculture is well known. Potassium saturation percentage (KSP) is an index of K fertility of soil and is also another index for assessment of K status and K buffering capacity in some countries [
1,
2]. It is defined as exchangeable K divided by cation exchange capacity (CEC), expressed as a percentage. In fact, KSP indicates the ability of soil to adsorb and buffer K ions and is directly related to CEC. Low KSP indicates that K ions occupy a small portion of CEC [
3]. Pagel and Insa (1974) proposed the critical value for KSP as being 2.3% [
4]. However, some soil physical and chemical properties, climate (temperature regimes), soil development, mineralogy, and soil depth may also affect its content [
1].
Nowadays, some analytical methods such as fuzzy logic-based approach and analytical hierarchy process (AHP) as an expert-based system are used for analysis and mapping of soil properties. The AHP technique has the ability to incorporate different types of data and compare two parameters at the same time by using the pair-wise comparison method [
5]. Although the fuzzy and AHP methods have been used for different purposes such as agricultural best management practices, contaminated land management, watershed management, etc. by many researchers [
6,
7,
8], no information is available about the use of these techniques for the mapping of essential soil elements for plant growth such as N, P and K.
Many fuzzy membership functions have been developed for different soils [
9]. These methods are implemented in Geography Information System (GIS) and analyses are performed for each raster cell to produce the soil maps. Input attributes are classified into different classes (high, medium, low, and very low values). However, for determination of fuzzy maps for each criterion, the main problem is the determination of the relative weight of these criteria and overlaying these maps to obtain the final map. The analytical hierarchy process (AHP) is known to be a good method to overcome this problem [
5,
6,
7,
8,
9,
10].
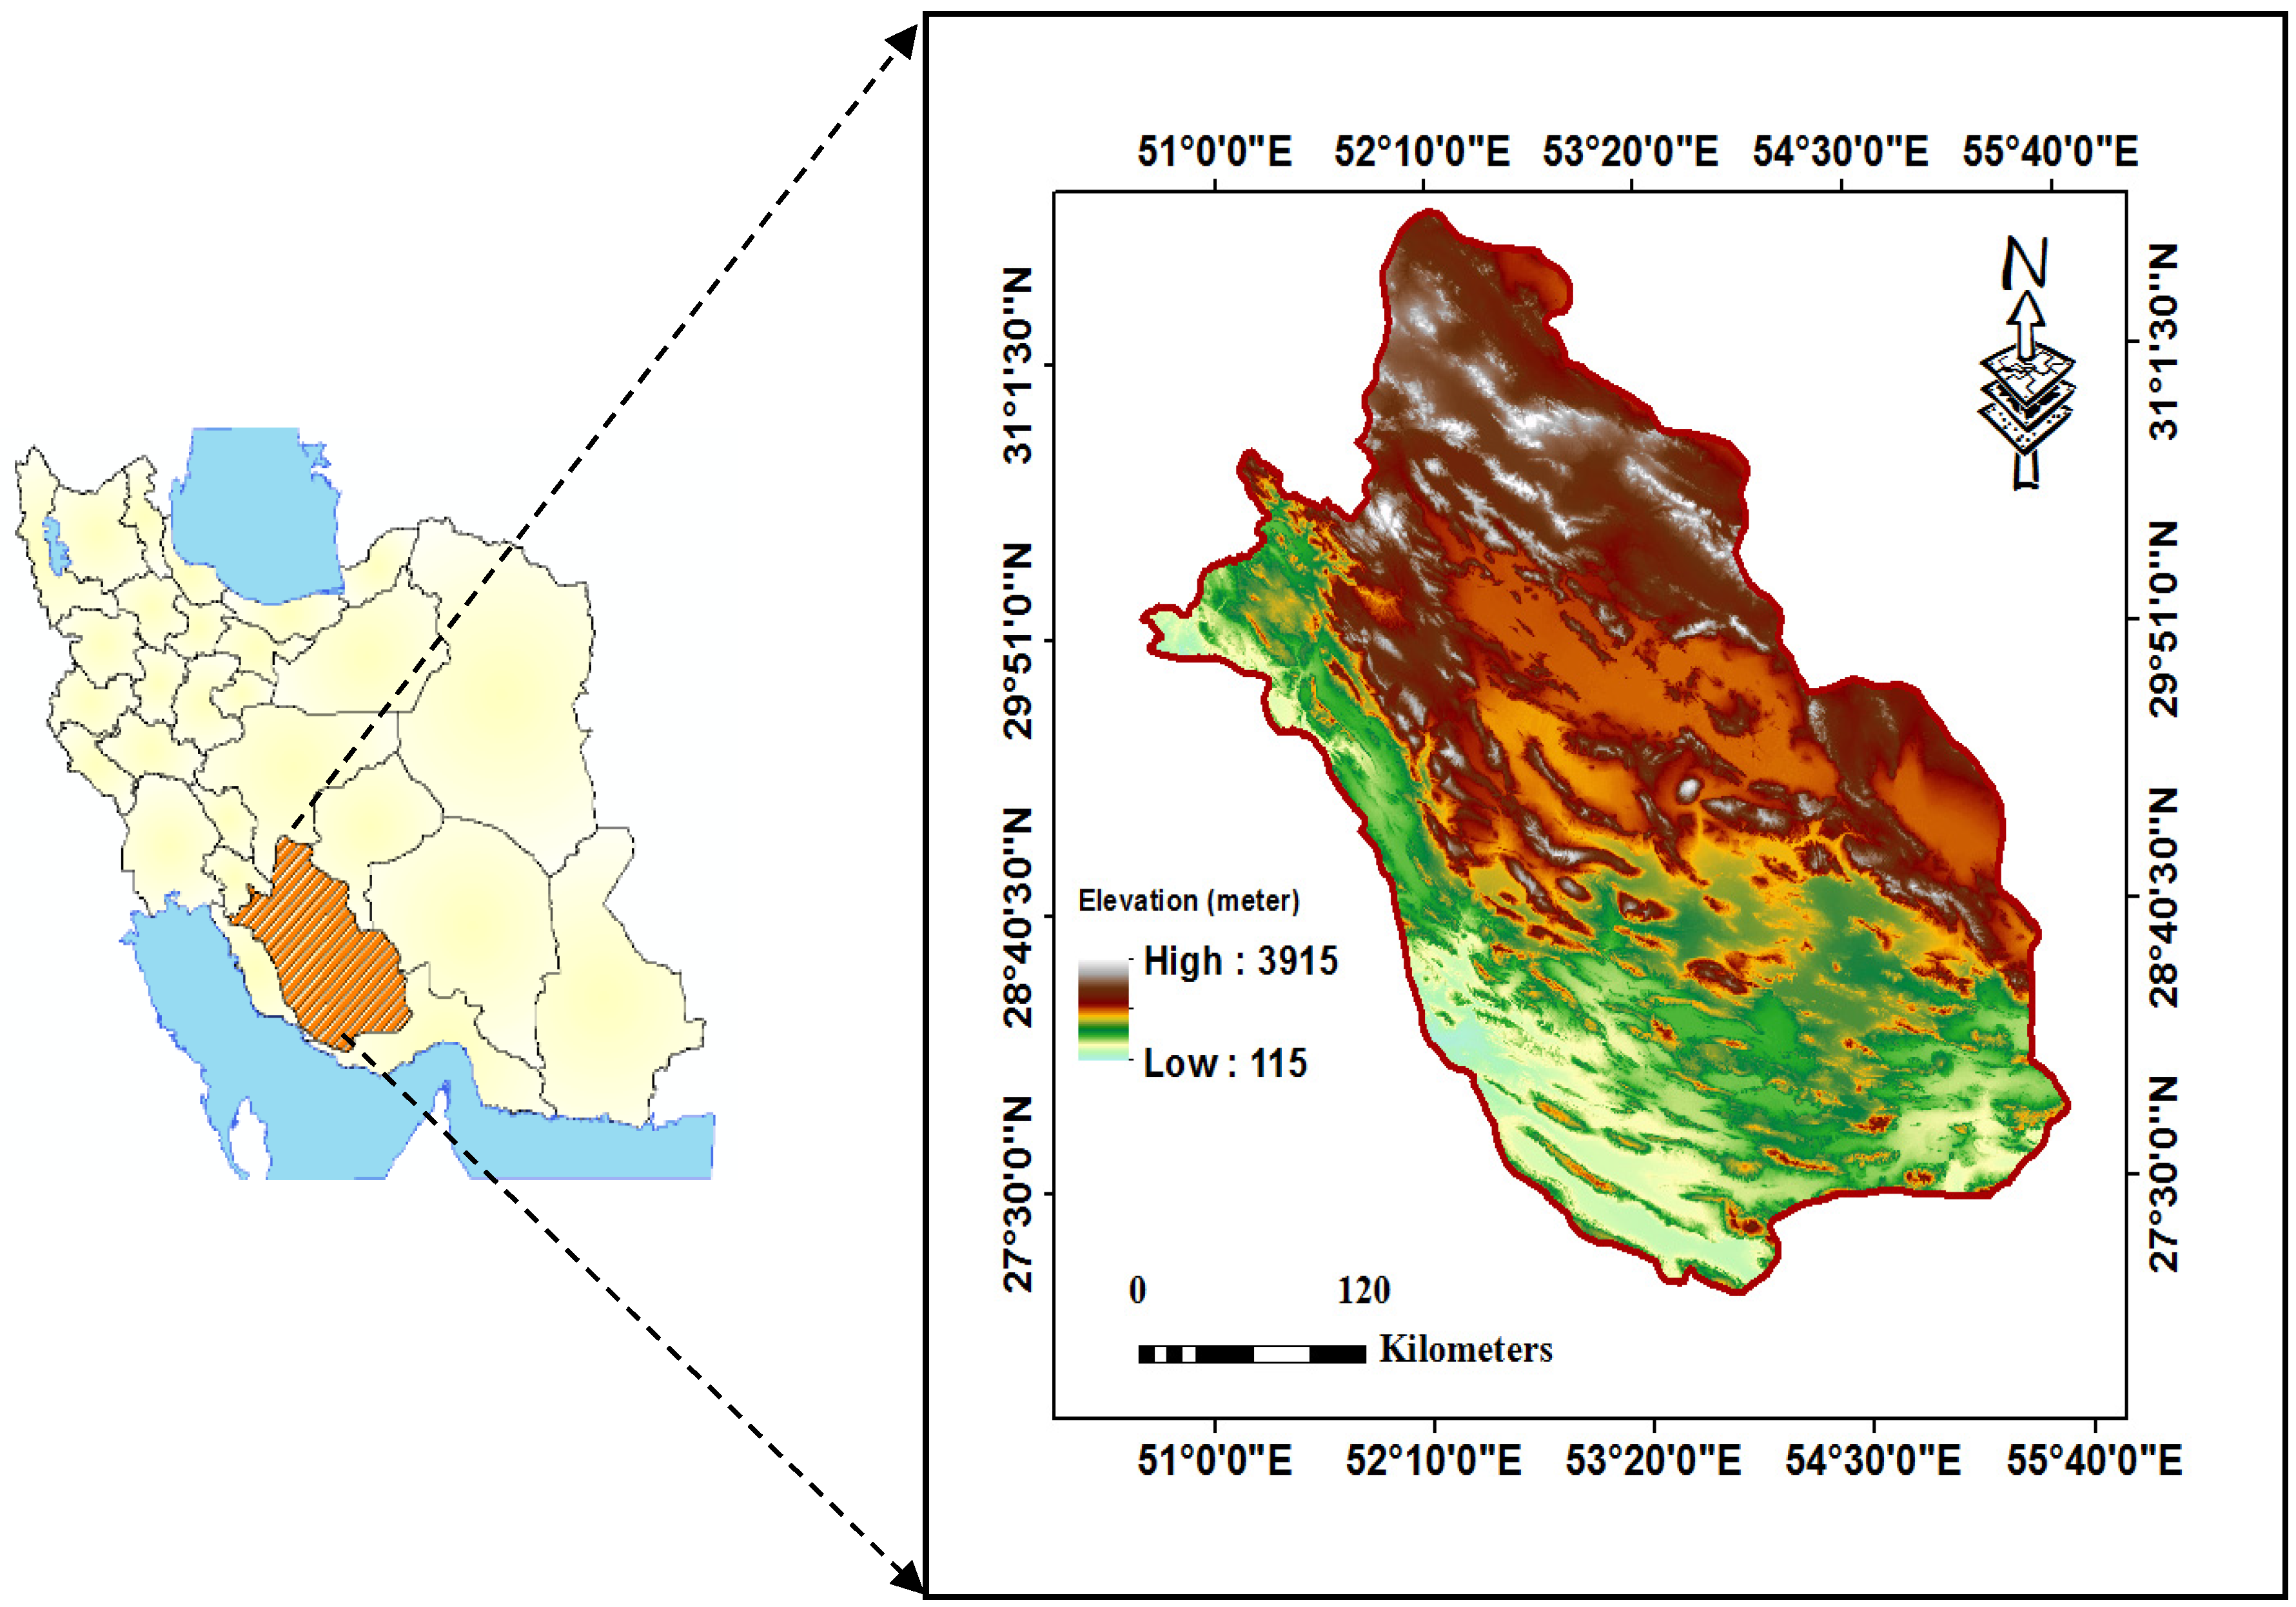
The current research was carried out to study the content of KSP and its variation in 52 calcareous soils of southern Iran and to map KSP as an index of K fertility using the fuzzy and AHP methods. The results of this investigation may be important for K fertility management of calcareous soils of southern Iran.
3. Results and Discussion
Some physical and chemical properties of the soil samples are shown in
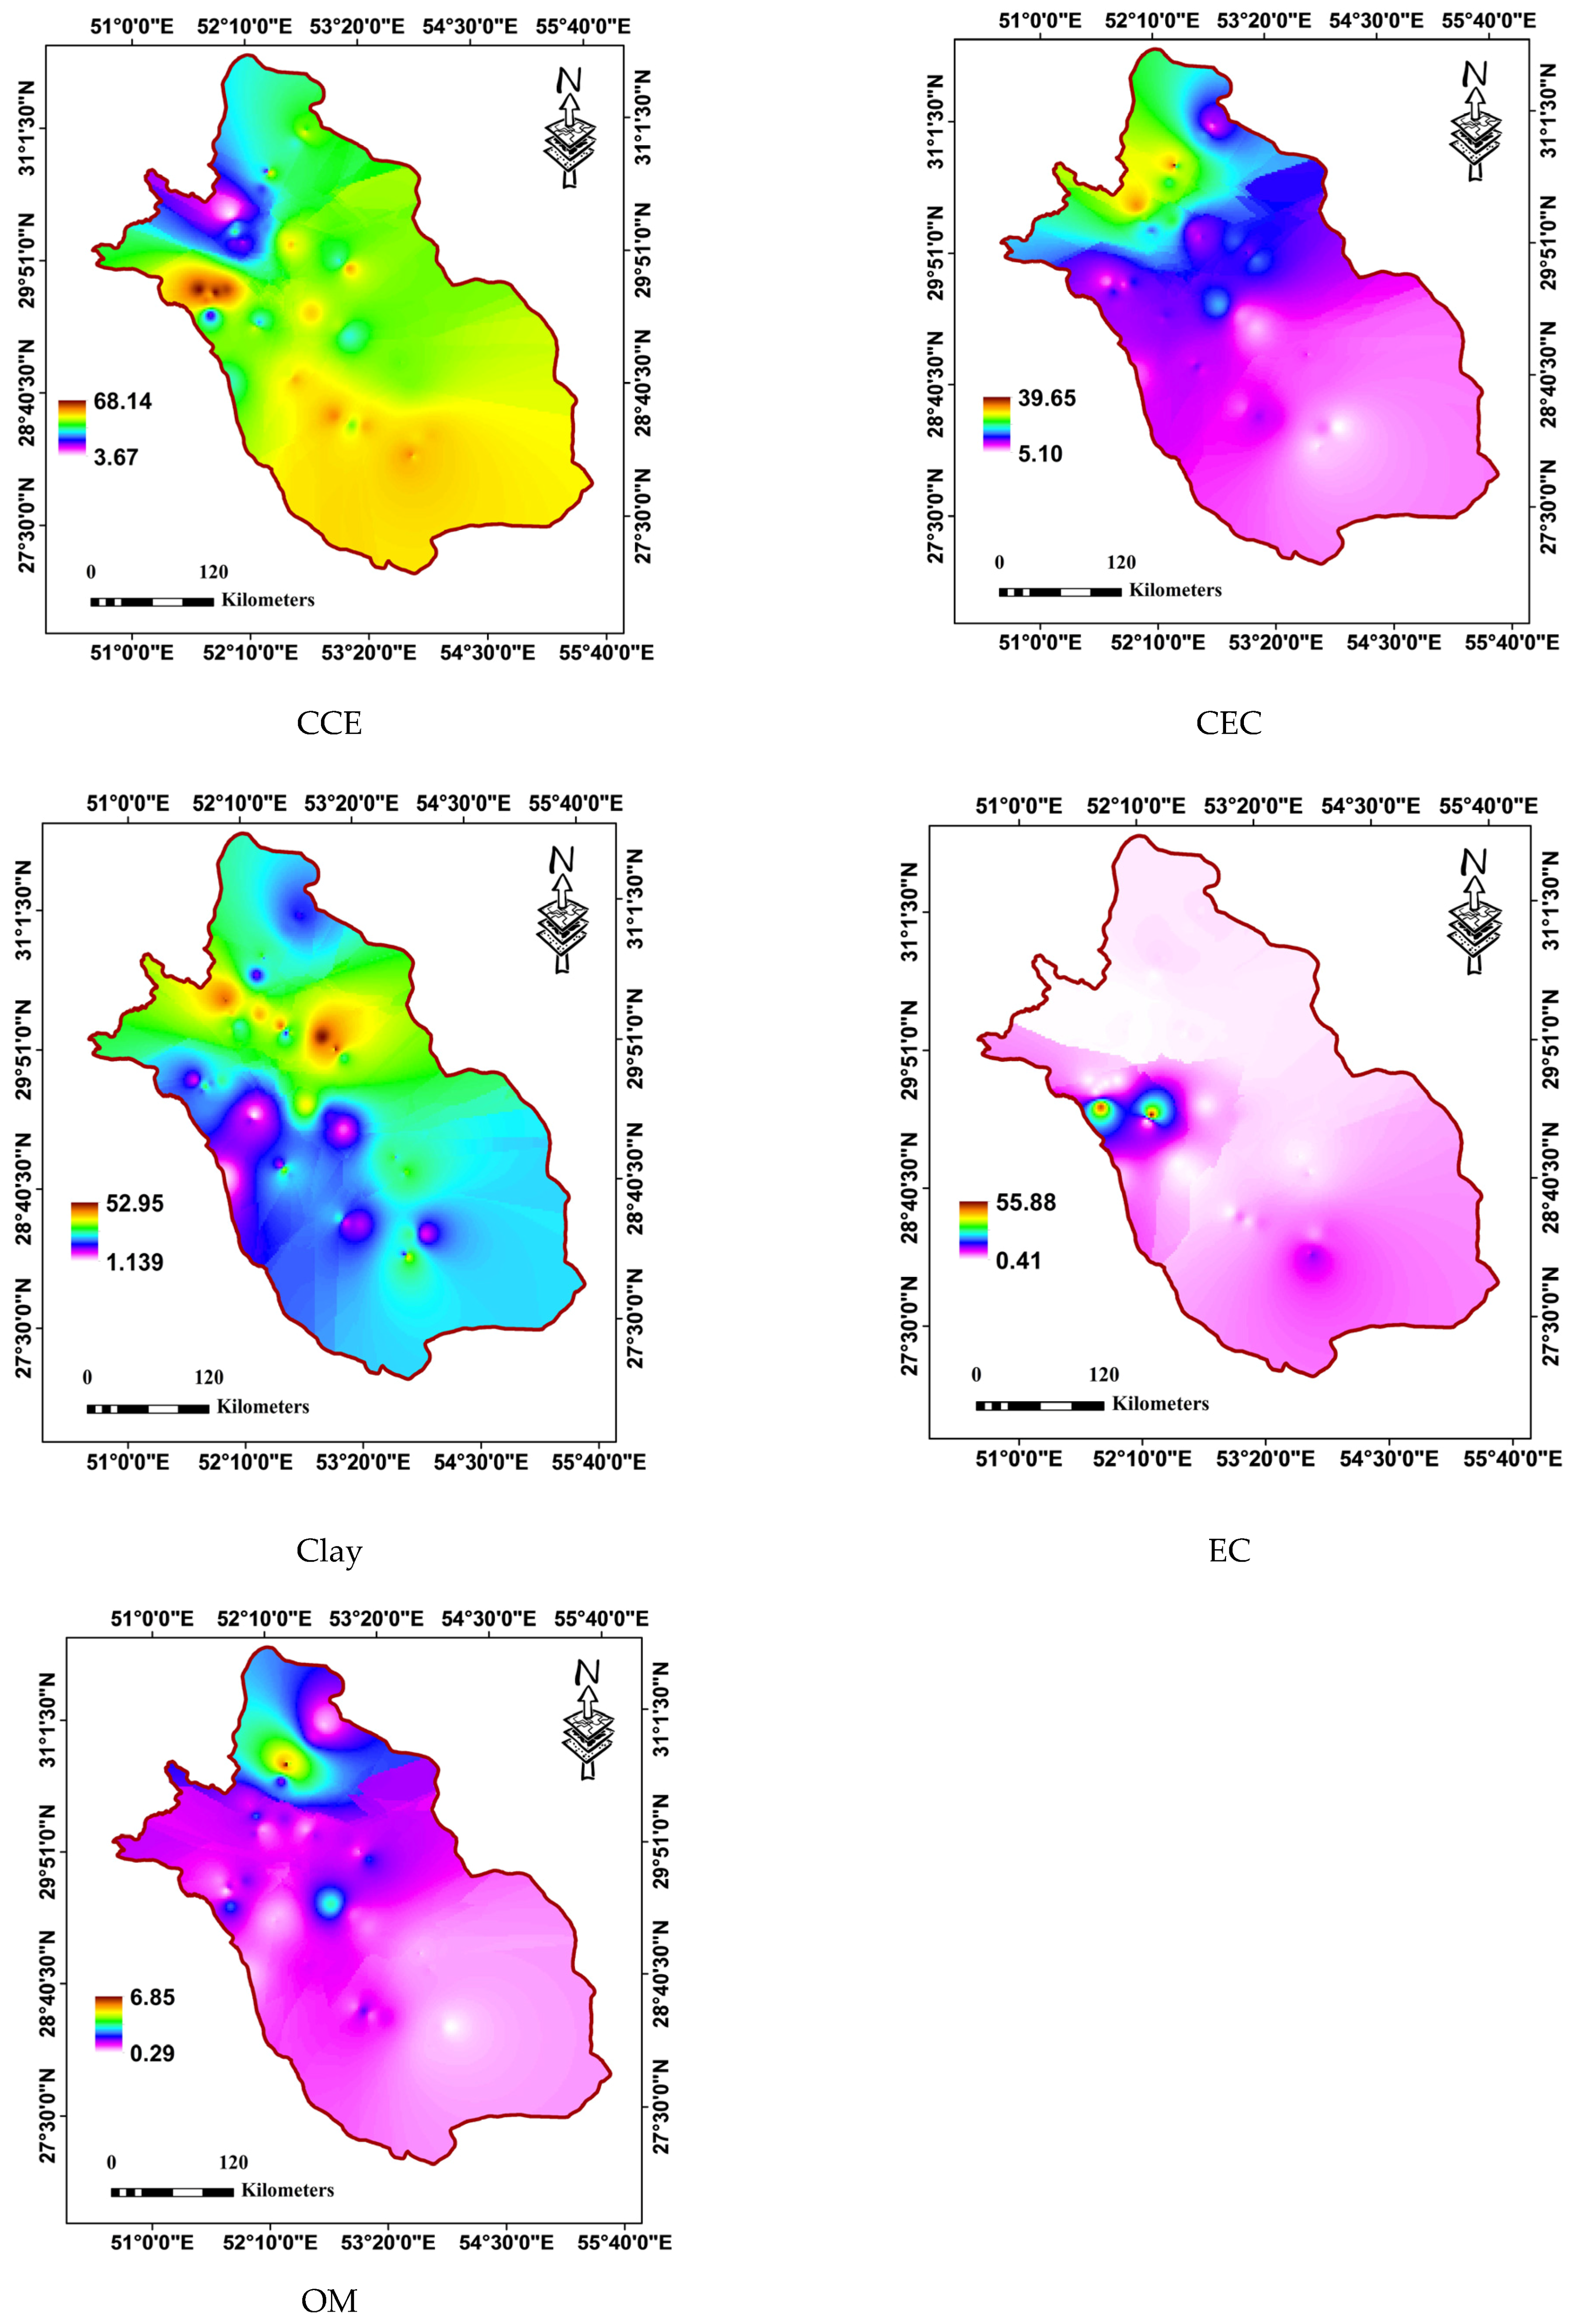
Table 1. All soils were calcareous and the average calcium carbonate content was 41%. A wide range of clay content, salinity, CEC, and organic matter contents was observed in the studied soils. This may be due to the different parent materials (including calcareous, gypsiferous, and saline alluviums), different climatic zones, different physiographic positions (including lowland, piedmont plain, river terrace, alluvial fan, and alluvial plain), different land covers (forest, range, agriculture, etc.), and divergent mineralogical compositions. Higher values of CCE were found in southern and to some extent southwestern locations within the studied area; while the lower values were related to the northwest part. Cation exchange capacity of the south and center parts were considerably lower than the north part. Clay content showed no regular distribution, but some small-scale regions in the center to the north part had soils with higher than 40% clay content. Generally, soil salinity was a serious problem for some parts in the west of the studied region. Most parts in the studied region had lower than 1% organic matter (OM) in the surface soils, however, some parts in southern Fars had a considerable content of OM (higher than 5%). Generally, soils that developed in cooler and more humid regions had higher clay, organic matter, and CEC and lower CCE, EC, and pH [
22]. Significant correlations were found between CEC and CCE (−0.67,
p < 0.01), OM (0.90,
p < 0.01), sand (−0.44,
p < 0.01), and clay (0.44,
p < 0.01). Clay content was also correlated with CCE (−0.32,
p < 0.01), sand (−0.68,
p < 0.01), and silt (−0.42,
p < 0.01). Significant relationships of the mentioned parameters with different forms of K and KSP in calcareous soils of Iran have been previously reported by Najafi-Ghiri et al. [
1] and Nabiollahy et al. [
23]. The value of KSP in the studied soils ranged from 0.4% to 9.2% with an average of 4.4%. These results are comparable with the findings of Al-Zubaidi [
24] for Iraqi soils (mean of 4.51%) and higher than the findings of Al-Zubaidi et al. [
3] for some Lebanese soils (mean of 1.73%).
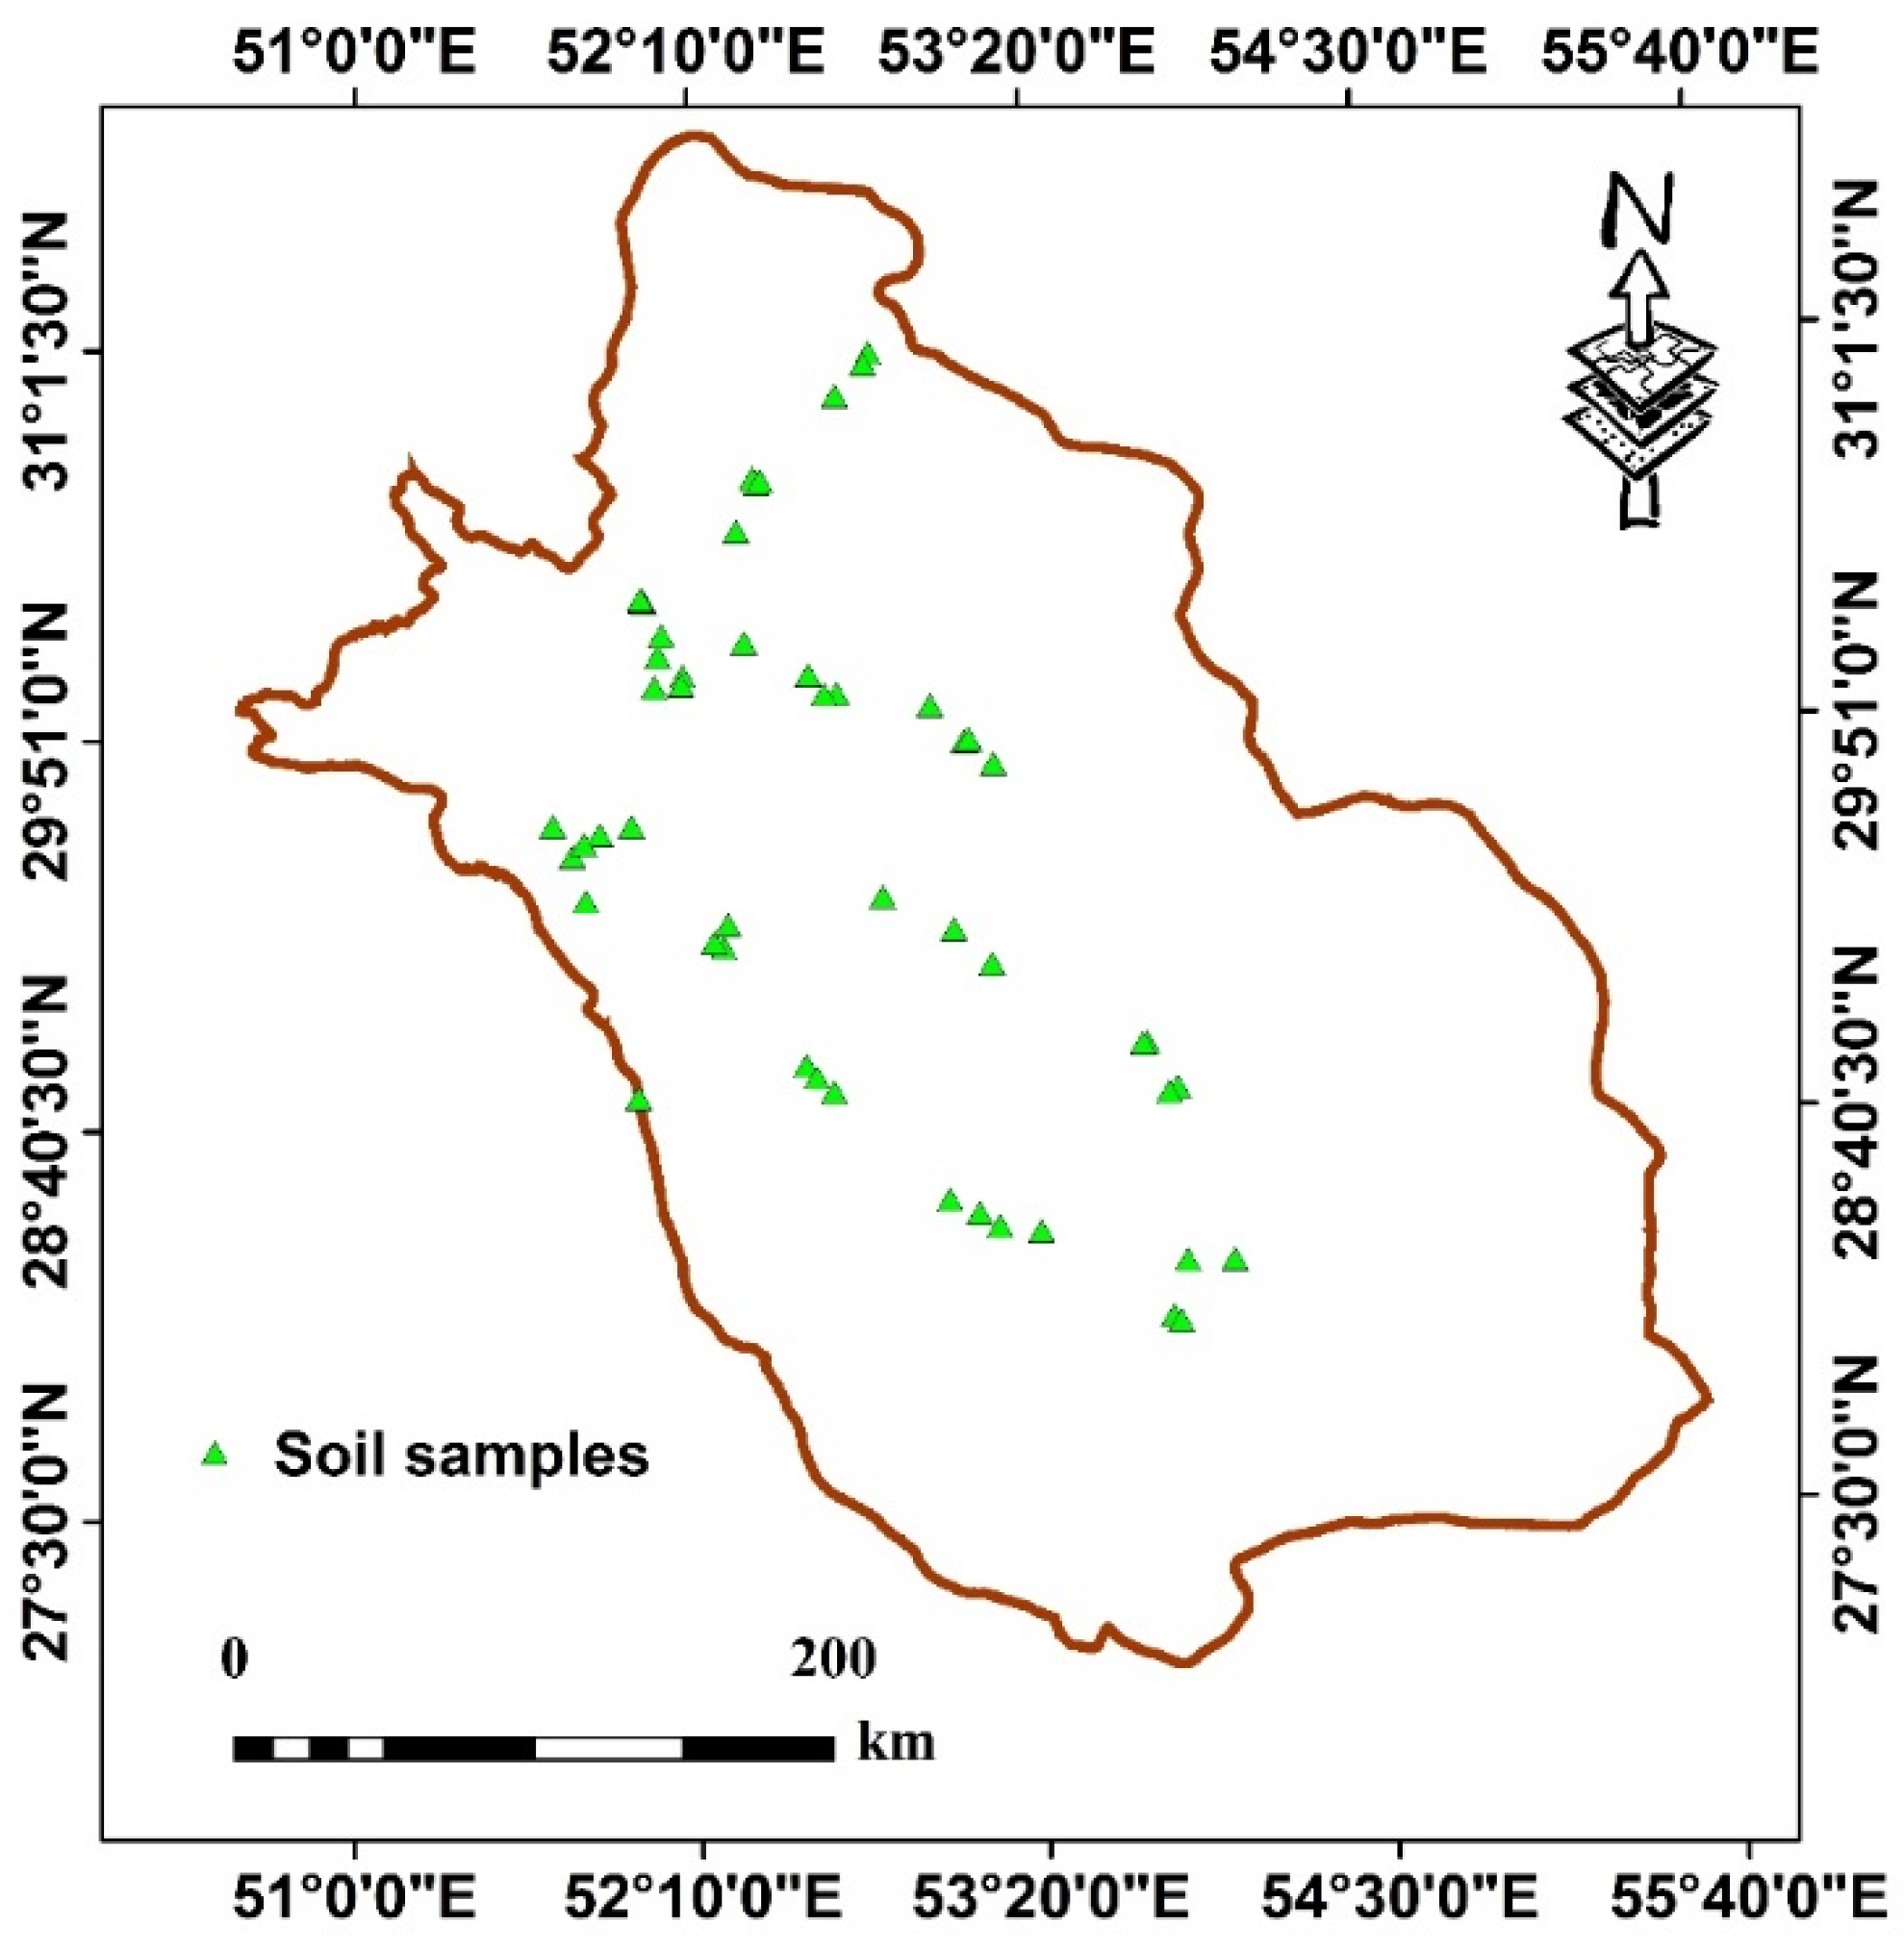
In this study, the spline, inverse distance weighted (IDW), and simple kriging methods (Gaussian, circular, spherical, and exponential models) were used for production of raster maps for each soil parameter in ArcGIS 10.2 software (Esri, New York, NY, USA). These methods are usual for the preparation of interpolation maps. For selection of the best method we used root-mean-square deviation (RMSE); 70% of the data was used as training data (37 samples), and 30% was used for testing data (15 samples), with the data randomly allocated for either training or testing purposes. The results of RMSE for three models showed that the simple kriging method (circular model) with the lowest RMSE is the best model for prediction of soil parameters (
Table 2).
Therefore, the prediction of soil properties was carried out by using the circular model in the study area. The maps of soil parameters were constructed by kriging method interpolation among 52 sampling points which are shown in
Figure 3.
Next, the capability of linear functions to calculate the fuzzy memberships was examined for prediction of the different KSP conditioning factors in ArcGIS 10.2 (extension of spatial data modeller (SDM)). In order to define membership functions, data in
Table 3 was used [
25,
26,
27,
28,
29]. According to
Table 3, variations in the different KSP conditioning factors are linear. Therefore, a linear function was used to define the membership function for each parameter in this study.
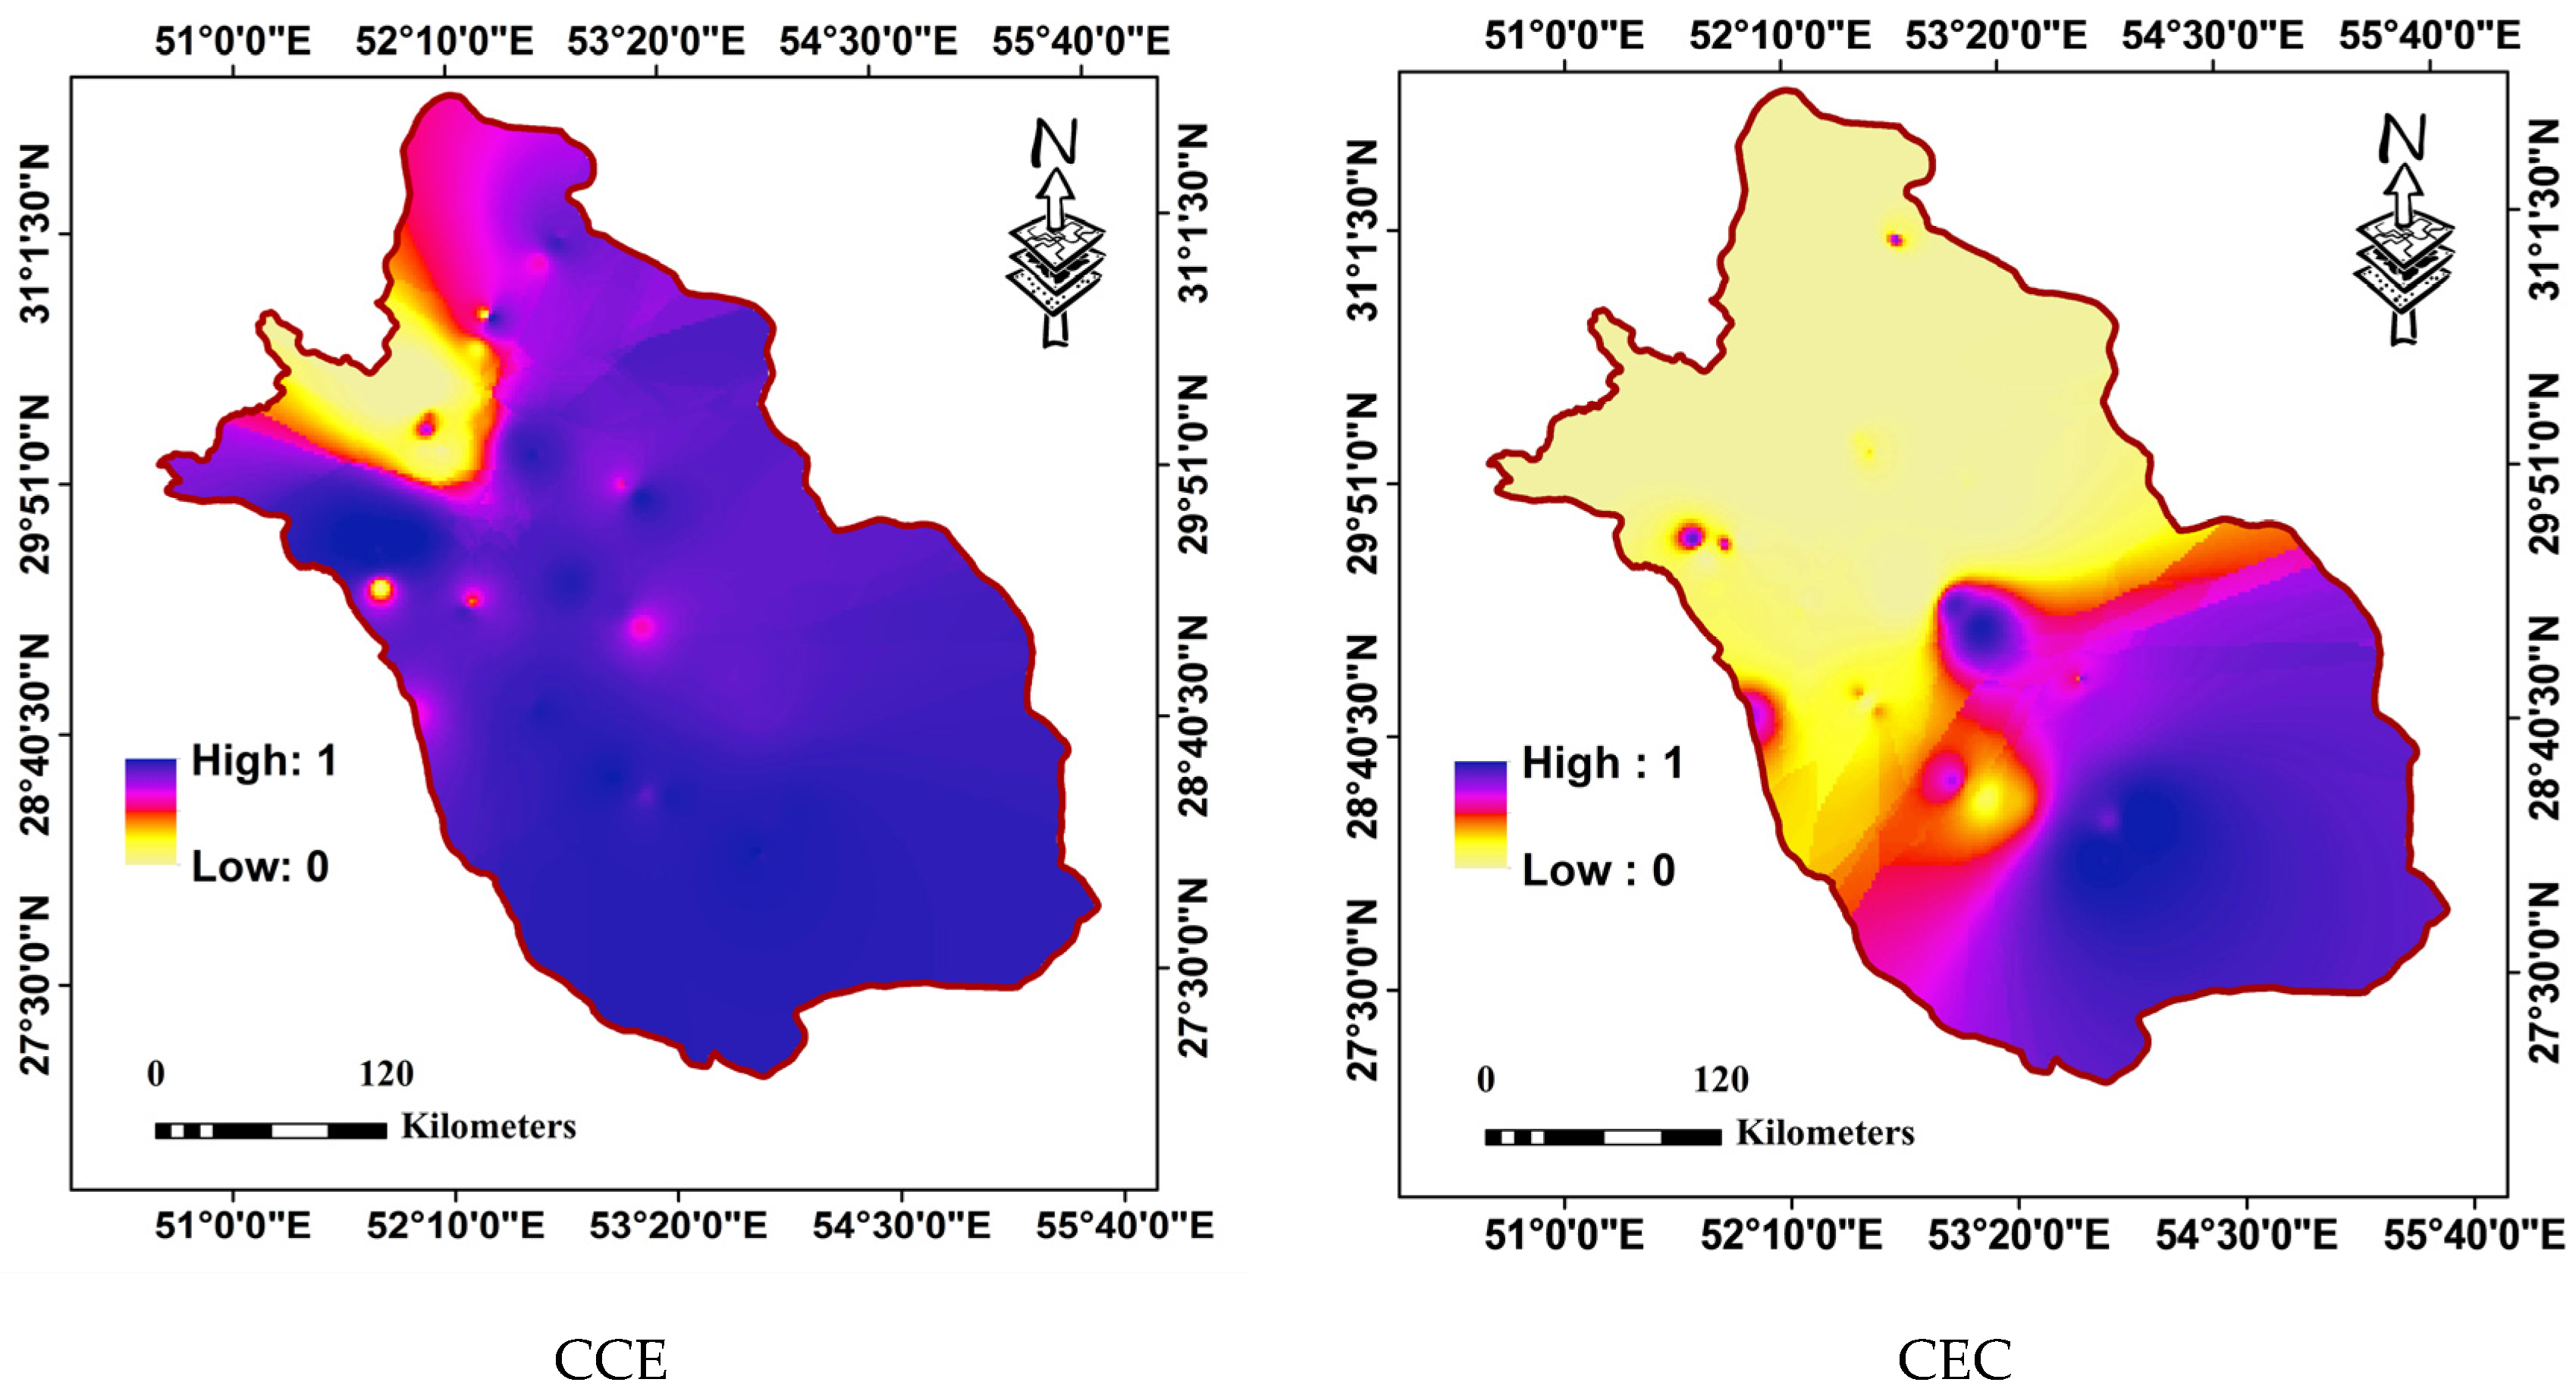
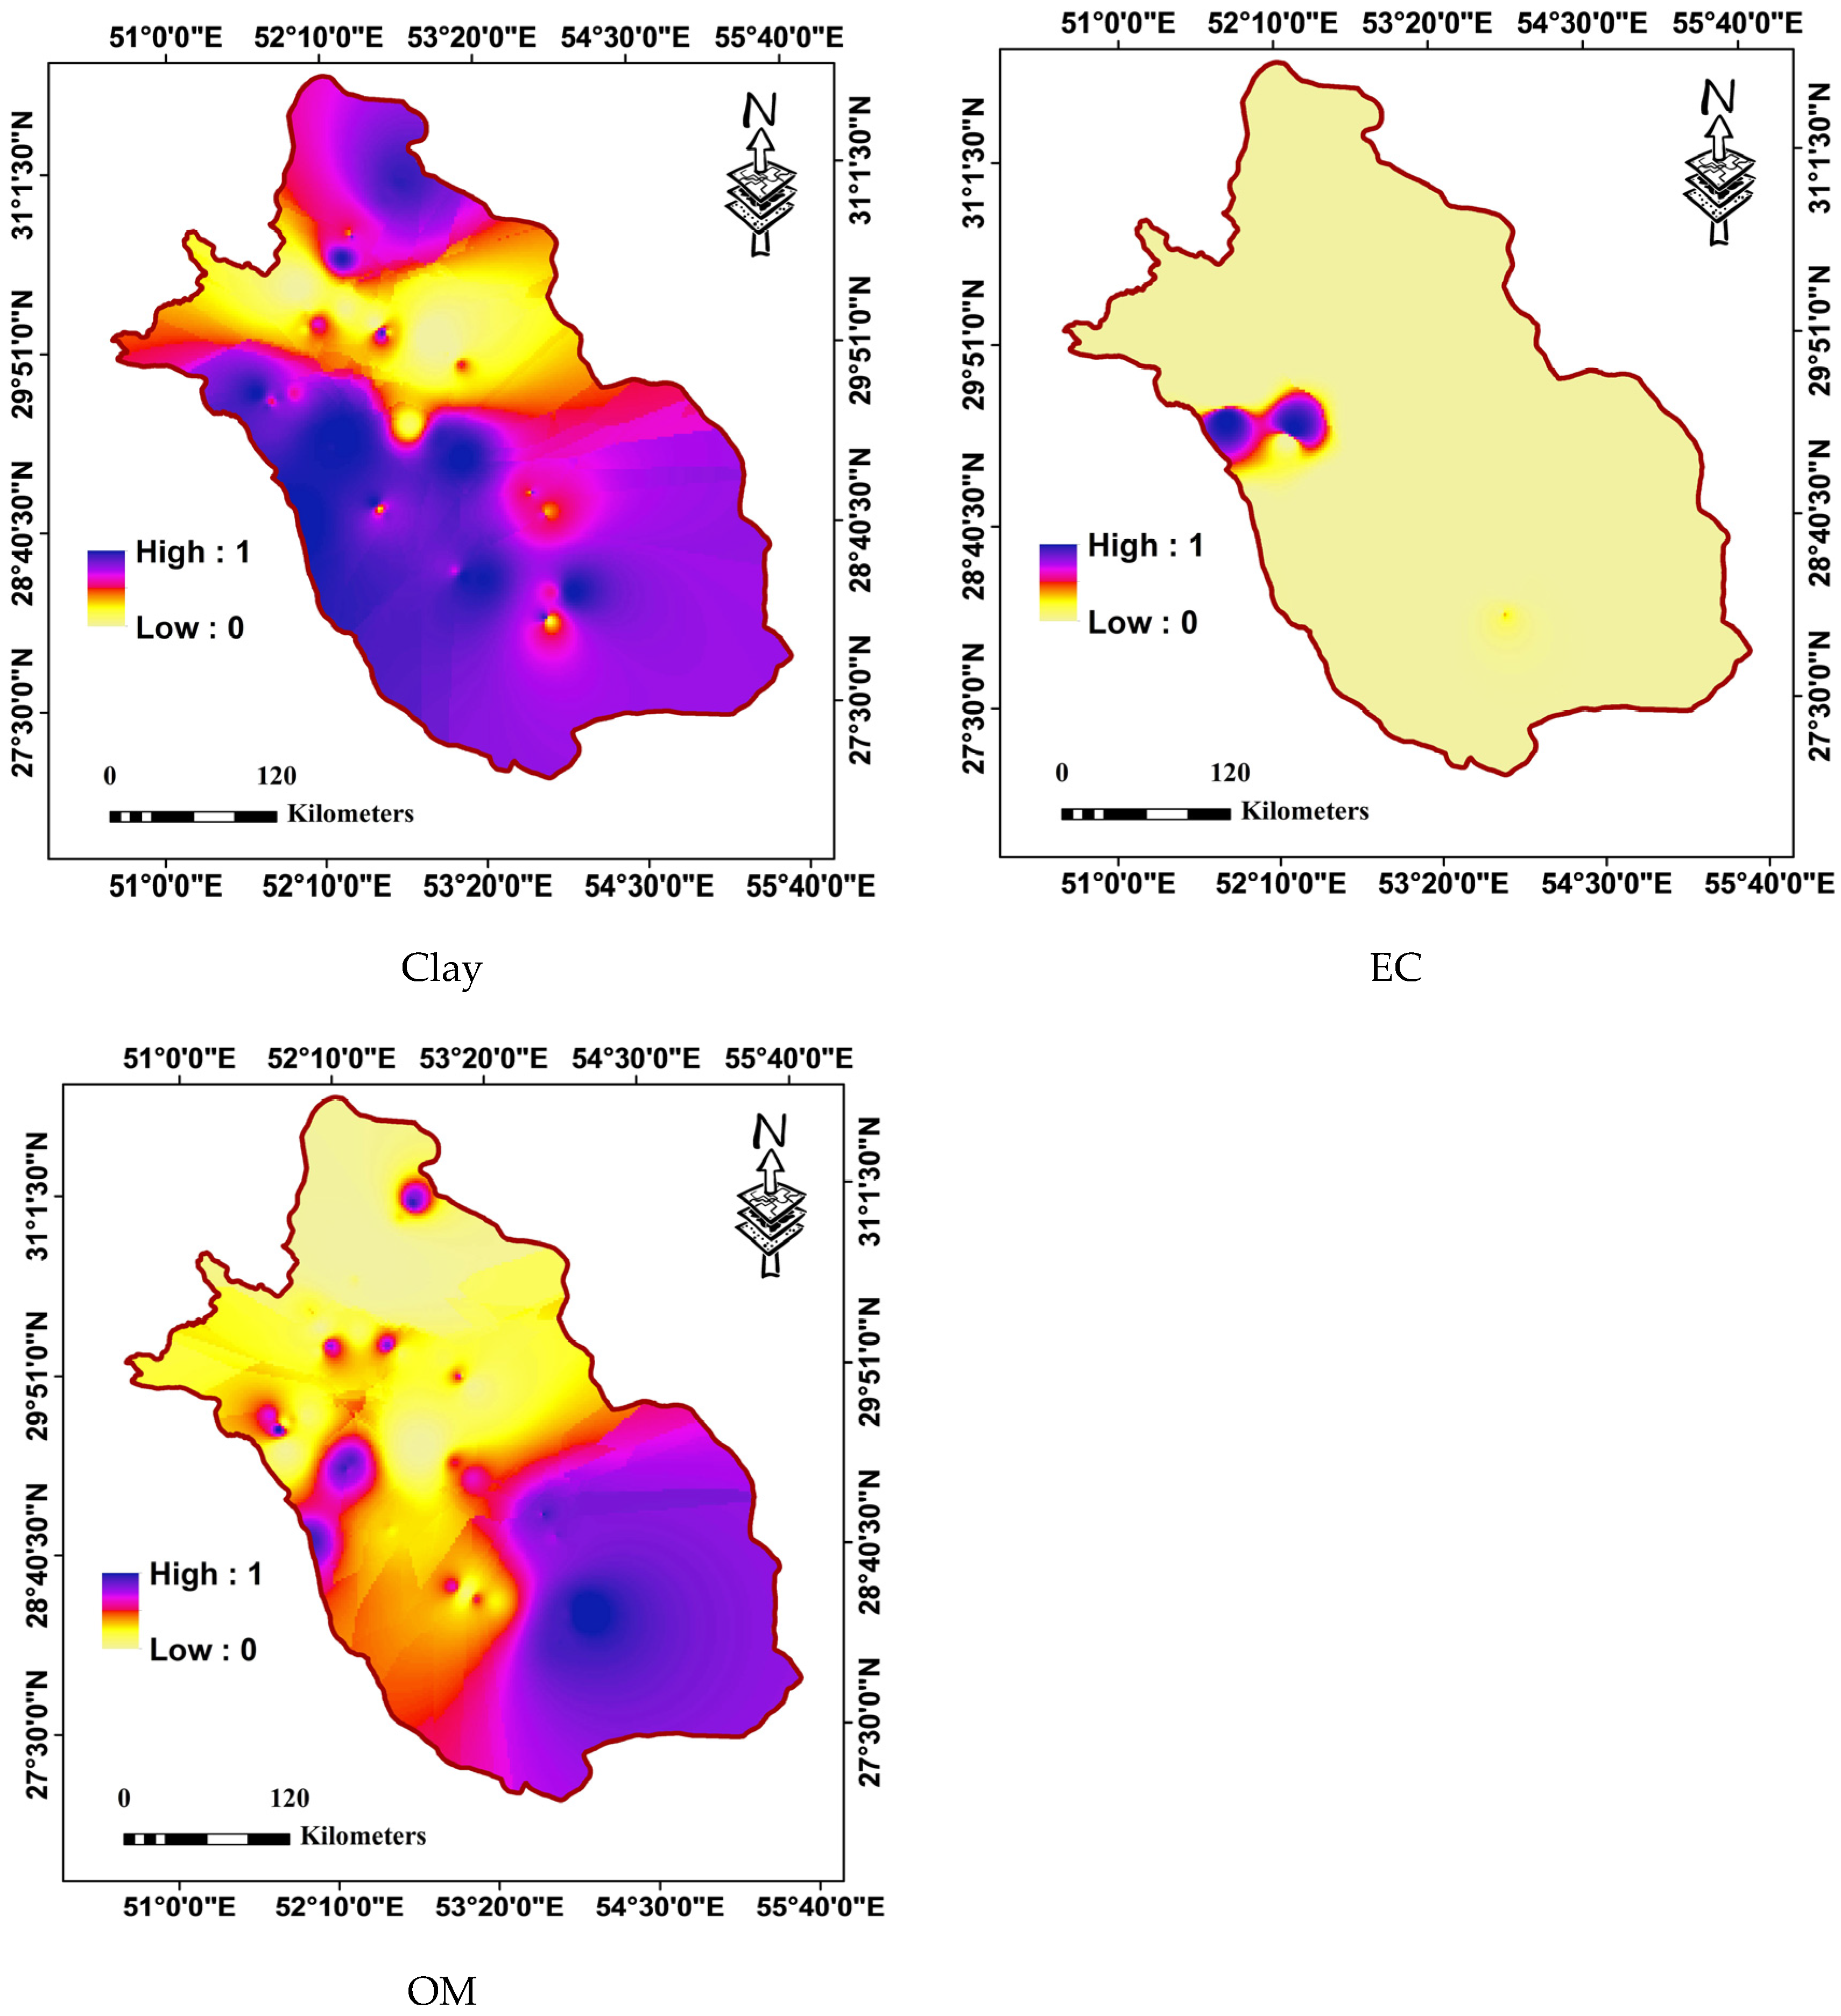
The best fuzzy membership was achieved by using the linear functions (Equations (4) and (5)). The resulting maps for each of the KSP conditioning factors are shown in
Figure 4. According to
Figure 4, the CEC and OM contents in the soils of the north regions were the lowest, while CCE and clay contents in some of the soils from parts of the northeast and northwest regions were the lowest, respectively. For EC, the highest content was related to some of the soils from the west regions. Then, for overlaying the maps and preparing the KSP map, the AHP method was applied on the fuzzy maps. The pair-wise comparisons matrix that was used for preparation of the weights for each KSP conditioning factor was determined by consulting experts opinions including soil investigators (six experts) about the chemistry of soil K, agronomists (six experts) about K absorption and utilization by plant roots, geomorphologists (three experts) about the relationships between different soil properties and land physiography with soil K, and soil mineralogists (three experts) about the importance of different clay minerals in K release, fixation, and availability; these weights are indicated in
Table 4. By taking each of the column values and dividing by the sum of the column the average weight was calculated for each of the parameters. According to expert opinions and a previous report from Najafi-Ghiri et al. [
1], it was determined that CEC, clay, CCE, OM, and EC were the most important parameters that had the highest effects on KSP, and the best relationship was observed between CEC and KSP. While KSP was defined as a percentage of CEC that was determined by K, with an increase in CEC, the value of KSP decreased. On the other hand, CEC is related to clay and organic matter content and thus these parameters may affect the KSP value [
25].
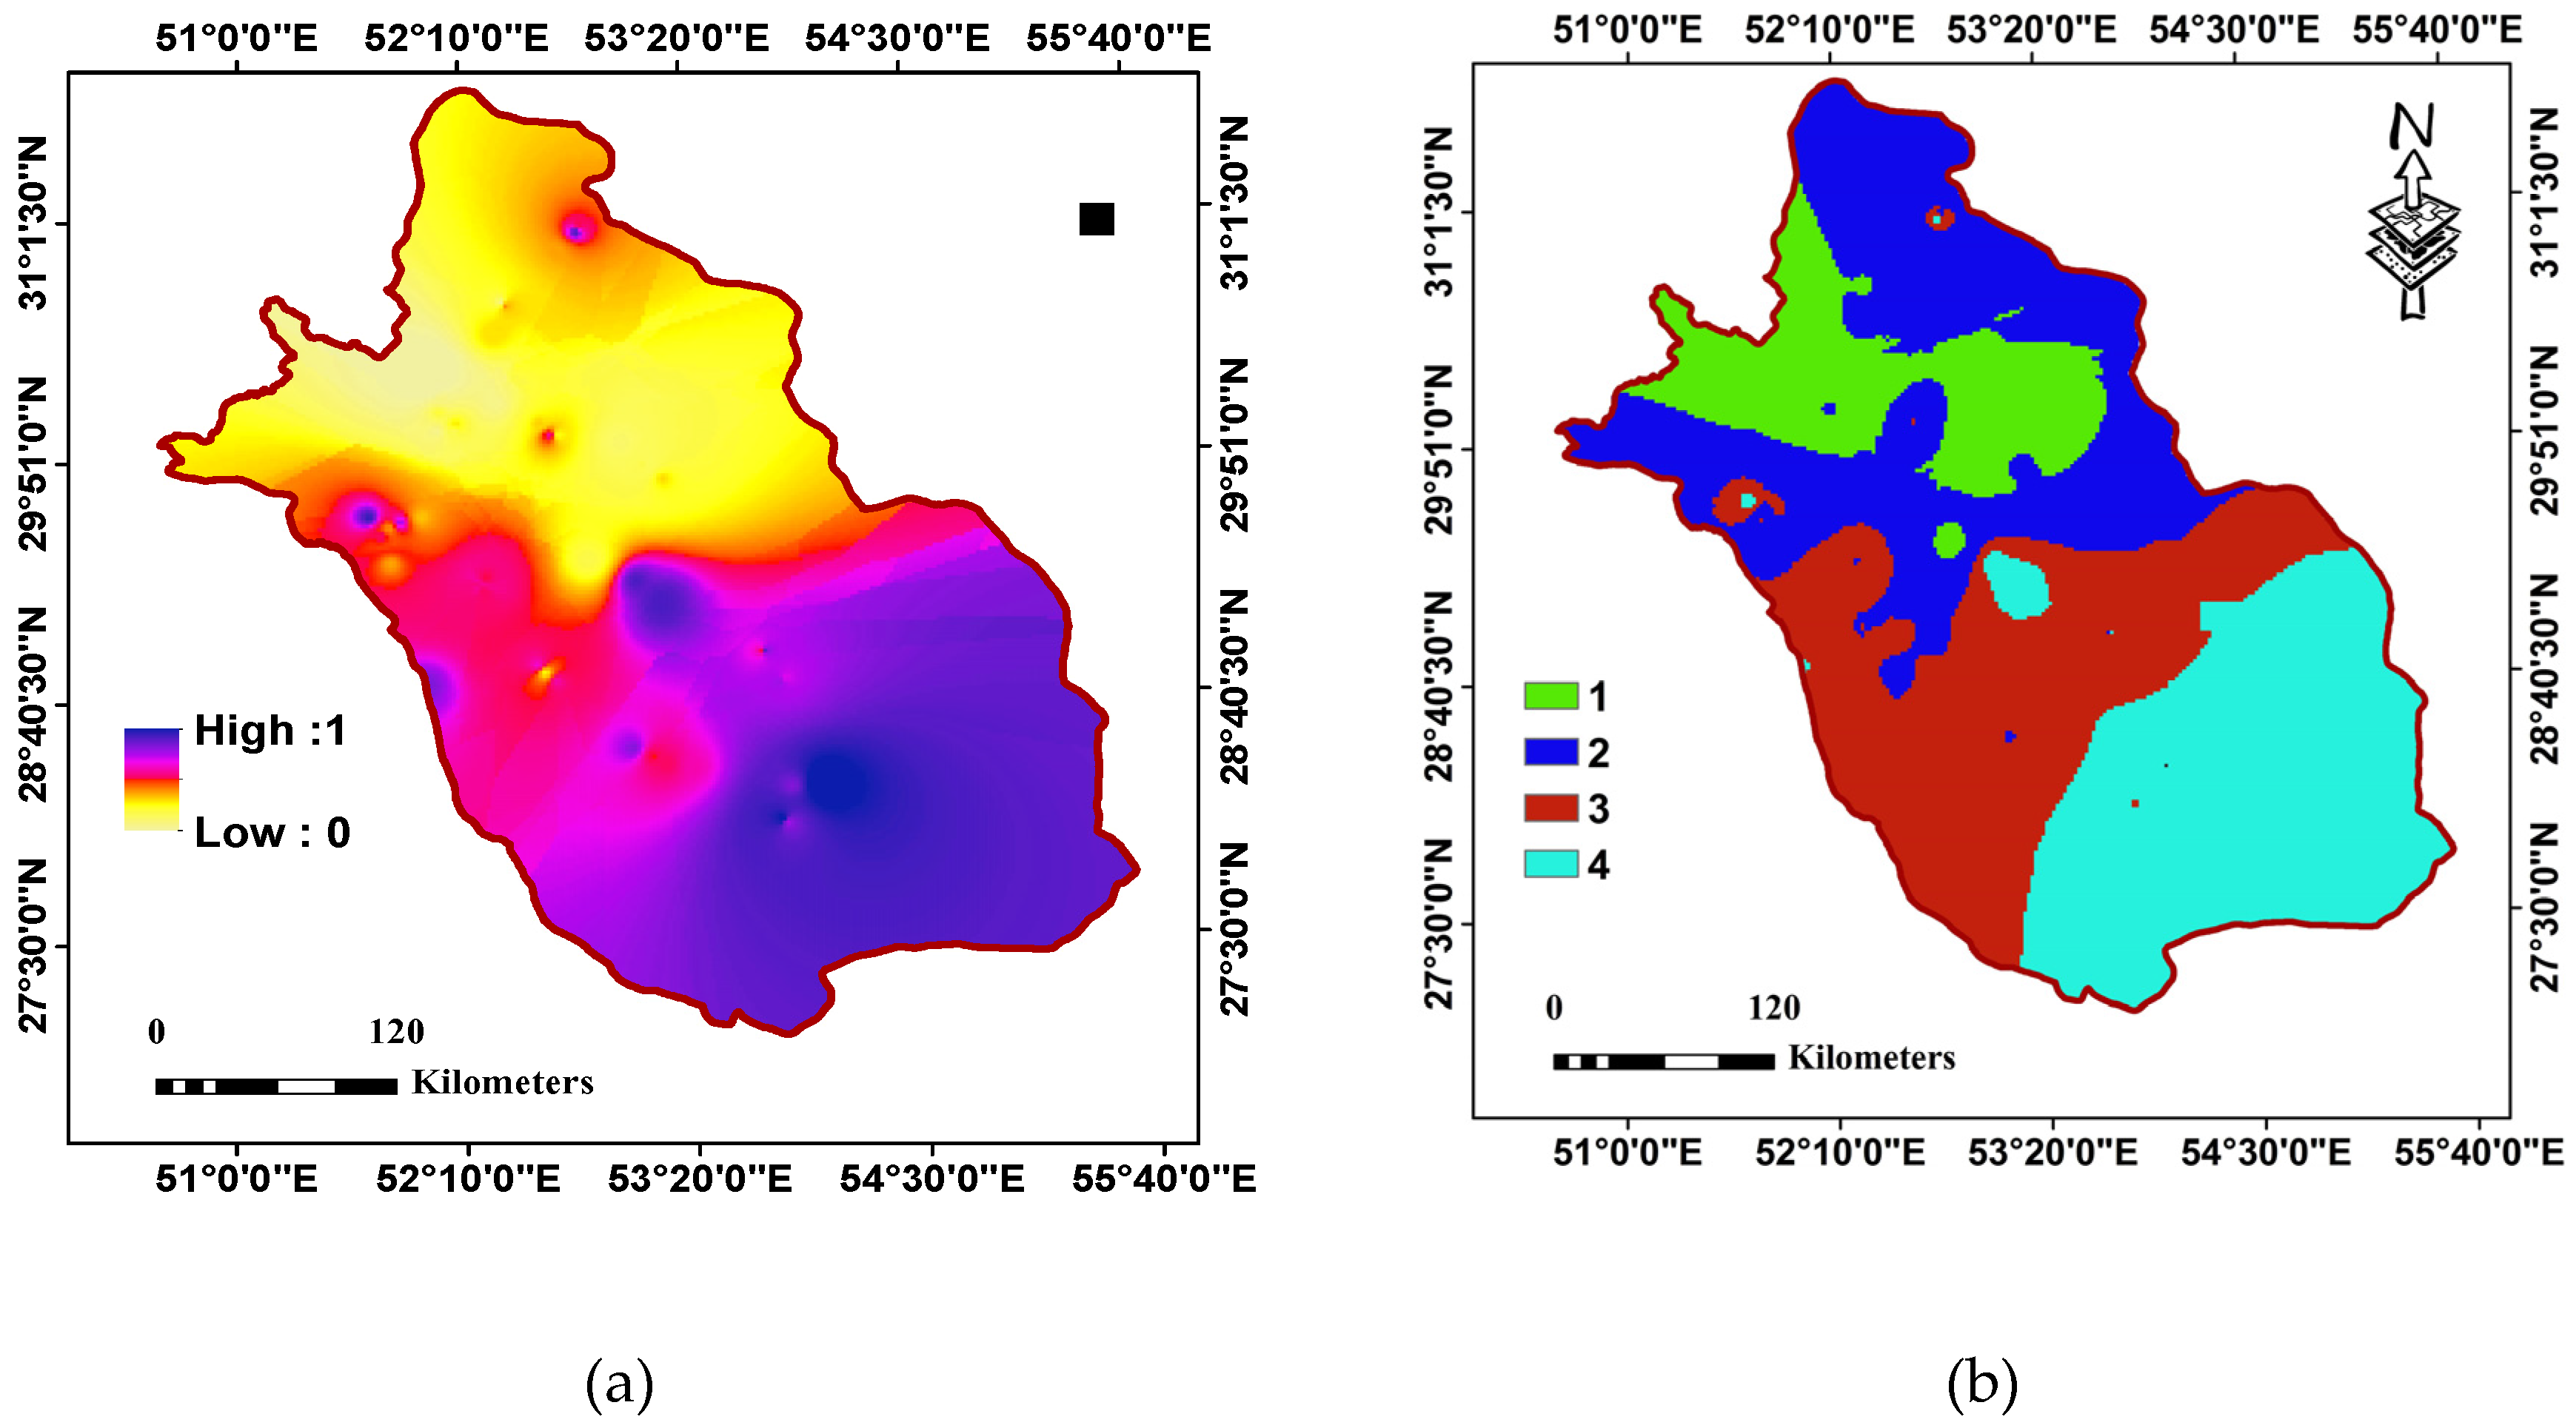
The results of fuzzy and AHP methods are shown in
Figure 5. The area of the land in each class is also shown in
Table 5. Generally, the fuzzy method classifies the studied region into four classes including very low, low, moderate, and high [
19]. About 60% of the studied area is classified as belonging to the moderate and high KSP classes and 40% of the studied area had low or very low KSP values. Generally, the KSP content in soils of the northwest to center area of the studied regions were the lowest, while the highest content was related to the soils of the south and southeast regions. According to
Table 4, it was determined that CEC had the maximum weight (0.42) and the most negative effect on KSP value. In considering these results, it was determined that the south region of the study area, with the minimum value of CEC, was located in a class 4 area according to a KSP map (KSP values of <1, 1–3, 3–5, >5 are classes of 1, 2, 3, and 4, respectively); while the north of the study area, with the maximum value of CEC, was located in a class 1 area with the lowest KSP. As such, CEC has the most effect on the final fuzzy and AHP maps for KSP. As mentioned, CEC is related to clay content and type and organic matter content. Thus, the soils of arid land (southern Fars province) that had the lowest content of organic matter and clay with low CEC, including illite and chlorite [
30], showed the highest value of KSP. On the other hand, more humid regions of Fars province (southwest area), with high organic matter content and high-charged clay like smectites, had the lowest value of KSP.
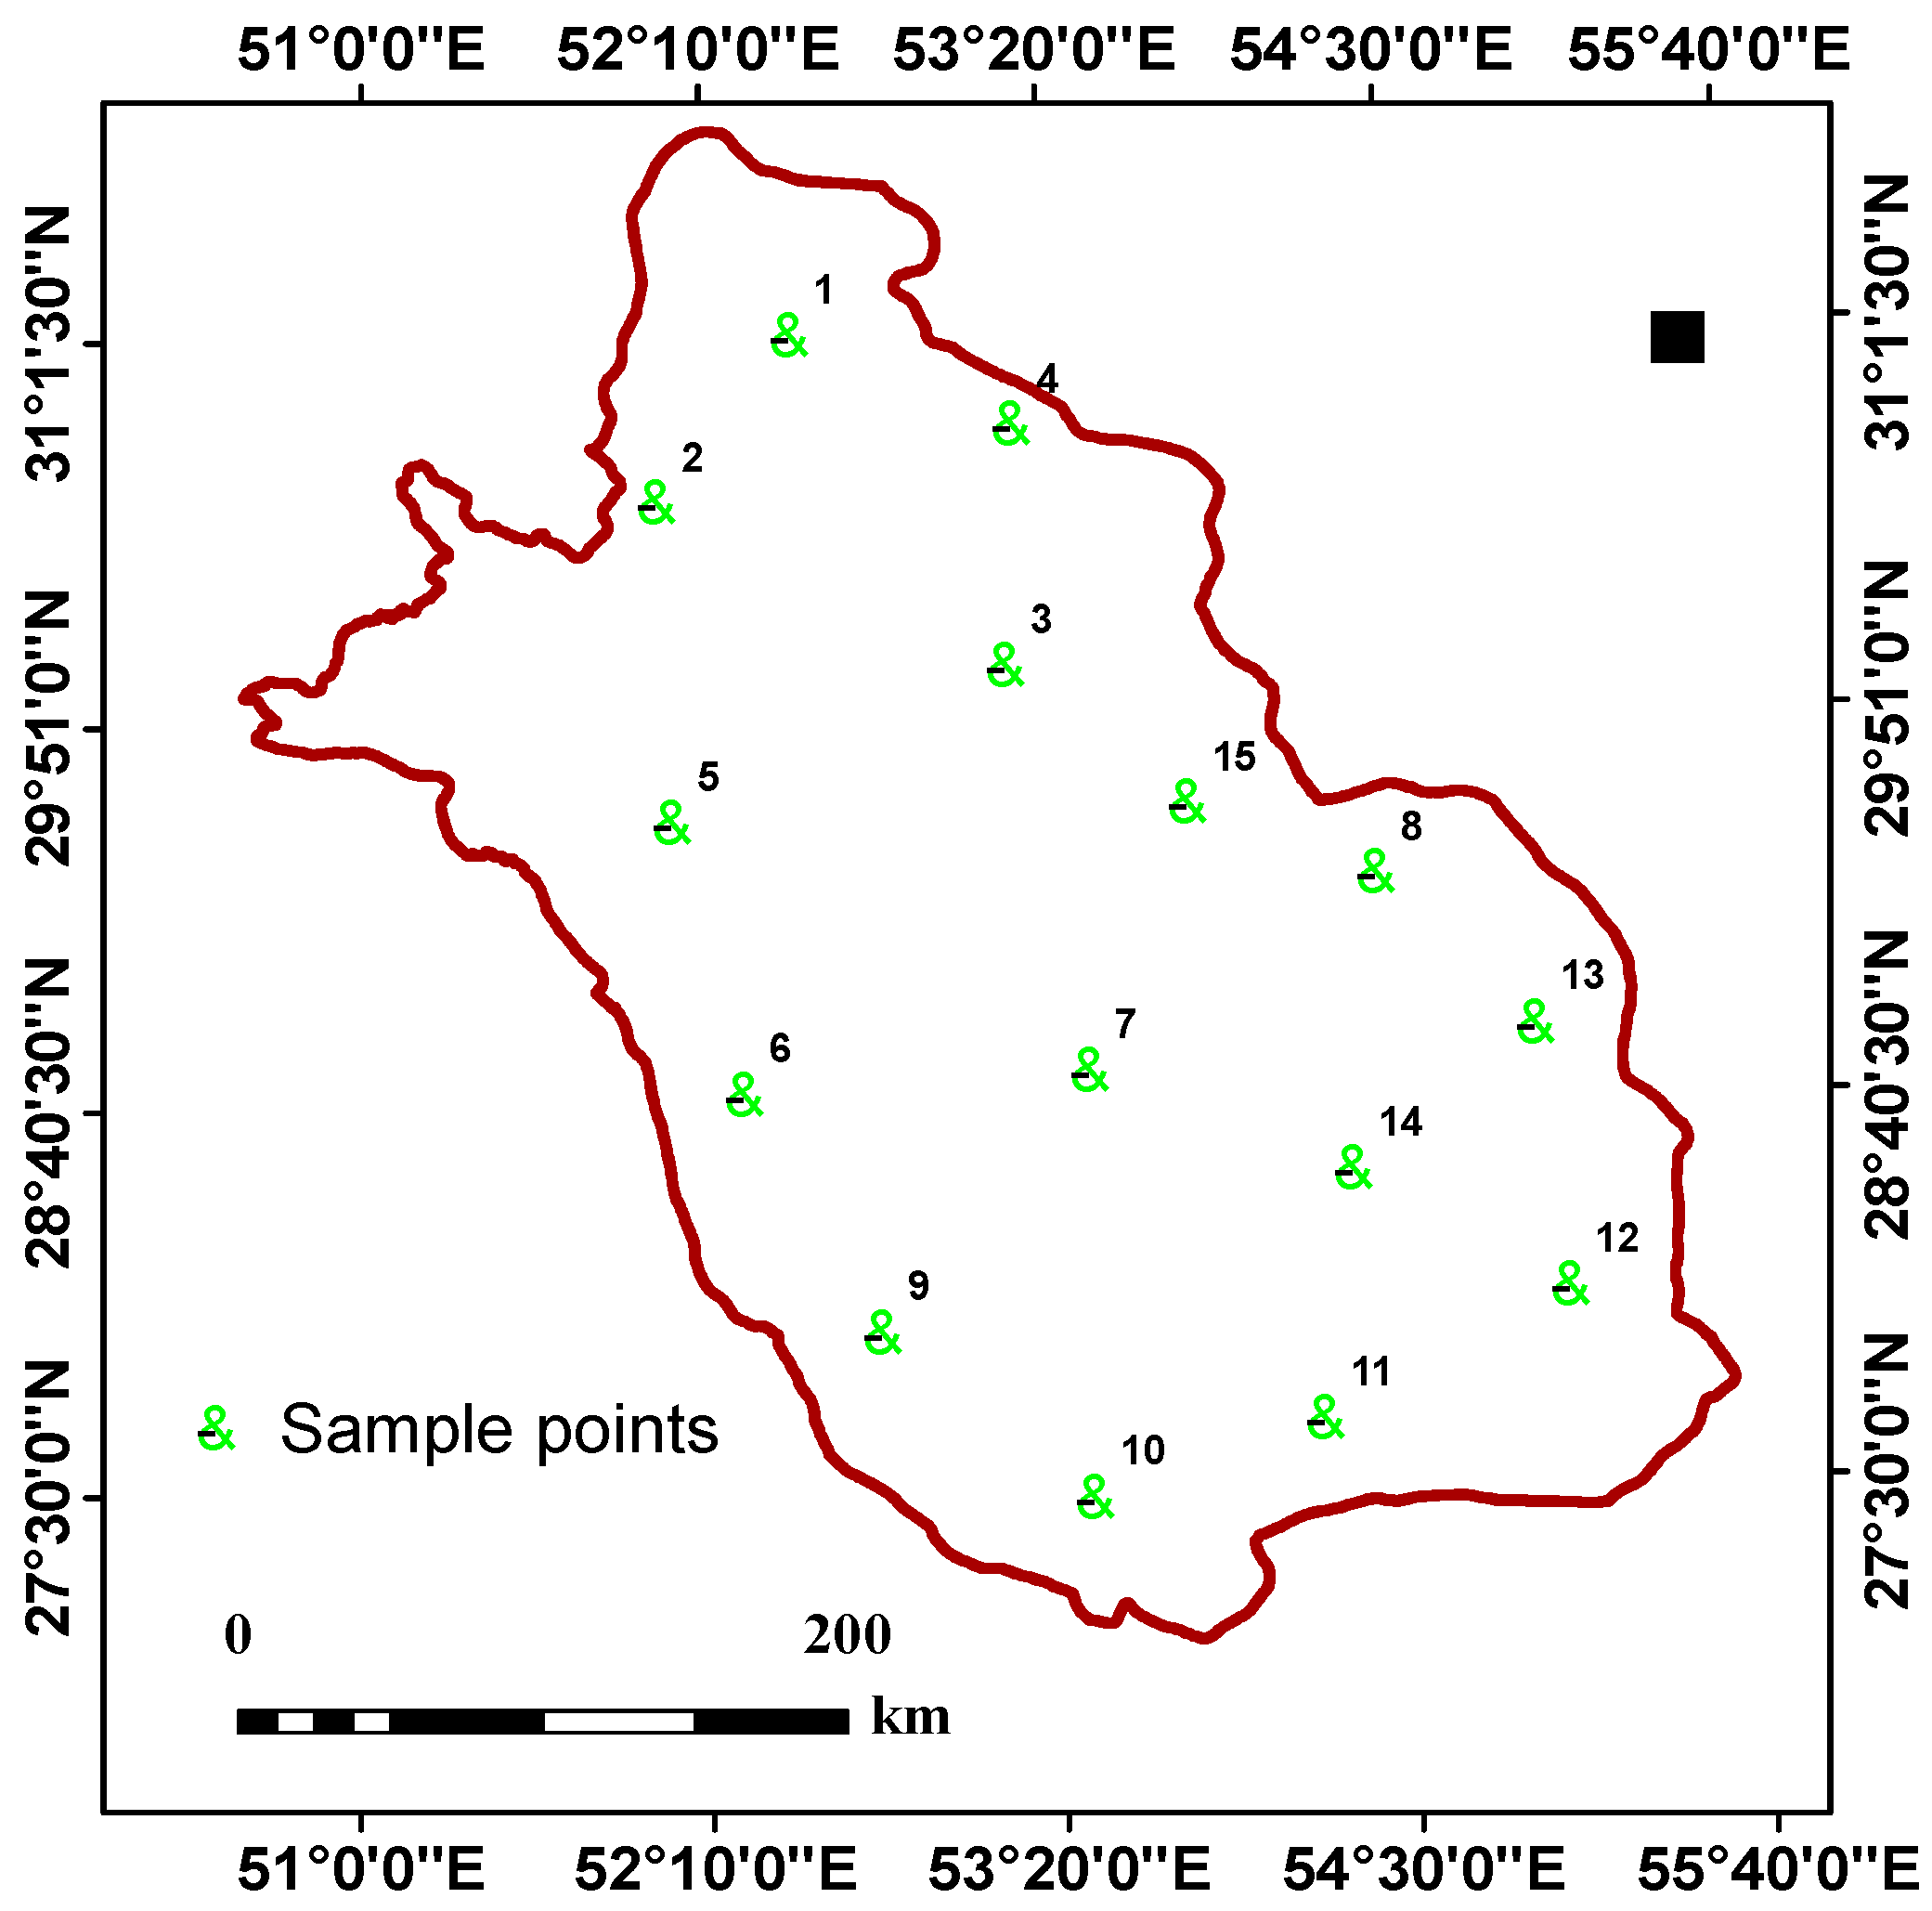
For determination of the accuracy of the fuzzy method, 15 sample points (equal to 30% of the primary studied points) were used. The results are shown in
Figure 6 and
Table 6. Then CCE, CEC, clay, OM, and KSP values were measured (
Table 6). The comparison of the content of each parameter (test data) with KSP map (
Figure 5) indicated that with decreases in the content of CEC, organic matter, and clay, the sampling point tended to be located in class 4 areas that had the highest content of KSP and vice versa. In fact, the method demonstrated high accuracy (100%) and was shown to be useful in the prediction of KSP values.


