Article

Microarray-Based Screening of Differentially Expressed Genes of E. coli O157:H7 Sakai during Preharvest Survival on Butterhead Lettuce

1
Institute for Agricultural and Fisheries Research (ILVO), Plant Sciences Unit—Crop Protection B. Van Gansberghelaan 96, Merelbeke B-9820, Belgium
2
Institute for Agricultural and Fisheries Research (ILVO), Food Sciences Unit—Food Safety Brusselsesteenweg 370, Melle B-9090, Belgium
3
Ghent University (UGent), Department of Food Safety and Food Quality, Laboratory of Food Microbiology and Food Preservation, Coupure links 653, Ghent B-9000, Belgium
4
Ghent University (UGent), Department of Pathology, Bacteriology and Poultry Diseases, Faculty of Veterinary Sciences, Salisburylaan 133, Merelbeke B-9820, Belgium
5
Ghent University (UGent), Department of Biochemistry and Microbiology, Laboratory of Microbiology, K.L. Ledeganckstraat 35, Ghent B-9000, Belgium
6
The James Hutton Institute, Cell and Molecular Sciences, Human and Animal Pathogens on Plants, Invergowrie, Dundee DD2 5DA, UK
*
Author to whom correspondence should be addressed.
Agriculture 2016, 6(1), 6; https://doi.org/10.3390/agriculture6010006
Submission received: 12 October 2015 / Revised: 5 January 2016 / Accepted: 13 January 2016 / Published: 26 January 2016

Abstract

:
Numerous outbreaks of Escherichia coli O157:H7 have been linked to the consumption of leafy vegetables. However, up to the present, little has been known about E. coli O157:H7’s adaptive responses to survival on actively growing (and thus responsive) plants. In this study, whole genome transcriptional profiles were generated from E. coli O157:H7 cells (isolate Sakai, stx-) one hour and two days after inoculation on the leaves of growing butterhead lettuce, and compared with an inoculum control. A total of 273 genes of E. coli O157:H7 Sakai (5.04% of the whole genome) were significantly induced or repressed by at least two-fold (p < 0.01) in at least one of the analyzed time points in comparison with the control. Several E. coli O157:H7 genes associated with oxidative stress and antimicrobial resistance were upregulated, including the iron-sulfur cluster and the multiple antibiotic resistance (mar) operon, whereas the Shiga toxin virulence genes were downregulated. Nearly 40% of the genes with significantly different expression were poorly characterized genes or genes with unknown functions. These genes are of special interest for future research as they may play an important role in the pathogens’ adaptation to a lifestyle on plants. In conclusion, these findings suggest that the pathogen actively interacts with the plant environment by adapting its metabolism and responding to oxidative stress.

1. Introduction

Leafy vegetables, such as lettuce, are considered a high-risk food since numerous outbreaks with enteric pathogens have been linked to the consumption of these products [1]. Escherichia coli O157:H7 (E. coli O157:H7) is one of the pathogens that is frequently involved and is of special interest due to the severe consequences of the illness it may cause. Infection may lead to bloody diarrhea, and, on rare occasions, kidney failure with damage to the central nervous system in severe cases. Young children, the elderly and immunocompromised persons are at higher risk of severe illness. The bacterium can enter the agricultural environment via animal feces and is able to enter our food chain from this point by, e.g., contaminating the irrigation water used for growing crops, or the use of untreated or non-sufficiently treated manure. As governments promote the consumption of a wide variety of fresh fruit and vegetables, it is important that there is no increased risk for foodborne infections. Therefore, the understanding of plant-pathogen interactions such as initial adherence, invasion and establishment is essential for the development of effective control measures.
Numerous studies have investigated the factors which may influence the preharvest survival, growth and attachment of E. coli O157:H7 on growing plants. The majority of investigations focused on the influence of temperature, relative humidity, irrigation treatment, UV radiation, leaf age, crop stage, crop variety, etc. However, less is known about the underlying genetic mechanisms that E. coli O157:H7 uses to survive and proliferate on plants. On the plant surface, the pathogen may encounter various stresses. For example, nutrient scarcity is likely to occur, especially within the phyllosphere compared to a mammalian intestinal environment. This may enhance resistance of the pathogen to subsequent physical or chemical challenges and is thus highly relevant to the pathogen’s behavior during processing and storage of the produce, but has yet to be intensively investigated [2].
Gene expression profiling such as microarray technology is one of the techniques used to determine which adaptive and regulatory processes are involved in the pathogen response to specific environmental variables. Only a few microarray studies have been performed on the interaction between E. coli O157:H7 and fresh produce. Two studies mainly focused on post-harvest contamination. Kyle et al. (2010) [3] have investigated the short-term effects of the influence of leaf injuries and damaged leaf tissue on the gene expression of E. coli O157:H7 EDL933 on romaine lettuce leaf lysate. Fink et al. (2012) [4] have performed a study on the gene expression of pathogenic and a laboratory reference strain of E. coli (serotype K-12) on harvested, intact lettuce leaves. They have studied the mid-term effect (one to three days) on surface sterilized leaves. Preharvest contamination conditions were also investigated for E. coli K12 and O157:H7 interacting with the lettuce rhizosphere [5,6] but not with the phyllosphere, and this is important as this is the part of the crop that is consumed. Only recently was a report on the gene expression of E. coli O157:H7 on radish sprouts published [7].
The aim of the present study was to characterize the transcriptional response of E. coli O157:H7 Sakai during interaction with the phyllosphere of growing butterhead lettuce plants, which has relevance to previous food-borne outbreaks and horticultural production. Gene expression changes were assessed at two time points to represent the very initial interactions (at one hour post-inoculation) and after sufficient time to allow establishment and colony development (two days post-inoculation).

2. Experimental Section

2.1. Bacterial Strains and Culture Conditions

E. coli O157:H7 Sakai strain RIMD 0509952 (Sakai; Stx- Kanamycin-resistant) was used and was previously described by Dahan et al. (2004) [8]. The Sakai strain was isolated from the Sakai city outbreak in Japan in 1996 [9,10] and possesses a double Shiga toxin knockout (stx knockout). A kanamycin cassette was inserted into the SmaI site in the stx2A gene, and a 0.6 kb BsiWI fragment, which contained the stx1A gene and the upstream region, was deleted [8]. Cells were pre-cultured in 5 mL LB and grown overnight at 37 °C, 200 rpm. This culture was diluted 1:100 in pre-tempered MOPS medium [11] enriched with essential and non-essential tissue culture amino acids (M5550 and M7145, Sigma-Aldrich, S. Louis, MO, USA) and supplemented with 0.2% glycerol, and grown at 18 °C, 200 rpm for 22 h to the early stationary phase of growth. The OD600 was measured (Genesys 10uv, Thermo Fischer Scientific Inc., Waltham, MA, USA). In order to remove nutrients from the culture broth which could bias the survival and establishment of cells once in contact with the phyllosphere, the culture was washed with sterile pretempered 10 mM MgSO4 (230291, Sigma-Aldrich, S. Louis, MO, USA) at 18 °C (10 min, 5000 × g, 4 °C), and re-suspended in sterile pretempered 10 mM MgSO4 at 18 °C to an OD600 of 0.5 which corresponded with 8.7 ± 0.1 log CFU/mL as determined by plate counting on the selective medium sorbitol MacConkey Agar (SMAC, Sigma-Aldrich, Sigma-Aldrich, St. Louis, MO, USA) (24 h, 37 °C). These MgSO4 suspended cells were used as inoculum for the plants.

2.2. Plant Growth Conditions

Pelletized butterhead lettuce seeds (Lactuca sativa L. var. capitata “Alexandria”) were obtained from Rijk Zwaan Distribution B.V., De Lier, the Netherlands. The seeds were sown in a mixture of peat, sand, limestone, perlite, celcote, sincrostart and multicote-4. One week after sowing, the seedlings were placed in square pots of 10 cm and grown in the greenhouse at The James Hutton Institute (Dundee, UK). Four-week-old plants were moved from the greenhouse to the growth chamber (Microclima1000, Snijders, Tilburg, The Netherlands) one day before the start of each experiment. Growth chamber conditions were set at continuously ±18 °C with a relative humidity (RH) of 75% and 16/8 hour light/dark cycle.

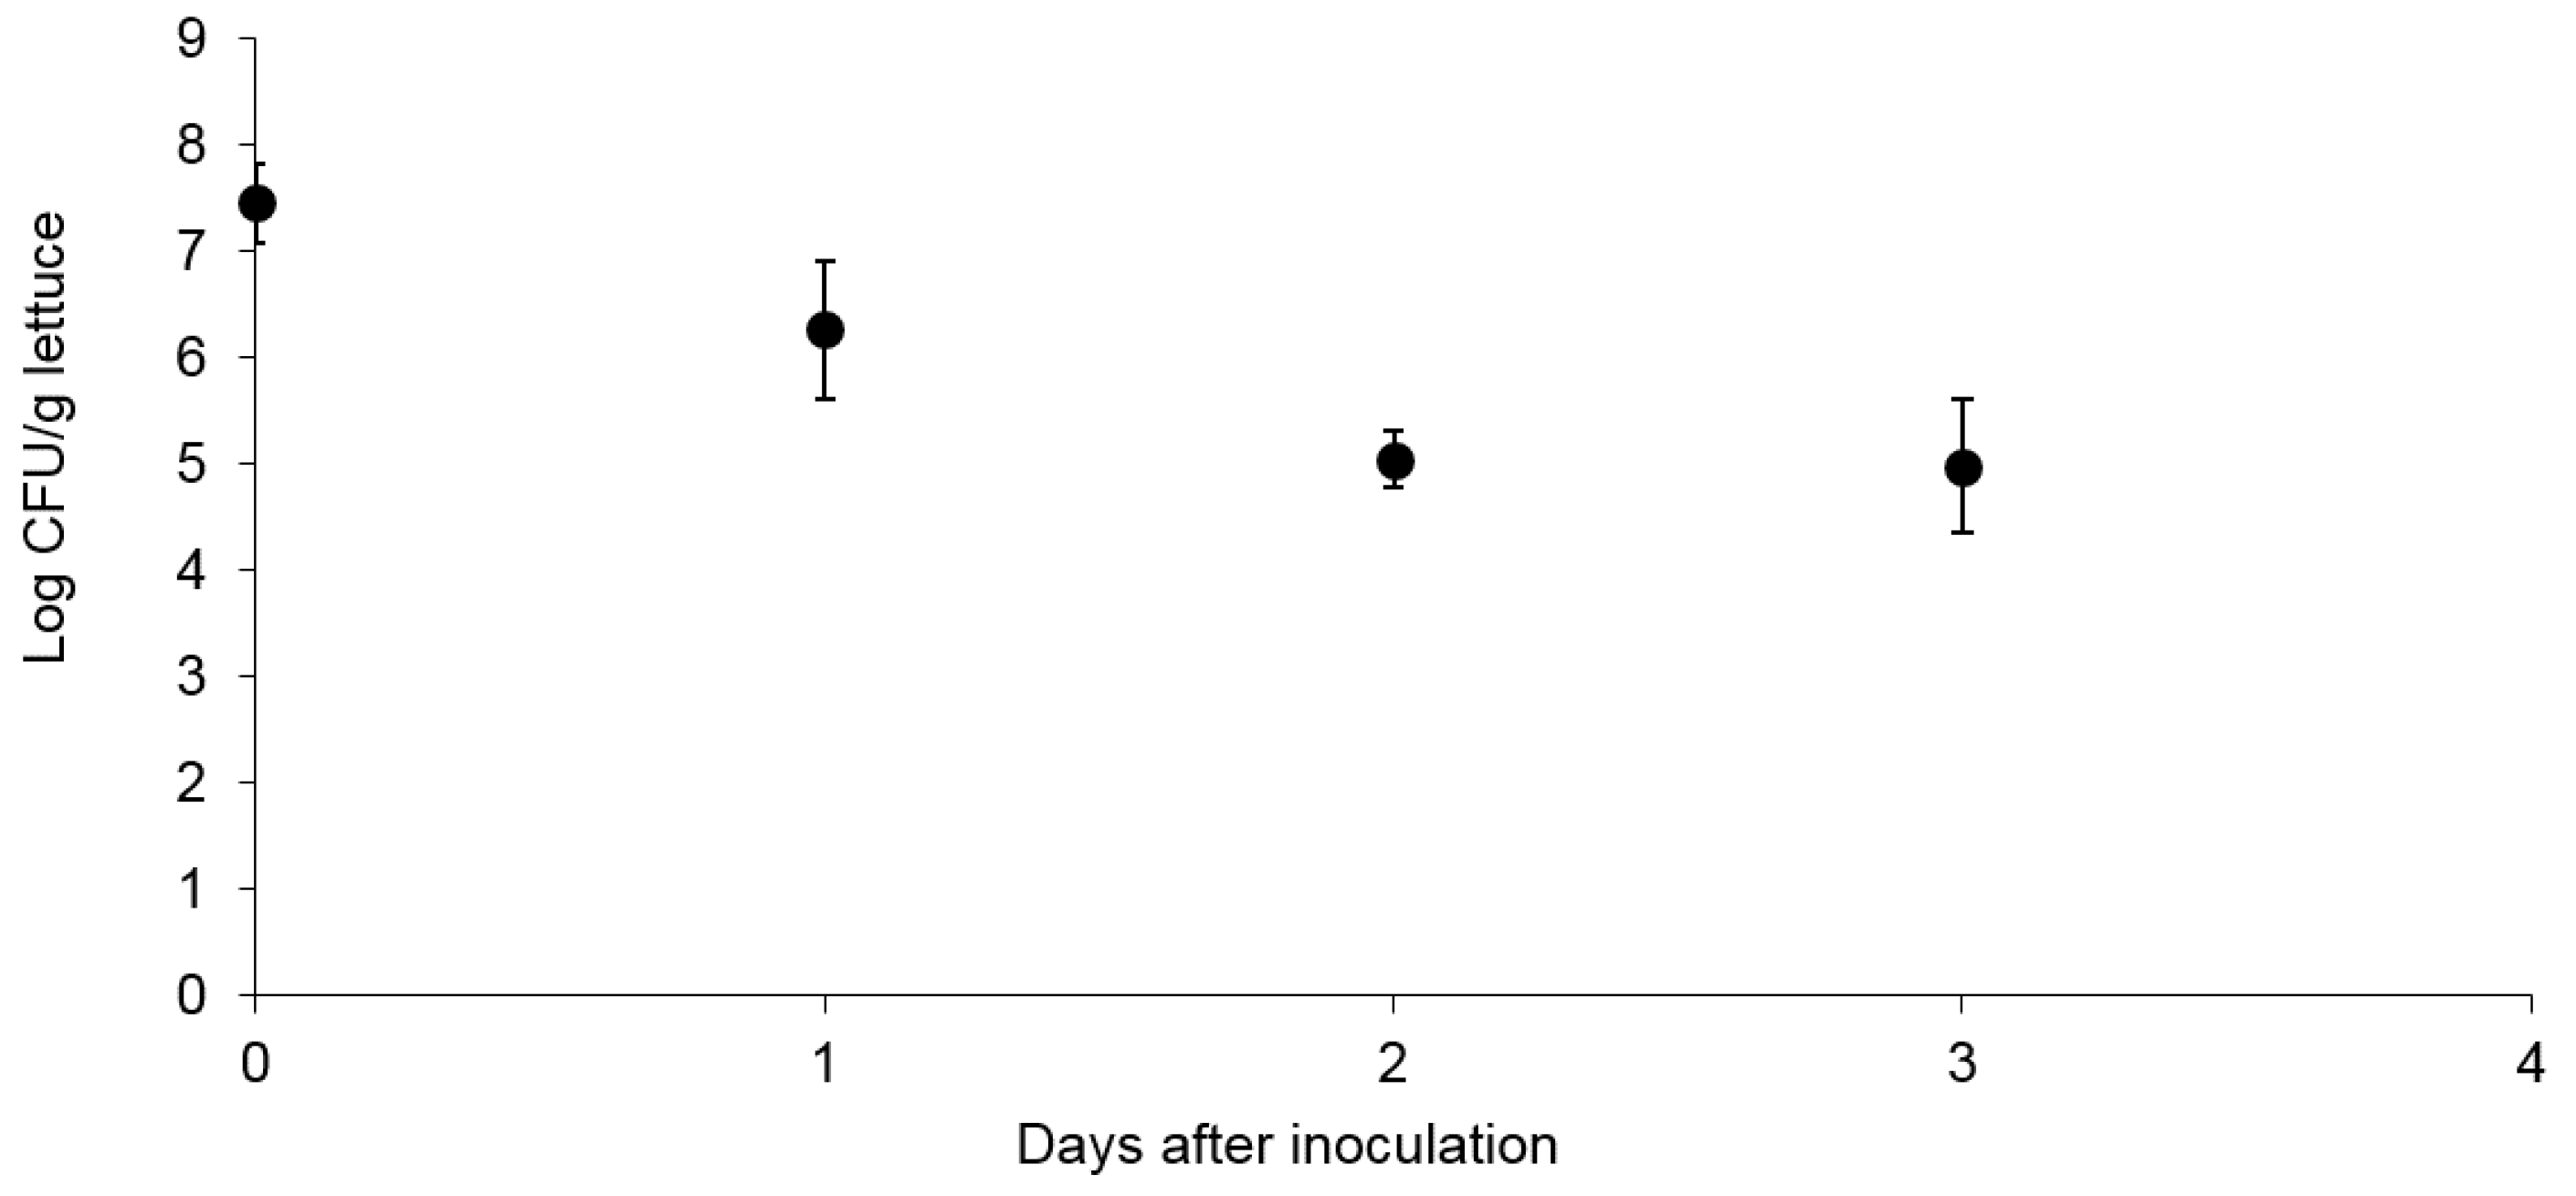
2.3. Inoculation of the Lettuce Plants and Measurement of Total Pathogen Populations on Lettuce Leaves

Four-week-old lettuce plants (±9-leaf stage) were spray-inoculated in a biosafety cabinet. A total of 100 mL inoculum (described in Section 2.1) was used to inoculate 16 plants. The pathogen population on the leaves was determined in duplicate one hour after inoculation (1 hpi) and one, two and three days thereafter. For each sample, 1 g of leaves from three lettuce plants was used. The sample was ground aseptically with sterilized sand and 2 mL phosphate buffered saline (PBS), using a pestle and mortar. Serial dilutions were made in PBS and the appropriate dilutions were plated onto SMAC (24 h, 37 °C). Maceration does not recover all of the interacting bacteria, but it is still one of the best methods for direct plate counts [12]. For each experiment two samples were analyzed (n = 2) and the experiment was performed three times. Non-inoculated plants were analyzed as control.

2.4. RNA Extraction for Microarray Experiment

A total of 10 g lettuce leaves from three lettuce plants were removed with sterile forceps and placed in a sterile beaker with 200 mL ice-cold RNA-stop wash solution (0.5% phenol pH 4.3, 9.5% ethanol absolute and 90% PBS). The lettuce was cut into pieces of ±2 cm2 with sterile scissors and stirred on a magnetic stirrer for 5 min at level 3 (Stuart stir UC151, Bibby Scientific Limited, Staffordshire, UK). The RNA extraction was performed on the wash water. Therefore, the 200 mL RNA-wash solution was pipetted into four 50 mL RNAse free polypropylene tubes and centrifuged for 10 min, 4 °C, 5000 rpm. The supernatant was removed and the pellets were dissolved in 1 mL ice-cold RNA-stop (5% phenol pH 4.3, 95% ethanol absolute). These solutions from the four tubes were collected in a 50 mL tube. Subsequently, the emptied tubes were rinsed with another 1 mL of ice-cold RNA-stop and this was added to the 50 mL tube as well and centrifuged as described above (5 mL in total). The supernatants were removed and the pellet was once more washed with 1 mL ice-cold RNA-stop solution. The pellet was immediately stored at −80 °C. The bacterial pellets were treated with 50 mg/mL of lysozyme (5 min) (L3790, Sigma Aldrich, St. Louis, MO, USA). Subsequently, RNA was extracted with the Qiagen RNeasy kit with an additional on-column DNase digestion performed following the instructions of the manufacturer (Qiagen, Hilden, Germany). As a reference control, a cell pellet of 1 mL of the inoculum was made one hour after resuspending the cells in the MgSO4-buffer, treated with the Qiagen RNeasy protocol as described above and immediately stored at −80 °C. Total RNA was quantified spectrophotometrically (NanoDrop ND 1000, Thermo Scientific, Wilmington, DE, USA) and the quality examined with a Bioanalyzer 2100 (Agilent technologies, Palo Alto, CA, USA).

2.5. Microarray Labeling Procedure

A volume of 17.7 µL of total RNA was combined with Enterobacteriaceae specific 10 × 11-mer oligos, 100 ng/μL as described by [13], on ice, incubated 10 min at 70 °C and cooled on ice again. A volume of 17.3 μL of a master mix (5× first strand buffer, 9.0 µL; 0.1 M DTT, 4.5 µL, 25× aa-dNTP labeling mix 1.8 µL Superscript RT 2.0 µL) was added and the samples were incubated for 2 h at 42 °C. A total of 15 µL of 1 M NaOH and 15 µL 0.5 M EDTA (pH 8.0) was added to hydrolyze the RNA and the samples were incubated for 15 min at 65 °C. Then 15 µL 1 M HCl was added to neutralize the samples. cDNA was purified by adding 450 µL PB buffer (Qiagen) mix and 1applied to a Qiagen MinElute column. The samples were centrifuged. Centrifugation always occurred at 10,000 × g for 1 min unless stated otherwise. The supernatant was removed and 750 µL filter sterilized phosphate wash buffer (0.25 mL 1 M phosphate buffer, 7.7 mL sterile distilled water (SDW), 42.2 mL absolute ethanol) was added and centrifuged. The supernatant was removed and the nucleic acid trapped in the column centrifuged for another 2 min. The column was transferred to a new amber 1.5 mL tube and 10 µL filter sterilized phosphate elution buffer (0.2 mL 1 M phosphate buffer, 49.8 mL SDW) was added to the center of the membrane, left for one minute at room temperature and subsequently centrifuged. This step was repeated with another 10 µL filter sterilized phosphate elution buffer. The subsequent reactions were performed in low light and the incubations were performed in the dark. Sodium carbonate buffer (2.0 µL, 1 M) was added to the purified cDNA and mixed. Subsequently, 1.0 µL of the appropriate Cy-dye (GE Healthcare #PA23001, PA25001) (in DMSO) was added and incubated for 1 h at room temperature in the dark. The labeled cDNA was purified by adding 3.0 µL 4.0 M hydroxylamine hydrochloride, mixed and incubated in the dark for 30 min. The volume of each reaction was made up to 100 µL with SDW. Five hundred µL of PB buffer were added, mixed and applied to a Qiagen MinElute (Qiagen,Valencia, CA, USA) column and centrifuged. The supernatant was removed and 750 µL PE buffer was added and then centrifuged. The supernatant was removed and the tube was once more centrifuged. The column was transferred to a new 1.5 mL tube and 10 µL elution buffer was added to the center of the membrane and left for 1 min at room temperature and then centrifuged. The sample was re-eluted with an additional 10 μL elution buffer into the same tube. The Cy3/Cy5 incorporation was estimated by NanoDrop ND 1000.

2.6. Preparation of Prokaryotic Hybridization Samples for Agilent 8 × 15K Arrays

The volume of each labeled cDNA was calculated to give 600 ng and pipetted into a fresh 1.5 mL amber tube. Nuclease-free water (Sigma-Aldrich, St. Louis, MO, USA) was added up to 20 μL. A volume of 5 μL of Agilent 10 × Blocking Agent was added to each tube and the samples were denatured at 98 °C for 3 min and cooled to room temperature. Twenty-five μL of 2 × GEx Hybridization Buffer HI-RPM was added to each tube, mixed well by careful pipetting. The tubes were spun for 1 min at room temperature and immediately placed on ice and loaded onto the Agilent 8 × 15K Arrays (Agilent, Santa Clara, CA, USA). Forty microliter of each mix was added to the gasket slide and the Agilent array slide was placed on top. The slides were incubated for 17 h at 65 °C with rotation at 10 rpm in a hybridization oven. A selection of four samples with the highest quality RNA from three independent experiments were prepared for each time point (1 h and two days after inoculation) and are subsequently called four biological replicates.

2.7. Uninoculated Lettuce Control

To check whether the microbial background microbiota on the lettuce may interfere with the micro-array spots, uninoculated samples were checked for the presence of the gadA gene, a housekeeping gene of E. coli. The presence of gadA was checked by conventional PCR. The forward primer was 5′-ACCTGCGTTGCGTAAATA and the reverse 5′-GGGCGGGAGAAGTTGATG and were described in Kim et al. (2006) [14]. Each PCR reaction consisted of 5 µL GoTaq Buffer Green, 3 µL dNTPs (2.5 mM), 0.2 µL 50 µM forward primer, 0.2 µL 50 µM reverse primer, 0.5 µL cDNA, 0.2 µL polymerase and 15.9 µL SDW. The reaction mixture was processed in a thermocycler (TProfessional basic Thermocycler gradient, Biometra GmbH, Göttingen, Germany) with the following settings: 2 min at 94 °C, 30 cycles: 30 s at 95 °C, 30 s at 56.7 °C, and 1 min at 72 °C, followed by a final extension time at 72 °C for 7 min. Five µL of PCR-product was loaded on a 1% agarose gel and imaged under UV illumination.

2.8. Data Analysis

The data were analyzed using the software Genespring version 7.0 (Agilent/Stratagene, Palo Alto, CA, USA). The data from all four biological replicates were further tested by a Principal Component Analysis (PCA) on the different conditions (mean centering and scaling). The outliers were removed by filtering on flags (present or marginal). The data were normalized to the control samples (inoculum) and the replicates combined.
Genes showing a greater than two-fold upregulation or downregulation following Volcano Plot analysis (0.01 ≤ p < 0.05 or p < 0.01) and a raw expression value >50 were considered to be differentially regulated. Comparison of the expression levels was done for the expression after 1 h (day 0) with the inoculum, day 2 with the inoculum and day 2 in comparison with 1 h after inoculation (day 0). A False Discovery Rate (FDR) was not conducted at these significance levels.
Subsequently, a single gene list was made as the Agilent array slide contained the genes of four different E. coli strains: the core genome derived from E. coli K-12 strain MG1655, and strain-specific genes of E. coli O157:H7 strains EDL933 and Sakai, and uropathogenic E. coli strain CFT073. Genes of uropathogenic E. coli CFT073 were not taken into consideration. For the single gene list, gene sequences of all significantly differentially regulated E. coli K-12, E. coli O157:H7 EDL933 and E. coli O157:H7 Sakai assigned with a gene name were taken into consideration. Furthermore, all significantly differentially regulated E. coli K-12, O157:H7 EDL933 and O157:H7 Sakai genes with only a “b”, “Z” or “ECs” accession pre-fix, resp. were looked up on XBase [15]. Where duplicates were present in the database, the E. coli Sakai gene was kept if possible, if duplicates were present between E. coli K12 and E. coli O157:H7 EDL933, the E. coli K12 gene was kept. Unknown E. coli O157:H7 EDL933 genes were discarded from the list as well. This single gene list, therefore, includes all genes spotted on the microarray relevant to E. coli Sakai, and was used to link the genes with a COG-annotation [16]. Furthermore, gene lists were made based on the GenProtEC Multifun classes. Since E. coli K-12 is often the only E. coli reference, all E. coli K-12 and Sakai genes with a gene name similar to K-12 were linked to the following classes: class 5 cell processes, class 6.3 pilus, 6.4 flagella and 6.6 ribosomes [17]. For the virulence gene list, E. coli O157:H7 Sakai virulence genes as described in Hayashi et al. were taken into account and a keyword search was performed on the GIRC-site [18,19]. The keywords that were used were: invasion, adhesion, fimbria, effacement, toxin and type III secretion.
As an internal validation, a gene list with housekeeping genes was composed based on genes that have been suggested by Rocha et al. (2015) and Zhou et al. (2011) to be used for these purposes [20,21].
For each gene list, the relative expression levels on day 0 and day 2 were plotted against the inoculum and significantly differentially regulated genes were highlighted using Matlab. The nucleotide sequence of the significantly differentially regulated unknown genes with Sakai-specific ECs number was obtained by XBase search. This nucleotide sequence was blasted in the Basic Local Alignment Search Tool (BLAST) in order to find out if the gene was already known or described in related strains.

3. Results and Discussion

In this study, the response of E. coli O157:H7 with intact growing young lettuce plants was investigated by the microarray technique to explore the transcriptional changes in E. coli O157:H7. In parallel, the fate of the bacteria was determined with the conventional plate-counting technique. The results will be discussed and compared with the existing literature, in particular with two gene expression studies on lettuce and E. coli [3,4]. Since there are apparent similarities, a comparative overview between these and the current study has been compiled (Table 1).
Table 1. Overview of the main differences between the different gene expression studies with E. coli O157:H7 and fresh produce.
Kyle et al., 2010 [3]Fink et al., 2012 [4]This Study
StrainE. coli O157:H7 EDL933E. coli K12 MG1655 E. coli O157:H7 EDL933E. coli O157:H7 Sakai
Growth mediumM9-glucose aLB bMOPS-enriched c
Growth temperature of E. coli28 °C37 °C18 °C
Time points15 min; 30 minOne and three days1 h, 2 days
Lettuce typeromaine lettucegreen leaf lettucebutterhead lettuce
Type of interactionleaf lysate supernatantsurface sterilized leaves sodium hypochloritegrowing non-sterilized plants
Inoculum level108 CFU/mL107 CFU/cm2 lettuce108 CFU/g lettuce
Plant growth conditionsNot applicable100% RH, 25 °C photoperiod 16 h for three days.Growth chamber, 18 °C, 75% RH, photoperiod 16 h for two days
Reference control for expression analysisCells grown in M9-glucose at 28 °CCells grown in LB at 37 °CCells were re-suspended and kept for 1 h in MgSO4 buffer after initial growth in MOPS-enriched medium, both at 18 °C
a M9= Minimal 9; b LB = Luria Bertani; c MOPS = potassium morpholinopropane sulfonate.

3.1. Survival and Association of E. coli Sakai on/with Growing Butterhead Lettuce

The survival of E. coli O157:H7 Sakai on 4-week old butterhead lettuce during 3 days is shown in Figure 1. E. coli Sakai was inoculated at a level of 7.45 ± 0.37 log CFU/g lettuce. A high inoculum level was used to ensure sufficient bacteria were recovered for subsequent whole transcriptome analysis, not to mimic ecologically relevant levels. The number of bacteria recovered after 2 days was 5.02 ± 0.27 log CFU/g, and did not significantly change at day 3, suggesting stabilization at this level.
Figure 1. Survival of E. coli O157:H7 Sakai on butterhead lettuce. For each experiment 2 samples were analyzed (n = 2) and the experiment was performed three times.
Agriculture 06 00006 g001

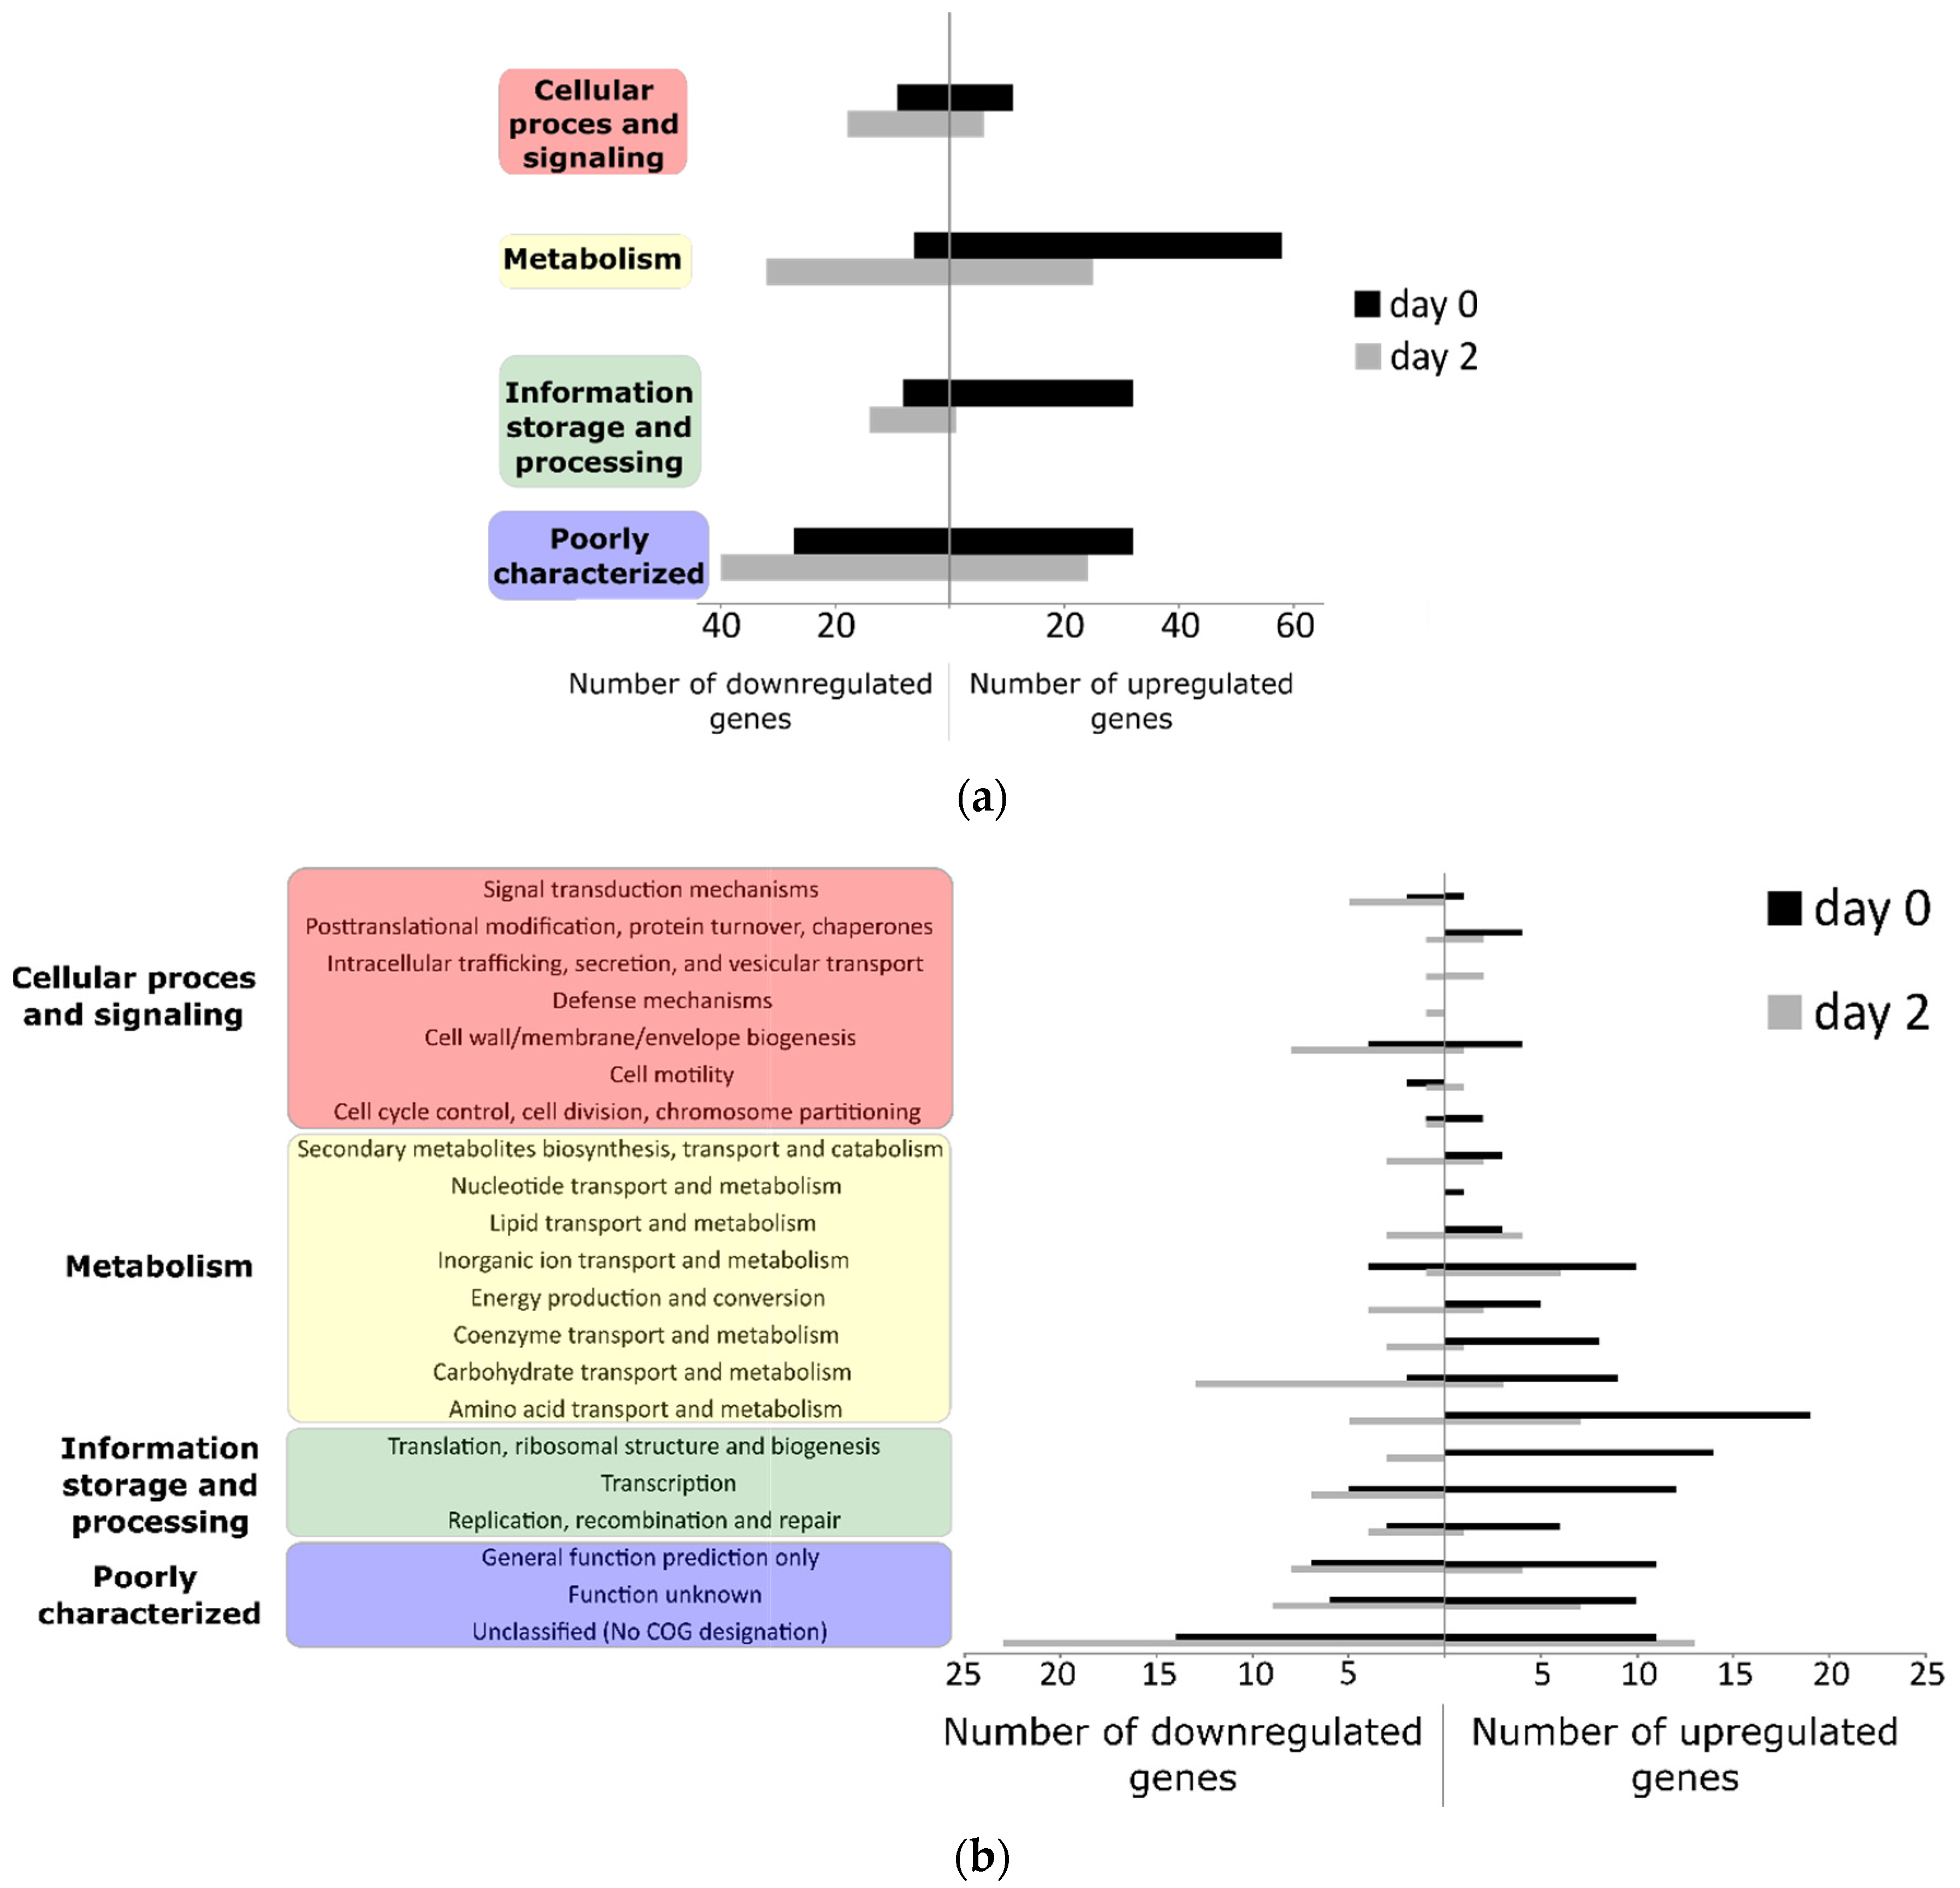
3.2. Differentially Regulated Transcriptome of E. coli O157:H7 Sakai on Growing Butterhead Lettuce

A total of 273 genes (5.04%) of the Sakai genome were induced or repressed by at least two-fold (p < 0.01, raw value >50 for all treatments) at either 1 hpi or 2 dpi in comparison with the inoculum (cells suspended in MgSO4 buffer). There was a difference between the functions of the genes that were differently regulated after being on the lettuce for one hour and after two days (Figure 2). One hour after inoculation, 164 of the selected genes were significantly differentially regulated, with the majority of the genes induced (71%). The induced genes that could be assigned to a category of orthologous genes (COG), belonging mainly to the transport and metabolism of amino acids and inorganic ions on the one hand, and to transcription, translation, ribosomal structure and biogenesis on the other hand. At day 2, 147 genes were significantly differentially regulated with the majority of the selected genes (65%) repressed. E. coli O157:H7 genes that were downregulated included those involved in carbohydrate transport and metabolism, cell wall/membrane, envelope biogenesis, and transcription. Only 37 of the 273 genes of the selected genes were significantly upregulated or downregulated at both time points and for only 23 genes was the expression significantly different between 1 hpi and 2 dpi. For almost 40% (39.9%) of the selected genes, a COG class could not be assigned or the genes were assigned as poorly characterized or function unknown. Furthermore, 23.8% of the selected genes were E. coli O157:H7 Sakai-specific genes (ECs) for which only the ECs number referred to a hypothetical or uncharacterized open reading frame.
As an internal control, the expression of 31 housekeeping genes, whose expression is expected to be consistent under a wide variety of conditions, was assessed. Only three of 35 were significantly affected in expression (rho, cca and ftsZ), and the majority were unchanged (see supplemental information). Furthermore, the gadA gene was not detected on uninoculated lettuce and generic E. coli was not detected on the SMAC-plates.
Figure 2. Overview of the significantly differentially regulated genes (p < 0.01, at least two-fold, raw value > 50) at 1 hpi (day 0) or 2 dpi (day 2), (a) classified by COG group and (b) COG functional category.
Agriculture 06 00006 g002

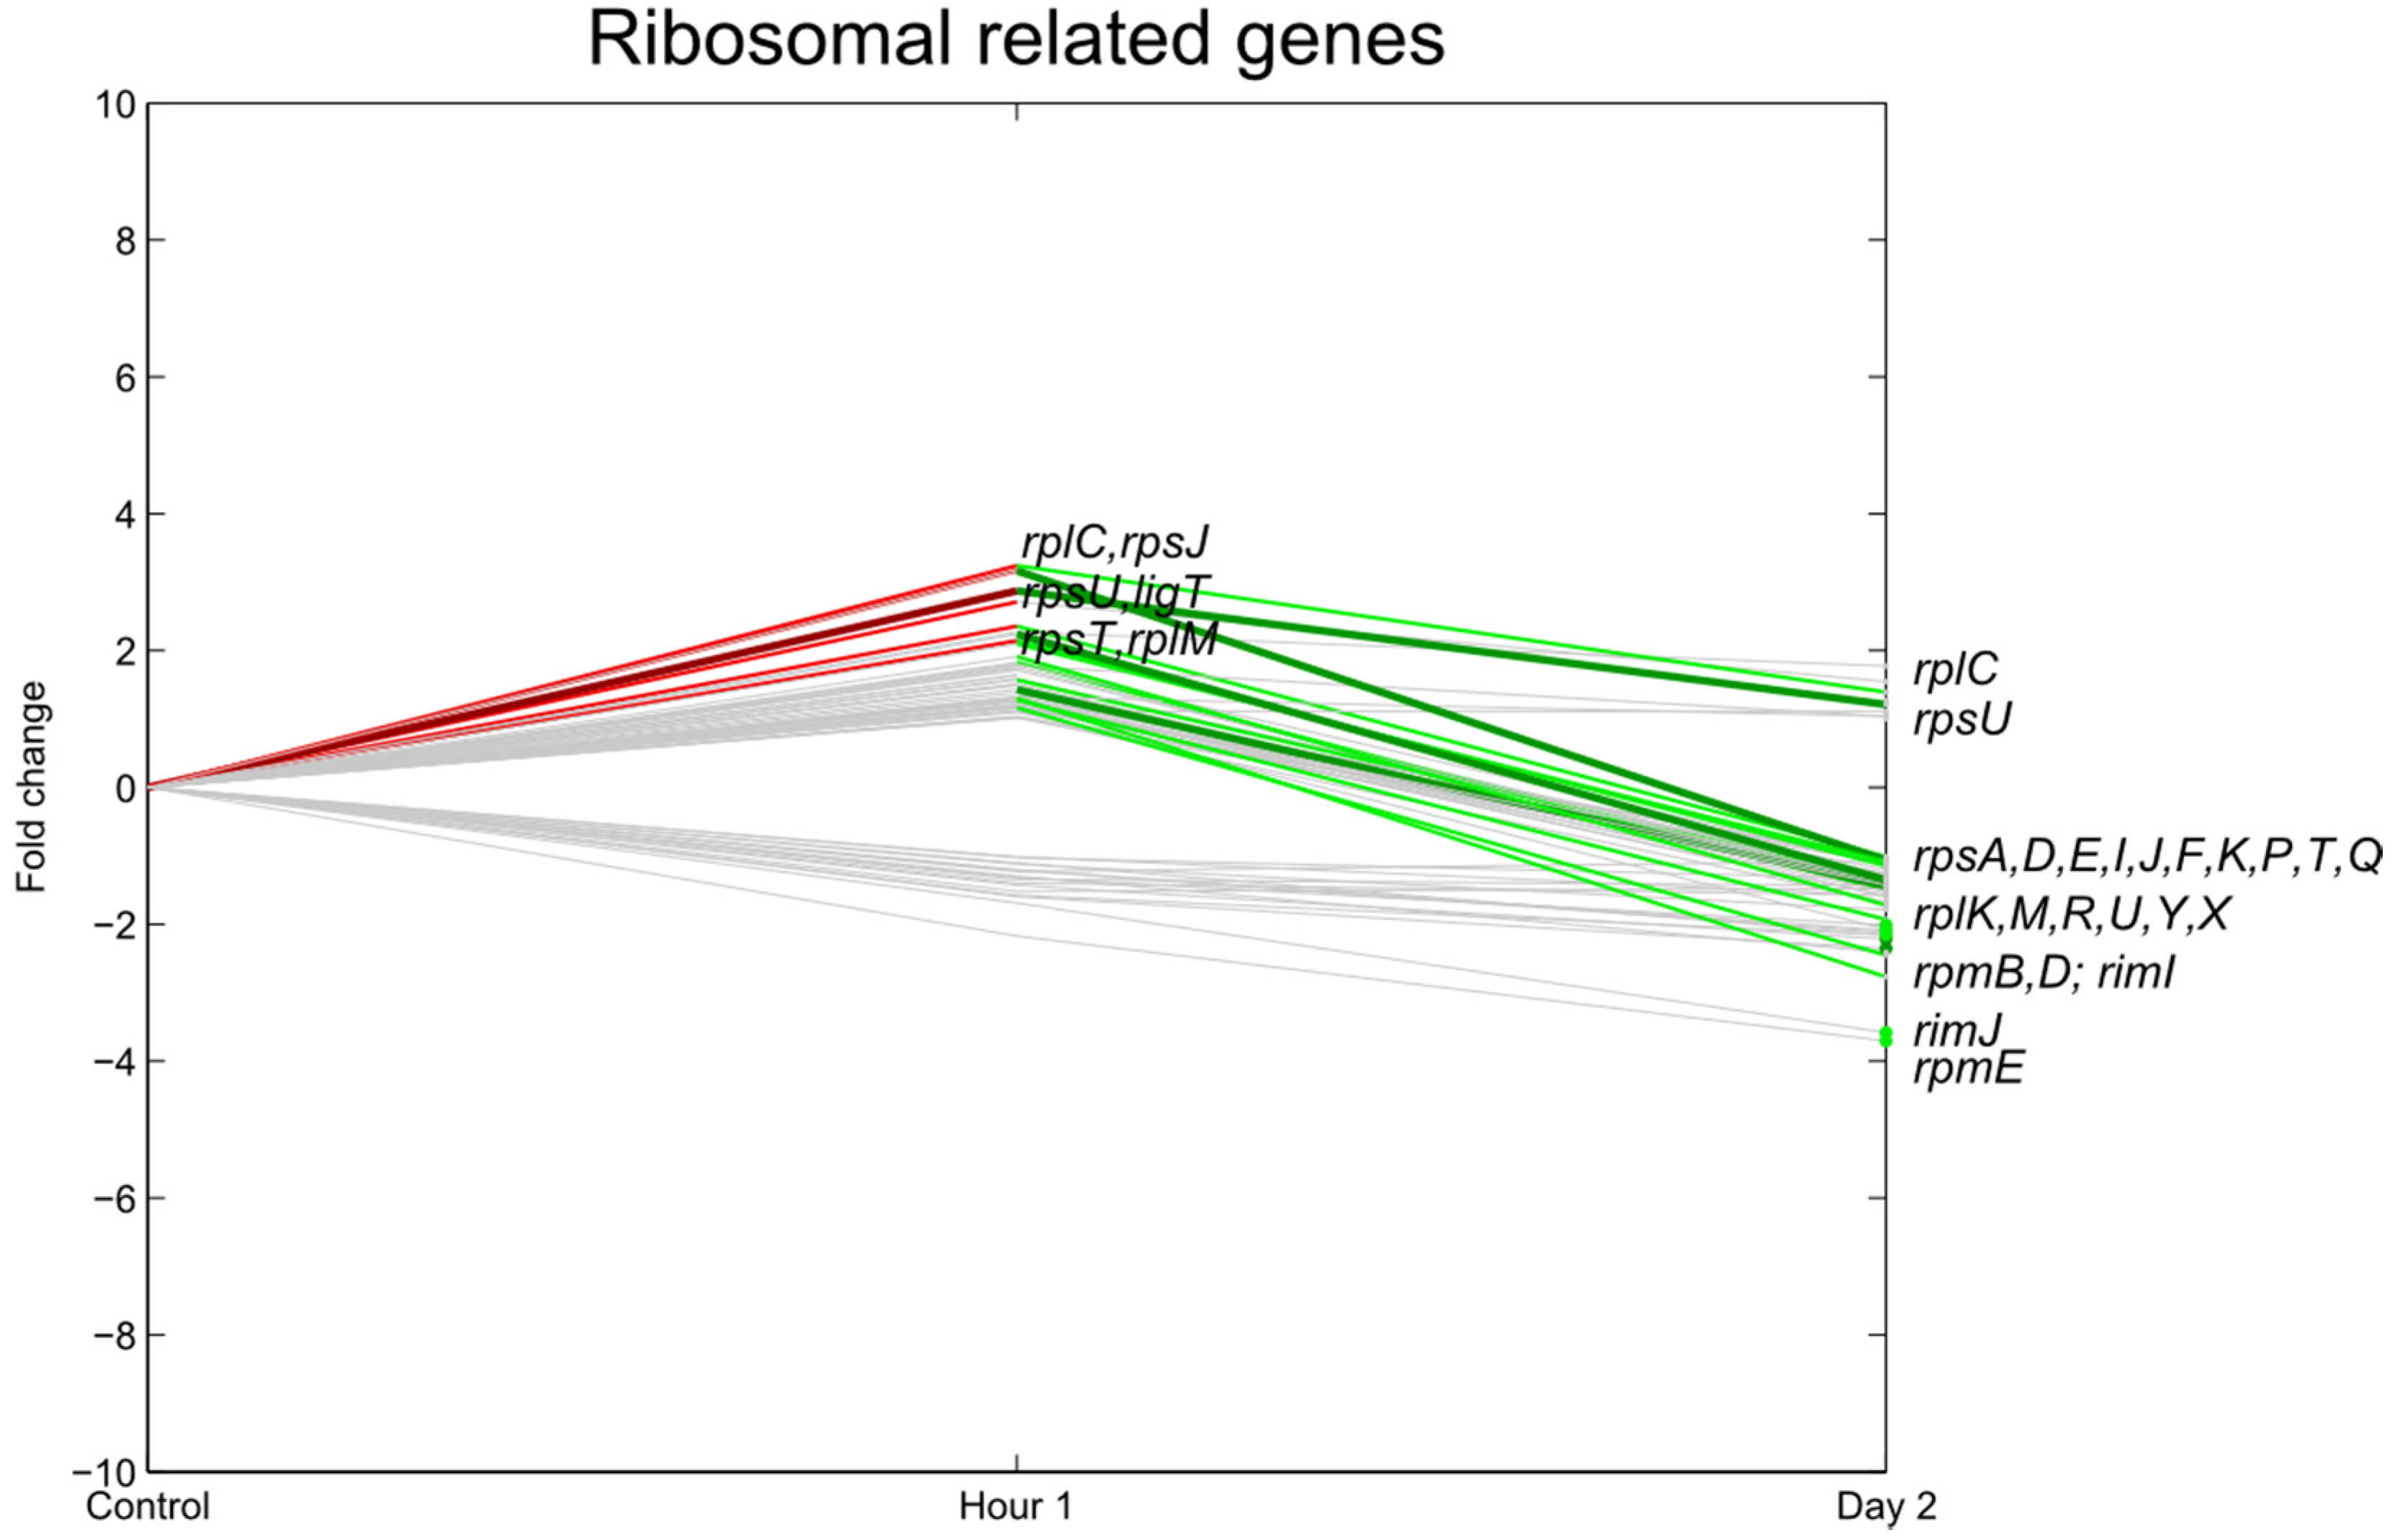
3.3. Transcription, Translation

One hour after inoculation, genes associated with transcription and translational processes were induced (Figure 3 and Figure 4), for example the 30S (e.g., rpsU at p < 0.01 and rpsJT at p < 0.05), 50S ribosomal subunit proteins (rplCM at p < 0.05), and cell division-related genes such as dacA, groS (p < 0.01) and mnmG (p < 0.05). Furthermore, genes related to transcription and translation such as fis, transcripts coding for, among others, RNA-helicases (rhlE), translation initiation factor IF-1 (infA), transcription termination (rho), and genes responsible for rRNA modification such as methylation of nucleotides (mnmA, rumB, ECs4154) were significantly upregulated. In contrast, ftsN, an essential cell division protein, was significantly downregulated.
The transcriptional profiles at 2 dpi were quite different. All the ribosomal subunit proteins were significantly repressed compared to their expression level 1 hpi (rpsUJT, rplCM at p < 0.05), as were other ribosomal subunit proteins (rpsFP at p < 0.01, rpsDIKT, rplKUXY at p < 0.05), and ftsN. This 2 dpi data agrees with the cell die-off after one day (see Figure 1) and with the data of Fink et al. (2012) [4], who observed a decrease in the expression of the E. coli O157:H7 ribosomal-related genes 1 and 3 dpi onto detached lettuce leaves.
Figure 3. Relative expression of E. coli O157:H7 Sakai ribosomal-related genes one hour and two days after inoculation on lettuce plants. A colored line between the control and hour 1 shows that a particular gene was significantly differently expressed one hour after inoculation on the lettuce in comparison with the inoculum. A colored line between hour 1 and day 2 shows that the gene expression of a particular gene was significantly different between these two time points. Colored dots at day 2 show the genes which were significantly differently expressed on day 2 in comparison with the control. Light green: downregulation at 0.01 ≤ p < 0.05, dark green: downregulation at p < 0.01, light red: upregulation at 0.01 ≤ p < 0.05, dark red: upregulation at p < 0.01. Grey: no significant difference in expression. Data represent the mean of four biological replicates.
Agriculture 06 00006 g003
Figure 4. Relative expression of E. coli O157:H7 Sakai genes related with cell division one hour and two days after inoculation on lettuce plants. A colored line between the control and hour 1 shows that a particular gene was significantly differently expressed one hour after inoculation on the lettuce in comparison with the inoculum. A colored line between hour 1 and day 2 shows that the gene expression of a particular gene was significantly different between these two time points. Colored dots at day 2 show the genes which were significantly differently expressed on day 2 in comparison with the control. Light green: downregulation at 0.01 ≤ p < 0.05, dark green: downregulation at p < 0.01, light red: upregulation at 0.01 ≤ p < 0.05, dark red: upregulation at p < 0.01. Grey: no significant difference in expression. Data represent the mean of four biological replicates.
Agriculture 06 00006 g004

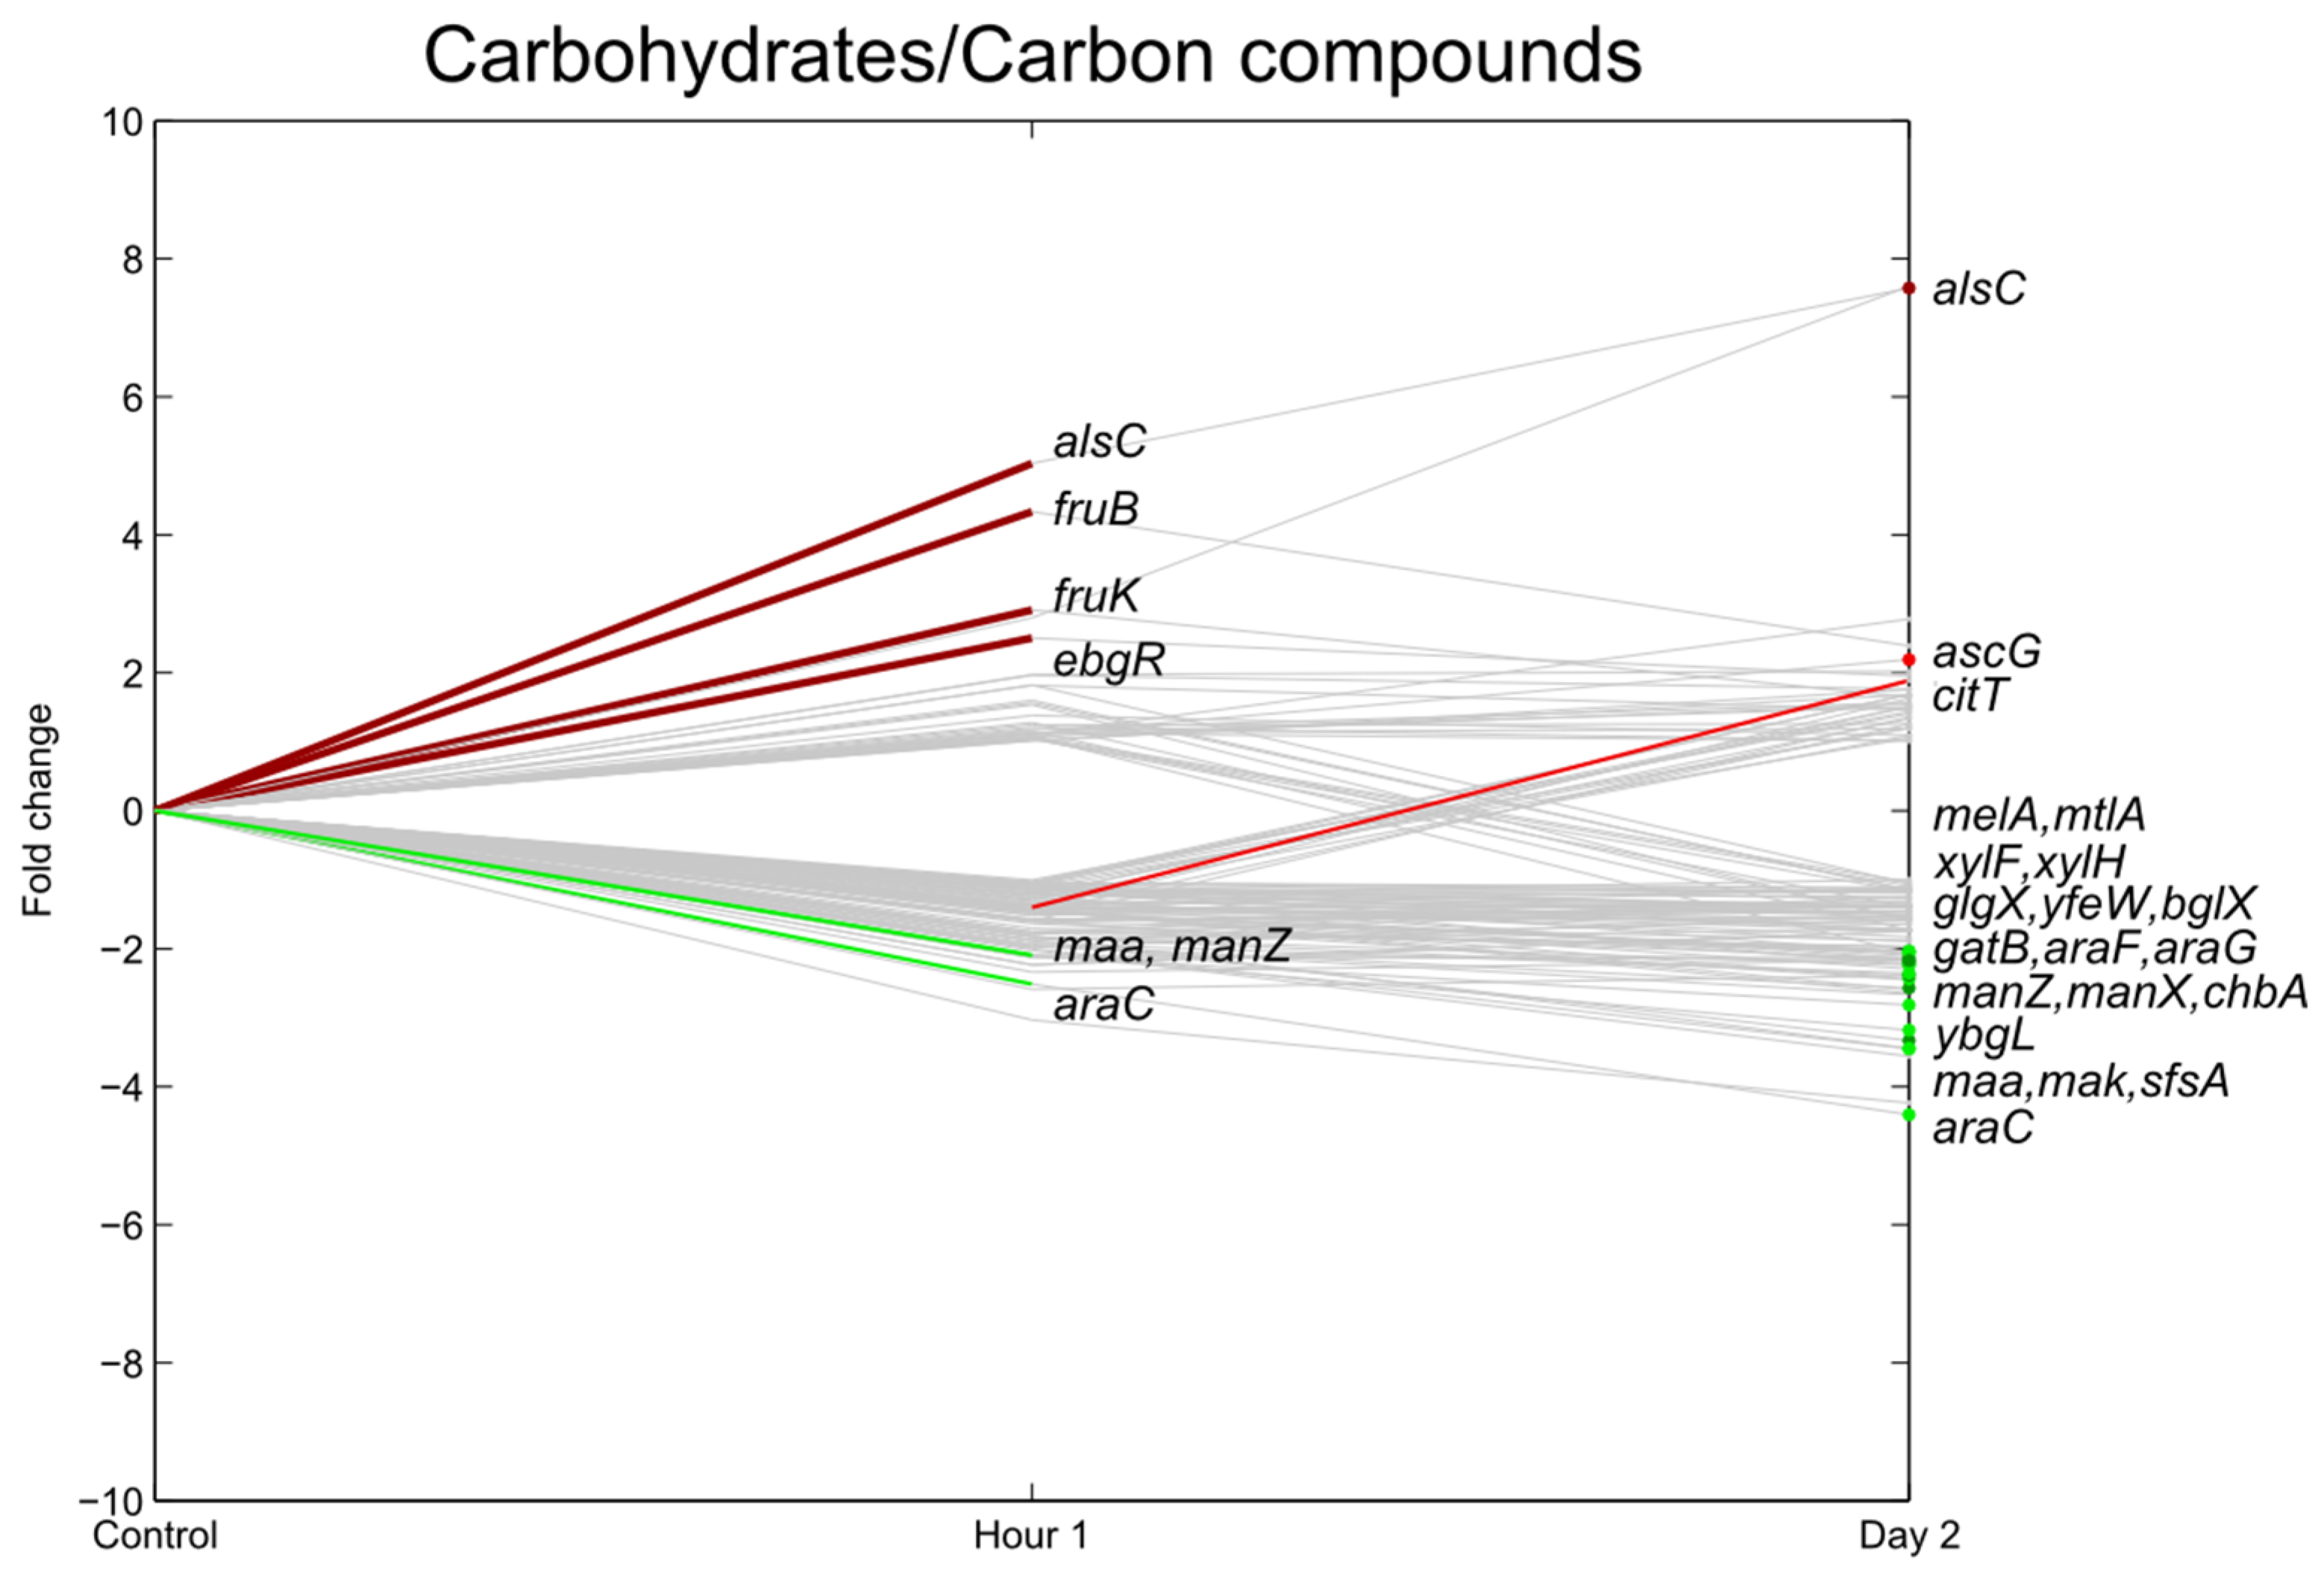
3.4. Carbohydrate Transport

One hour after inoculation, genes essential for the utilization of fructose as a carbon source (fruB and fruK) were significantly upregulated (Figure 5). The carbon starvation protein (cstA), which is induced by carbon starvation, was downregulated 1 hpi and 2 dpi.
The uptake of these sugars was only a short-term effect as, on day two, the expression levels did not change significantly. Further upregulation could only be seen for alsC, responsible for the uptake of D-allose. Several other carbohydrate transport-related genes were downregulated 2 dpi together with other genes involved in (or predicted to be involved in) sugar transport and metabolism (araGF, dhaLM, mak, manX, sfsA, xylH, ytfQ, ytfT, yjfF, ECs5207).
Temporary upregulation of the carbohydrate system may be explained by the fact that more nutrients are available on the lettuce leaves in comparison with the control. Sucrose is a major trans-locatable product of photosynthesis and the main soluble component of the phloem sap; its monosaccharides are glucose and fructose. It was already shown that near the guard cells of leaves, up to 150 mM [22,23,24] sucrose can be present. Moreover, for Salmonella it was shown that the pathogen is attracted to all three sugars and actively moves towards it on lettuce leaves [24]. In addition, Leveau et al. suggested that fructose is highly heterogeneously available in the bean phyllosphere. In their experiments with Erwinia herbicola harboring a fructose bioreporter, nearly all cells appeared to be actively engaged in fructose consumption 1 h after inoculation, whereas this fraction dropped to approximately 11% after 7 h and to <1% one day after inoculation [25].
Figure 5. Relative expression of E. coli O157:H7 Sakai genes related with carbohydrate uptake one hour and two days after inoculation on lettuce plants. A colored line between the control and hour 1 shows that a particular gene was significantly differently expressed one hour after inoculation on the lettuce in comparison with the inoculum. A colored line between hour 1 and day 2 shows that the gene expression of a particular gene was significantly different between these two time points. Colored dots at day 2 show the genes which were significantly differently expressed on day 2 in comparison with the control. Light green: downregulation at 0.01 ≤ p < 0.05, dark green: downregulation at p < 0.01, light red: upregulation at 0.01 ≤ p < 0.05, dark red: upregulation at p < 0.01. Grey: no significant difference in expression. Data represent the mean of four biological replicates.
Agriculture 06 00006 g005

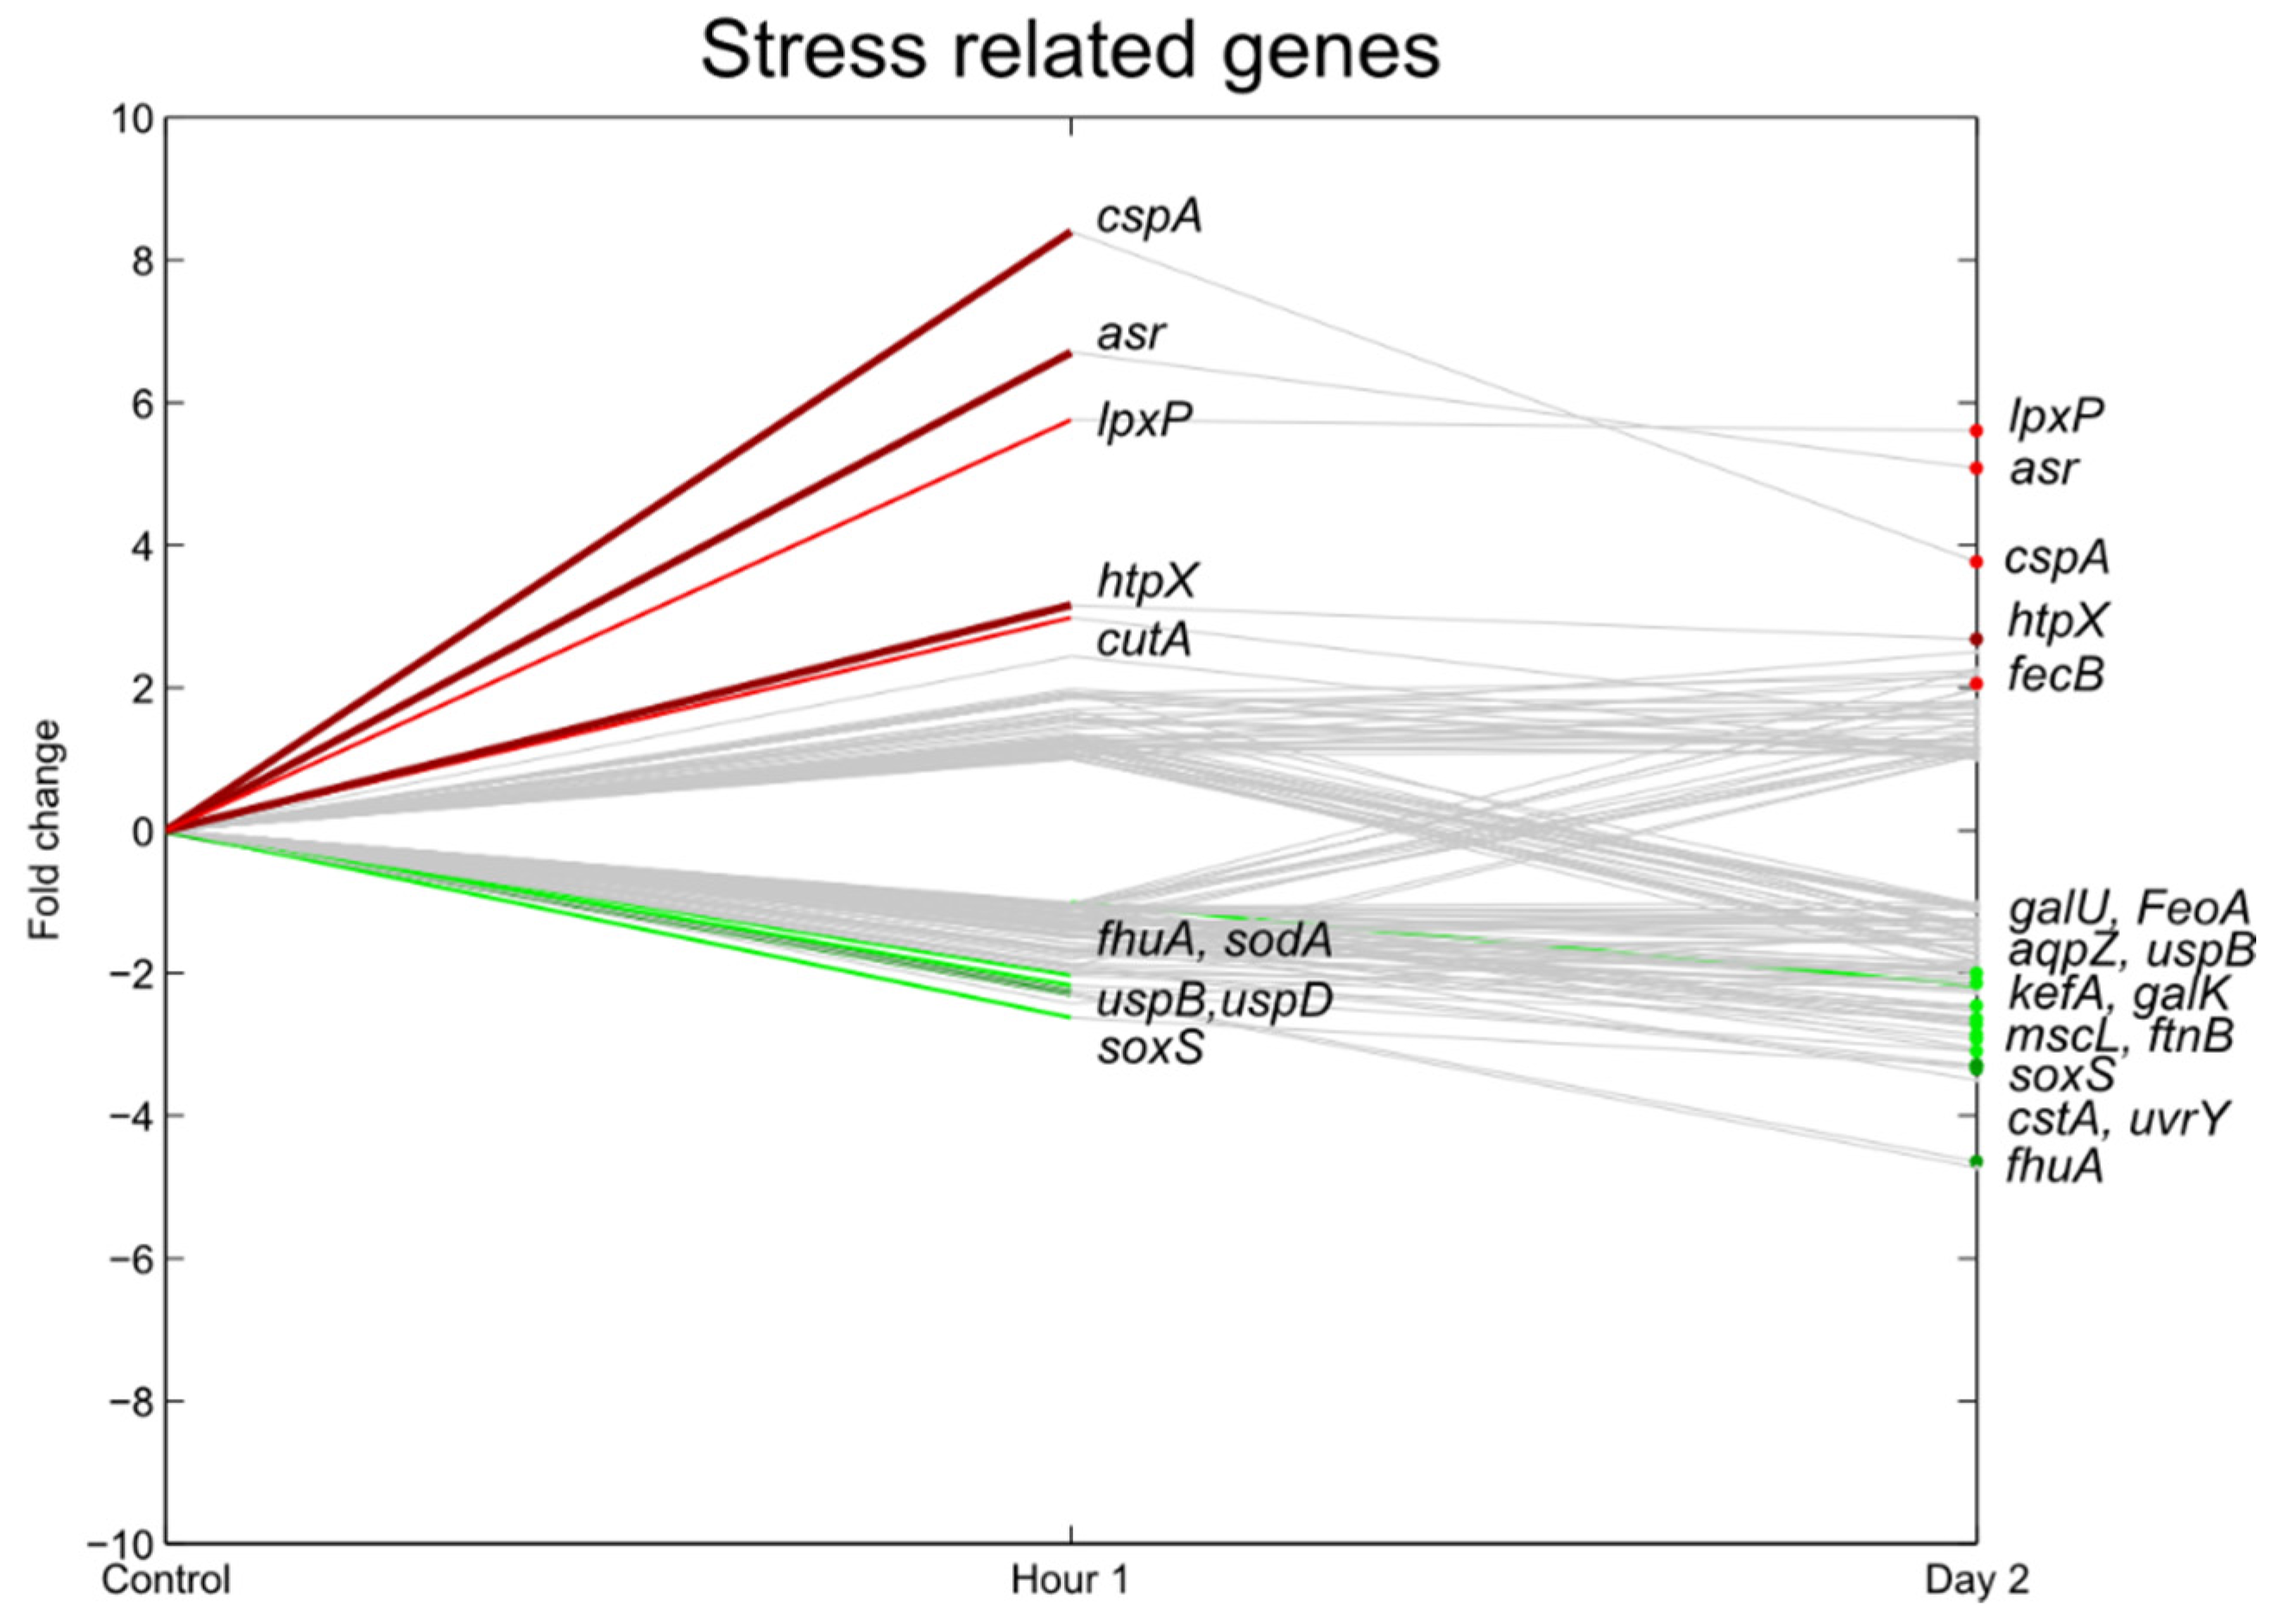
3.5. Stress Responsive Genes

The expression of the stress responsive genes and drug resistance genes is shown in Figure 6 and Figure 7. A stress responsive gene set that was significantly induced at 1 hpi was the iron-sulfur cluster (iscSRUA-hscBA-fdx). These genes are essential for all proteins containing Fe-S clusters which participate in many vital cellular functions such as DNA repair, transcriptional regulation, nucleotide and amine acid biosynthesis and energy metabolism [26]. Two other systems with a similar function, the suf-system (sulfur assimilation) and the csd-system (cysteine sulfinate desulfinase), were not differentially regulated. Expression of the three Fe-S cluster assembly operons is regulated by oxidative stress as Fe-S clusters are very sensitive for active oxygen species and iron limitation [26,27].
Based on the data, there was no indication for iron limitation, as the feb operon (febA) related to iron transport was not differentially upregulated. However, sulfur depletion may have occurred as the cysteine operon (cys) was upregulated at both time points. Cysteine is, together with methionine, the only amino acid containing sulfur; therefore, it serves as a precursor for many forms of reduced organic sulfur which is present in cofactors such as Fe-S clusters [27]. Also, some genes of the tau operon, which are related to sulfur acquisition, were significantly upregulated at either day 0 (tauB at day 0 and day 2, p < 0.05) or day 2 (tauA, p < 0.01). Similar results were observed by Fink et al. (2012) [4] where genes involved in Fe-S cluster assembly and repair (isc) were upregulated. In addition, they also found that the two other Fe-S cluster-related operons were not differentially expressed. Brankatschk et al. (2013) who investigated the transcriptional profile of Salmonella Weltevreden during alfalfa sprout colonization also reported upregulation of the cys operon [28].
Figure 6. Relative expression of E. coli O157:H7 Sakai genes related with drug resistance one hour and two days after inoculation on lettuce plants. A colored line between the control and hour 1 shows that a particular gene was significantly differently expressed one hour after inoculation on the lettuce in comparison with the inoculum. A colored line between hour 1 and day 2 shows that the gene expression of a particular gene was significantly different between these two time points. Colored dots at day 2 show the genes which were significantly differently expressed on day 2 in comparison with the control. Light green: downregulation at 0.01 ≤ p < 0.05, dark green: downregulation at p < 0.01, light red: upregulation at 0.01 ≤ p < 0.05, dark red: upregulation at p < 0.01. Grey: no significant difference in expression. Data represent the mean of four biological replicates.
Agriculture 06 00006 g006
Figure 7. Relative expression of E. coli O157:H7 Sakai genes related with stress one hour and two days after inoculation on lettuce plants. A colored line between the control and hour 1 shows that a particular gene was significantly differently expressed one hour after inoculation on the lettuce in comparison with the inoculum. A colored line between hour 1 and day 2 shows that the gene expression of a particular gene was significantly different between these two time points. Colored dots at day 2 show the genes which were significantly differently expressed on day 2 in comparison with the control. Light green: downregulation at 0.01 ≤ p < 0.05, dark green: downregulation at p < 0.01, light red: upregulation at 0.01 ≤ p < 0.05, dark red: upregulation at p < 0.01. Grey: no significant difference in expression. Data represent the mean of four biological replicates.
Agriculture 06 00006 g007
Several genes involved in multi-drug resistance (MDR) and response to inhibitory compounds were induced in expression. The marRAB operon was consistently upregulated in E. coli Sakai, with a higher and significant upregulation at 1 hpi. marA, multiple antibiotic resistance gene A, is one of the transcription factors which coordinates the multiple mechanisms that bacteria possess to survive exposure to various chemical stresses and antimicrobial compounds. It is an MDR efflux pump but different observations suggest a role of MDR pumps in plant/bacteria interactions as well [29,30].
Also, other genes, involved in the degradation of inhibitory phenolic compounds such as azoreductases azoR and acpD, were highly upregulated at 1 hpi and 2 dpi [31,32]. azoR was also found to be upregulated in Salmonella enterica serovar Typhimurium SL1344 on contact with macerated Dickeya dadantii cilantro leaves compared to healthy tissue [32] and was recently reported to be upregulated on radish sprouts as well [7]. Landstorfer et al. (2015) speculate on a role of this enzyme in detoxification of secondary plant metabolites such as salicylic acid (SA) and jasmonic acid (JA), produced by the plant defense system directed against, or modulating, the bacterial microbiome.
Upregulation of the mar operon was also described by both Fink et al. (2012) [4] when E. coli was inoculated on detached lettuce leaves and by Kyle et al. (2010) [3] when E. coli O157:H7 was inoculated into lettuce lysate. However, Kyle et al. (2010) [3] observed stronger upregulation compared to this study, probably in response to the presence of H2O2 released in the damaged lettuce tissue.
In general, many other oxidative stress genes were upregulated as well (grxB, yeeE, yjgH, yjgI), although the transcripts of the stress-related gene regulators rpoS and relA (stringent response) were not significantly induced. Oxidative stress may have been caused by active oxygen species, a byproduct of normal aerobic metabolism of the lettuce plant.
cspA was significantly upregulated at 1 hpi. This gene is the major cold shock protein of E. coli and belongs to a family of structurally analogous proteins. It is an RNA chaperone to prevent the misfolding of single-stranded RNAs due to the formation of secondary structures at cold temperatures [33,34]. Cold shock, however, was prevented as much as possible in the present study, as the MOPS preculture, the MgSO4 inoculum and the temperature of the growth chamber were incubated or set at 18 °C. A plausible explanation for the increase in cold shock protein expression was suggested by Lesley et al. (2002), who have shown that upregulation of cold shock proteins can also be an indication of paused translation as a response to the presence of misfolded proteins, a response that is independent of any temperature shifts [35].

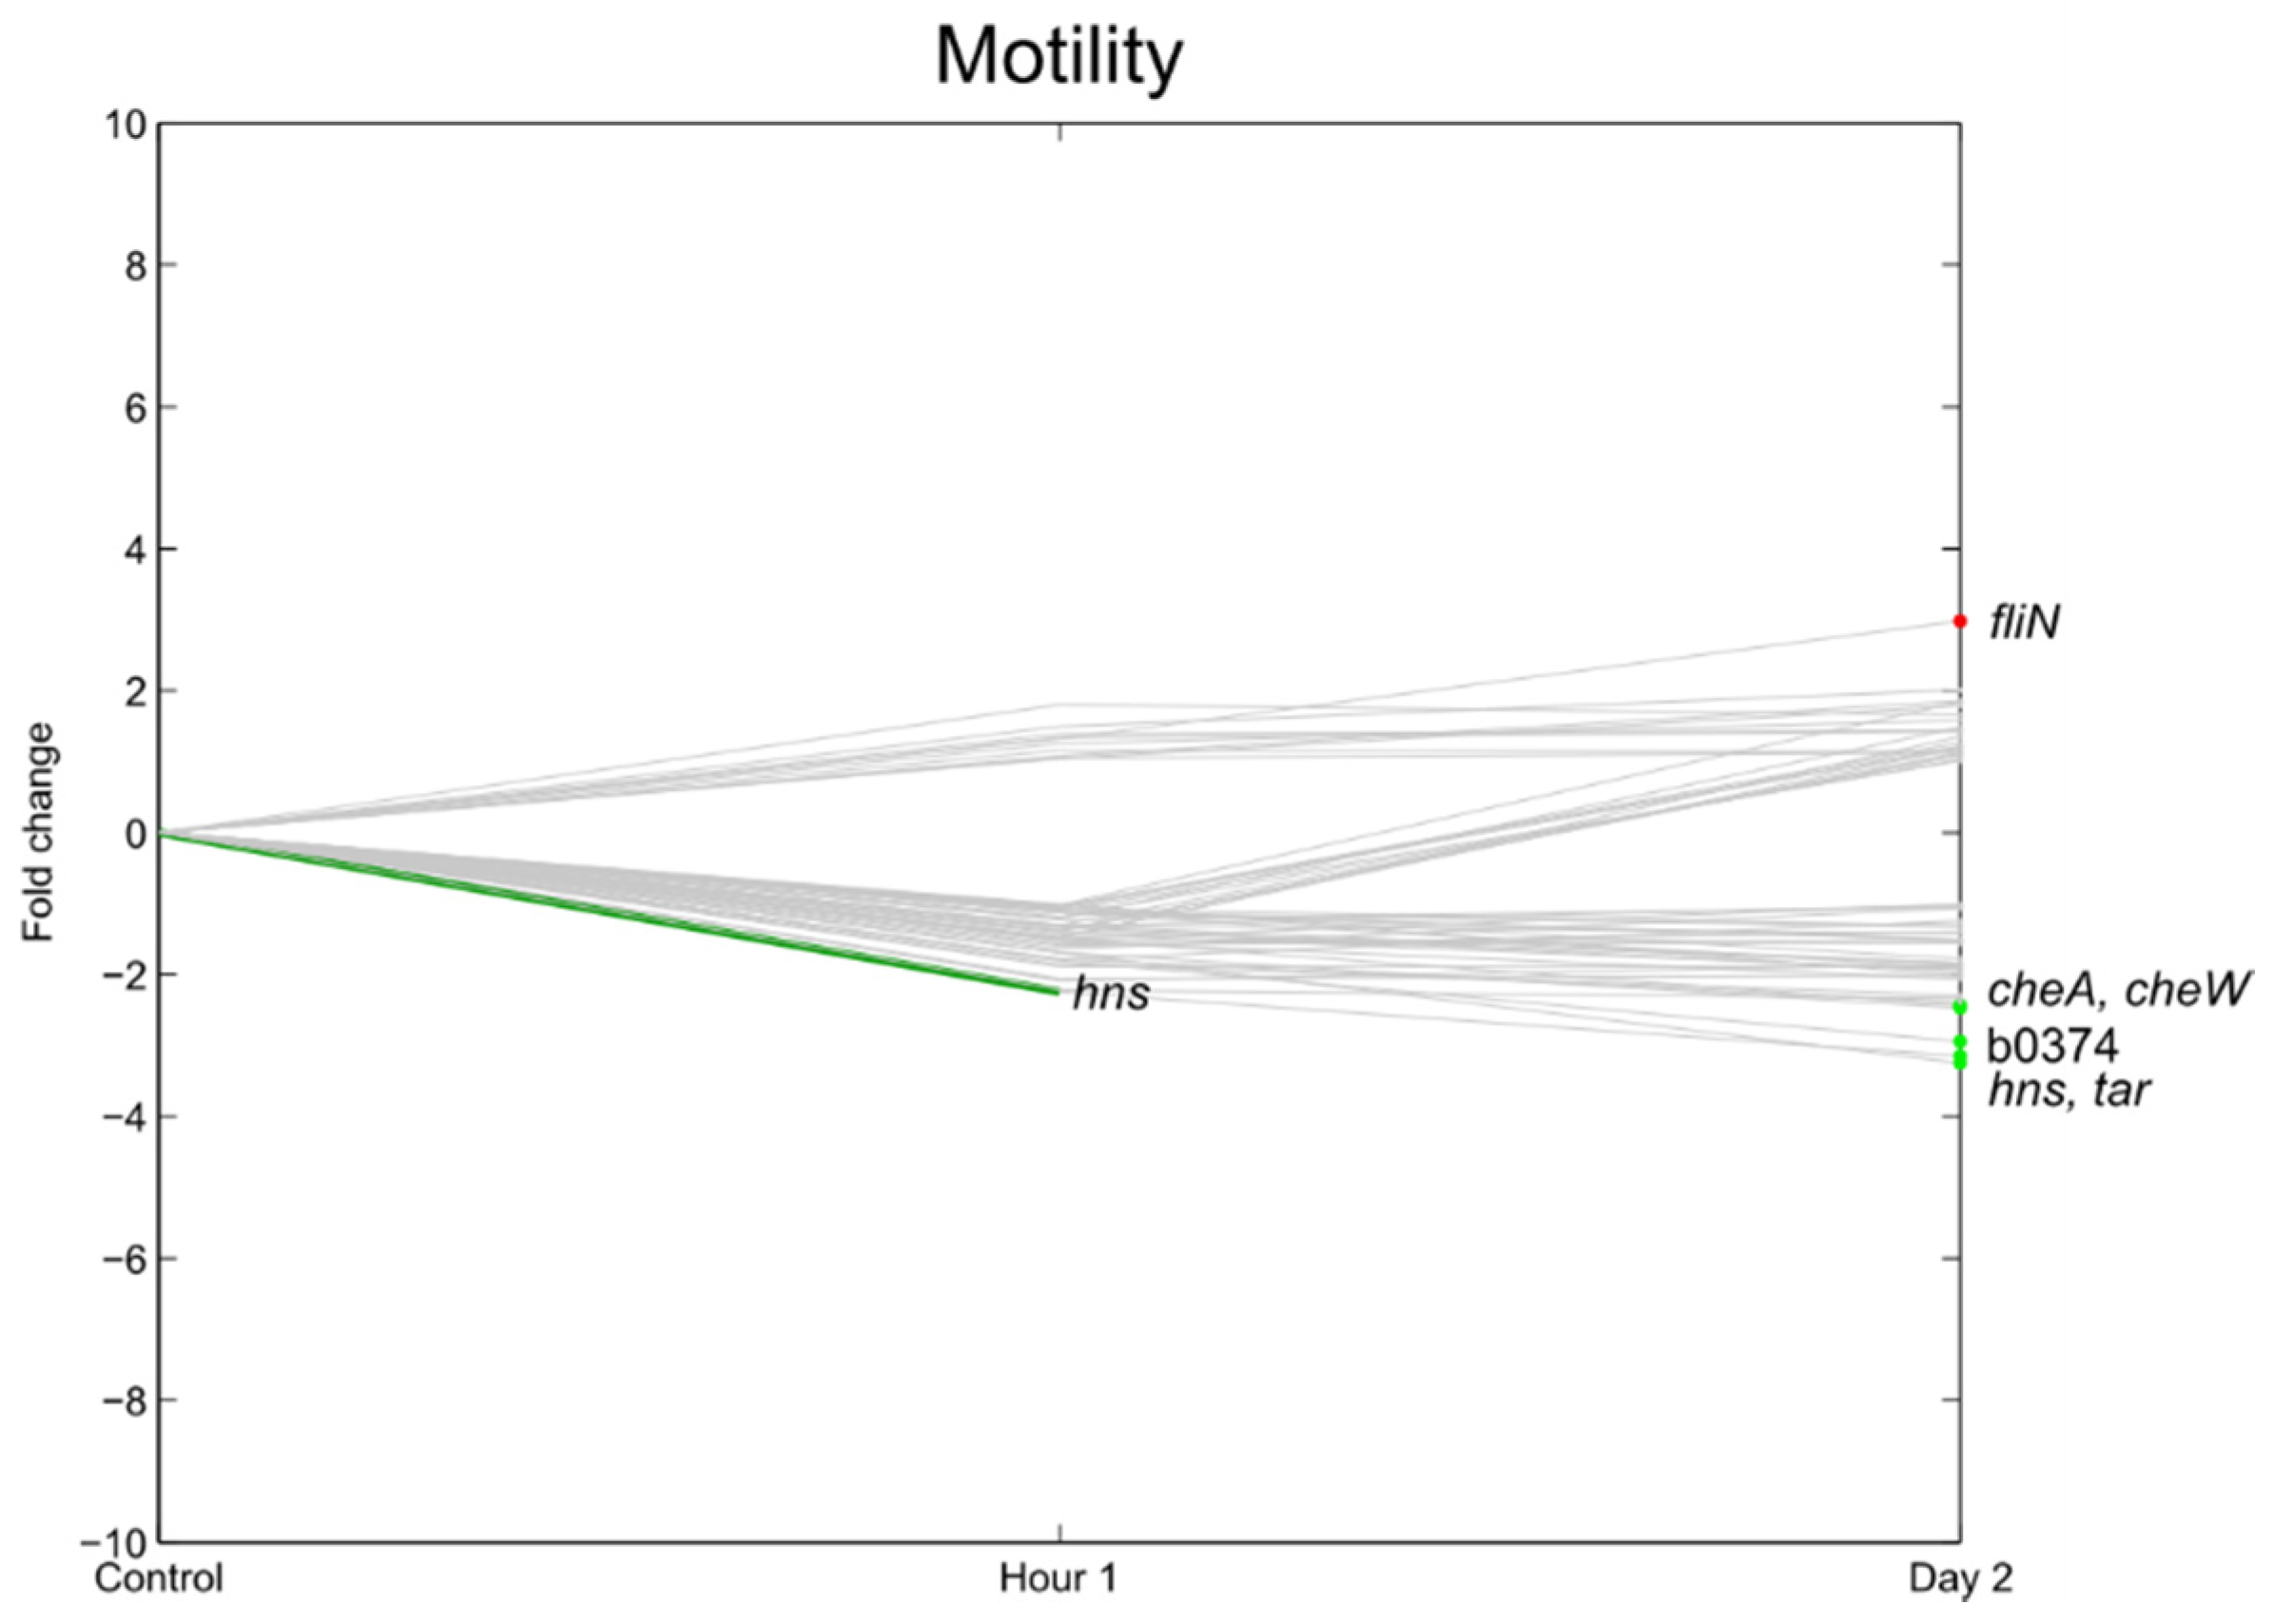
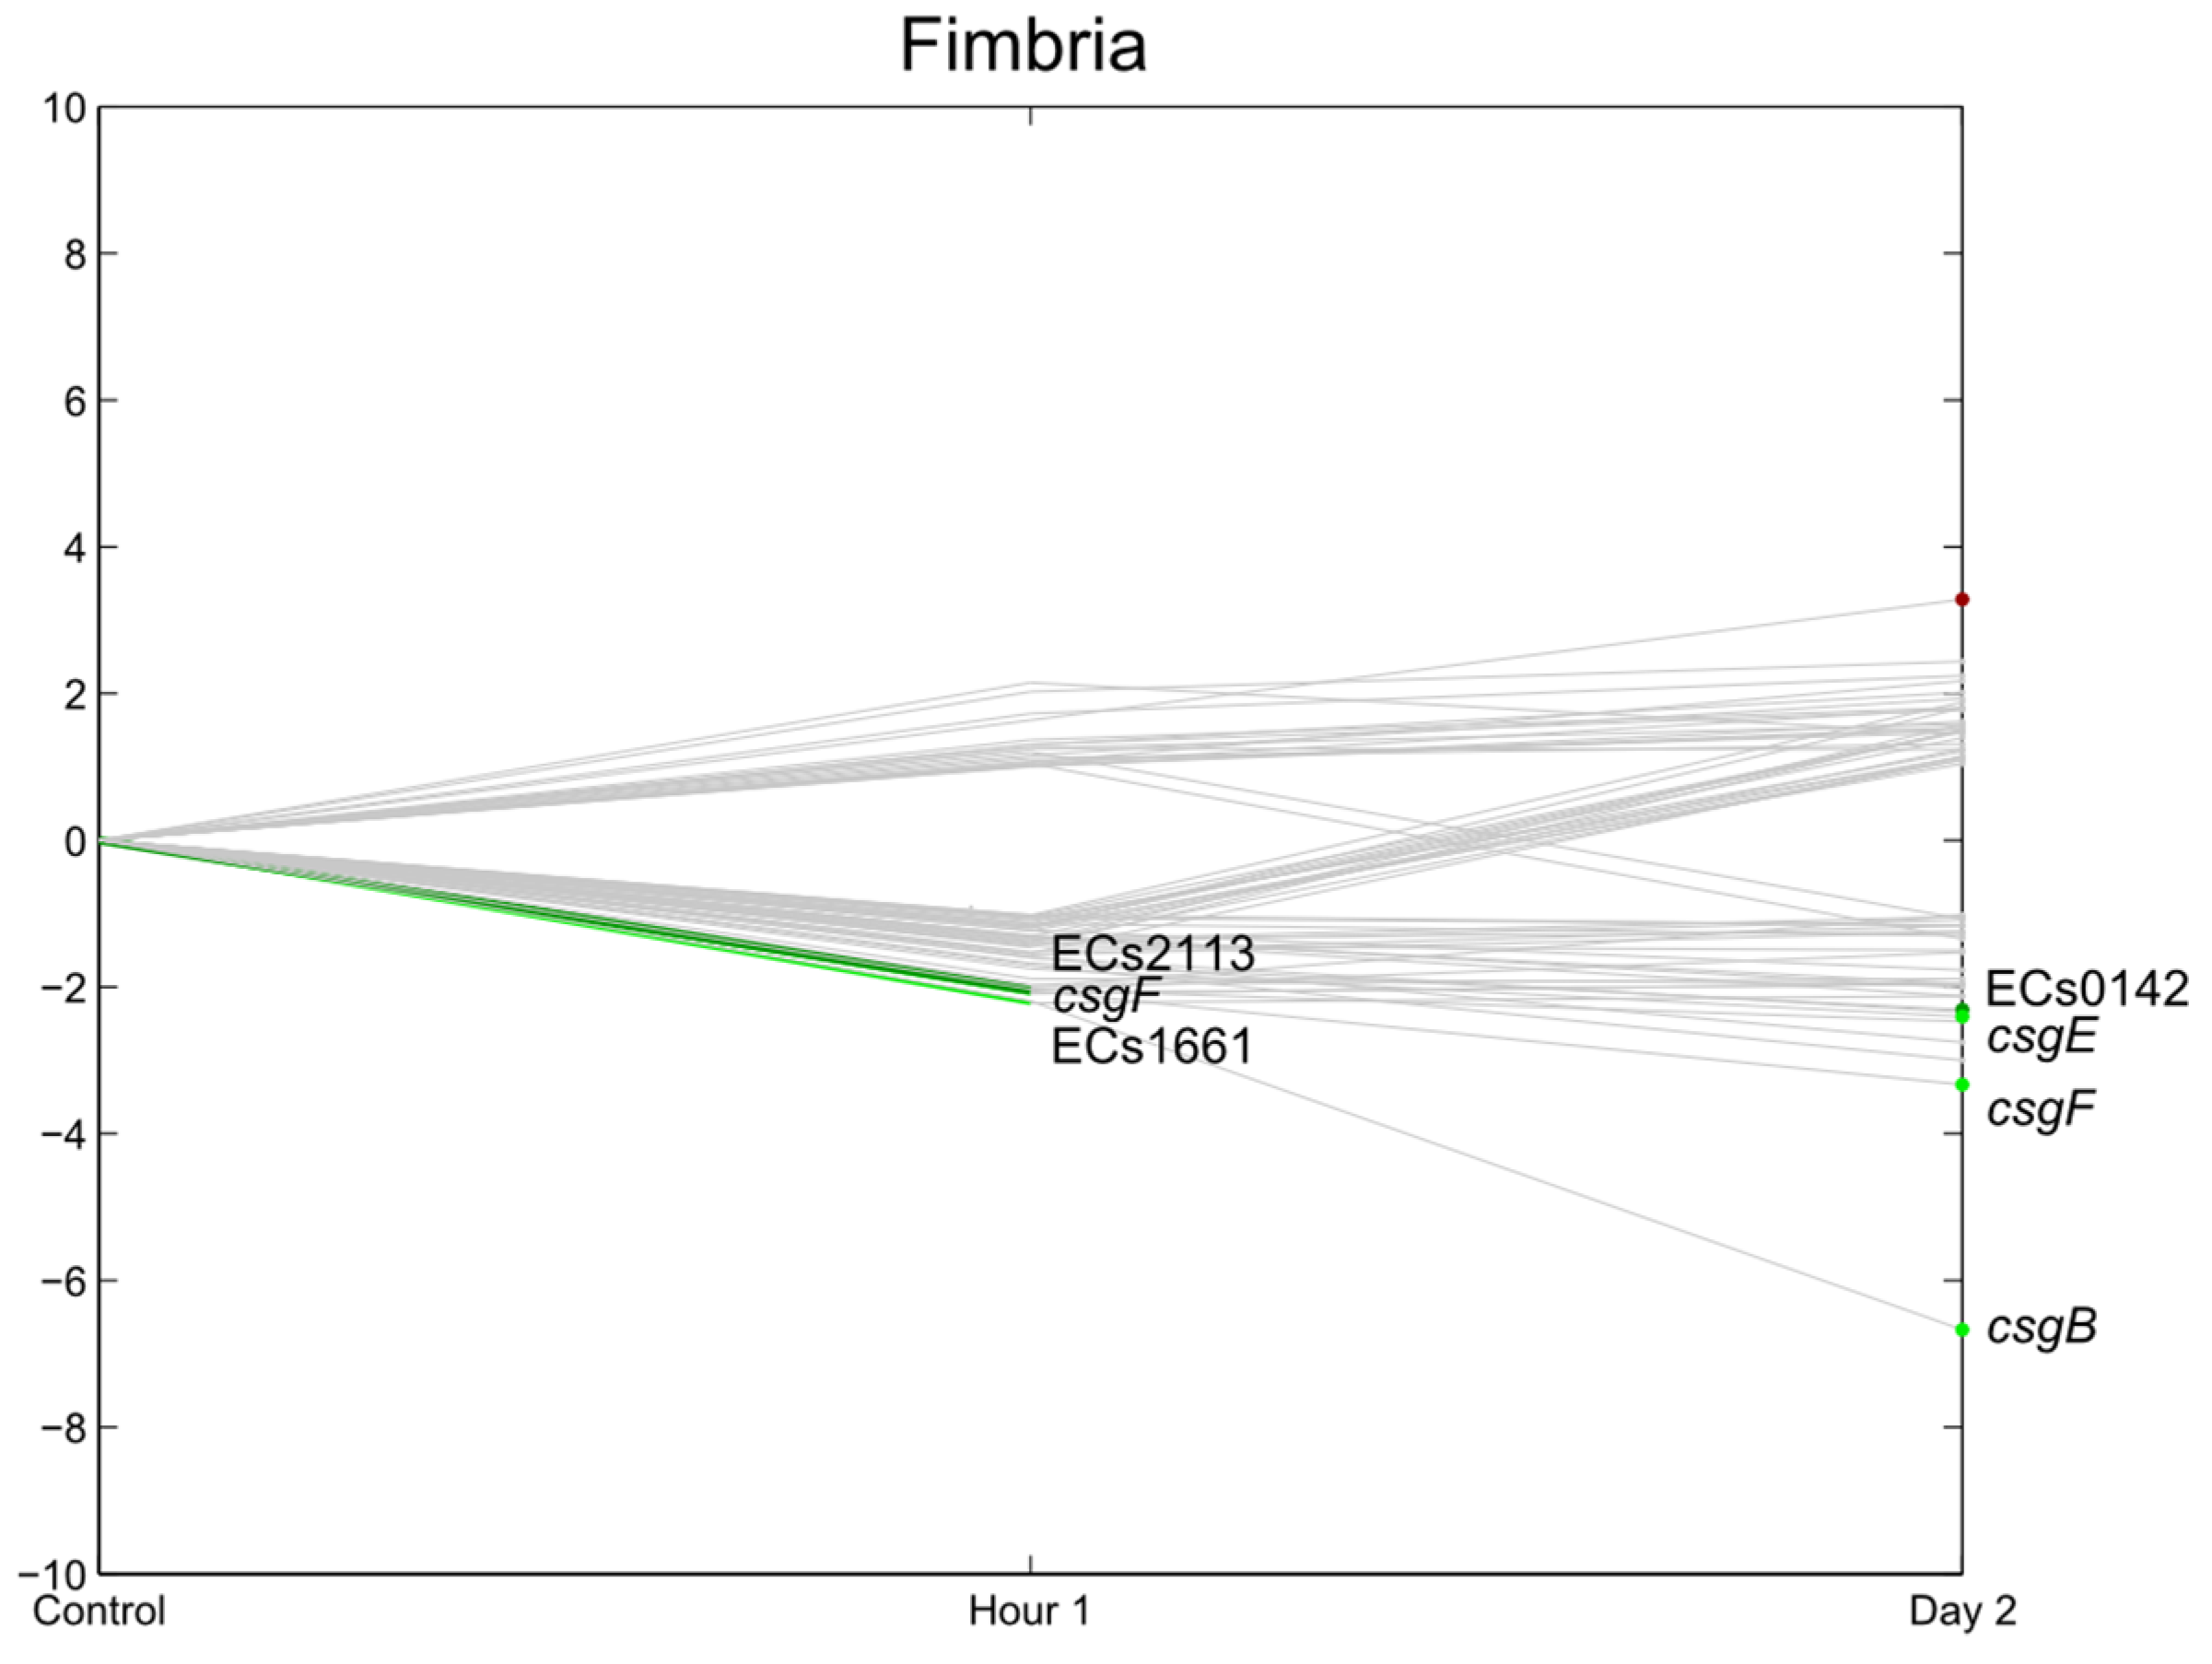
3.6. Flagella, Motility, Fimbrial Expression, Biofilm

Several authors have proposed that the presence of flagella and curli and the possibility of the bacteria to produce a biofilm may be involved in the attachment of enteric pathogens to plant tissue.
Flagella are cellular appendages involved in the motility of the pathogen and were already related to being involved in the attachment mechanism of pathogenic E. coli to fresh produce [36]. Also, for Salmonella, it was shown that the presence of flagella could increase the attachment capacity of the bacterium to plant tissue for some strains [24,37]. Furthermore, it was also shown that a mutant flagella-deficient Salmonella strain showed reduced internalization into lettuce leaf tissue compared to its wild-type strain [24]. In the present study, only a few genes related to flagella chemotaxis were significantly differentially regulated, with the majority of these genes downregulated (Figure 8 and Figure 9). tar, cheA, cheW, and b0374, were significantly downregulated at 2 dpi. Only fliN, which is responsible for flagellar export, was significantly upregulated at 1 hpi. Taking into account the reduction of cell counts at 2 dpi, these findings are in accordance with the results of Jozefzuc et al. (2010) and Lemuth et al. (2008) who observed downregulation of genes assigned to flagella and motility in response to glucose deprivation and a variety of stress conditions [38,39]. Fink et al. (2012) [4], who investigated the gene expression of E. coli and, did not observe an induction of the flagellar genes (fli operon) for E. coli O157:H7 on detached lettuce leaves. In contrast, Kyle et al. (2010) [3] observed an increase in E. coli O157:H7 fli genes in response to lettuce lysates as compared to growth in M9 medium. In their experiment, however, nutrient replenishment occurred (macerated leaves). This indicates that the influence of postharvest practices (e.g., presence of lettuce lysate due to wounding, e.g., in fresh-cut produce) can have a totally different influence on the gene expression of the pathogen.
Figure 8. Relative expression of E. coli O157:H7 Sakai genes related with motility and flagella one hour and two days after inoculation on lettuce plants. A colored line between the control and hour 1 shows that a particular gene was significantly differently expressed one hour after inoculation on the lettuce in comparison with the inoculum. A colored line between hour 1 and day 2 shows that the gene expression of a particular gene was significantly different between these two time points. Colored dots at day 2 show the genes which were significantly differently expressed on day 2 in comparison with the control. Light green: downregulation at 0.01 ≤ p < 0.05, dark green: downregulation at p < 0.01, light red: upregulation at 0.01 ≤ p < 0.05, dark red: upregulation at p < 0.01. Grey: no significant difference in expression. Data represent the mean of four biological replicates.
Agriculture 06 00006 g008
Figure 9. Relative expression of E. coli O157:H7 Sakai genes related with fimbria one hour and two days after inoculation on lettuce plants. A colored line between the control and hour 1 shows that a particular gene was significantly differently expressed one hour after inoculation on the lettuce in comparison with the inoculum. A colored line between hour 1 and day 2 shows that the gene expression of a particular gene was significantly different between these two time points. Colored dots at day 2 show the genes which were significantly differently expressed on day 2 in comparison with the control. Light green: downregulation at 0.01 ≤ p < 0.05, dark green: downregulation at p < 0.01, light red: upregulation at 0.01 ≤ p < 0.05, dark red: upregulation at p < 0.01. Grey: no significant differences in expression. Data represent the mean of four biological replicates.
Agriculture 06 00006 g009
Furthermore, flagellin, the protein that is the basic component of the filament of the flagella, is also known to be a major PAMP, recognized by plants a.o. Arabidopsis thaliana [40]. Downregulation of flagella genes may, therefore, be a reaction to the PAMP-triggered immunity response of the plant.
Curli, a specific type of fimbria, are known to mediate binding to proteins and abiotic surfaces, and are also related to biofilm formation [41,42]. In the present study, similarly to flagella-related genes, the expression of genes related to curli (operon csgDEFG and csgBAC) were either not significantly changed or were suppressed, e.g., csgA (major subunit curli), csgB (nucleator), csgE and csgF (involved in the initiation of curli subunit polymerization [43,44]). These results represent only the gene expression of loosely associated cells and confirm the results of a study performed by Macarasin et al. (2012). In their study, curli were only shown to be critical in strong attachment to spinach leaves, whereas loose attachment to spinach was not affected by curli expression [45]. These results differ from the observations of Fink et al. (2012) [4] who saw stark upregulation of csgA and csgB on detached lettuce leaves at 1 dpi. The expression levels in their study decreased at day 3 but were up to seven times higher in comparison with the control. In their experiments, the bacteria were, however, grown at 37 °C (18 °C in the present study), and it is known that curli are induced at colder temperatures. Therefore, the temperature shift that occurred in the experiment of Fink et al., (2012) [4] (the lettuce was kept at 25 °C) may explain the upregulation of the curli genes. In the present experiment no temperature shift occurred and no upregulation could be seen, but curli were initially expressed as the raw value of, e.g., the csgA gene, which was >1000. Fink et al. (2012) [4] however, found no significant regulation of the generic E. coli and E. coli O157:H7 csgAB genes on lettuce roots, although the curli regulator crl was induced in generic E. coli. However, they could demonstrate that the deletion of the csgA genes (but not of the csgB gene), resulting in a reduced capacity of generic E. coli to attach to roots [6]. Curli-related genes were also expressed during the exponential growth of E. coli O157 EDL933 in radish seedlings [7]. In summary, it appears that the role of curli has yet to be fully elucidated.
The ability to produce curli seems to be related to the ability of E. coli to produce a biofilm [46]. The gene encoding bhsA (formerly known as ycfR), biofilm formation through hydrophobicity and stress response were significantly upregulated. Upregulation of bhsA induces repression of biofilm formation by increasing indole synthesis. bhsA is upregulated under a variety of stresses such as heavy metals, drastic pH changes, temperature shock, sodium, hydrogen peroxide and in the presence of sodium salicylate [47,48]. Similar to other stress-related genes, upregulation of this gene confers resistance to these stresses [48]. Upregulation was also observed by Kyle et al. (2010) [4] and Fink et al. (2012) [4] on lettuce leaves and Hou et al. (2013) [6] on lettuce roots. The last two authors also showed that a deletion mutant showed reduced attachment to both lettuce roots and lettuce leaves.

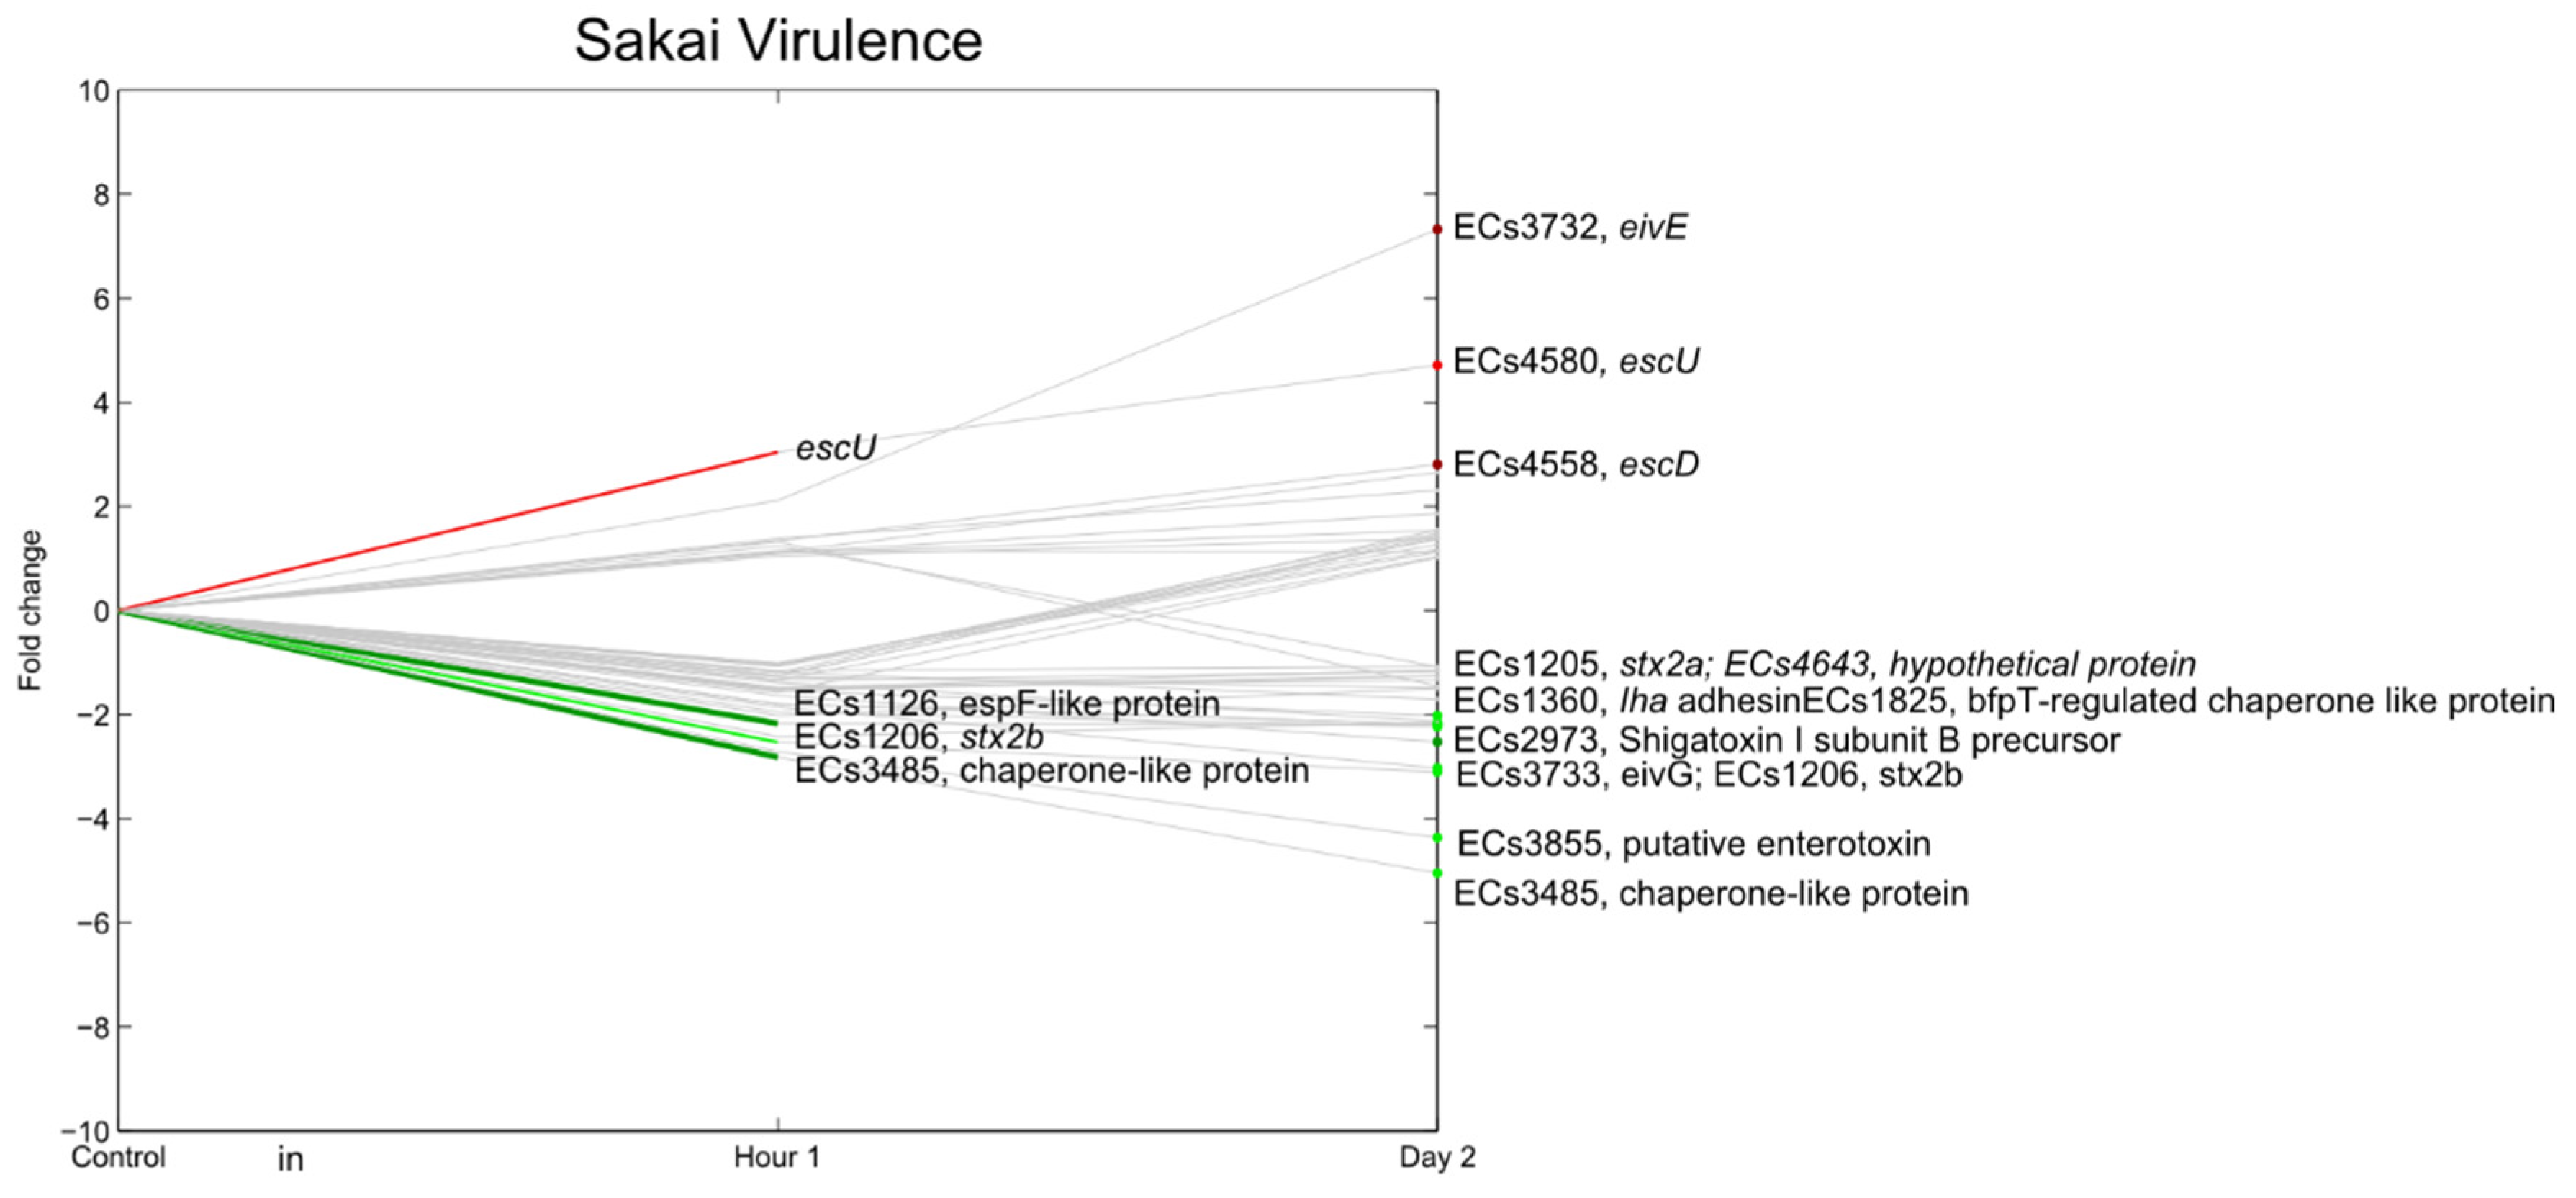
3.7. E. coli O157:H7 Sakai Virulence Genes

The Sakai O157:H7 chromosome encodes at least 131 proteins that are assumed to have virulence-related functions and that are not present in E. coli K12 [19]. A total of 31 genes are related to fimbria. Other virulence genes are encoding other adhesins/invasion-like proteins (at least 14 genes), type III secretions system-related proteins and toxin or toxin-like proteins [19].
The type III secretion system (T3SS) encoded by the LEE locus is responsible for the formation of attaching and effacing (A/E) lesions. ler (LEE encoded regulator, ECs4588), a central regulator for the genes encoded on the LEE locus [49], was repressed during the experiments and, consequently, most T3SS-related genes were downregulated (Figure 10). Some T3SS genes, however, were significantly upregulated, including ECs3732 (eivE), ECs4558 (escD) and ECs4580 (escU).
In general, the majority of virulence genes were downregulated. The best known virulence factors are the Shiga toxins (stx1 and stx2) and, to a lesser extent, enterohemolysins. Here we used a strain that has an insertional inactivation of the stx2 gene and is lacking stx1ORF; therefore, it was not possible to accurately assess the expression of these genes. However, the expression of Shiga toxin I subunit B precursor (ECs2973) and EHEC-hlyA (hemolysin toxin protein, located on the pO157 plasmid) were significantly downregulated two days after inoculation (p < 0.01). ECs1283, a homologue of the major virulence factor in Clostridium difficile, was not differentially regulated. This contrasts with the findings from Carey et al. (2009) who showed that the expression of stx1 and stx2 increased on postharvest romaine lettuce at 4 °C and 15 °C, with higher expression values at 4 °C [50]. Sharma et al. (2011) also reported increased expression of virulence genes at postharvest at 15 °C, although not at 4 °C. Their experiment was relevant for near-ambient conditions compared to modified atmosphere packaging [51]. Small amounts Shiga toxins were also detected in an E. coli O157 population supposed to be in the viable but non culturable (VBNC) state after inoculation on lettuce leaves [52]. In these cases it is possible that Shiga toxin was expressed and detected as a result of a stress response in the bacteria (e.g., from temperature or iron depletion), which may have resulted in expression and even lysogeny of the Shiga toxin phage, via the SOS response [53,54]. eae was also found not to be differentially regulated, which is in accordance with Xicohtencatl-cortes et al. (2009), who showed that the eae gene was not involved in attachment to fresh produce [36]. Finally, Noel et al. (2010) found that Salmonella motility and animal virulence genes did not contribute significantly to fitness of the bacteria inside tomatoes [55].
Figure 10. Relative expression of E. coli O157:H7 Sakai genes related with virulence (except for fimbrial genes) one hour and two days after inoculation on lettuce plants. A colored line between the control and hour 1 shows that a particular gene was significantly differently expressed one hour after inoculation on the lettuce in comparison with the inoculum. A colored line between hour 1 and day 2 shows that the gene expression of a particular gene was significantly different between these two time points. Colored dots at day 2 show the genes which were significantly differently expressed on day 2 in comparison with the control. Light green: downregulation at 0.01 ≤ p < 0.05, dark green: downregulation at p < 0.01, light red: upregulation at 0.01 ≤ p < 0.05, dark red: upregulation at p < 0.01. Grey: no significant difference in expression. Data represent the mean of four biological replicates.
Agriculture 06 00006 g010

3.8. Unknown Genes

Almost 40% of the genes that were differentially regulated at p < 0.01 were poorly characterized or had an unknown function following COG classification. This is likely a reflection of the fact that most research to determine the function of E. coli genes is carried out in the context of animal colonization and pathogenicity. The high proportion of uncharacterized genes may indicate that E. coli O157:H7 has a specific set of genes to survive in the non-animal environment. Interestingly, several of these genes were also Sakai-specific. Seven Sakai-specific genes were significantly upregulated and 20 downregulated at p < 0.01. Alignment analysis of these genes was performed with other E. coli strains in an attempt to define a (putative) function (Table 2).
Of note are ECs4115, ECs2526 and ECs0230, three of the most highly expressed Sakai-specific hypothetical genes. ECs4115 has similarity to yhcR, also known as aaeX, which may be related with biofilm formation. The genes in the AaeXAD operon, which are normally not expressed at a significant level [56,57], were some of the most upregulated genes in a study of global gene expression of biofilms of two E. coli urinary tract infection strains grown in human urine [58]. Furthermore, Monnappa et al. (2013) showed that aaeXAB may be involved in the efflux of (even low) concentrations of plant hydrolysate-related phenolics, such as ferulic acid, an abundant phenolic phytochemical found in plant cell wall components and vanillic acids [59]. It was notable here that ECs4115 was induced almost 26-fold. The ECs2526 nucleotide sequence shows some similarity to corC, which encodes a Mg and Co efflux protein. ECs0230 potentially encodes an RNA methyltransferase type VI secretion protein. The contributions of the type 6 secretion system (T6SSs) to virulence development are diverse. In cell culture systems, T6SSs have been reported to play crucial roles in cell adhesion and invasion and intracellular growth, but most importantly in inter-bacterial competition [60]. Thus, its expression on lettuce leaves may indicate the presence of other epiphytic bacteria.
Table 2. Overview of expression levels of genes encoding for hypothetical Sakai-specific proteins at the p < 0.01 level at day 0 or day 2 (significant regulation is shown in bold).
GeneNameFoldchange Day 0Foldchange Day 2Similarity with Known GeneStrain with Known Gene with Similar Sequence
ECs0073−2.3−2.5non-LEE-encoded type III secreted effectorEscherichia coli O157:H7 str. TW14359
ECs02302.03.7VCA0109-like protein (RNA methyltransferase type VI secretion protein)Escherichia coli O157:H7 str. EDL933
ECs0238−2.4−4.4//
ECs0281−1.9−2.4Putative tail fiber assembly proteinEscherichia coli O157:H7 str. EDL933
ECs0541−2.1−2.7PKD domain proteinEscherichia coli O157:H7 str. EC4115
ECs1125−1.7−2.7EspF like protein or Tir-cytoskeleton coupling proteinEscherichia coli Xuzhou21/Escherichia coli O157:H7 str. TW14359
ECs12041.72.2Putative DNA methylaseEscherichia coli O157:H7 str. EDL933, complete genome
ECs1238−2.0−3.1//
ECs1239−1.8−2.3//
ECs1246−2.2−3.7//
ECs1445−1.9−3.4//
ECs1567−2.6−3.3T3SS effector protein EspOEscherichia coli O145:H28 str. RM12761
ECs1586−2.9−4.0//
ECs2291−1.6−2.2Lipoprotein YnfC precursorEscherichia coli O157:H7 str. SS17, complete genome
ECs2473−2.0−1.5Putative lipoprotein
ECs252614.78.2Mg and Co efflux protein CorCEscherichia coli O157:H7 str. EDL933, complete genome
ECs3238−3.8−6.2//
ECs3250−2.1−2.256 bp at 5′ side: hybrid sensory histidine kinase in regulatory system with EvgA
289 bp at 3’ side predicted transporter
a.o. Escherichia coli O157:H7 str. EDL933, complete genome
ECs3772−2.2−2.9//
ECs39662.33.523S rRNA (guanine−N−2−) −methyltransferase rlmGa.o. Escherichia coli O157:H7 str. EDL933, complete genome
ECs41157.625.8similar to yhcR which is also known as aaeXEscherichia coli O157:H7 str. EC4115
ECs4465−2.6−4.4Fic family proteinEscherichia coli O157:H7 str. EC4115, complete genome
ECs44913.11.8Periplasmic septal ring factor with murein hydrolase activity EnvCEscherichia coli O157:H7 str. EDL933, complete genome
ECs4537−2.2−2.4transposase ORF B, IS3 family proteinEscherichia coli O55:H7 str. RM12579, complete genome
ECs4816−2.4−2.4//
ECs52662.02.6transposaseEscherichia coli O157:H7 str. EDL933, complete genome
ECs5291−1.9−2.9adherence and invasion outermembrane protein (Inv, enhances Peyer's patches colonization)Escherichia coli O157:H7 str. EDL933, complete genome

3.9. Limitations of the Data

Although efforts were made to mimic a natural contamination event, it should be taken into account that the data presented in this study were generated from artificially inoculated plants and that a high E. coli Sakai inoculum level had to be used to be able to extract sufficient levels of bacterial mRNA. As the initial inoculum level was higher than the maximum carrying capacity of the lettuce leaves, which is around 6 log CFU/g [61,62], the pathogen load on the leaves indeed declined. It has, however, already been shown that E. coli O157 is able to grow in the lettuce phyllosphere under high humidity conditions [61,63]. Furthermore, we remark that the high inoculum density could also bias other aspects of E. coli O157 fitness in the phyllosphere, among which are the transition to a viable but non-culturable state [52] or changes in capacity to attach [64,65].
In addition, the data from this study only describe the gene expression of loosely associated E. coli Sakai cells that could be collected by applying the washing protocol as described above. Preliminary tests showed that about 10% of the E. coli Sakai population could not be removed from the lettuce leaves with the used washing protocol, and hence were considered either strongly associated or internalized. Attempts to investigate the gene expression profiles of these strongly associated or internalized E. coli Sakai cells failed when a wash protocol with glass beads was applied, because not enough high quality mRNA could be extracted due to proportionally high amounts of co-extracted lettuce (chloroplast) RNA.

4. Conclusions

The main aim of this research was to characterize the gene expression response of E. coli O157:H7 in a simulated preharvest contamination event in a greenhouse.
Attention was given to the growth conditions of the plants and bacteria. Plants were grown from seeds under conditions that mimic those in commercial lettuce production greenhouses in Belgium; the bacterial strain used for inoculations, E. coli O157:H7 Sakai, previously isolated from a fresh produce outbreak, was cultured at 18 °C and resuspended in a low concentration salt solution to simulate the suboptimal environmental conditions that occur outside the animal host, e.g., in irrigation water. The results support the concept that the plant environment, or, more broadly, the non-animal environment, is part of the ecological niche of human pathogens [66,67,68,69,70]. Firstly, the data showed that genes such as the highly upregulated azoR could have been induced in reaction to the plant defense response. Secondly, the fact that almost 40% of the significantly differentially regulated genes were poorly characterized or had an unknown function showed that there are still questions on the function of environment-specific genes, including the plant environment, in comparison with the well-studied animal host environment. Thirdly, there was clearly little need for virulence genes associated with pathogenicity of animal hosts as most virulence genes were downregulated. It was noticed that there was overlap between the results of the present study for growing lettuce leaves and the response to detached lettuce leaves, observed by Fink et al. (2012) [4] (for an overview see also supplemental Figure 2), adding strength to the concept of a plant-dependent response. In both studies, stress responsive genes in particular were upregulated, whereas energy metabolism and translation mechanisms were downregulated. Differences, however, could be observed, e.g., for the curli genes which may be due to the different experimental set-up.
The present study provides a basis for further studies using mutants (knock-out, overexpression) and challenge tests such as those performed by Kyle et al. (2010) [3] and Oliveira et al. (2010) [71]. Such studies would reveal the extent to which the observed gene expression changes influence subsequent survival and antibiotic and sanitation resistance of the bacteria. In order to facilitate choices for experimental set-up, to increase consistency among studies and to enable direct comparison or at least facilitate meta-analysis, the use of standardized protocols would be essential.
In conclusion, we have shown that E. coli O157:H7 Sakai actively interacts with the plant environment by adapting its metabolism and responding to oxidative stress. Expression of several other animal-associated virulence genes was decreased in the lettuce phyllosphere. Further research is needed to investigate how these adaptations may affect the pathogen’s subsequent survival during processing and consumption.

Supplementary Files

Supplementary File 1

Acknowledgments

This study was funded by the Federal Public Service of Health, Food Chain Safety and Environment (contract SALCOSLA RF 6202). The authors would like to thank Louise Birse, Pete Hedley and Jenny Morris for their help and processing the microarrays.

Author Contributions

Inge Van der Linden contributed to the design of the study, production, analysis and interpretation of the results, and preparation of the manuscript. Nicola Holden contributed to the design of the study, analysis and interpretation of the results and preparation of the manuscript. Martine Maes, Bart Cottyn, Marc Heyndrickx, Geertrui Vlaemynck and Mieke Uyttendaele contributed to the design of the study and preparation of the manuscript.

Conflicts of Interest

The authors declare no conflict of interest.

References

  1. Klein, S.; Tian, A.; Witmer, J.; DeWaal, C.S. The FDA Top Ten: The Riskiest Foods Regulated by the US Food and Drug Administration; The Center for Science in the Public Interest: Washington, DC, USA, 2009. [Google Scholar]
  2. Delaquis, P.; Bach, S.; Dinu, L.D. Behavior of Escherichia coli O157:H7 in leafy vegetables. J. Food Prot. 2007, 70, 1966–1974. [Google Scholar] [PubMed]
  3. Kyle, J.L.; Parker, C.T.; Goudeau, D.; Brandl, M.T. Transcriptome analysis of Escherichia coli O157:H7 exposed to lysates of lettuce leaves. Appl. Environ. Microbiol. 2010, 76, 1375–1387. [Google Scholar] [CrossRef] [PubMed]
  4. Fink, R.C.; Black, E.P.; Hou, Z.; Sugawara, M.; Sadowsky, M.J.; Diez-Gonzalez, F. Transcriptional responses of Escherichia coli K-12 and O157:H7 associated with lettuce leaves. Appl. Environ. Microbiol. 2012, 78, 1752–1764. [Google Scholar] [CrossRef] [PubMed]
  5. Hou, Z.; Fink, R.C.; Black, E.P.; Sugawara, M.; Zhang, Z.; Diez-Gonzalez, F.; Sadowsky, M.J. Gene expression profiling of Escherichia coli in response to interactions with the lettuce rhizosphere. J. Appl. Microbiol. 2012, 113, 1076–1086. [Google Scholar] [CrossRef] [PubMed]
  6. Hou, Z.; Fink, R.C.; Sugawara, M.; Diez-Gonzalez, F.; Sadowsky, M.J. Transcriptional and functional responses of Escherichia coli O157:H7 growing in the lettuce rhizoplane. Food Microbiol. 2013, 35, 136–142. [Google Scholar] [CrossRef] [PubMed]
  7. Landstorfer, R.; Simon, S.; Schober, S.; Keim, D.; Scherer, S.; Neuhaus, K. Comparison of strand-specific transcriptomes of enterohemorrhagic Escherichia coli O157:H7 EDL933 (EHEC) under eleven different environmental conditions including radish sprouts and cattle feces. BMC Genomics 2014, 15, 353. [Google Scholar] [CrossRef] [PubMed]
  8. Dahan, S.; Knutton, S.; Shaw, R.K.; Crepin, V.F.; Dougan, G.; Frankel, G. Transcriptome of enterohemorrhagic Escherichia coli O157 adhering to eukaryotic plasma membranes. Infect. Immun. 2004, 72, 5452–5459. [Google Scholar] [CrossRef] [PubMed]
  9. Michino, H.; Araki, K.; Minami, S.; Takaya, S.; Sakai, N.; Miyazaki, M.; Ono, A.; Yanagawa, H. Massive outbreak of Escherichia coli O157:H7 infection in schoolchildren in Sakai City, Japan, associated with consumption of white radish sprouts. Am. J. Epidemiol. 1999, 150, 787–796. [Google Scholar] [CrossRef] [PubMed]
  10. Watanabe, Y.; Ozasa, K.; Mermin, J.H.; Griffin, P.M.; Masuda, K.; Imashuku, S.; Sawada, T. Factory outbreak of Escherichia coli O157:H7 infection in Japan. Emerg. Infect. Dis. 1999, 5, 424–428. [Google Scholar] [CrossRef] [PubMed]
  11. Neidhardt, F.C.; Bloch, P.L.; Smith, D.F. Culture medium for enterobacteria. J. Bacteriol. 1974, 119, 736–747. [Google Scholar] [PubMed]
  12. Kisluk, G.; Hoover, D.G.; Kneil, K.E.; Yaron, S. Quantification of low and high levels of Salmonella enterica serovar Typhimurium on leaves. LWT Food Sci. Technol. 2012, 45, 36–42. [Google Scholar] [CrossRef]
  13. Fislage, R.; Berceanu, M.; Humboldt, Y.; Wendt, M.; Oberender, H. Primer design for a prokaryotic differential display RT-PCR. Nucleic Acids Res. 1997, 25, 1830–1835. [Google Scholar] [CrossRef] [PubMed]
  14. Kim, J.; Demeke, T.; Clear, R.M.; Patrick, S.K. Simultaneous detection by PCR of Escherichia coli, Listeria monocytogenes and Salmonella typhimurium in artificially inoculated wheat grain. Int. J. Food Microbiol. 2006, 111, 21–25. [Google Scholar] [CrossRef] [PubMed]
  15. Chaudhuri, R.R.; Pallen, M.J. xBASE, a collection of online databases for bacterial comparative genomics. Nucleic Acids Res. 2006, 34, D335–D337. [Google Scholar] [CrossRef] [PubMed]
  16. Markowitz, V.M.; Chen, I.-M.A.; Palaniappan, K.; Chu, K.; Szeto, E.; Pillay, M.; Ratner, A.; Huang, J.; Woyke, T.; Huntemann, M. IMG 4 version of the integrated microbial genomes comparative analysis system. Nucleic Acids Res. 2013. [Google Scholar] [CrossRef] [PubMed]
  17. GenProTec. E. coli genome and proteome database. Available online: http://genprotec.mbl.edu/ (accessed on 31 December 2013).
  18. E. coli O157:H7 Sakai genome project. Available online: http://genome.bio.titech.ac.jp/bacteria/o157/search.html (accessed on 10 September 2014).
  19. Hayashi, T.; Makino, K.; Ohnishi, M.; Kurokawa, K.; Ishii, K.; Yokoyama, K.; Han, C.-G.; Ohtsubo, E.; Nakayama, K.; Murata, T. Complete genome sequence of enterohemorrhagic Escherichia coli O157:H7 and genomic comparison with a laboratory strain K-12. DNA Res. 2001, 8, 11–22. [Google Scholar] [CrossRef] [PubMed]
  20. Rocha, D.J.; Santos, C.S.; Pacheco, L.G. Bacterial reference genes for gene expression studies by RT-qPCR: Survey and analysis. Antonie Van Leeuwenhoek 2015, 108, 685–693. [Google Scholar] [CrossRef] [PubMed]
  21. Zhou, K.; Zhou, L.; Lim, Q.E.; Zou, R.; Stephanopoulos, G.; Too, H.-P. Novel reference genes for quantifying transcriptional responses of Escherichia coli to protein overexpression by quantitative PCR. BMC Mol. Biol. 2011. [Google Scholar] [CrossRef] [PubMed]
  22. Lemoine, R. Sucrose transporters in plants: Update on function and structure. Biochim. Biophys. Acta 2000, 1465, 246–262. [Google Scholar] [CrossRef]
  23. Kang, Y.; Outlaw, W.H.; Andersen, P.C.; Fiore, G.B. Guard-cell apoplastic sucrose concentration—A link between leaf photosynthesis and stomatal aperture size in the apoplastic phloem loader Vicia faba L. Plant Cell Environ. 2007, 30, 551–558. [Google Scholar] [CrossRef] [PubMed]
  24. Kroupitski, Y.; Golberg, D.; Belausov, E.; Pinto, R.; Swartzberg, D.; Granot, D.; Sela, S. Internalization of Salmonella enterica in leaves is induced by light and involves chemotaxis and penetration through open stomata. Appl. Environ. Microbiol. 2009, 75, 6076–6086. [Google Scholar] [CrossRef] [PubMed]
  25. Leveau, J.H.J.; Lindow, S.E. Appetite of an epiphyte: Quantitative monitoring of bacterial sugar consumption in the phyllosphere. Proc. Natl. Acad. Sci. USA 2001, 98, 3446–3453. [Google Scholar] [CrossRef] [PubMed]
  26. Schwartz, C.J.; Djaman, O.; Imlay, J.A.; Kiley, P.J. The cysteine desulfurase, IscS, has a major role in in vivo Fe-S cluster formation in Escherichia coli. Proc. Natl. Acad. Sci. USA 2000, 97, 9009–9014. [Google Scholar] [CrossRef] [PubMed]
  27. Hidese, R.; Mihara, H.; Esaki, N. Bacterial cysteine desulfurases: Versatile key players in biosynthetic pathways of sulfur-containing biofactors. Appl. Microbiol. Biotechnol. 2011, 91, 47–61. [Google Scholar] [CrossRef] [PubMed]
  28. Brankatschk, K.; Kamber, T.; Pothier, J.F.; Duffy, B.; Smits, T.H. Transcriptional profile of Salmonella enterica subsp. enterica serovar Weltevreden during alfalfa sprout colonization. Microb. Biotechnol. 2013, 7, 528–544. [Google Scholar] [PubMed]
  29. Konstantinidis, K.T.; Tiedje, J.M. Trends between gene content and genome size in prokaryotic species with larger genomes. Proc. Natl. Acad. Sci. USA. 2004, 101, 3160–3165. [Google Scholar] [CrossRef] [PubMed]
  30. Matilla, M.A.; Espinosa-Urgel, M.; Rodríguez-Herva, J.J.; Ramos, J.L.; Ramos-González, M.I. Genomic analysis reveals the major driving forces of bacterial life in the rhizosphere. Genome Biol 2007. [Google Scholar] [CrossRef] [PubMed]
  31. Liu, G.; Zhou, J.; Fu, Q.S.; Wang, J. The Escherichia coli azoreductase AzoR is involved in resistance to thiol-specific stress caused by electrophilic quinones. J. Bacteriol. 2009, 191, 6394–6400. [Google Scholar] [CrossRef] [PubMed]
  32. Goudeau, D.M.; Parker, C.T.; Zhou, Y.; Sela, S.; Kroupitski, Y.; Brandl, M.T. The Salmonella transcriptome in lettuce and cilantro soft rot reveals a niche overlap with the animal host intestine. Appl. Environ. Microbiol. 2013, 79, 250–262. [Google Scholar] [CrossRef] [PubMed]
  33. Kortmann, J.; Narberhaus, F. Bacterial RNA thermometers: Molecular zippers and switches. Nat. Rev. Microbiol. 2012, 10, 255–265. [Google Scholar] [CrossRef] [PubMed]
  34. Duffitt, A.D.; Reber, R.T.; Whipple, A.; Chauret, C. Gene expression during survival of Escherichia coli O157:H7 in soil and water. Int. J. Microbiol. 2011. [Google Scholar] [CrossRef] [PubMed]
  35. Lesley, S.A.; Graziano, J.; Cho, C.Y.; Knuth, M.W.; Klock, H.E. Gene expression response to misfolded protein as a screen for soluble recombinant protein. Protein Eng. 2002, 15, 153–160. [Google Scholar] [CrossRef] [PubMed]
  36. Xicohtencatl-Cortes, J.; Chacon, E.S.; Saldana, Z.; Freer, E.; Giron, J.A. Interaction of Escherichia coli O157:H7 with leafy green produce. J. Food Prot. 2009, 72, 1531–1537. [Google Scholar] [PubMed]
  37. Berger, C.N.; Shaw, R.K.; Brown, D.J.; Mather, H.; Clare, S.; Dougan, G.; Pallen, M.J.; Frankel, G. Interaction of Salmonella enterica with basil and other salad leaves. ISME J. 2009, 3, 261–265. [Google Scholar] [CrossRef] [PubMed]
  38. Lemuth, K.; Hardiman, T.; Winter, S.; Pfeiffer, D.; Keller, M.; Lange, S.; Reuss, M.; Schmid, R.; Siemann-Herzberg, M. Global transcription and metabolic flux analysis of Escherichia coli in glucose-limited fed-batch cultivations. Appl. Environ. Microbiol. 2008, 74, 7002–7015. [Google Scholar] [CrossRef] [PubMed]
  39. Jozefczuk, S.; Klie, S.; Catchpole, G.; Szymanski, J.; Cuadros-Inostroza, A.; Steinhauser, D.; Selbig, J.; Willmitzer, L. Metabolomic and transcriptomic stress response of Escherichia coli. Mol. Syst. Biol. 2010, 6, 1–16. [Google Scholar] [CrossRef] [PubMed]
  40. Thilmony, R.; Underwood, W.; He, S.Y. Genome-wide transcriptional analysis of the Arabidopsis thaliana interaction with the plant pathogen Pseudomonas syringae pv. tomato DC3000 and the human pathogen Escherichia coli O157:H7. Plant J. 2006, 46, 34–53. [Google Scholar] [CrossRef] [PubMed]
  41. Blomfield, I.C.V.D.M. Regulation of fimbrial expression. In EcoSal; Curtiss, R.I., Kaper, J.B., Squires, C.L., Karp, P.D., Neidhardt, F.C., Slauch, J.M., Eds.; ASM Press: Washington, DC, USA, 2007. [Google Scholar]
  42. Boyer, R.R.; Sumner, S.S.; Williams, R.C.; Pierson, M.D.; Popham, D.L.; Kniel, K.E. Influence of curli expression by Escherichia coli O157:H7 on the cell's overall hydrophobicity, charge, and ability to attach to lettuce. J. Food Prot. 2007, 70, 1339–1345. [Google Scholar] [PubMed]
  43. Römling, U.; Bian, Z.; Hammar, M.; Sierralta, W.D.; Normark, S. Curli fibers are highly conserved between Salmonella typhimurium and Escherichia coli with respect to operon structure and regulation. J. Bacteriol. 1998, 180, 722–731. [Google Scholar] [PubMed]
  44. Keseler, I.M.; Collado-Vides, J.; Santos-Zavaleta, A.; Peralta-Gil, M.; Gama-Castro, S.; Muñiz-Rascado, L.; Bonavides-Martinez, C.; Paley, S.; Krummenacker, M.; Altman, T. EcoCyc: A comprehensive database of Escherichia coli biology. Nucleic Acids Res. 2011, 39, D583–D590. [Google Scholar] [CrossRef] [PubMed]
  45. Macarisin, D.; Patel, J.; Bauchan, G.; Giron, J.A.; Sharma, V.K. Role of curli and cellulose expression in adherence of Escherichia coli O157:H7 to spinach leaves. Foodborne Pathog. Dis. 2012, 9, 160–167. [Google Scholar] [CrossRef] [PubMed]
  46. Vidal, O.; Longin, R.; Prigent-Combaret, C.; Dorel, C.; Hooreman, M.; Lejeune, P. Isolation of an Escherichia coli K-12 mutant strain able to form biofilms on inert surfaces: Involvement of a new ompR allele that increases curli expression. J. Bacteriol. 1998, 180, 2442–2449. [Google Scholar] [PubMed]
  47. Pomposiello, P.J.; Bennik, M.H.J.; Demple, B. Genome-wide transcriptional profiling of the Escherichia coli responses to superoxide stress and sodium salicylate. J. Bacteriol. 2001, 183, 3890–3902. [Google Scholar] [CrossRef] [PubMed]
  48. Zhang, X.S.; Garcia-Contreras, R.; Wood, T.K. YcfR (BhsA) influences Escherichia coli biofilm formation through stress response and surface hydrophobicity. J. Bacteriol. 2007, 189, 3051–3062. [Google Scholar] [CrossRef] [PubMed]
  49. Zhu, C.; Feng, S.; Thate, T.E.; Kaper, J.B.; Boedeker, E.C. Towards a vaccine for attaching/effacing Escherichia coli: A LEE encoded regulator (ler) mutant of rabbit enteropathogenic Escherichia coli is attenuated, immunogenic, and protects rabbits from lethal challenge with the wild-type virulent strain. Vaccine 2006, 24, 3845–3855. [Google Scholar] [CrossRef] [PubMed]
  50. Carey, C.M.; Kostrzynska, M.; Thompson, S. Escherichia coli O157:H7 stress and virulence gene expression on Romaine lettuce using comparative real-time PCR. J. Microbiol. Methods 2009, 77, 235–242. [Google Scholar] [CrossRef] [PubMed]
  51. Sharma, M.; Lakshman, S.; Ferguson, S.; Ingram, D.T.; Luo, Y.G.; Patel, J. Effect of modified atmosphere packaging on the persistence and expression of virulence factors of Escherichia coli O157:H7 on shredded iceberg lettuce. J. Food Prot. 2011, 74, 718–726. [Google Scholar] [CrossRef] [PubMed]
  52. Dinu, L.D.; Bach, S. Induction of viable but non-culturable Escherichia coli O157:H7 on the phyllosphere of lettuce: A food safety risk factor. Appl. Environ. Microbiol. 2011, 77, 8295–8302. [Google Scholar] [CrossRef] [PubMed]
  53. Wagner, P.L.; Livny, J.; Neely, M.N.; Acheson, D.W.; Friedman, D.I.; Waldor, M.K. Bacteriophage control of Shiga toxin 1 production and release by Escherichia coli. Mol. Microbiol. 2002, 44, 957–970. [Google Scholar] [CrossRef] [PubMed]
  54. Grau-Leal, F.; Quiros, P.; Martinez-Castillo, A.; Muniesa, M. Free Shiga toxin 1-encoding bacteriophages are less prevalent than Shiga toxin 2 phages in extraintestinal environments. Environ. Microbiol. 2015, 17, 4790–4801. [Google Scholar] [CrossRef] [PubMed]
  55. Noel, J.T.; Arrach, N.; Alagely, A.; McClelland, M.; Teplitski, M. Specific responses of Salmonella enterica to tomato varieties and fruit ripeness identified by in vivo expression technology. PLoS ONE 2010, 5, e12406. [Google Scholar] [CrossRef] [PubMed]
  56. Tseng, T.-T.; Gratwick, K.S.; Kollman, J.; Park, D.; Nies, D.H.; Goffeau, A.; Saier, M.H., Jr. The RND permease superfamily: An ancient, ubiquitous and diverse family that includes human disease and development proteins. J. Mol. Microbiol. Biotechnol. 1999, 1, 107–125. [Google Scholar] [PubMed]
  57. Van Dyk, T.K.; Templeton, L.J.; Cantera, K.A.; Sharpe, P.L.; Sariaslani, F.S. Characterization of the Escherichia coli AaeAB efflux pump: A metabolic relief valve? J. Bacteriol. 2004, 186, 7196–7204. [Google Scholar] [CrossRef] [PubMed]
  58. Kvist, M.; Hancock, V.; Klemm, P. Inactivation of efflux pumps abolishes bacterial biofilm formation. Appl. Environ. Microbiol. 2008, 74, 7376–7382. [Google Scholar] [CrossRef] [PubMed]
  59. Monnappa, A.K.; Lee, S.; Mitchell, R.J. Sensing of plant hydrolysate-related phenolics with an aaeXAB::luxCDABE bioreporter strain of Escherichia coli. Bioresour. Technol. 2013, 127, 429–434. [Google Scholar] [CrossRef] [PubMed]
  60. Kapitein, N.; Mogk, A. Deadly syringes: Type VI secretion system activities in pathogenicity and interbacterial competition. Curr. Opin. Microbiol. 2013, 16, 52–58. [Google Scholar] [CrossRef] [PubMed]
  61. Van der Linden, I.; Cottyn, B.; Uyttendaele, M.; Vlaemynck, G.; Heyndrickx, M.; Maes, M. Survival of enteric pathogens during butterhead lettuce growth: Crop stage, leaf age, and irrigation. Foodborne Pathog. Dis. 2013, 10, 485–491. [Google Scholar] [CrossRef] [PubMed] [Green Version]
  62. Rastogi, G.; Sbodio, A.; Tech, J.J.; Suslow, T.V.; Coaker, G.L.; Leveau, J.H.J. Leaf microbiota in an agroecosystem: Spatiotemporal variation in bacterial community composition on field-grown lettuce. ISME J. 2012, 6, 1812–1822. [Google Scholar] [CrossRef] [PubMed]
  63. Brandl, M.T.; Amundson, R. Leaf age as a risk factor in contamination of lettuce with Escherichia coli O157:H7 and Salmonella enterica. Appl. Environ. Microbiol. 2008, 74, 2298–2306. [Google Scholar] [CrossRef] [PubMed]
  64. Takeuchi, K.; Frank, J.F. Penetration of Escherichia coli O157:H7 into lettuce tissues as affected by inoculum size and temperature and the effect of chlorine treatment on cell viability. J. Food Prot. 2000, 63, 434–440. [Google Scholar] [PubMed]
  65. Iturriaga, M.H.; Escartin, E.F.; Beuchat, L.R.; Martinez-Peniche, R. Effect of inoculum size, relative humidity, storage temperature, and ripening stage on the attachment of Salmonella Montevideo to tomatoes and tomatillos. J. Food Prot. 2003, 66, 1756–1761. [Google Scholar] [PubMed]
  66. Schikora, A.; Garcia, A.V.; Hirt, H. Plants as alternative hosts for Salmonella. Trends Plant Sci. 2012, 17, 245–249. [Google Scholar] [CrossRef] [PubMed]
  67. Schikora, A.; Garcia, A.V.; Charrier, A.; Hirt, H. Infection of plants by the human pathogen Salmonella Typhimurium: Challenges and new insights. Biocommun. Plants 2012, 14, 349–360. [Google Scholar]
  68. Schikora, A.; Carreri, A.; Charpentier, E.; Hirt, H. The dark side of the salad: Salmonella typhimurium overcomes the innate immune response of Arabidopsis thaliana and shows an endopathogenic lifestyle. PLoS ONE 2008, 3, e2279. [Google Scholar] [CrossRef] [PubMed]
  69. Shirron, N.; Yaron, S. Active suppression of early immune response in tobacco by the human pathogen Salmonella Typhimurium. PLoS ONE 2011, 6, e18855. [Google Scholar] [CrossRef] [PubMed]
  70. Seo, S.; Matthews, K.R. Influence of the plant defense response to Escherichia coli O157:H7 cell surface structures on survival of that enteric pathogen on plant surfaces. Appl. Environ. Microbiol. 2012, 78, 5882–5889. [Google Scholar] [CrossRef] [PubMed]
  71. Oliveira, M.; Usall, J.; Solsona, C.; Alegre, I.; Viñas, I.; Abadias, M. Effects of packaging type and storage temperature on the growth of foodborne pathogens on shredded ‘Romaine’ lettuce. Food Microbiol. 2010, 27, 375–380. [Google Scholar] [CrossRef] [PubMed]

