1. Introduction
Photosynthesis is the key process that drives plant life on earth. The understanding of the biophysical processes that affect plants photosynthesis has stimulated generations of scientists and is important to improve agricultural production to support the expanding needs of the growing human population. Photosynthetic processes are driven by both internal and external factors [
1] in which the cellular and leaf-level processes have been extensively studied under laboratory conditions. However, measuring photosynthetic performance at the stand or ecosystem level is challenging and has thus far only been measured by bulk exchange processes derived from eddy-covariance methods [
2] or remote sensing observations [
3].
Within the last few decades, chlorophyll fluorescence has become an important tool for measuring photosynthetic performance at different ecosystem levels. On the leaf level, the pulse-amplitude-modulation (PAM) approach [
4] has proven to be an important tool to measure photosynthesis in an active manner, whereas on the canopy level, sun-induced fluorescence (SIF) provides a way to assess photosynthetic processes passively over vast areas [
5,
6]. Remote sensing active fluorometers, such as LIFT, are establishing a link between the active measurements taken in the lab and the passive measurements obtained in the ecosystem. For non-invasive plant phenotyping, Fiorani and Schurr [
7] concluded that the active measurement of the photosynthetic status is an important approach to provide “quantitative analyses of plant structure and function relevant for traits that help plants better adapt to low-input agriculture and resource-limited environments.”
The LIFT instrument is capable of remote sensing photosynthetic efficiency from a distance up to 50 m. While the PAM approach uses saturating pulses to close the photosystem II reaction centers and induce a maximum fluorescence emission, the LIFT approach uses sub-saturating pulses, which are applied with different duty cycles, resulting in a fluorescence transient that is fitted with a model to extrapolate the maximum fluorescence [
8,
9]. The LIFT approach compares well with gas exchange and PAM measurements [
10] and was used to study photosynthetic response under a range of different environmental scenarios in inaccessible canopies [
9,
10,
11,
12].
In this study, the LIFT method was used to measure the photosynthetic performance of an agricultural ecosystem. We investigated different cultivars of Hordeum vulgare and Beta vulgaris subs. vulgaris over a period of two years. In addition, ground-based fluorescence was measured on selected leaves with commercial fluorometers.
2. Results
The photosynthetic light-use efficiency was measured on four cultivars of barley and sugar beet with Monitoring-PAM (cf. [
13]) and by the LIFT instrument, which was placed on a tower next to the plots (
Figure 1). Exemplary measurements from both devices on one day in sugar beet are shown in
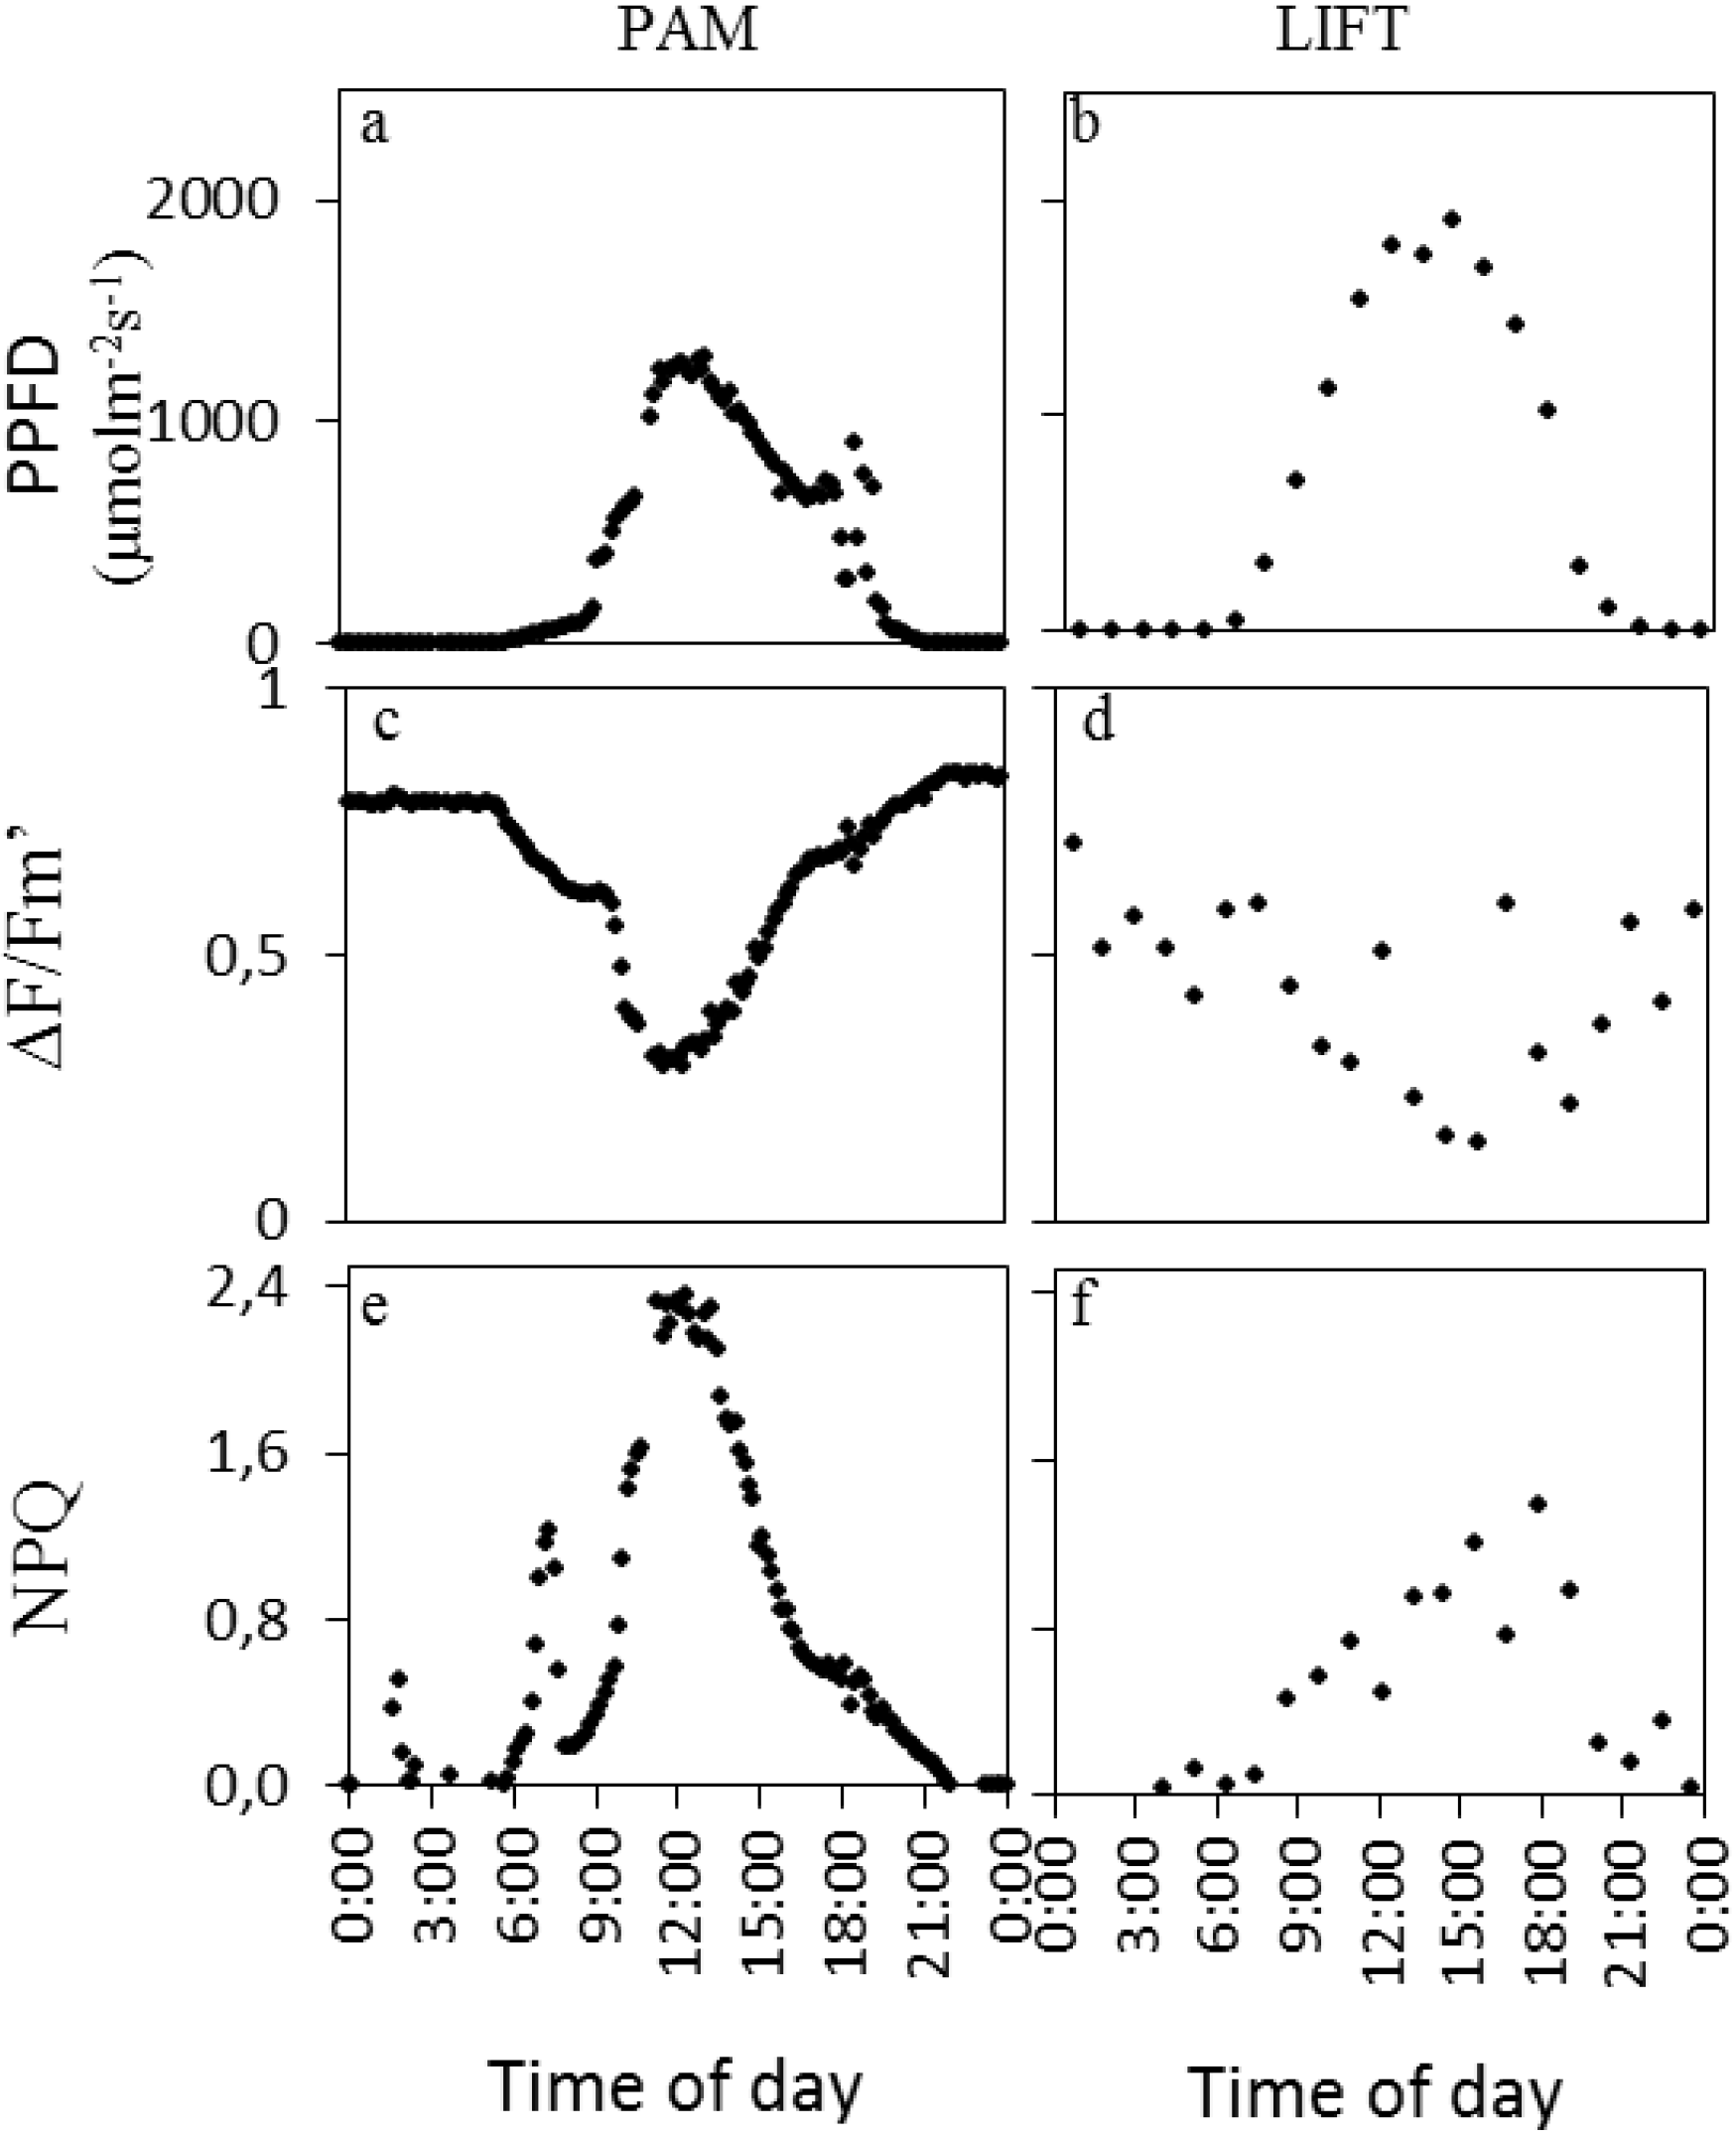
Figure 2. A clear sunny day was chosen with peak PPFD (photosynthetic photon flux density) around noon (
Figure 2a,b) and ∆F/Fm′ responding opposite to the PPFD diurnal pattern (
Figure 2c,d). NPQ (non-photochemical quenching) in this particular example had an initial small peak, presumably in response to the first sunlight, followed by another peak with highest values at midday for PAM (
Figure 2e). For LIFT, however, NPQ had a broader peak with more variation during high light intensities (
Figure 2f).
The diurnal patterns for barley and sugar beet cultivars were shown by smoothed curves of the mean of hourly averages of selected days (
Figure 3), whereas all data, after removal of unreliable data points (see experimental section), were used for statistical analysis (
Table 1). In sugar beet, the PPFD diurnal course was similar for both instruments but with lower absolute values measured by the light sensors mounted on the Monitoring-PAM compared to the light sensors of the weather station (
Figure 3a,b). This was probably due to the different types of sensors, accumulation of dirt on the white reflective panel over time, which is used to reflect the light into the light sensor of the Monitoring-PAM and the differences in the light regimes measured either on crop or on tropospheric level.
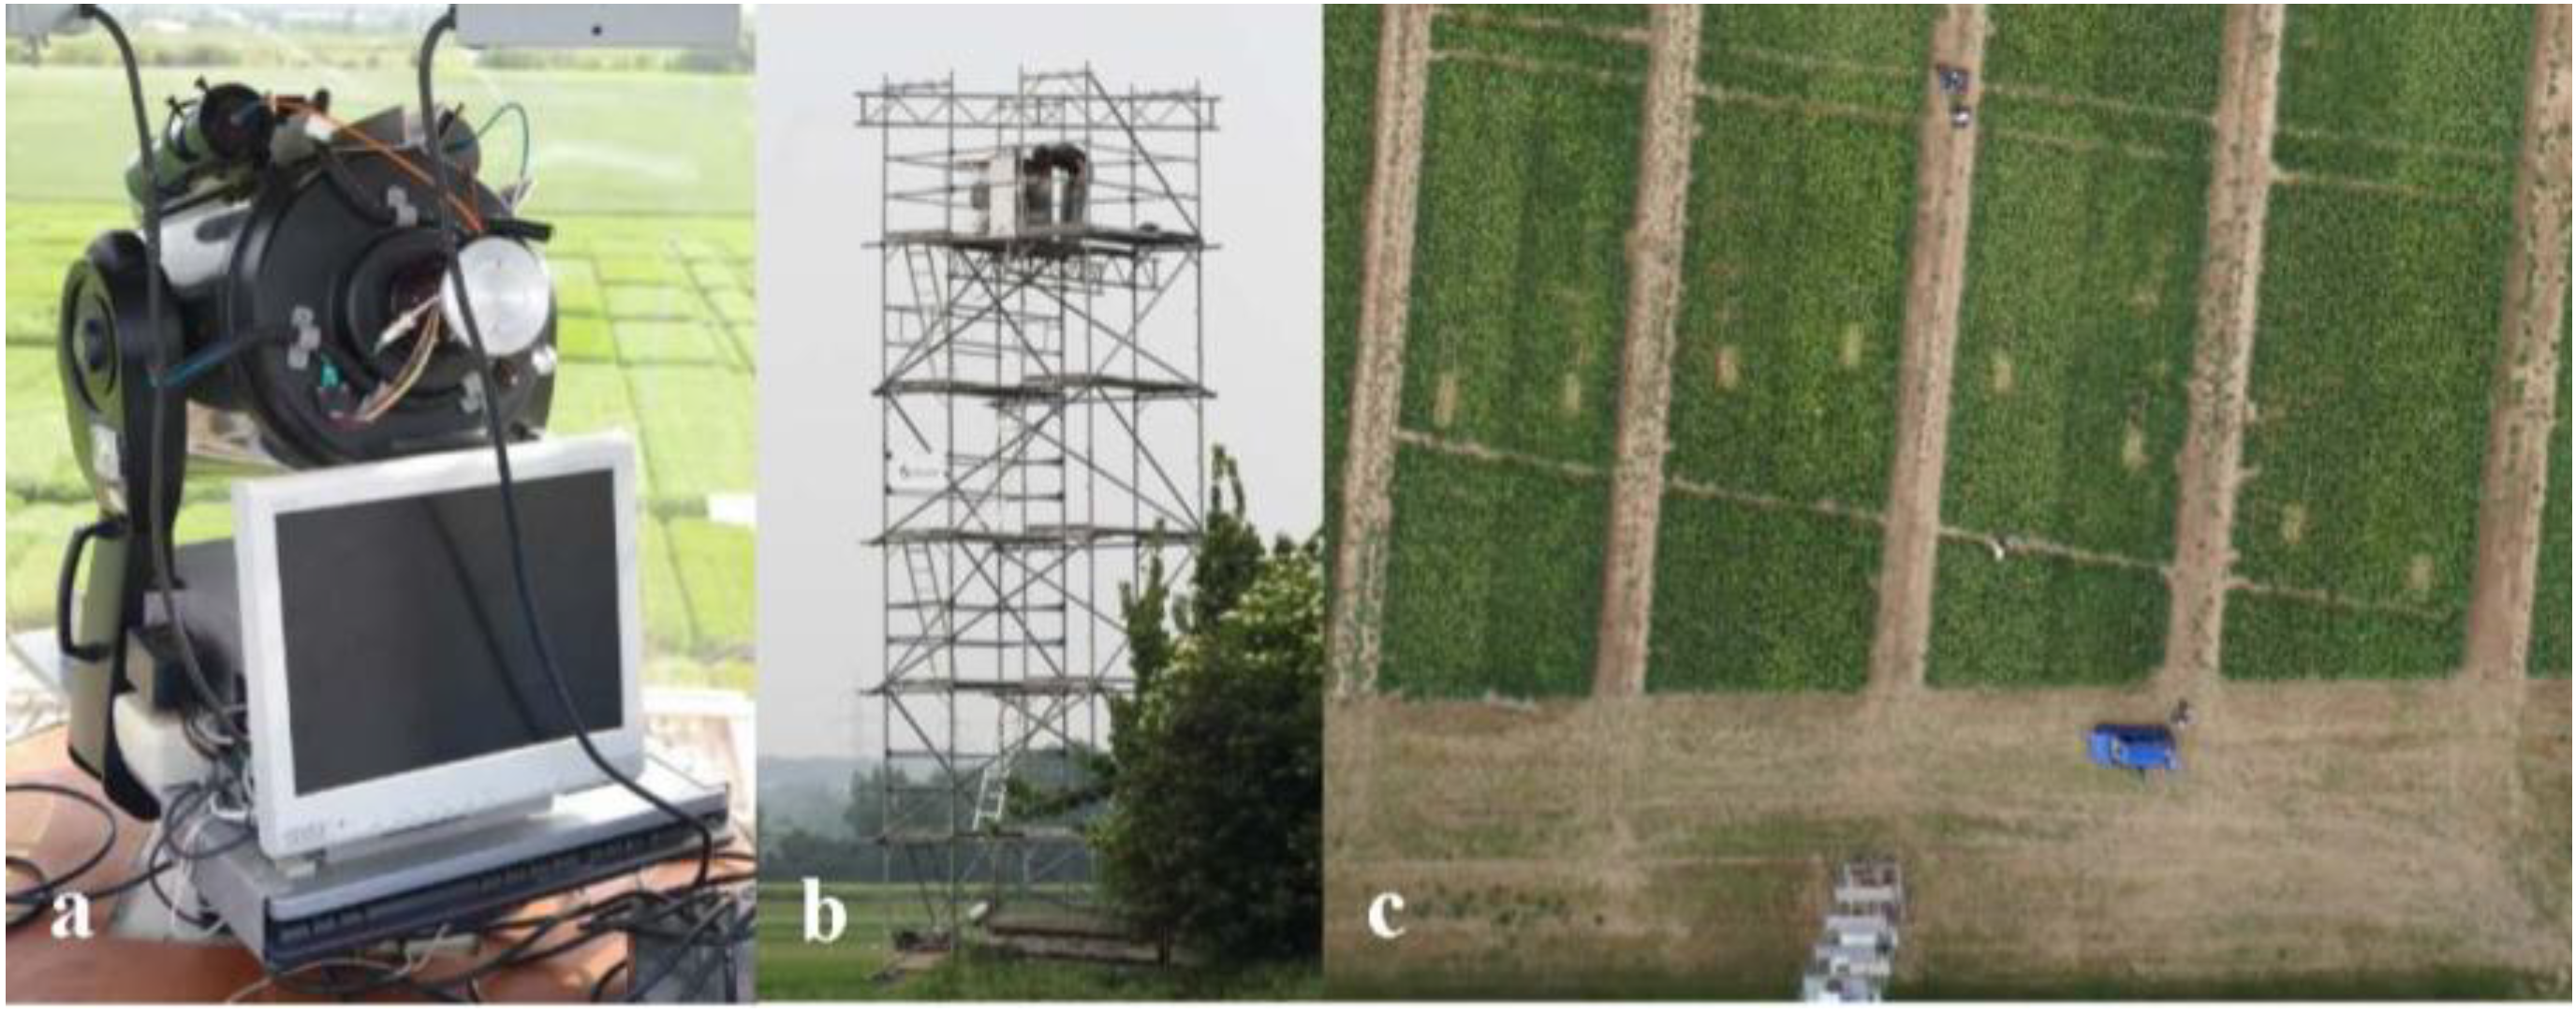
Figure 1.
The LIFT (laser-induced fluorescence transient) instrument (a) placed on top of a 10-meter-high scaffolding tower (b) located north of agricultural fields with barley (a, b) and sugar beet (c) in Campus Klein-Altendorf. The LIFT instrument is placed on a motorized table for automatized shift of targets; a pulsing laser induces a fluorescence transient in the photosynthetic tissue, which is then collected by the telescope and detected by the photodiode. The typical bow the LIFT laser describes while moving between the targets is seen in patches where sugar beets were removed for additional measurements (c). In the sugar beet field, eight plots—planted with the four cultivars Pauletta, Berenika, Maurica, Cesira from left to right—were measured with low nitrogen supply and then high nitrogen supply.
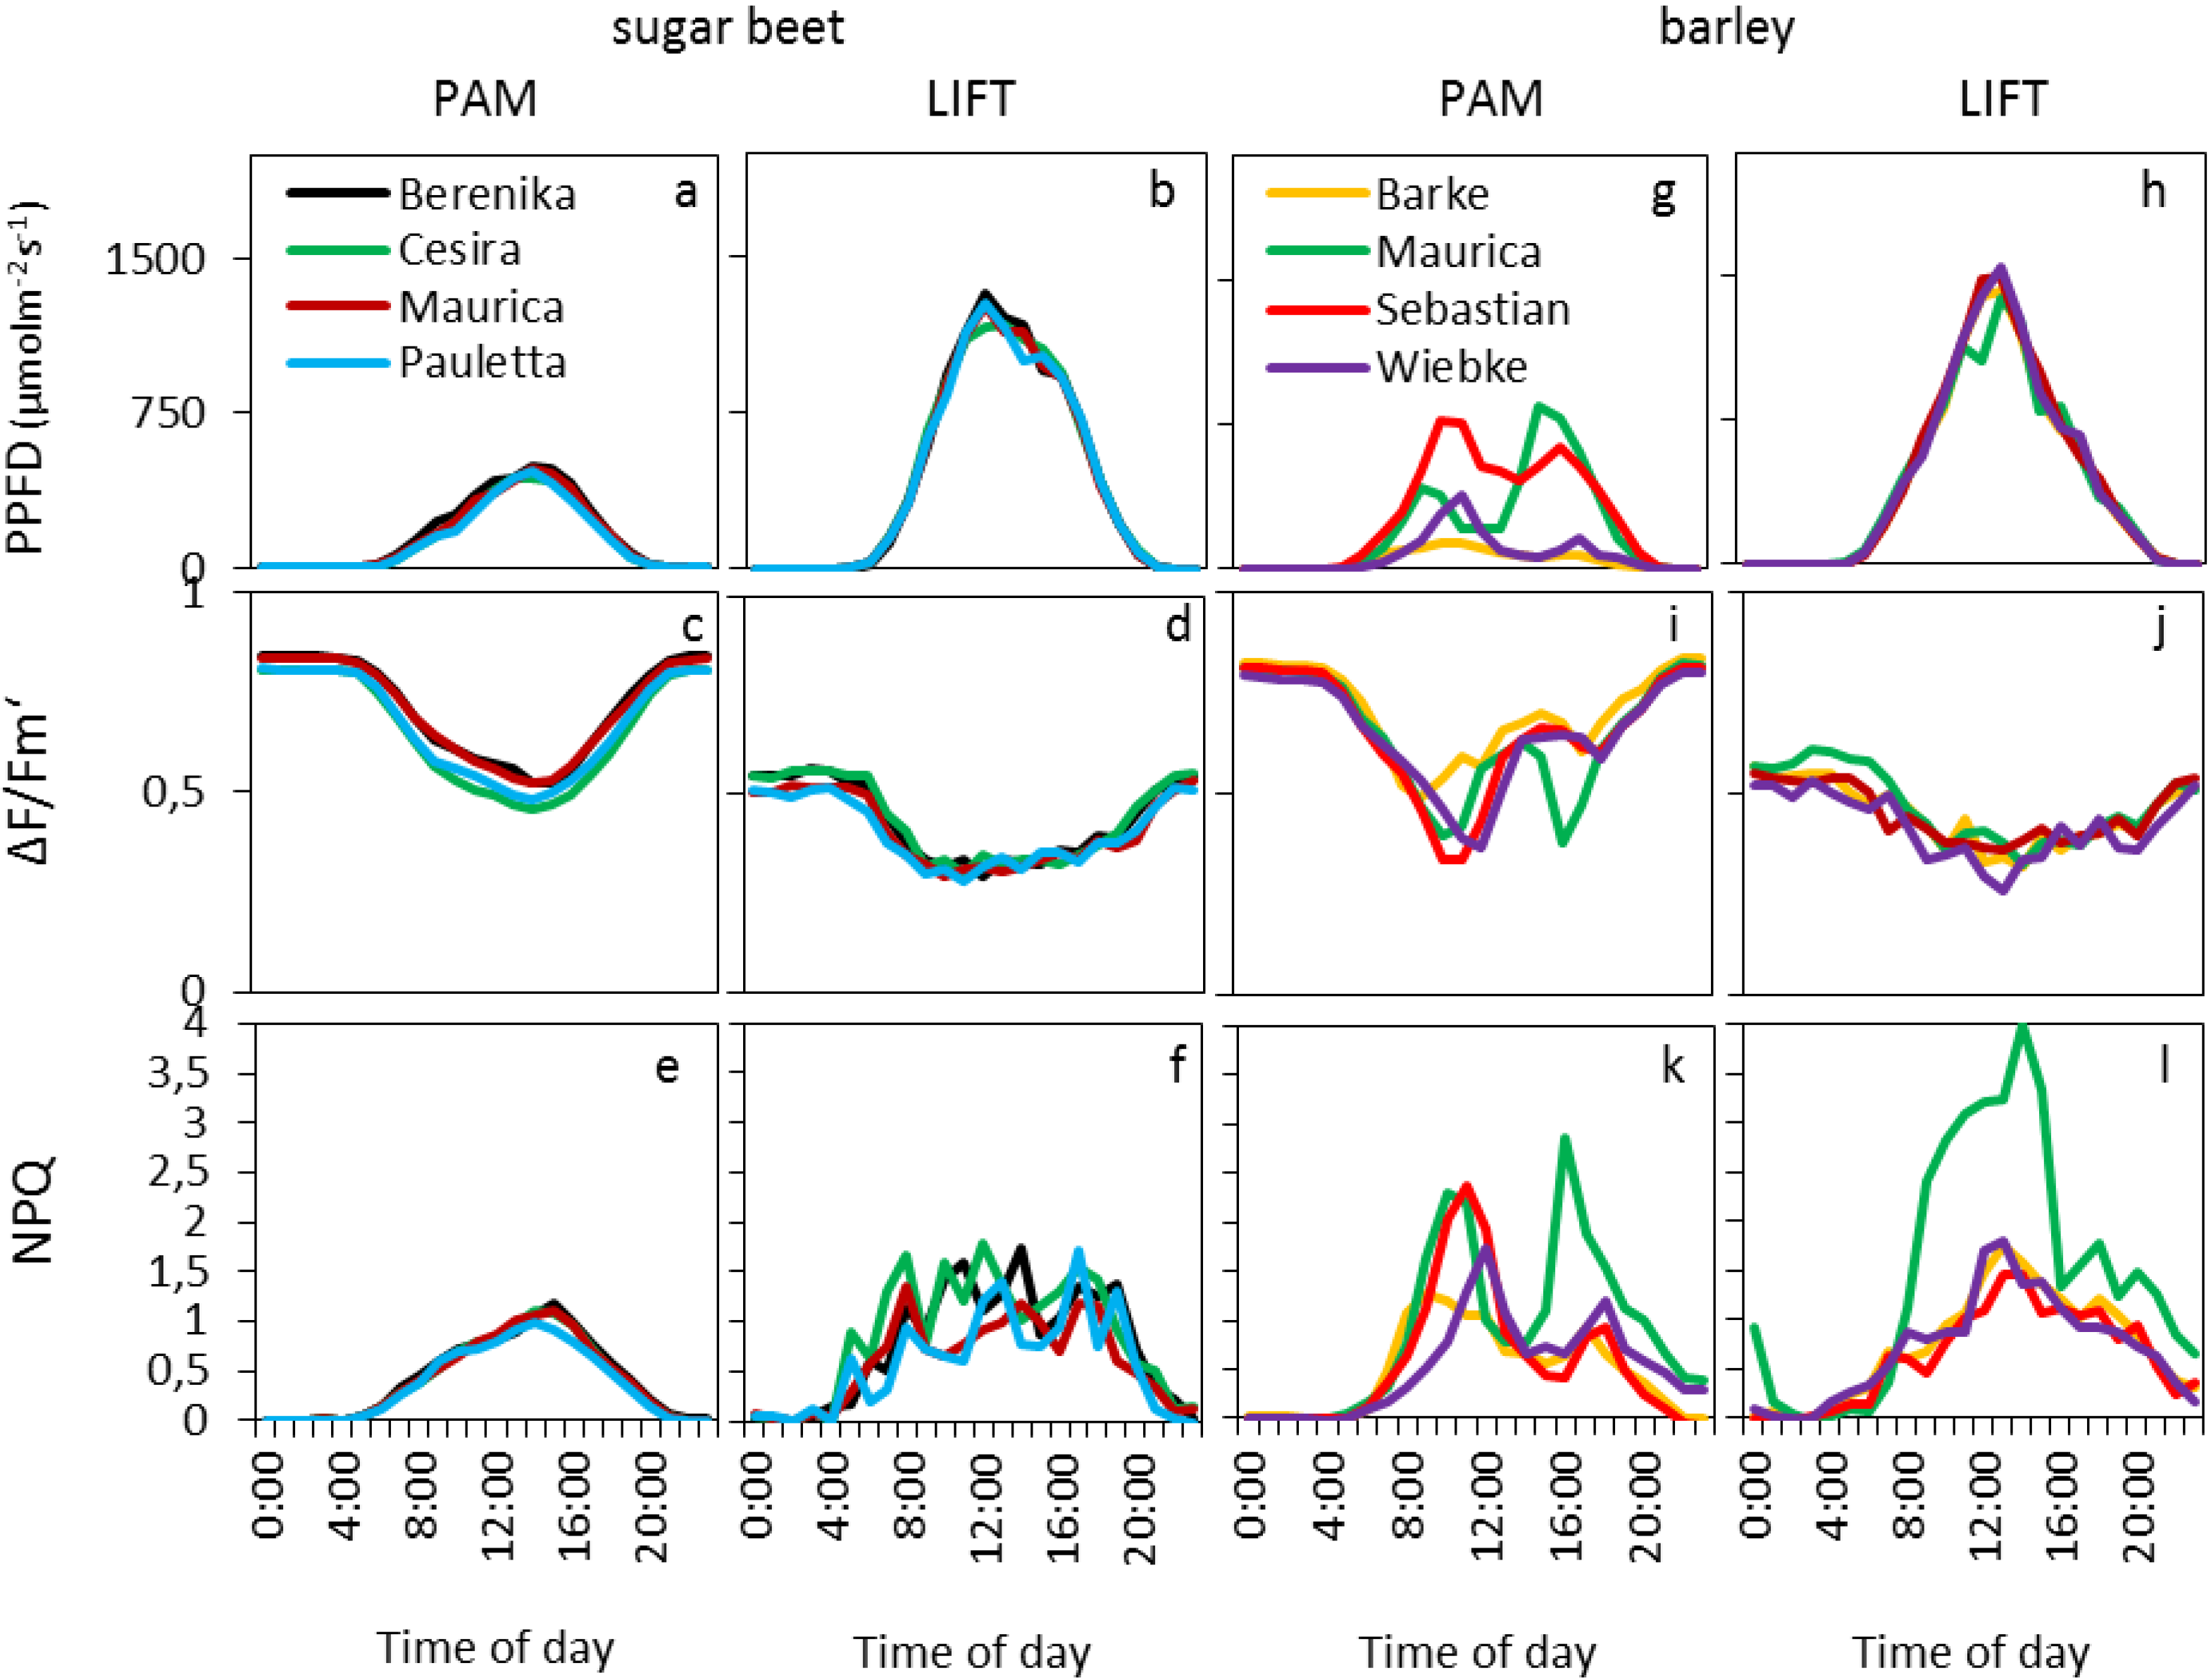
Figure 2.
PPFD (photosynthetic photon flux density) and fluorescence parameters of one single day (2 August, 2011) measured by PAM (pulse-amplitude modulation) (left column) and LIFT (right column) on sugar beet. The sugar beet cultivar Berenika was grown in an agricultural field in Klein-Altendorf and fertilized with 150 kg N ha−1. PPFD was measured by the light sensor on the PAM fluorometer (a) and taken from a meteorological station next to the field for LIFT (b). Measurement intervals were every 10 min for PAM and every 68 min for LIFT. Fluorescence parameters were derived as described in the methods.
Figure 3.
Daily average course of PPFD and fluorescence parameters measured by PAM and LIFT for four cultivars of sugar beet (a–f) and barley (g–l) in the agricultural fields of Campus Klein-Altendorf during the vegetation period of 2011 and 2012. The PPFD was obtained from PAR (photosynthetically active radiation) sensors attached to the Monitoring-PAM (a, g) or extrapolated from a nearby PAR sensor at a meteorological station (b, h). All diagrams in one column were computed based on the same days, and the data was averaged per hour (nPAM = 89; nLIFT = 39).
Table 1.
Main effects and interactions of the factors cultivar (C), date (D), and PPFD (P) in barley and sugar beet on the observed fluorescence parameters in the observed years, analyzed separately for instrument by the use of a three-factor MANOVA (multivariate analysis of variance). Red boxes represent a significant effect (p < 0.05), black boxes an insignificant effect (p ≥ 0.05).
| | Barley | Sugar Beet | Sugar Beet |
|---|
| 2012 | 2011 | 2012 |
|---|
| PAM | LIFT | PAM | LIFT | PAM | LIFT |
|---|
| ΔF/m′ | NPQ | ΔF/Fm′ | NPQ | ΔF/Fm′ | NPQ | ΔF/Fm′ | NPQ | ΔF/Fm′ | NPQ | ΔF/Fm′ | NPQ |
|---|
| Cultivar (C) | | | | | | | | | | | | |
| Day (D) | | | | | | | | | | | | |
| PPFD (P) | | | | | | | | | | | | |
| D × C | | | | | | | | | | | | |
| D × P | | | | | | | | | | | | |
| C × P | | | | | | | | | | | | |
| C × D × P | | | | | | | | | | | | |
The photosynthetic efficiency (ΔF/Fm′) in the dark showed typical values, around 0.8, for PAM, whereas LIFT method returned in the dark to values around 0.58. Small differences were found between the different cultivars (
Table 1,
Figure 3c,d) but were not consistent between the two instruments and between the years for the LIFT method. Diurnal ΔF/Fm′ patterns showed the typical decrease with the onset of light and increase at sunset. The minimum for the LIFT-measured ΔF/Fm′ was much broader, however, than for PAM (
Figure 3c,d). The largest difference between the diurnal patterns of the two instruments in sugar beet were found in the NPQ that followed the diurnal changes in light for PAM (
Figure 3e), whereas the LIFT-measured NPQ varied strongly during the day (
Figure 3f). The different parameters N supply, cultivar, day, and PPFD had significant effects on most fluorescence parameters during the two growing seasons when measured by PAM; however, these parameters appeared to affect LIFT-based fluorescence to a lesser extent, and they differed between the two growing seasons (
Table 1). In barley, the parameters day, light, and cultivar significantly affected fluorescence parameters measured by either the PAM or LIFT methods (
Table 1). The diurnal patterns of PPFD measured by the PAM method varied strongly between the different cultivars (
Figure 3g) as compared with the clear diurnal PPFD patterns for LIFT references that were measured by the weather station (
Figure 3h). ΔF/F
m′ and NPQ followed the diurnal patterns of PPFD, which determined the differences between cultivars in PAM (
Table 1). As in sugar beet, the dark-adapted ΔF/F
m′ values of the barley cultivars were similarly different between the instruments (
Figure 4c,d): about 0.8 (PAM) and 0.58 (LIFT). However, ΔF/F
m′ showed similar minimum values (about 0.35) between the two instruments (
Figure 3i,j). The difference between cultivars was expressed most in NPQ, where the cultivar Maurica appeared to have higher NPQ than the other cultivars when measured by the LIFT method during the day and also when measured by Monitoring-PAM at the end of the day (
Figure 3k,l).
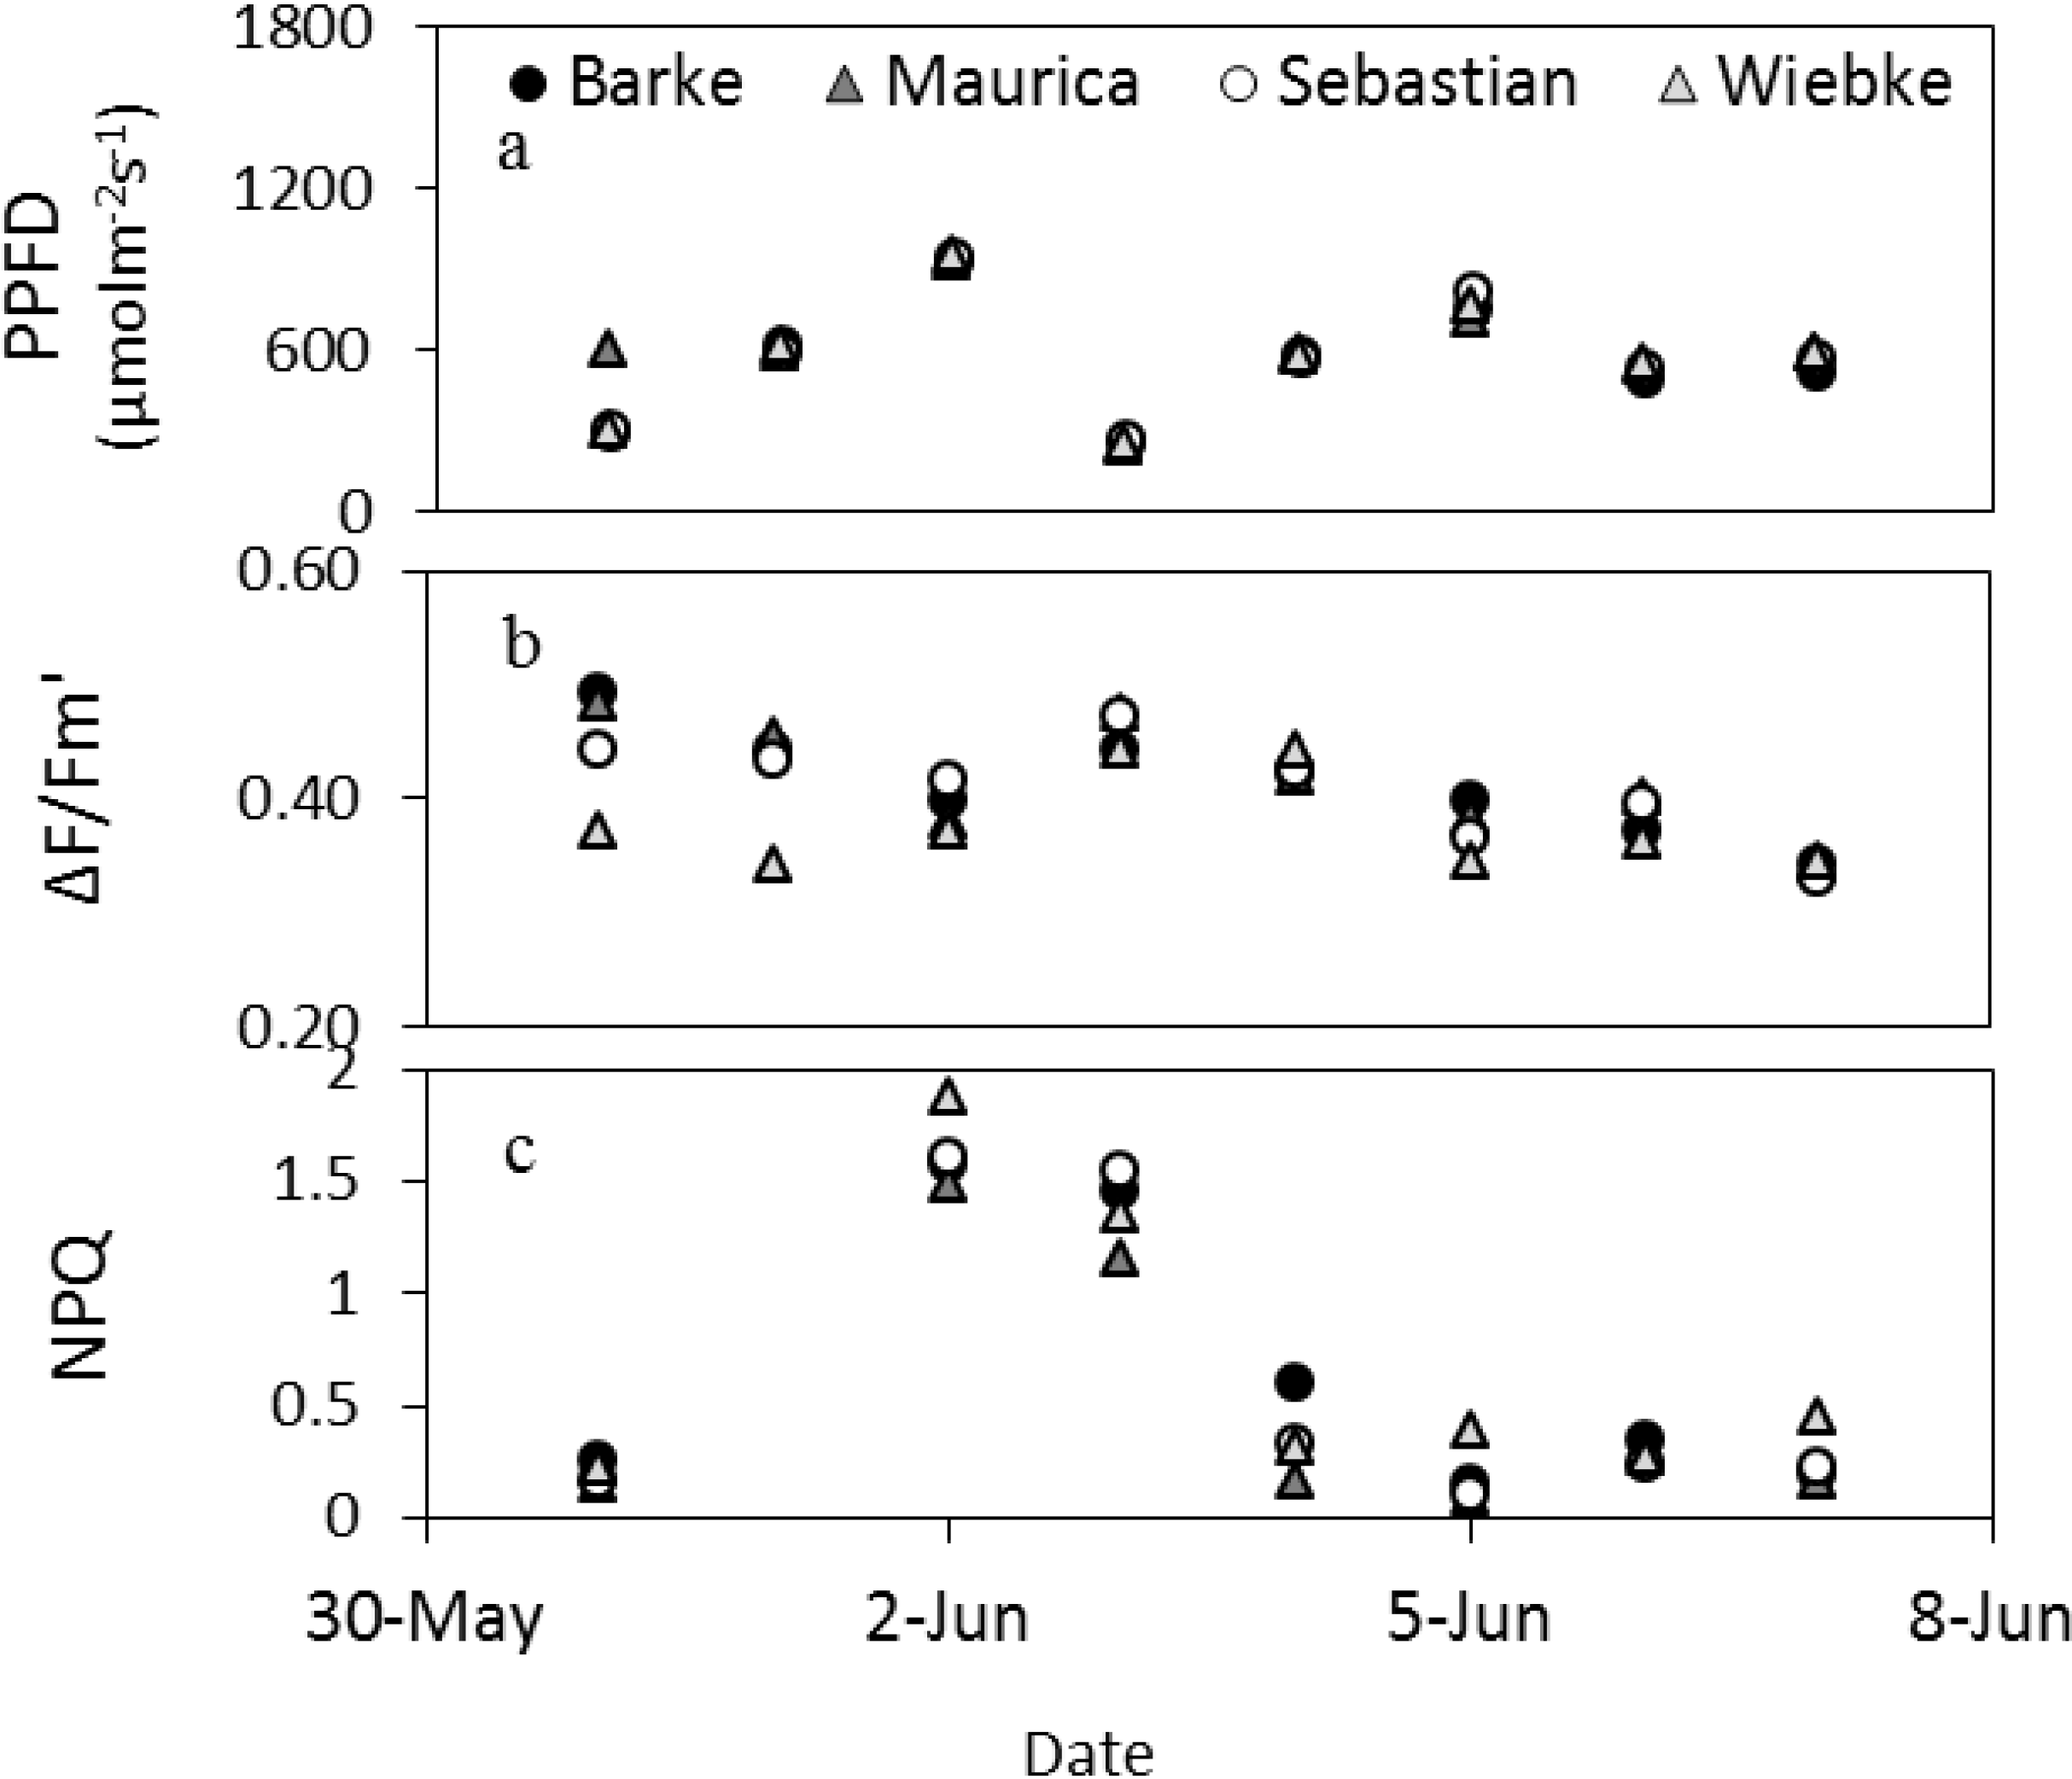
Figure 4.
Dynamics of the daytime averages (without night values) of fluorescence parameters and PPFD of the barley cultivars measured by the LIFT method at the meteorological station in Campus Klein-Altendorf in beginning of June 2012.
Figure 4.
Dynamics of the daytime averages (without night values) of fluorescence parameters and PPFD of the barley cultivars measured by the LIFT method at the meteorological station in Campus Klein-Altendorf in beginning of June 2012.
Changes in fluorescence parameters over the days were minimal and non-coherent in sugar beet [
14]
Figure 4 shows the changes in fluorescence parameters for barley in early summer measured by the LIFT instrument (
Figure 4). From May 31 to June 2, the maximum PPFD within a day increased steeply to drop to low values on June 3 and increase similarly again over three days before dropping slightly in the following days. This pattern was copied by ΔF/Fm′ for most cultivars, except Wiebke, which appeared less responsive to the first three days of changes in PPFD shown here. The increase in PPFD of the first three days resulted in a high NPQ that did not diminish the following day when PPFD dropped. NPQ remained low thereafter also when PPFD increased to similar heights again on June 6, which suggests that not only PPFD differed over this reported period (
Figure 4).
3. Discussion
In this study, the LIFT instrument was used for the first time in an agricultural setting to monitor photosynthetic efficiency and protection for barley and sugar beet from a distance of 50 m (
Figure 1,
Figure 2,
Figure 3 and
Figure 4). The diurnal changes in photosynthetic efficiency (ΔF/F
m′) and photoprotection (NPQ) confirmed the results of previous studies that showed that NPQ and the inverse of ΔF/F
m′ follow the diurnal changes in PPFD [
10,
11]. Interestingly, statistical analysis revealed differences between cultivars and N treatment in fluorescence parameters for sugar beet (
Table 1) and also between cultivars for barley (
Table 1). However, when we compared the average diurnal fluorescence curves, consistent differences that we observed were minimal (
Figure 3), and no consistent patterns were found over the individual days for differences between cultivars [
14]. The only exception is NPQ in barley, where one variety showed higher values than the others during the day but without a decrease in ΔF/Fm′, suggesting an efficient photoprotection mechanism (e.g., [
15]). Besides diurnal changes in fluorescence, differences between days, expressed as daily average fluorescence values, were significant for barley, and clearly photosynthetic efficiency was also following PPFD between days (
Figure 4). These results show the potential for the LIFT method to determine fluorescence parameters remotely and characterize cultivars in the agricultural field.
Measurements on barley and sugar beet were done at a similar spot and time for both the PAM and LIFT methods (
Figure 2 and
Figure 3). In a previous study, through direct comparison of both instruments, an empirical correction factor applied on LIFT data resulted in values to those of PAM for the species studied [
10]. However in this study, after applying the correction factor, ΔF/F
m′ was lower for LIFT than PAM in both sugar beet and barley (
Figure 2 and
Figure 3). Between sunrise and sunset, LIFT-derived ΔF/F
m′ in sugar beet was lower than PAM (
Figure 3c,d), whereas the values were similar in barley (
Figure 3i,j). We assume that different canopy structure, resulting in different optical properties, may cause these differences. In the diurnal patterns of LIFT, a depression of ΔF/F
m′ at solar noon was detected by both PAM and LIFT methods but had been reached earlier and maintained longer in LIFT data (
Figure 2 and
Figure 3) as was also observed for other species [
9,
10]. Additionally, NPQ was more variable over the day when measured by the LIFT method as compared to PAM in sugar beet (
Figure 3). However, in barley the PAM-measured NPQ (
Figure 3k) appeared more variable than the LIFT-measured NPQ (
Figure 3l), but this could be directly related to the difference in PPFD at leaf level (
Figure 3g). The leaf-level PAM measurements as compared with the canopy-level LIFT measurements might be a factor influencing the differences in diurnal patterns and absolute values as discussed further below.
Another factor influencing the variation between LIFT and PAM fluorescence measurements may be the differences in the measurement angle. For PAM, the monitoring spot is fixed by a leaf clip on the leaf to ascertain a constant distance and angle of observation [
13]. Besides the obvious advantages, the drawback of this installation in natural vegetation is that the individual leaf is not a good representative of the photosynthetic potential of the whole plant due to fluctuations in the light environment at leaf level that may have a larger influence than the difference between cultivars or nitrogen treatments. Especially in dense vegetations, like in most agricultural fields, target leaves are rapidly shaded after the installation of the instrument by other leaves resulting in varying light conditions at the measurement spot, which was also observed in our study for barley (
Figure 3g). In sugar beet, however, the rosette shape of the leaves enabled the Monitoring-PAM to be placed on leaves that are less likely to be shaded and differ between cultivars (
Figure 3a). The measuring spot of the LIFT instrument, however, is 10 cm in diameter and thus considerably larger than the PAM measuring spot, which results in an integration into the signal of not only the top layers of leaves but also the leaves within the canopy. In vegetation with relatively small leaves, such as barley, typically lower ΔF/Fm′ values are measured by the remote LIFT instrument than in vegetation with larger leaves [
16], with similar scatterings during day and night such as in a grass community [
10,
17]. However, in large leaves—for example, cottonwood [
11]—ΔF/Fm′ is higher than the leaves of sugar beet [
16] that generally have a much larger leaf area. In cottonwood, the measuring spot was close to perpendicular and centered on a leaf whereas in sugar beet the measuring angle from the tower, angle of leaves in rosette plants, and additionally the rough leaf surface might have resulted in a greater reduction of the ΔF/Fm′ signal than expected from leaf area alone. Thus, the measuring spot size in relation to leaf size should be taken into account when comparing fluorescence measurements.
Variations of the LIFT data occurred even after a large part of data was removed by using correction algorithms (
Table 2 and
Table 3). LIFT measurements during the day are sensitive to high background radiation, which introduces noise [
9]. Additionally, the geometry of solar illumination relative to the detector viewing angles may induce further noise [
18], and the light beam of the LIFT instrument may also hit soil when leaves are moving in the wind. However, these challenges typically occur in field measurements, and as suggested by Nichol
et al. [
19], “the ‘fuzzy’ interrogation of a large number of outer canopy targets by raster-LIFT … might in the end provide useful alternatives to simple spot measurements on individual leaves using … PAM.”
Table 2.
Share of LIFT data eliminated by mathematical based (1), chi-square-based (2), and biological-based (3) correction algorithms.
Table 2.
Share of LIFT data eliminated by mathematical based (1), chi-square-based (2), and biological-based (3) correction algorithms.
| Step | Barley 2012 | Sugar Beet 2011 | Sugar Beet 2012 |
|---|
| (1) | 1.7% | 5.6% | 6.5% |
| (2) | - | 20.7% | 26.6% |
| (3) | - | 10.5% | 28.3% |
Table 3.
Share of PAM data eliminated by PAM internal correction.
Table 3.
Share of PAM data eliminated by PAM internal correction.
| Barley 2012 | Sugar Beet 2011 | Sugar Beet 2012 |
|---|
| - | 8.20% | 11.60% |
4. Experimental Section
Two crop species, Hordeum vulgare (barley) and Beta vulgaris (sugar beet), were grown in the agricultural field of Campus Klein-Altendorf (50.628122, 6.98885) of the University of Bonn, Germany. Experiments were done for sugar beet between July and September 2011 and between June and October 2012, and for barley between May and June 2012. Sugar beet was grown in eight 7 × 20 m plots that contained each one of the four cultivars Berenika, Cesira, Mauricia, and Pauletta fertilized with either 80 kg N ha−1 or with 150 kg N ha−1. Barley was grown in four 3 × 7 plots that contained each one of the four cultivars Barke, Maurita, Sebastian, and Wiebke fertilized according to the good farming practice of Campus Klein-Altendorf.
Photosynthetic efficiency and protection were measured by chlorophyll fluorescence with four commercial Monitoring-PAM fluorometers (Heinz Walz GmbH, Effeltrich, Germany) and with one remotely measuring LIFT fluorometer. The LIFT instrument is a remote measuring fluorometer capable of active measurements up to a distance of 50 m [
6] (
Figure 1a–c). It uses sub-saturating flashes that continuously reduce the PS II reaction centers and induce a fluorescence transient that is numerically fitted to derive F′ and Fm′ as described in detail by [
6]. The actual quantum yield of photosystem II (PSII) (ΔF/F
m′) was calculated as (F
m′ − F′)/F
m′ and was corrected by the factor 1.628. This correction factor was examined empirically by Pieruschka
et al. through comparison with PAM fluorometer and gas exchange [
10]. NPQ was calculated as (F
m − F
m′)/F
m′, where F
m was obtained by averaging the F
m data measured between 2 AM and 4 AM of the preceding night. PPFD was measured by the sensors on the Monitoring-PAM and PPFD references for the LIFT measurements were obtained by the cosine-corrected PAR200 sensor of the nearby meteorological station and interpolated linearly to the time of the LIFT measurement. Measurements were repeated at 10-minute intervals for PAM and 30- to 68-minute intervals for LIFT. The Monitoring-PAMs were adjusted continuously to new top leaves as the vegetation grew and used simultaneously for four cultivars at one nitrogen treatment.
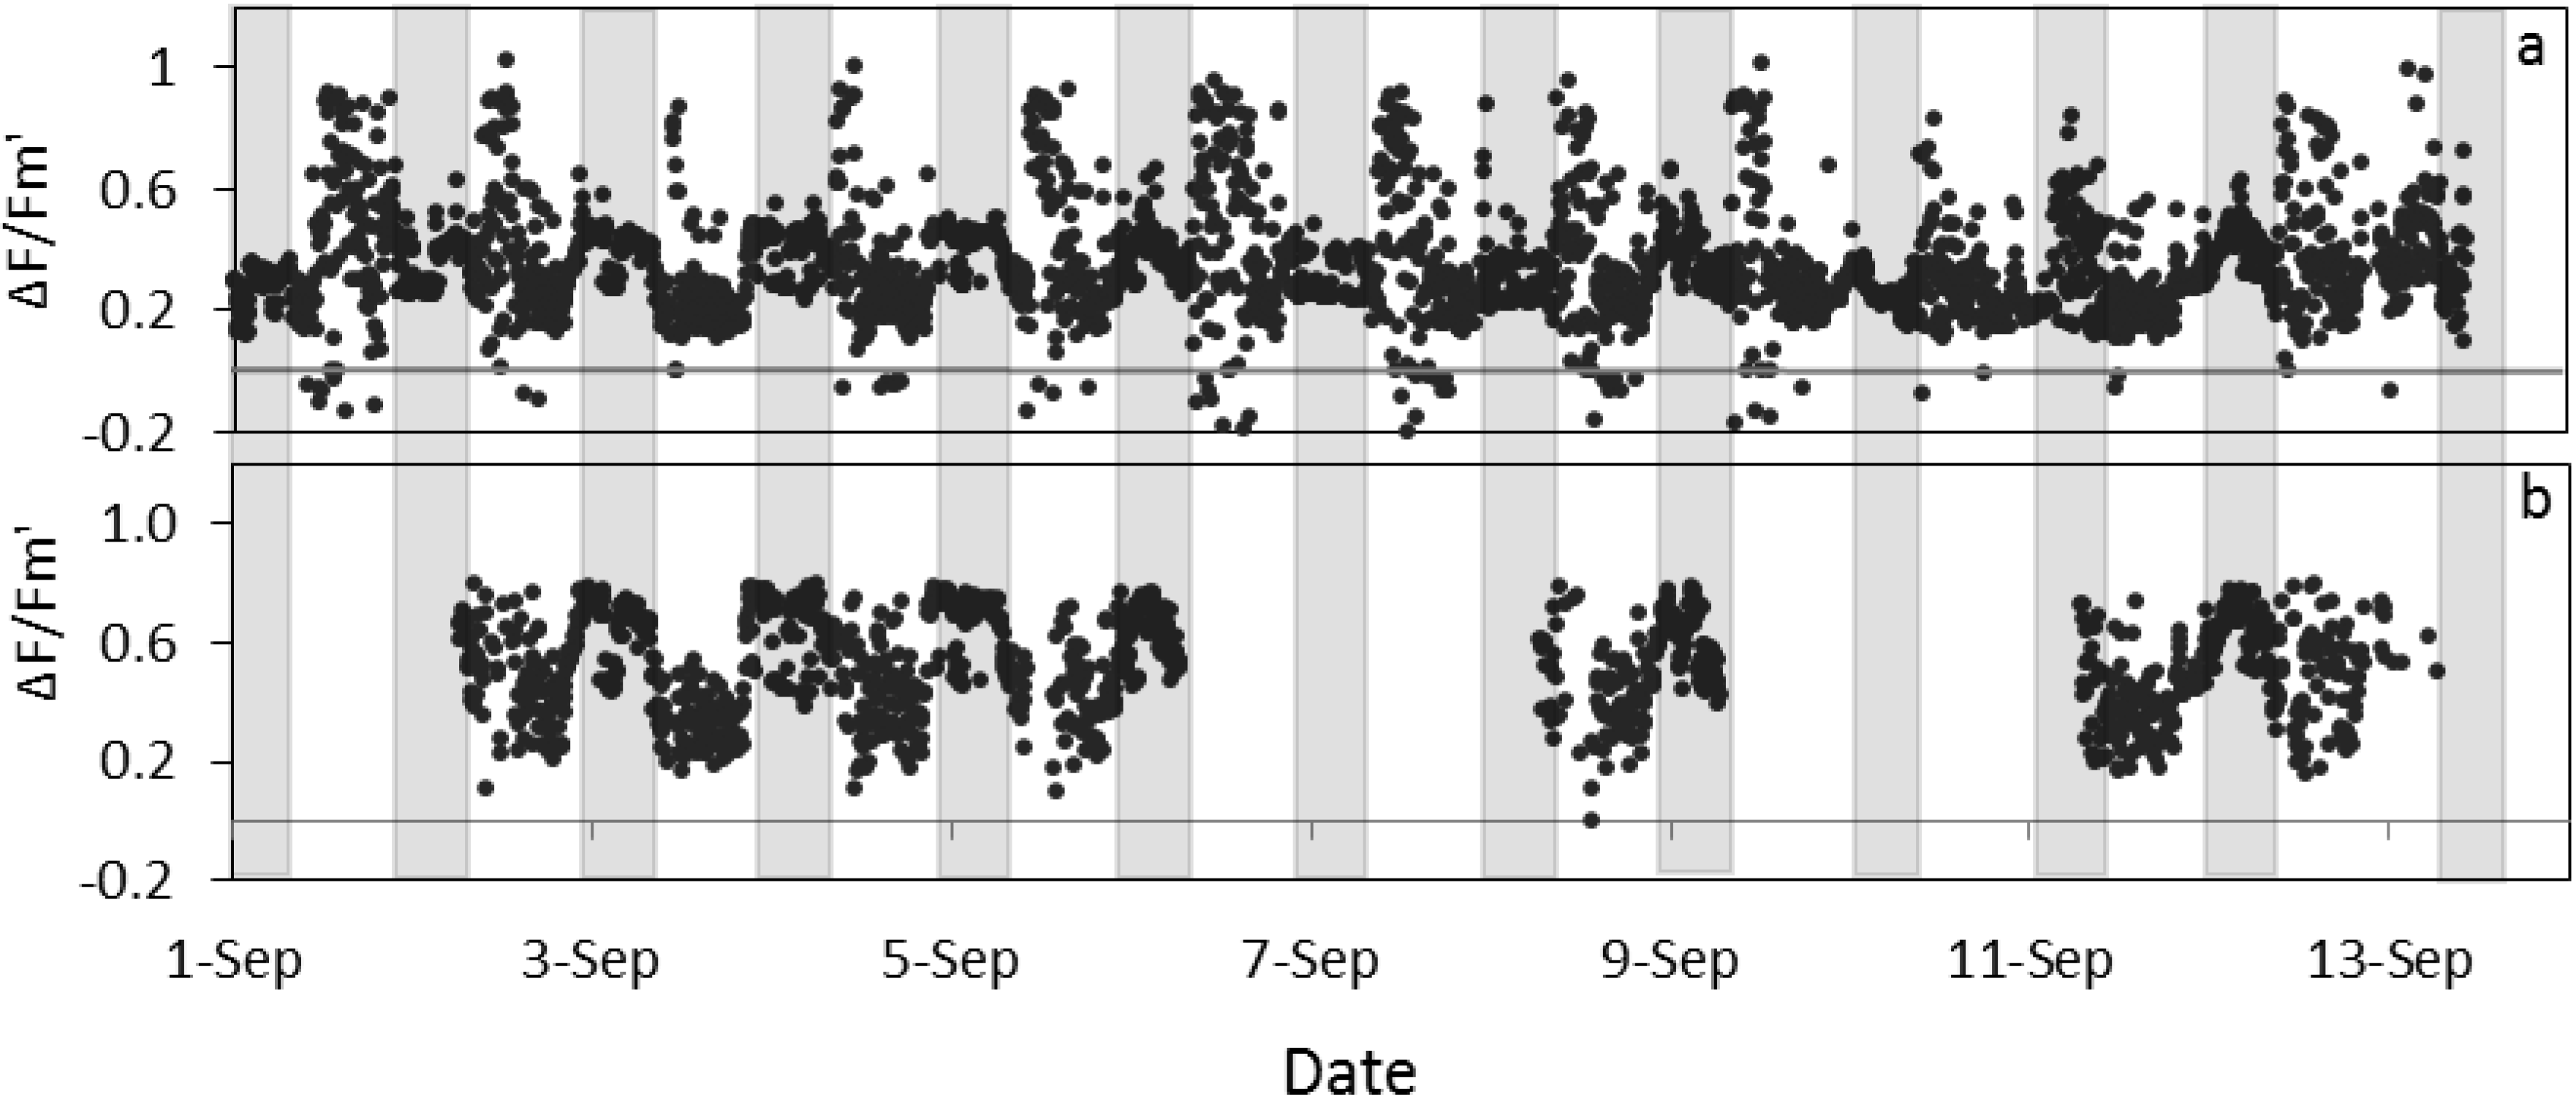
To increase the signal-to-noise ratio, the average of 50 transients was analyzed. Nevertheless, shifting of the leaves and subsequent targeting of non-photosynthetic tissues, high ambient background light, changing irradiation regimes while probing an area of interest, and technical issues resulted in unreliable data. To remove these data, the measurements were analyzed as follows. In step 1, ΔF/F
m′ data that was outside the mandatory range of 0–1 and F′ and F
m′ values smaller than zero were deleted. Step 2 the chi-square values (ChiSq) were used to define the quality of the fit of the fluorescence transients. ChiSq data were weighted by the irradiation regimes represented by Fm′, and it was shown that the logarithmic ChiSq/Fm’ ratio increased substantially beyond the 0.85 quantile; therefore, the upper 15% were removed [
14]. In step 3, ΔF/F
m′ data larger than 0.85 were assumed as incorrect and removed, and days that did not show more than a 15% difference between night (PPFD = 0) and day (PPFD > 0) ΔF/F
m′ were removed. The amount of data removed differed largely between steps and crops (
Table 2 and
Table 3). In a final step, after the correction procedures, we deleted daily data sets that lacked more than 50% of the achievable data volume of one day. Due to this rigorous correction procedure, few data remained for analysis (
Figure 5).
Figure 5.
Quantum yield of photosystem II estimated by fluorescence by LIFT on sugar beet in Klein-Altendorf before (a) and after (b) error elimination in September 2012 (see methods for details). Grey columns indicate night phases.
Figure 5.
Quantum yield of photosystem II estimated by fluorescence by LIFT on sugar beet in Klein-Altendorf before (a) and after (b) error elimination in September 2012 (see methods for details). Grey columns indicate night phases.
Statistical analysis was done by a MANOVA, which was conducted separately for the years, the species, and the instruments. Independent variables (factors) for the analysis of sugar beet were nitrogen supply level, cultivar, and for preventing bias also date and PPFD.


