
Balancing Acts: Unveiling the Dynamics of Revitalization Policies in China’s Old Revolutionary Areas of Gannan

1
School of Economics and Management, Jiangxi Agricultural University, Nanchang 330045, China
2
Jiangxi Research Center for Three Rural Issues, Nanchang 330045, China
*
Author to whom correspondence should be addressed.
Agriculture 2024, 14(3), 354; https://doi.org/10.3390/agriculture14030354
Submission received: 24 January 2024
/
Revised: 14 February 2024
/
Accepted: 21 February 2024
/
Published: 23 February 2024
(This article belongs to the Special Issue Agricultural Policies toward Sustainable Farm Development)
Abstract
:A series of revitalization policies (RPs) have been implemented in China’s Old Revolutionary Areas (ORAs). Evaluating the impact of these RPs is of paramount importance for refining policy design and achieving the goal of common prosperity. This study focuses on the ORAs in Gannan (ORAG) and employs the Propensity Score Matching Difference-in-Differences (PSM-DID) method to assess the effects of the RPs from two perspectives: stimulating economic growth and increasing farmers’ income, utilizing county-level data spanning from 2006 to 2019. The findings of this study reveal that while the RP restrains the growth of per capita GDP in ORAG, it significantly promotes the growth of farmers’ income. Moreover, it plays a crucial role in reducing the income gap between ORAG and Jiangxi Province, thus promoting the common prosperity of farmers in ORAG. A detailed examination using quantile regression shows that the RP has a significant and consistent negative impact on GDP per capita GDP at different quantile points. At the same time, it has a significant positive effect on increasing farmers’ income at the 25% quantile point, effectively reducing income inequality among farmers at all quantile levels. The mechanism analysis shows that the RP has stimulated increased government investment in ORAG, leading to an increase in farmers’ incomes and a reduction in income disparities. However, the study also highlights the existence of a “policy trap” that has hindered the RP’s effectiveness in ORAG. Drawing upon these findings, this paper offers policy recommendations to enhance the impact of RP in ORAs.
1. Introduction
During the 20th National Congress of the Communist Party of China (CPC)in October 2022, the Chinese government explicitly introduced a new governance goal, namely to build a Chinese-style modernization in which “Common Prosperity” (CP) is shared by all citizens. This entails the imperative of raising the incomes of low-income individuals, expanding the middle-income population, standardizing income distribution, and resolutely advancing the common prosperity agenda. A key facet of CP promotion is to reduce income disparities between residents and regions, with a particular focus on raising farmers’ incomes and reducing income inequalities [1,2]. Indeed, these actions are fundamental to achieving CP, with farm income levels serving as a litmus test for measuring the extent of CP implementation [3,4]. The core facets of CP include addressing regional disparities, rural-urban disparities, and income inequalities. Efforts to reduce income disparities focus on raising the income levels of lower-income cohorts, therefore diminishing the size of this group while expanding the middle-income segment. Particular attention is paid to rural and underdeveloped regions, with policies targeting marginalized communities to consistently promote CP. The lower-income groups are predominantly located in rural areas, especially in less prosperous regions known as Outlying Rural Areas (ORAs). Increasing the income of farmers in ORAs and reducing regional income disparities among farmers constitute pivotal steps towards realizing CP in rural areas [5].
It is worth mentioning that major national strategies such as the Western Development Strategy, the Rise of Central China Strategy, the Northeast Revitalization Strategy, and the Revitalization of ORAs Strategy have had some positive impacts on the economic development of underdeveloped regions. Nonetheless, the income gap between farmers in different regions of China remains significant [6,7]. The 2021 China Statistical Yearbook highlights the significant disparities in farmers’ disposable income between cities and provinces. For example, the disposable income of farmers in Shanghai (ranked first) is 2.06 times that of Jiangxi Province (ranked tenth) and 2.61 times that of Shanxi Province (ranked twenty-seventh). Zhejiang Province (ranked second) has 3.08 times the income of Gansu Province (ranked thirty-first), while Beijing (ranked third) has 2.59 times the income of Guizhou Province (ranked thirtieth). In addition, the reports of the 19th and 20th Congresses of the Communist Party of China clearly emphasize the implementation of a regional coordinated development strategy characterized by a continuous increase in support for revolutionary regions, ethnic areas, border areas, and impoverished areas, and the establishment of a more effective mechanism for regional coordinated development. In light of both domestic and international practices, regional coordinated development is proving beneficial in enhancing inter-regional harmony, which, to some extent, addresses the challenges of unbalanced and insufficient development [8,9,10,11]. From 2022 onwards, it is imperative to conduct an objective assessment of the results of the revitalization policies in revolutionary regions. This assessment should determine whether the 11 years of implementation have resulted in rapid economic growth and shared prosperity for the residents of these areas. Such an evaluation is crucial not only for refining and improving the policies related to these regions but also for providing valuable insights into the development strategies of other revolution-era regions. Simultaneously, there is an urgent need for in-depth research on how to pioneer a new phase of regional coordinated regional development in the context of high-quality development. The research will be crucial in promoting Chinese-style modernization and development.
A substantial body of literature has undertaken policy evaluations of regional development strategies from a variety of perspectives. Scholars have also begun to assess the effectiveness of revitalization policies in western regions, revolutionary areas, and former revolutionary bases. However, consensus remains elusive, and considerable controversy persists. Existing studies often measure the extent of regional revitalization solely in terms of economic growth, poverty alleviation efforts, industrial development, targeted education initiatives, spillover effects, and citizen well-being.
The results of the specific evaluations are mixed. On the one hand, most studies indicate that Regional Revitalization Policy (RRP) has a positive impact. It promotes the optimization of industrial structure through industrial transformation [12,13] and supports GDP growth rates and industrial development by promoting investment and industrialization processes [1,11]. Other studies have also shown that the implementation of the RRP plays an important role in improving the consumer welfare of rural residents in the old revolutionary base areas in China. It can improve the consumer welfare of rural residents by increasing local fiscal expenditure and narrowing the income gap between urban and rural areas [14]. Nonetheless, these policy-driven effects show regional disparities [15], particularly in China’s vast territory, where geographical variations can influence policy outcomes [16,17]. Targeted investment in education to alleviate educational poverty has yielded striking direct benefits, significantly increasing the average annual number of school-age children enrolled in education in Outlying Rural Areas (ORAs) by 5.9% and effectively raising the overall human capital level of local school-age children [18]. It has also stimulated the endogenous forces of poverty alleviation driven by rural revitalization. Additionally, RP elevates the level of social development and enhances the well-being of residents in ORAs. However, it has also contributed to increased carbon emissions while promoting economic development [19,20].
On the other hand, some scholars argue that the RP, similar to the Western Development Strategy, could lead to a “policy trap” [21]. In other words, the RP may not effectively stimulate rapid economic growth in ORAs and may overlook the need for institutional reform and the development of a conducive soft environment. Consequently, the structure of economic development remains unbalanced, hindering the enhancement of regional sustainability [22,23].
In terms of evaluation methods, many studies have relied on before-and-after comparisons of policy implementation. From a perspective that emphasizes the scientific rigor of policy evaluation, these studies may not fully isolate the effects of other factors, potentially biasing the assessment of the impact of RP. In essence, other factors may be driving the development of ORAs, even in the absence of RP. Consequently, policy evaluation results may be biased.
In summary, the existing literature on the evaluation of revitalization policies in revolutionary-era areas has made significant progress but leaves room for further in-depth research. Therefore, this paper will innovatively use panel data from 2006 to 2019 for 35 revolutionary-era counties in Jiangxi Province. For the first time, it will use the PSM-DID model to comprehensively and scientifically assess the implementation effects of these revitalization policies.
There are three main contributions to this paper. First, it focuses its study sample at the level of core counties within the Outlying Rural Areas (ORAs), allowing for a more detailed and precise evaluation of the effects of the Regional Regeneration Policy (RRP). Second, the comprehensive evaluation covers both the economic impact and the impact on shared prosperity, examining these aspects through the lens of economic growth and farmers’ income. Heterogeneity analysis is also carried out using quantile regression, providing a nuanced understanding of the impact of the policy. Third, in terms of evaluation methodology, the paper employs the Propensity Score Matching Difference-in-Differences (PSM-DID) method, effectively addressing sample selection bias and, therefore, enhancing the accuracy of the DID-based policy evaluation results. The innovation of this study is, therefore, to enrich the dimension and depth of the research sample further. This not only increases the precision of the analyses but also captures changes at a more micro level, allowing for a more three-dimensional and comprehensive assessment of policy effects. The PSM-DID research methodology also provides a double test for estimating policy effects. Reflecting the innovation and sophistication of this study at both the methodological and applied levels, these advances not only provide important perspectives for understanding RPs in the region but also offer new methods and approaches for subsequent research.
2. Policy Background and Theoretical Analysis
2.1. Policy Background
Old Revolutionary Areas (ORAs) are revolutionary bases established under the leadership of the Chinese Communist Party during the period of the Agrarian Revolutionary War and the Anti-Japanese War. While these ORAs made significant contributions and sacrifices during the Chinese Revolution, factors such as the lingering effects of war trauma and natural geographical challenges have resulted in their relatively underdeveloped economic status (Figure 1). Among these ORAs, the Ganan ORA (ORAG), which covers three provinces (Jiangxi, Fujian, and Guangdong), has a unique historical significance. It was China’s largest revolutionary base area during the Second Domestic Revolutionary War and served as the political nucleus and core region of the ORAs. It also marks the start of the iconic 25,000-mile Long March. Despite its pivotal role in China’s revolution, ORAG has lagged behind in economic development, characterized by severe livelihood problems and persistent poverty. To promote quality revitalization and development in ORAG, a regional coordinated development (RCD) strategy is essential and provides a means to create new opportunities for RCD.
The development plan is shown in Table 1. In 2012, with the aim of addressing ORAG’s underdevelopment, improving the living conditions of its farmers, and boosting economic development and income levels, the State Council issued the “Opinions on Supporting the Revitalization and Development of Gannan and Other Old Revolutionary Areas”, hereafter referred to as the revitalization policy (RP). This policy provides comprehensive support for the revitalization and development of ORAG, encompassing all aspects of livelihoods, infrastructure, industrial growth, public services, environmental protection, and institutional reform, all aimed at promoting the shared prosperity of ORAG residents. Its implementation is of immense importance and value in achieving coordinated regional development and realizing the overarching “Two Centenary Goals”.
The RP has been strategically planned and implemented in various areas with clearly defined development goals. In 2013, the “Implementation Plan of Central State Organs and Relevant Units to Support Old Revitalization Areas” was introduced, further bolstering the RP’s execution. This plan emphasizes the importance of counterpart support as it establishes an integrated support framework that maximizes the strengths of each of the units involved and strengthens the development momentum of ORAG. Additional measures were taken in 2014, including the implementation of the “Plan for the Revitalization and Development of the Old Revitalization Areas of Jiangxi, Fujian, and Guangdong”. This plan prioritizes regional cooperation and the construction of ORAG’s core economic circle, providing support and assistance in areas such as talent development, education, capital injection, technological advancement, and project implementation. The overall goal is to steer ORAG’s economy towards quality development, improve the well-being of its residents, and promote sustainable economic and social progress.
From 2021 onwards, it is imperative to objectively and scientifically evaluate the results of the RP. This evaluation will assess whether the 10 years of implementation have successfully raised farmers’ incomes in ORAG and reduced income disparities between regions. Such an evaluation would serve to identify both the shortcomings and strengths of the RP and provide valuable insights into the development of ORAG. In addition, this experience can inform the refinement of the RP for ORAG and provide a reference and demonstration model for the development of other ORAs across the country.
2.2. Theoretical Analysis
Economic growth theory traditionally considers factors such as capital, land, and labor as the primary drivers of economic growth. The Regional Revitalization Policies (RPs) are mainly characterized by a series of preferential policies, including increased financial investment, tax incentives, relaxed conditions for resource development, emphasis on industrial factors, and improved incentives for talent attraction [24,25]. Capital, the most important factor, comes mainly from government financial investment, bank lending, industrial and commercial investment, and personal income deposits.
The RPs have increased fiscal transfers, particularly through equalization and special fiscal transfers, therefore increasing government financial allocations. For example, the Ministry of Finance provides annual financial subsidies, and special central lottery funds are allocated to the ORAs in Jiangxi, Fujian, and Guangdong Provinces. In addition, there has been an escalation in central budgetary investments, special construction funds, and major national projects, which have served as an initial capital base for rural revitalization and improved income levels for farmers in the ORAs. Financial credit support has played an important role in overcoming the challenges posed by low local savings rates. Tax incentives, relaxed conditions for resource development, and attractive conditions for talent acquisition have also had positive results in attracting foreign investment. The rich resource endowment and the relaxed conditions for resource development have created opportunities for resource development in ORAs, ultimately increasing farmers’ incomes [26,27].
While the RPs have achieved certain milestones since their inception, the presence of a policy trap warrants attention. To fully exploit the revenue growth effect of the RPs, the government needs to provide long-term and stable policy support. In the actual implementation process, the effectiveness of the policy has been limited by its relatively modest strength. In addition, underdeveloped conditions in the ORAs may dilute the impact of the policy, leaving room for improvement in revenue enhancement. On the one hand, local governments tend to prioritize short-term economic growth at the expense of long-term development, often driven by political performance targets [28]. This emphasis on rapid, short-term growth and revenue enhancement through fixed asset investment can inadvertently lead to a resource curse effect. On the other hand, ORAs, especially in rural areas, often have weak developmental foundations. The RPs emphasize addressing rural issues by promoting rural industries, improving the basic public service system covering both urban and rural areas, and increasing investment in rural infrastructure, livelihood projects, and the ecological environment. These efforts are aimed at improving farmers’ living conditions, creating employment opportunities, elevating income levels, narrowing regional income disparities, and ultimately achieving shared prosperity.
3. Method and Variable Setting
3.1. Model Specification
In 2012, the State Council issued the Regional Revitalization Policy (RRP), which marked the official start of a series of initiatives to revitalize Old Revolutionary Areas (ORAs). Consequently, the RP can be regarded as a quasi-natural experiment, and the difference-in-differences (DID) method is used to investigate its implementation effects and mechanisms [29]. The accuracy of the DID method depends on ensuring that the variables studied in the experimental and control groups have the same temporal trends prior to policy implementation. However, the selection of counties (districts and cities) in ORAG is not entirely exogenous and random but is often influenced by socioeconomic factors and differences in resource endowments. This may introduce potential self-selection problems that may bias the estimation results. Therefore, this paper uses the Propensity Score Matching Difference-in-Differences (PSM-DID) method to validate the impact of RP on economic growth and farmers’ income in ORAG [30].
- Step 1: PSM Matching
The counties (districts and cities) where the RP is implemented form the experimental group, while the unaffected counties (districts and cities) form the control group. PSM matching uses observable matching variables to compute conditional sample probabilities, generating propensity scores for matched individuals in both the experimental and control groups. The aim of PSM matching is to minimize any significant differences between the experimental and control groups prior to the implementation of the RP, thus adhering as closely as possible to the parallel trend assumption. This minimizes endogeneity concerns due to self-selection bias. The sample of this study mainly takes the counties that belong to the RP influence and the counties that do not belong to the policy influence as the research object, considering the completeness and accessibility of the data, as well as the comprehensive effect of the local policy on the counties so that it will be the core area of the RP Ganzhou City, All the counties in the region as the experimental group, and the 54 counties (townships) in Jiangxi Province that were excluded from the revitalization policy as well as the counties of Nanchang City that were not included in the policy as the control group. In this study, a total of 20 counties in other county areas of Jiangxi Province that are not included in the scope of the RP are selected because of the impact of the capital effect of Nanchang. Therefore, this study divides the 35 counties (cities and districts) in Jiangxi Province from 2006 to 2019 into four sub-samples according to the two classification criteria of whether they are included in the scope of the policy and whether the policy is implemented, which are the two treatment groups before and after the implementation of the Vibrational RP, and the two control groups before and after the RP.
- 2: DID Estimation
Building on the outcomes of PSM matching, the DID regression model is employed to estimate the net effect of the RP on increasing farmers’ income. This is illustrated by the following equation:
In Equation (1), is the explained variable, which is the economic effect indicator and income effect indicator of the RP, measuring the economic level of ORAs and the common prosperity of farmers, which are GDP per capita and income per farmer, respectively; represents the policy implementation area, and t represents the policy implementation time; is the core explanatory variable of this study, i.e., the RP; policy = 1 represents the experimental group of counties (districts and cities) where the RP is implemented, policy = 0 represents the control group of counties (districts and cities) where no RP is implemented; dt = 0 represents the year before the RP implementation, dt = 1 represents the year after the RP implementation; is the control variable; is the individual effect; is the time effect; and is the random error term.
The above baseline regression results reflect the average impact of the RP on local development, which masks the dynamic differences. Meanwhile, the DID empirical results can genuinely reflect the policy effect on the premise only when the experimental and control groups satisfy the parallel trend hypothesis before the policy implementation. For this reason, this paper uses the event study method to test the dynamic effect of the RP as well as the parallel trend test and constructs the model as follows:
In Equation (2), represents the year after the RP implementation, − represents year before the RP implementation, represents the estimated coefficients for period t in 2006–2019, and the rest of the variables are consistent with the baseline model.
3.2. Variable Setting
3.2.1. Explained Variables
This study assesses the impact of the RP in two key dimensions: the economic impact and the income impact. Specifically: (1) Economic Effect. The level of GDP per capita serves as a crucial indicator of regional economic development [31]. Therefore, “GDP per capita” is chosen as the dependent variable to assess the economic impact of the RP; (2) Income Effect. Given that rural areas in ORAs exhibit relative underdevelopment, farmers’ income levels are typically low, and these regions often have a concentration of impoverished individuals. The RP is designed to advance rural infrastructure and industrial development, with the intended outcome of raising farmers’ income levels and, consequently, the progress of the “three rural areas” in the ORAs. In this study, “farmers’ disposable income” and “the proportion of farmers’ disposable income in Jiangxi Province compared to ORAG counties (counties and cities)” are selected as dependent variables. These measures are used to assess farmers’ income and the regional income gap among farmers in ORAG, respectively. Together, these variables characterize the income effect in ORAG and contribute to the realization of shared prosperity.
3.2.2. Core Explanatory Variables
RP dummy variable is the core explanatory variable; if the study sample counties (districts and cities) are ORA counties after 2012, is assigned a value of 1 and the opposite is 0; is the time dummy variable, is assigned a value of 1 after the RP implementation, and the opposite is 0.
3.2.3. Control Variables
This study draws upon the research of prominent scholars, including Attanasio (2000) [32] and Wang et al. (2019) [31], as it employs a set of key indicators to comprehensively assess various aspects of the ORAG region. Specifically, Investment and Savings: The study utilizes “Total Regional Per Capita Fixed Asset Investment” and “Per Capita Resident Savings Deposit Balance” to gauge the levels of investment and savings within ORAG; Local Government Finance: “Per Capita Fiscal Revenue” is chosen as a metric for evaluating local government revenue, while “Per Capita Fiscal Expenditure within the General Public Budget” is employed to assess local government expenditure; Industrial Structure: To analyze the industrial composition of the counties, “Value-Added of Secondary Industry Per Capita” and “Value-Added of Tertiary Industry Per Capita” are selected to measure the levels of industrialization and advanced industrial structure; Opening Up Level: The degree of openness to foreign investment is quantified using the “Amount of Actual Foreign Capital Utilized Per Capita”. Table 2 shows the definitions and detailed descriptive statistics.
3.3. Data
This study examines the impact of the RP. It identifies Ganzhou City (GC) as the core area for the RP, based on the policy implementation scope outlined in the “Study on the Establishment of Statistical Monitoring System for the Revitalization and Development of Gannan and Other Old Revolutionary Areas” published by the Jiangxi Provincial People’s Government in 2015. In the study, 15 counties within Ganzhou City were selected as the experimental group, representing a typical sample. In addition, 20 other counties (cities) in Jiangxi Province that did not implement RP serve as the control group, making a total of 35 counties. To maintain accuracy and to account for administrative boundary changes prior to 2005, the study focuses on the period from 2006 to 2019, covering the first six years and the subsequent seven years of RP implementation since 2012.
The data sources used in this study include the China County Statistical Yearbook, the China Regional Economic Statistical Yearbook, Jiangxi in the New China Sixth Decade, and the Jiangxi Provincial Statistical Yearbook 2007–2020. In addition, the National Economic Statistical Bulletin was used for each county. Several data processing steps were implemented: (1) Price conversion adjustments using the 2005 base period Consumer Price Index (CPI) for Jiangxi Province to mitigate the effects of inflation [33]. (2) Application of a moving average method to account for missing raw data. (3) Uniform use of farmers’ disposable income as a measure of farmers’ income, as it later replaced farmers’ net income per capita.
For a more comprehensive understanding of the evolving trends in the variables before and after RP implementation, the description of the data was split into experimental and control groups, and comparisons were made in terms of mean changes between 2006–2011 and 2013–2019. The details are shown in Table 3. Prior to RP implementation, the experimental group had an average annual growth rate of 15.03% in GDP per capita, slightly lower than the control group’s rate of 15.65%. However, after RP implementation, the experimental group experienced a significantly lower average annual growth rate of 8.51% compared to the control group’s rate of 9.98%. This suggests that RP implementation did not effectively promote economic development in GC and further widened the gap between GC’s level of economic development and that of non-ORAG areas. In terms of farmers’ per capita disposable income, the experimental group had an average annual growth rate of 9.42% before RP implementation, which was lower than the control group’s rate of 11.29%. However, after RP implementation, the experimental group achieved an elevated average annual growth rate of 11.43%, which exceeded the control group’s rate of 8.53%. This indicates that the implementation of RP has effectively increased the income of farmers in GC and promoted rural development in the region.
4. Empirical Results
4.1. PSM Processing
This study used Stata 15.1 to perform propensity score matching (PSM) between the experimental and control groups, with the aim of identifying a control group sample that closely matched the conditions of the experimental group. Table 4 shows the normalized bias for each variable before and after matching. From the data in the table, it is clear that each variable in both the experimental and control groups shows a reduced discrepancy after the matching process. In particular, there are no longer any significant differences between the variables after matching, which indicates the effectiveness of the matching results and justifies the use of the PSM-DID method.
In addition to PSM, three other matching methods, namely nearest neighbor matching, caliper matching, and kernel matching, are used to improve the accuracy of the matching results, as shown in Table 5. The results show a significant decrease in the pseudo-R2 value after matching, from 0.352 to values between 0.007 and 0.013, close to zero. Similarly, the LR statistic showed a significant decrease after matching, from 192.22 to values between 1.67 and 3.73. Prior to matching, the mean standardized deviation between the experimental and control groups was 66.00%, indicating a significant disparity in the raw data and considerable heterogeneity between the two groups. After matching, the mean standardized deviation between the two groups decreased to 4.20%, 6.60%, and 11.90%, respectively. The median deviation also shows a significant reduction. Taken together, these results demonstrate the homogeneity achieved in the sample after matching, confirming the validity of the propensity score estimation method.
4.2. PSM-DID Results
4.2.1. Baseline Results
The income effect of the RP was assessed using a DID model, and to ensure the robustness of the results, all regressions were controlled for bidirectional fixed effects of region and time. The regression results of model (1) presented in Table 6 show that the RP did not lead to a significant increase in per capita GDP in GC; In fact, it showed a negative effect, with the RP causing a significant decrease of 5.64% in GDP per capita in the experimental group compared to the control group. This suggests that the RP did not have the intended positive impact on economic development. Several factors may have contributed to this result. First, despite the RP’s emphasis on promoting and developing characteristic advantageous industries, GC faced challenges due to its weak conditions and unfavorable industrial structure. The RP’s support and promotion may not have been sufficient to address the immediate problems of industrial structure upgrading and institutional reform, resulting in limited industrial growth and efficiency, which in turn hindered the county’s GDP growth. Second, strengthening the endogenous drivers of economic development in the GC is essential. While the state has provided funds and projects to support local economic and industrial development, the lack of an effective system to ensure the realization of policy benefits may have led to rent-seeking behavior, crowding-out effects, and the potential for falling into a “policy trap”. policy traps can lead to a reduction in the efficiency of resource allocation, neglect of institutional reform and optimization of the market mechanism, which in turn can lead to system rigidity and inefficiency. Failure to effectively strengthen the rule of law, optimize the business environment, improve public services, and other aspects of the soft environment makes it difficult to attract long-term private investment and talent inflows. To overcome the policy trap, it is necessary to strengthen autonomous development capacity, reduce over-dependence on policies, promote innovation-driven and technological upgrading, and support the sustainable development of RP. Strengthen the market orientation of policies and make rational use of the market mechanism to guide resource allocation and improve the efficiency of resource use and the quality of economic development. Improve the investment and business environment to attract more foreign investment and talent. Third, the RP places a strong emphasis on ecological construction and environmental protection while prioritizing sustainable development. It does not exclusively prioritize GDP growth but seeks to strike a balance between development and protection. This approach has effectively promoted the harmonization of economic development with resource and environmental factors and steered it toward high-quality development. As a result, the GDP growth rate in ORAG, including GC, may appear to be slower compared to non-ORAG regions.
In contrast, the regression results of model (2) show that the implementation of the RP resulted in a substantial 13% increase in farmers’ income in the experimental group compared to the control group, indicating the effectiveness of the RP in increasing farmers’ income in GC. The increase in farmers’ income can be attributed to RP’s focus on developing agriculture and the rural economy, promoting increased production and quality of agricultural products by raising the level of agricultural production and promoting modern agricultural technology and management methods. The RP encourages farmers to participate in the transformation and upgrading of rural industries and supports farmers in developing new industries such as agricultural product processing, rural tourism, and rural specialty industries, which can provide more quality employment opportunities and ways to increase farmers’ incomes. At the same time, the RP has implemented a series of support and subsidy policies for farmers, including agricultural production subsidies, agricultural product price protection, and rural social security, which can improve farmers’ production capacity and income levels. This success can be attributed to the RP’s focus on addressing agricultural and rural development and livelihood issues, resulting in tangible improvements in rural production conditions and farmers’ livelihoods’ livelihoods. Finally, the regression results of model (3) show that the implementation of the RP significantly narrowed the income gap between GC and Jiangxi Province, thus contributing to the common prosperity of farmers in GC.
The RP is expected to have the following impacts on the economic sustainability and development of ORAG in the long term: the overall economic strength will be strengthened, leading to the diversification of the regional economy; traditional industries can be upgraded through technological transformation; and new industries can be developed with the help of policy support and market orientation. The RP will help narrow the development gap between the inland and other developed regions, promote the coordinated development of the region and the new type of urbanization, and form a more balanced and harmonious regional development pattern. Optimizing the industrial structure and improving the scientific and technological innovation capability is expected to promote the formation of an independent and complete industrial system and the sustainable development capability of the local economy.
4.2.2. Parallel Trends Assumptions Test
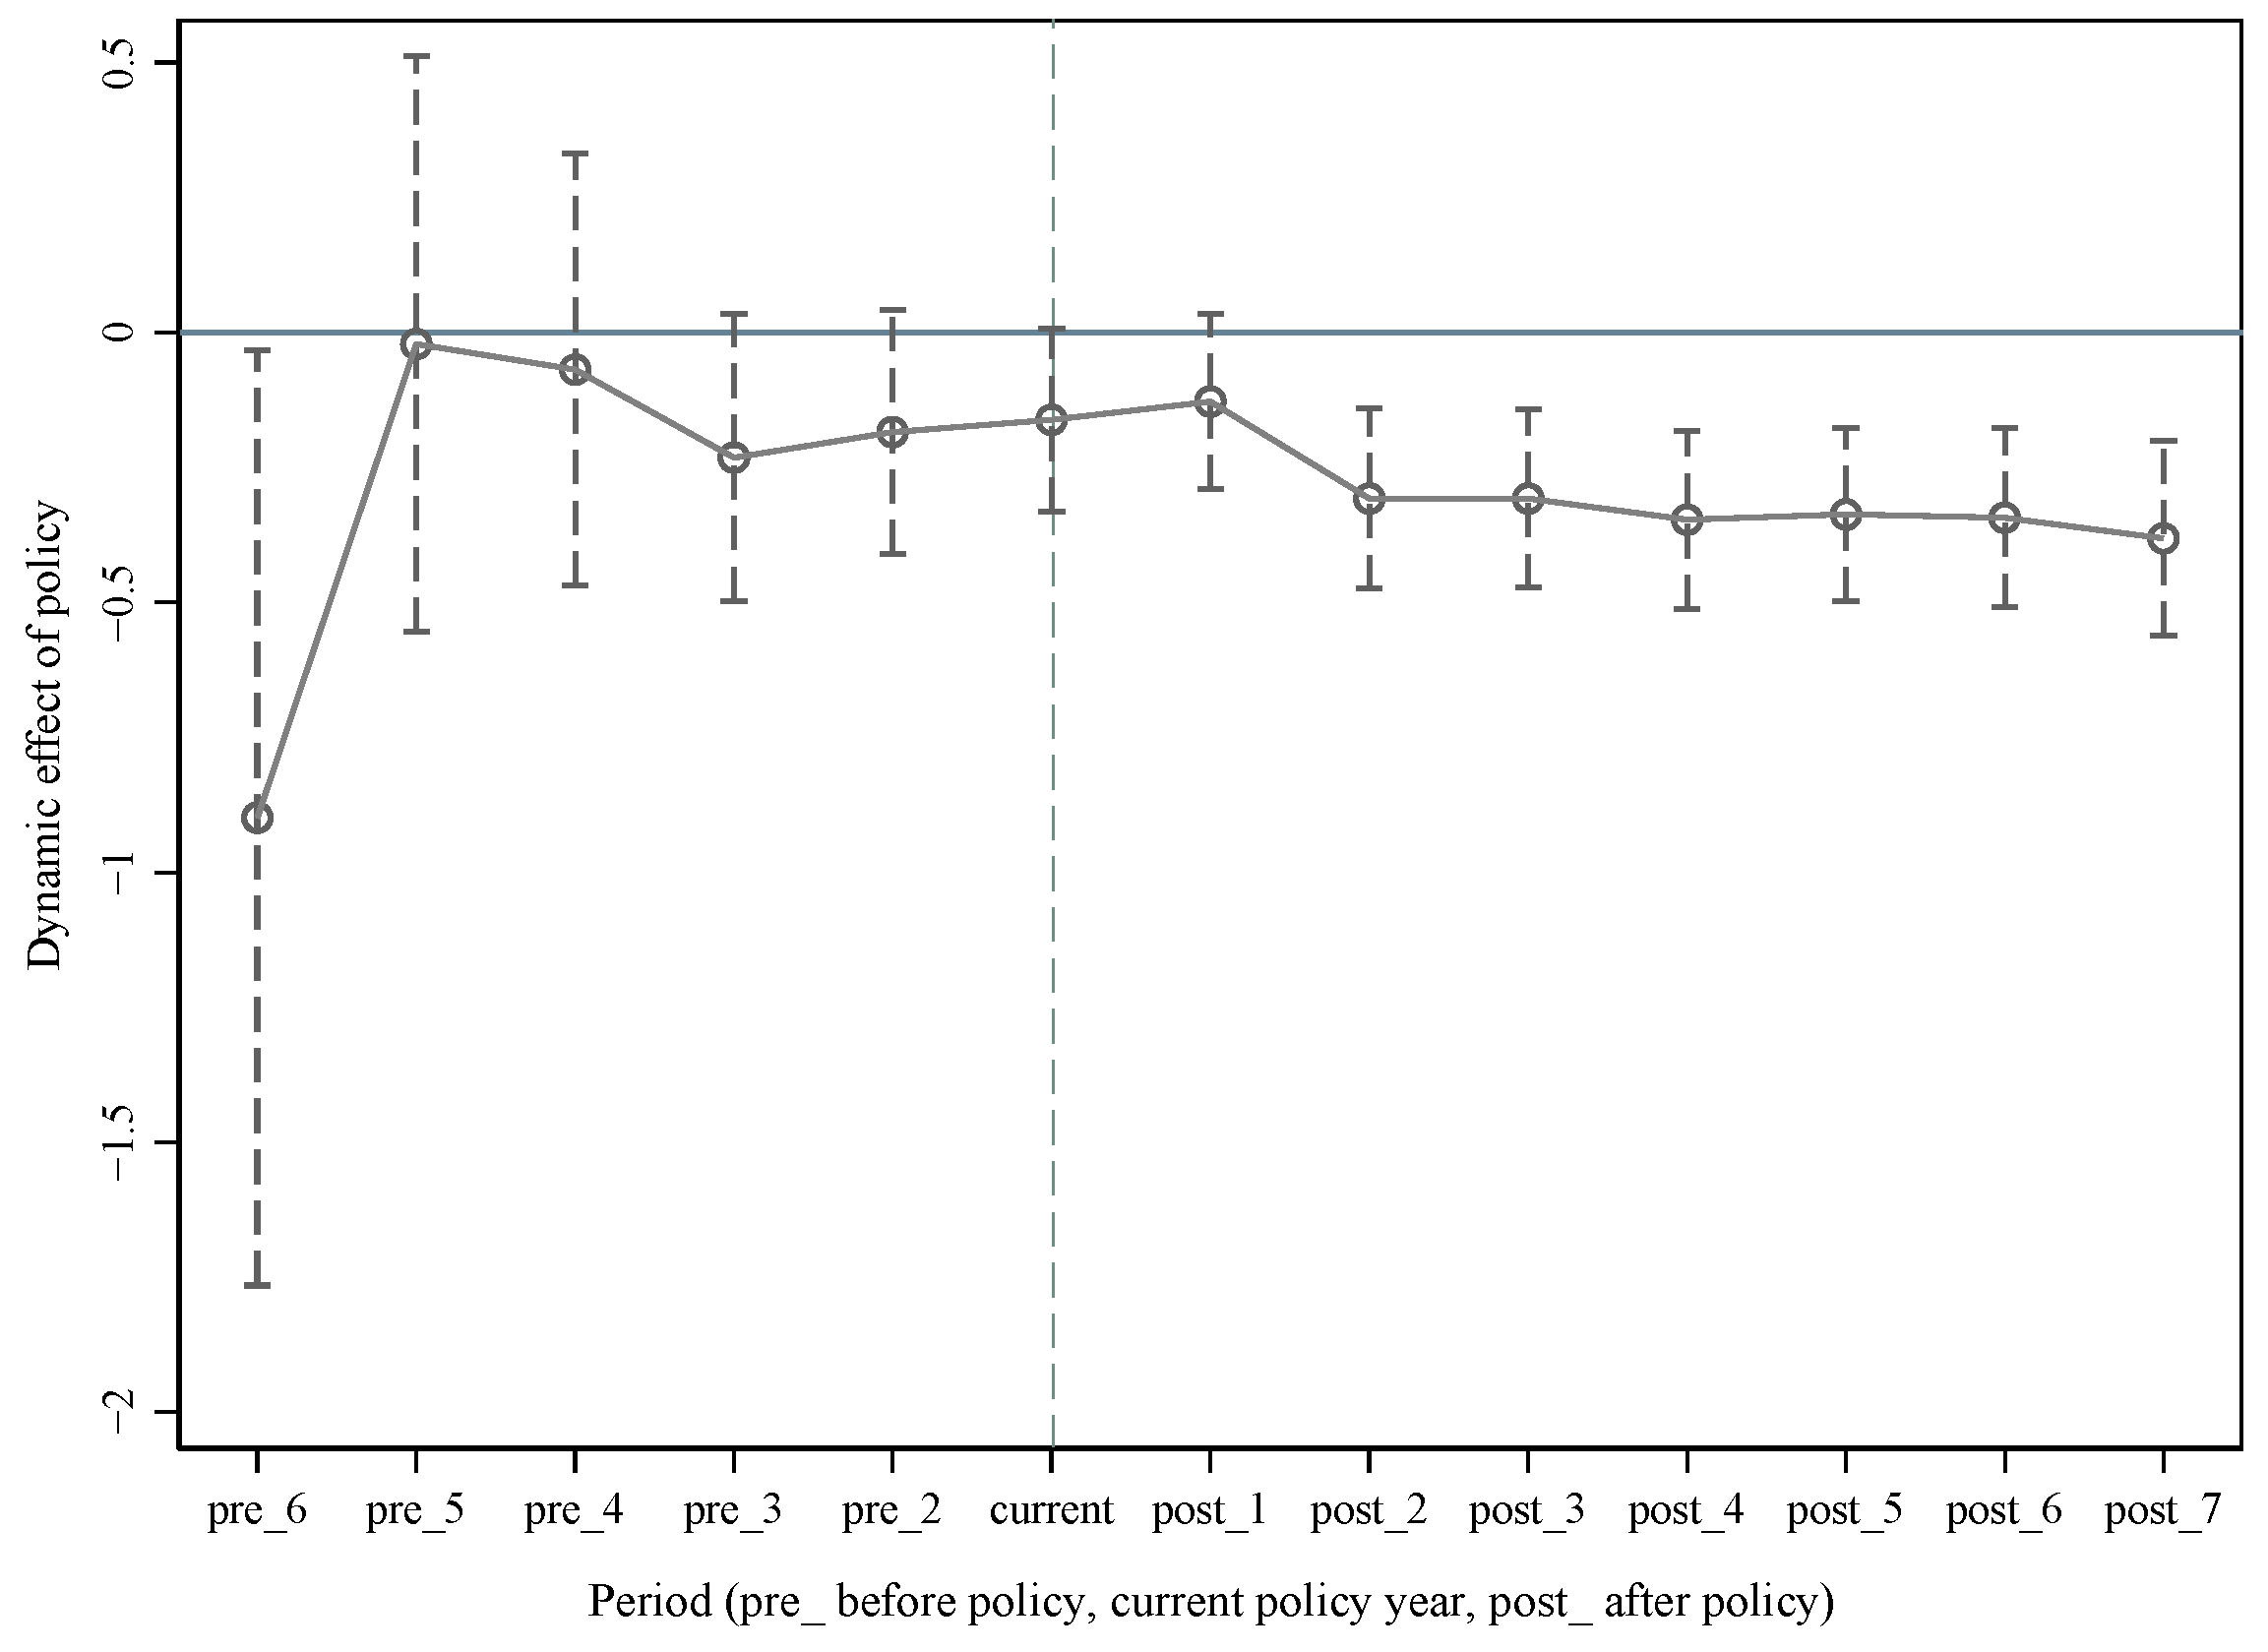
The DID model must satisfy the parallel trend assumption. To further assess the dynamic effect of the RP, we use the event study method to conduct a counterfactual test, which helps to estimate how the RP has affected farmers’ income over time [34]. In this analysis, the dependent variable is farm income multiplied by the RP dummy variable. The coefficient of the interaction term tells us whether there is a significant difference between the experimental and control groups. Figure 2 illustrates the dynamic effect of the RP on GDP per capita in the GC. Before the implementation of the RP in 2012, there was no significant difference in GDP per capita between the experimental and control groups. However, after the implementation of the RP, there was a significant negative impact on GDP per capita in the GC. This negative impact intensified over time, suggesting that the RP did not effectively stimulate the region’s economic development as intended. Figure 3 shows the dynamic impact of the RP on farmers’ incomes in the GC. The results, using farmers’ income as the dependent variable, show a significant positive impact of the RP. After 2012, the effect shows an initial decline followed by an increase as the duration of the policy implementation increases. Furthermore, Figure 4, the parallel trend test, shows that the RP significantly reduced the income gap between GC and Jiangxi Province. This effect becomes more pronounced as the number of years of policy implementation increases. In summary, these results support the condition of the parallel trend assumption required for the DID model.
4.2.3. Robustness Checks
(1) Change in estimation method. To further validate the RP effect, we used an alternative estimation method to corroborate the previously presented results. Specifically, we used the DID model to measure the impact of the RP on livelihoods and to explore its role in promoting the common welfare of the GC. The empirical results are summarized in Table 7. Notably, the RP continues to have a significant negative impact on regional economic growth. On the other hand, it makes a significant positive contribution to increasing the income of GC farmers, with an improvement effect of 8.69%. However, it is worth noting that these effects appear to be slightly lower than those observed in the regression results for the PSM-DID model. This suggests that the RP effect may be underestimated to some extent if the selection bias is not taken into account. Moreover, the RP continues to narrow the income gap between farmers in the GC and Jiangxi Province, effectively promoting rural development in the GC and promoting shared prosperity. Importantly, these findings remain consistent after changing the estimation method, demonstrating the robustness of the results.
(2) Varying the timing of policy implementation. To mitigate potential confounding effects due to concurrent policies in the region, we conducted further robustness tests by varying the year of RP implementation. Specifically, we shifted the year of RP implementation to 2008 and 2009, and the empirical results are presented in model (7) and model (8) of Table 8. In these models, we perform a counterfactual test by moving the RP implementation year forward while using GDP per capita, farmer income, and the income gap between farmers as the dependent variables. The regression results show that the coefficients are not statistically significant under these alternative scenarios. This confirms that the development progress observed in GC can be attributed to the implementation of RP itself rather than being influenced by other concurrent policies. It highlights the positive impact of the RP on improving livelihoods in GC.
4.2.4. Heterogeneity Analysis
Previous empirical analysis has shown that RP has a significant impact on both economic growth and farmers’ incomes in GC. However, this is a holistic assessment, and given the different levels of economic development across counties, it is plausible that the impact of RP varies across counties with different levels of development. To gain insight into these differences, we applied a panel quantile regression model to estimate the heterogeneity of the impact of RP on economic growth and farm income in GC across different quartiles.
The results of model (9) in Table 9 illustrate the variation in the impact of the RP at different levels of GDP per capita. It has a significant and negative impact on GDP per capita at all sub-points, with an increasing degree of impact. This means that the negative effect of the RP is more pronounced in counties (cities) with higher levels of economic development. This phenomenon can be attributed to the relatively weak economic conditions in GC. The RP’s focus on infrastructure development through economic aid in less developed areas has a negative effect on economic growth. Conversely, this effect is less pronounced in areas with higher levels of economic development, where a focus on rural areas may hinder the overall economic performance of non-rural areas.
As shown in model (10), the RP has a significant positive effect on farmers’ income only at the 25% quantile point but not at the 50% and 75% quantile points. In other words, for counties (cities) with lower farm income levels, the RP has a significant promotional effect. This suggests that for counties (cities) characterized by lower farmers’ income levels, the RP can enhance farmers’ economic conditions to some extent. It is worth noting that the development of rural industries, together with the diversification of economic activities, especially the growth of tertiary and high-tech sectors, has contributed to raising the income level of farmers. Conversely, for counties (cities) with medium to high farmers’ income levels, the existing fundamental issues cannot be resolved solely through financial poverty alleviation and subsidies. While these regions may initially experience some relief from the policy, they eventually encounter developmental bottlenecks where the policy’s effectiveness of the policy diminishes, resulting in a decline in income levels. Consequently, the boosting effect is not significant in the middle and high-income regions.
In model (11), the results show differences in the effect of the RP at different levels of the income gap for farmers. Although the RP significantly reduces the income gap for farmers at all quantile points, the magnitude of the effect is reduced. In essence, the restraining effect of the RP is more pronounced in regions with a smaller income gap for farmers. This phenomenon can be explained by the fact that although the RP effectively increases income levels in areas with lower farm incomes, it mainly impacts the absolute income figures. As a result, the relative income figures in these areas are less affected than in higher-income areas, particularly because of the considerable pre-existing income gap between low-income areas and Jiangxi Province. These findings are consistent with the earlier baseline results.
4.2.5. Mechanism Test
The results so far show that RP is effective in increasing farmers’ incomes in GC, reducing income inequality among farmers, and contributing to the overall welfare of farming communities. To gain a deeper insight into the determinants of RP’s effectiveness, this study examines its impact on different drivers of farmers’ income. In Table 10, the focus of this analysis is on the interaction term, which represents the net effect of RP on these income drivers. The regression results reveal significant findings. First, RP has a significant positive effect on the level of investment. This suggests that the effect of RP on increasing farmers’ incomes is closely linked to the increase in local government investment in fixed assets. In essence, RP contributes to the improvement of farmers’ incomes by increasing investment in the region. However, the impact of the RP on other drivers is mixed. In particular, the RP has a significant negative effect on the level of government expenditure, advanced industrial structure, and openness. These findings suggest that while the RP may increase investment, it may unintentionally suppress government spending, hinder the development of an advanced industrial structure, and discourage efforts to attract external capital and investment. It is crucial to address these negative effects and create mechanisms to ensure the sustainable and balanced development of these aspects to optimize the effectiveness of the RP.
Conversely, the RP does not show a significant effect on the level of household savings, fiscal revenue, and industrialization. These results suggest that the implementation of RP does not substantially affect these specific drivers of farmer income. Overall, the mechanism analysis emphasizes the RP’s significant role in promoting investment levels in GC, therefore increasing farmers’ income. However, there is room for further enhancing the effectiveness of RP with respect to other revenue drivers. Constructing a long-term mechanism to ensure the sustainable implementation of the RP is essential for achieving these goals [35].
5. Conclusions and Policy Implications
This study uses panel data from 2006 to 2019, covering 35 counties in Jiangxi Province, to examine the potential of the revitalization policy (RP) to promote shared prosperity among farmers in Ganzhou City (GC), located in the Old Revolutionary Area of Gannan (ORAG). The analysis uses the Propensity Score Matching and Difference-in-Differences (PSM-DID) method and focuses on two main perspectives: the increase of farmers’ income and the reduction of income disparities. In addition, robustness tests and heterogeneity analyses were carried out to validate the results. This study has made certain innovations and improvements in sample selection, evaluation content, and evaluation methods through empirical analysis of the effects of revitalization policy in the Soviet Union after effectively addressing endogeneity and selection bias, which provides a more accurate and comprehensive assessment and understanding of the implementation effects of revitalization policy in the Soviet Union. This has important guiding significance for the formulation and promotion of related policies and provides a certain reference value for further in-depth research in the future.
The results reveal several important findings. First, the average impact of the RP on GDP per capita in GC is significantly negative. However, the RP had a significantly positive impact on increasing the income of farmers in GC and contributed to narrowing the income gap between GC and Jiangxi, therefore facilitating shared prosperity. This is consistent with existing research that RP contributes to the sustainable development of Old Revolutionary Areas [35]. These findings are supported by robustness tests and quantile regression analyses, which show different effects for different economic quantiles.
Further analysis of the mechanisms driving these results suggests that RP significantly increases the level of local government investment in GC, which primarily contributes to the increase in farmers’ incomes. The findings are consistent with the effectiveness of public support policies presented in most studies. Public support policies are the key factors that can compensate for market failures and improve residents’ quality of life [36]. However, there is room for improvement in the impact of RP on other drivers, which requires the establishment of a long-term mechanism to ensure its continued effectiveness.
Based on these evaluation results, several research lessons have been learned. First, there is an urgent need to optimize support policies for the revitalization of Old Revolutionary Areas (ORAs) and to implement a more robust long-term mechanism for RP. This includes addressing institutional constraints and promoting endogenous development in ORAs to overcome development bottlenecks. Second, there is a need to promote integrated urban-rural development and to establish mechanisms for sustainable growth in farmers’ incomes. Strategies such as urbanization, concentration of elements in county cities, and activation of rural elements should be used to cultivate new agricultural units and build a competitive industrial system in ORAs. Finally, a market-oriented approach should be adopted to improve industrial competitiveness. This involves optimizing the industrial structure in ORAs, encouraging the transfer of advantageous industries, and promoting the development of green and environmentally sustainable agricultural practices. In addition, supporting the deep processing of raw materials and promoting lead industries can enhance the competitiveness of county-level industries. These findings provide valuable guidance for policymakers and stakeholders seeking to maximize the impact of revitalization policies and achieve shared prosperity in Old Revolutionary Areas such as Gannan.
This study may have some limitations. From the perspective of the research object, not all counties (cities and districts) involved in the revitalization and development policy are fully included, and only representative counties belonging to Ganzhou City are selected for empirical analysis; in the future, attempts should be made to include the research object at the prefecture and city level, so as to comprehensively assess and analyze the impact of the policy; From the perspective of the data level, there are certain limitations in the statistical indicators of county data, and due to the lack of availability, the indicators are not comprehensive enough to synthesize the factors of various parties to study the impact of the policy.
Author Contributions
W.L.: Writing, Methodology, Software; R.Y.: Data curation, Writing—Original draft preparation; X.Z.: Validation, Investigation. N.L.: Software, Validation. H.Q.: Writing—Reviewing and Editing. All authors have read and agreed to the published version of the manuscript.
Funding
This research was supported by the National Natural Science Foundation of China (Grant No. 71934003, 72263017), Jiangxi Modern Agricultural Sericulture Industry Technology System Project (Grant No. JXARS-23) and the National Social Science Foundation of China (Grant No. 22CGL027).
Institutional Review Board Statement
Not applicable.
Data Availability Statement
The original contributions presented in the study are included in the article, further inquiries can be directed to the corresponding author.
Conflicts of Interest
The authors declare no conflicts of interest.
References
- Lu, Y.; Wang, J.; Zhu, L. Place-based policies, creation, and agglomeration economies: Evidence from China’s economic zone program. Am. Econ. J. Econ. Policy 2019, 11, 325–360. [Google Scholar] [CrossRef]
- Gao, J.; Liu, Y.; Chen, J.; Cai, Y. Demystifying the geography of income inequality in rural China: A transitional framework. J. Rural. Stud. 2022, 93, 398–407. [Google Scholar] [CrossRef]
- Zhang, X.; Liu, H. Heterogeneity Perspective on the Dynamic Identification of Low-Income Groups and Quantitative Decomposition of Income Increase: Evidence from China. Sustainability 2022, 14, 9367. [Google Scholar] [CrossRef]
- Yao, Y.; Li, J. Urbanization forces driving rural urban income disparity: Evidence from metropolitan areas in China. J. Clean. Prod. 2021, 312, 127748. [Google Scholar] [CrossRef]
- Pan, D.; Fang, P.; Chen, S. Can place-based policies reduce urban-rural income inequality? Evidence from China’s Old Revolutionary Development Program based on county-level data. Econ. Res. Ekon. Istraživanja 2023, 36, 1–24. [Google Scholar] [CrossRef]
- Liu, L.; Chen, Y.Y.; Wu, T.; Li, H.M. The drivers of air pollution in the development of western China: The case of Sichuan province. J. Clean. Prod. 2018, 197, 1169–1176. [Google Scholar] [CrossRef]
- Zhou, X.B.; Zhang, C.; Wang, J.Y. The status quo, causes and countermeasures of economic differentiation in North and South China: A new trend that needs attention. J. Hebei Univ. Econ. Bus. 2019, 40, 801–808. [Google Scholar]
- Freedman, M. Targeted Business Incentives and Local Labor Markets. J. Hum. Resour. 2013, 48, 311–344. [Google Scholar]
- Bernini, C.; Pellegrini, G. How are Growth and Productivity in Private Firms Affected by Public Subsidy? Evidence from a Regional Policy. Reg. Sci. Urban Econ. 2011, 41, 253–265. [Google Scholar] [CrossRef]
- Shenoy, A. Regional development through place-based policies: Evidence from a spatial discontinuity. J. Dev. Econ. 2018, 130, 173–189. [Google Scholar] [CrossRef]
- Barbieri, E.; Pollio, C.; Prota, F. The impacts of spatially targeted programmes: Evidence from Guangdong. Reg. Stud. 2020, 54, 415–428. [Google Scholar] [CrossRef]
- Hong, M.; Zhang, W. Industrial structure upgrading, urbanization and urban-rural income disparity: Evidence from China. Appl. Econ. Lett. 2021, 28, 1321–1326. [Google Scholar] [CrossRef]
- Kline, P.; Moretti, E. People, places, and public policy: Some simple welfare economics of local economic development programs. Natl. Bur. Econ. Res. 2014, 6, 629–662. [Google Scholar] [CrossRef]
- He, C.; Zhou, C.; Wen, H. Improving the consumer welfare of rural residents through public support policies: A study on old revolutionary areas in China. Socio-Econ. Plan. Sci. 2024, 91, 101767. [Google Scholar] [CrossRef]
- Falck, O.; Koenen, J.; Lohse, T. Evaluating a place-based innovation policy: Evidence from the innovative Regional Growth Cores Program in East Germany. Reg. Sci. Urban Econ. 2019, 79, 103480. [Google Scholar] [CrossRef]
- Ren, W.; Xue, B.; Yang, J.; Lu, C. Effects of the Northeast China revitalization strategy on regional economic growth and social development. Chin. Geogr. Sci. 2020, 30, 791–809. [Google Scholar] [CrossRef]
- Yang, Z.; Shao, S.; Xu, L.; Yang, L. Can regional development plans promote economic growth? City-level evidence from China. Socio-Econ. Plan. Sci. 2022, 83, 101212. [Google Scholar] [CrossRef]
- Bai, Y.; Zhang, L.; Sun, M.; Xu, X. Status and path of intergenerational transmission of poverty in rural China: A human capital investment perspective. J. Integr. Agric. 2021, 20, 1080–1091. [Google Scholar] [CrossRef]
- Pan, D.; Chen, Y.G.; Kong, F. The role of place-based policies on carbon emission: A quasi-natural experiment from China’s old revolutionary development program. Heliyon 2023, 9, e15964. [Google Scholar] [CrossRef]
- Xu, M.; Tan, R.; He, X. How does economic agglomeration affect energy efficiency in China? Evidence from endogenous stochastic frontier approach. Energy Econ. 2022, 108, 105901. [Google Scholar] [CrossRef]
- Jia, J.; Ma, G.; Qin, C.; Wang, L. Place-based policies, state-led industrialisation, and regional development: Evidence from China’s Great Western Development Programme. Eur. Econ. Rev. 2020, 123, 103398. [Google Scholar] [CrossRef]
- Zhang, C.; Zhao, Z.; Wang, Q. Effect of Western Development Strategy on carbon productivity and its influencing mechanisms. Environ. Dev. Sustain. 2021, 24, 4963–5002. [Google Scholar] [CrossRef]
- Stern, D.I.; Common, M.S.; Barbier, E.B. Economic growth and environmental degradation: The environmental Kuznets curve and sustainable development. World Dev. 1996, 24, 1151–1160. [Google Scholar] [CrossRef]
- Su, C.; Meng, X.; Tao, R.; Umar, M. Policy turmoil in China: A barrier for FDI flows? Int. J. Emerg. Mark. 2022, 17, 1617–1634. [Google Scholar] [CrossRef]
- Chishti, M.Z.; Alam, N.; Murshed, M.; Rehman, A.; Balsalobre-Lorente, D. Pathways towards environmental sustainability: Exploring the influence of aggregate domestic consumption spending on carbon dioxide emissions in Pakistan. Environ. Sci. Pollut. Res. 2022, 29, 45013–45030. [Google Scholar] [CrossRef] [PubMed]
- Lassoued, M. Control of corruption, microfinance, and income inequality in MENA countries: Evidence from panel data. SN Bus. Econ. 2021, 1, 1–19. [Google Scholar] [CrossRef]
- Jha, C.K. Financial reforms and corruption: Which dimensions matter? Int. Rev. Financ. 2020, 20, 515–527. [Google Scholar] [CrossRef]
- Khan, H.H.; Samargandi, N.; Ahmed, A. Economic Development, Energy Consumption, and Climate Change: An Empirical Account from Malaysia. In Natural Resources Forum; Blackwell Publishing Ltd.: Oxford, UK, 2021; Volume 45, pp. 397–423. [Google Scholar]
- Gruber, J.; Poterba, J. Tax Incentives and the Decision to Purchase Health Insurance: Evidence from the Self-employed. Q. J. Econ. 1994, 109, 701–733. [Google Scholar] [CrossRef]
- Qi, S.; Cheng, S.; Cui, J. Environmental and economic effects of China’s carbon market pilots: Empirical evidence based on a DID model. J. Clean. Prod. 2021, 279, 123720. [Google Scholar] [CrossRef]
- Wang, M.; Yang, Y.; Zhang, B.; Liu, M.; Liu, Q. How does targeted poverty alleviation policy influence residents’ perceptions of rural living conditions? A study of 16 villages in Gansu Province, Northwest China. Sustainability 2019, 11, 6944. [Google Scholar] [CrossRef]
- Attanasio, O.P.; Picci, L.; Scorcu, A.E. Saving, Growth, and Investment; A Macroeconomic Analysis Using a Panel of Countries. Rev. Econ. Stat. 2000, 82, 182–211. [Google Scholar] [CrossRef]
- Zhang, M.; Zhang, G.; Liu, H. Analysis of the impact of tourism development on the urban-rural income gap: Evidence from 248 prefecture-level cities in China. Asia Pac. J. Tour. Res. 2021, 26, 614–625. [Google Scholar] [CrossRef]
- Beck, T.; Levine, R.; Levkov, A. Big bad banks? The winners and losers from bank deregulation in the United States. J. Financ. 2010, 5, 1637–1667. [Google Scholar] [CrossRef]
- Wen, H.; Jiang, L. Promoting sustainable development in less developed regions: An empirical study of old revolutionary base areas in China. Environ. Dev. Sustain. 2023, 25, 1–26. [Google Scholar] [CrossRef]
- Khan, A.H. Aggregate consumption function and income distribution effect: Some evidence from developing countries. World Dev. 1987, 15, 1369–1374. [Google Scholar] [CrossRef]
Figure 1.
Old Revolutionary Areas in Jiangxi Province.

Figure 2.
Parallel trend of GDP per capita.
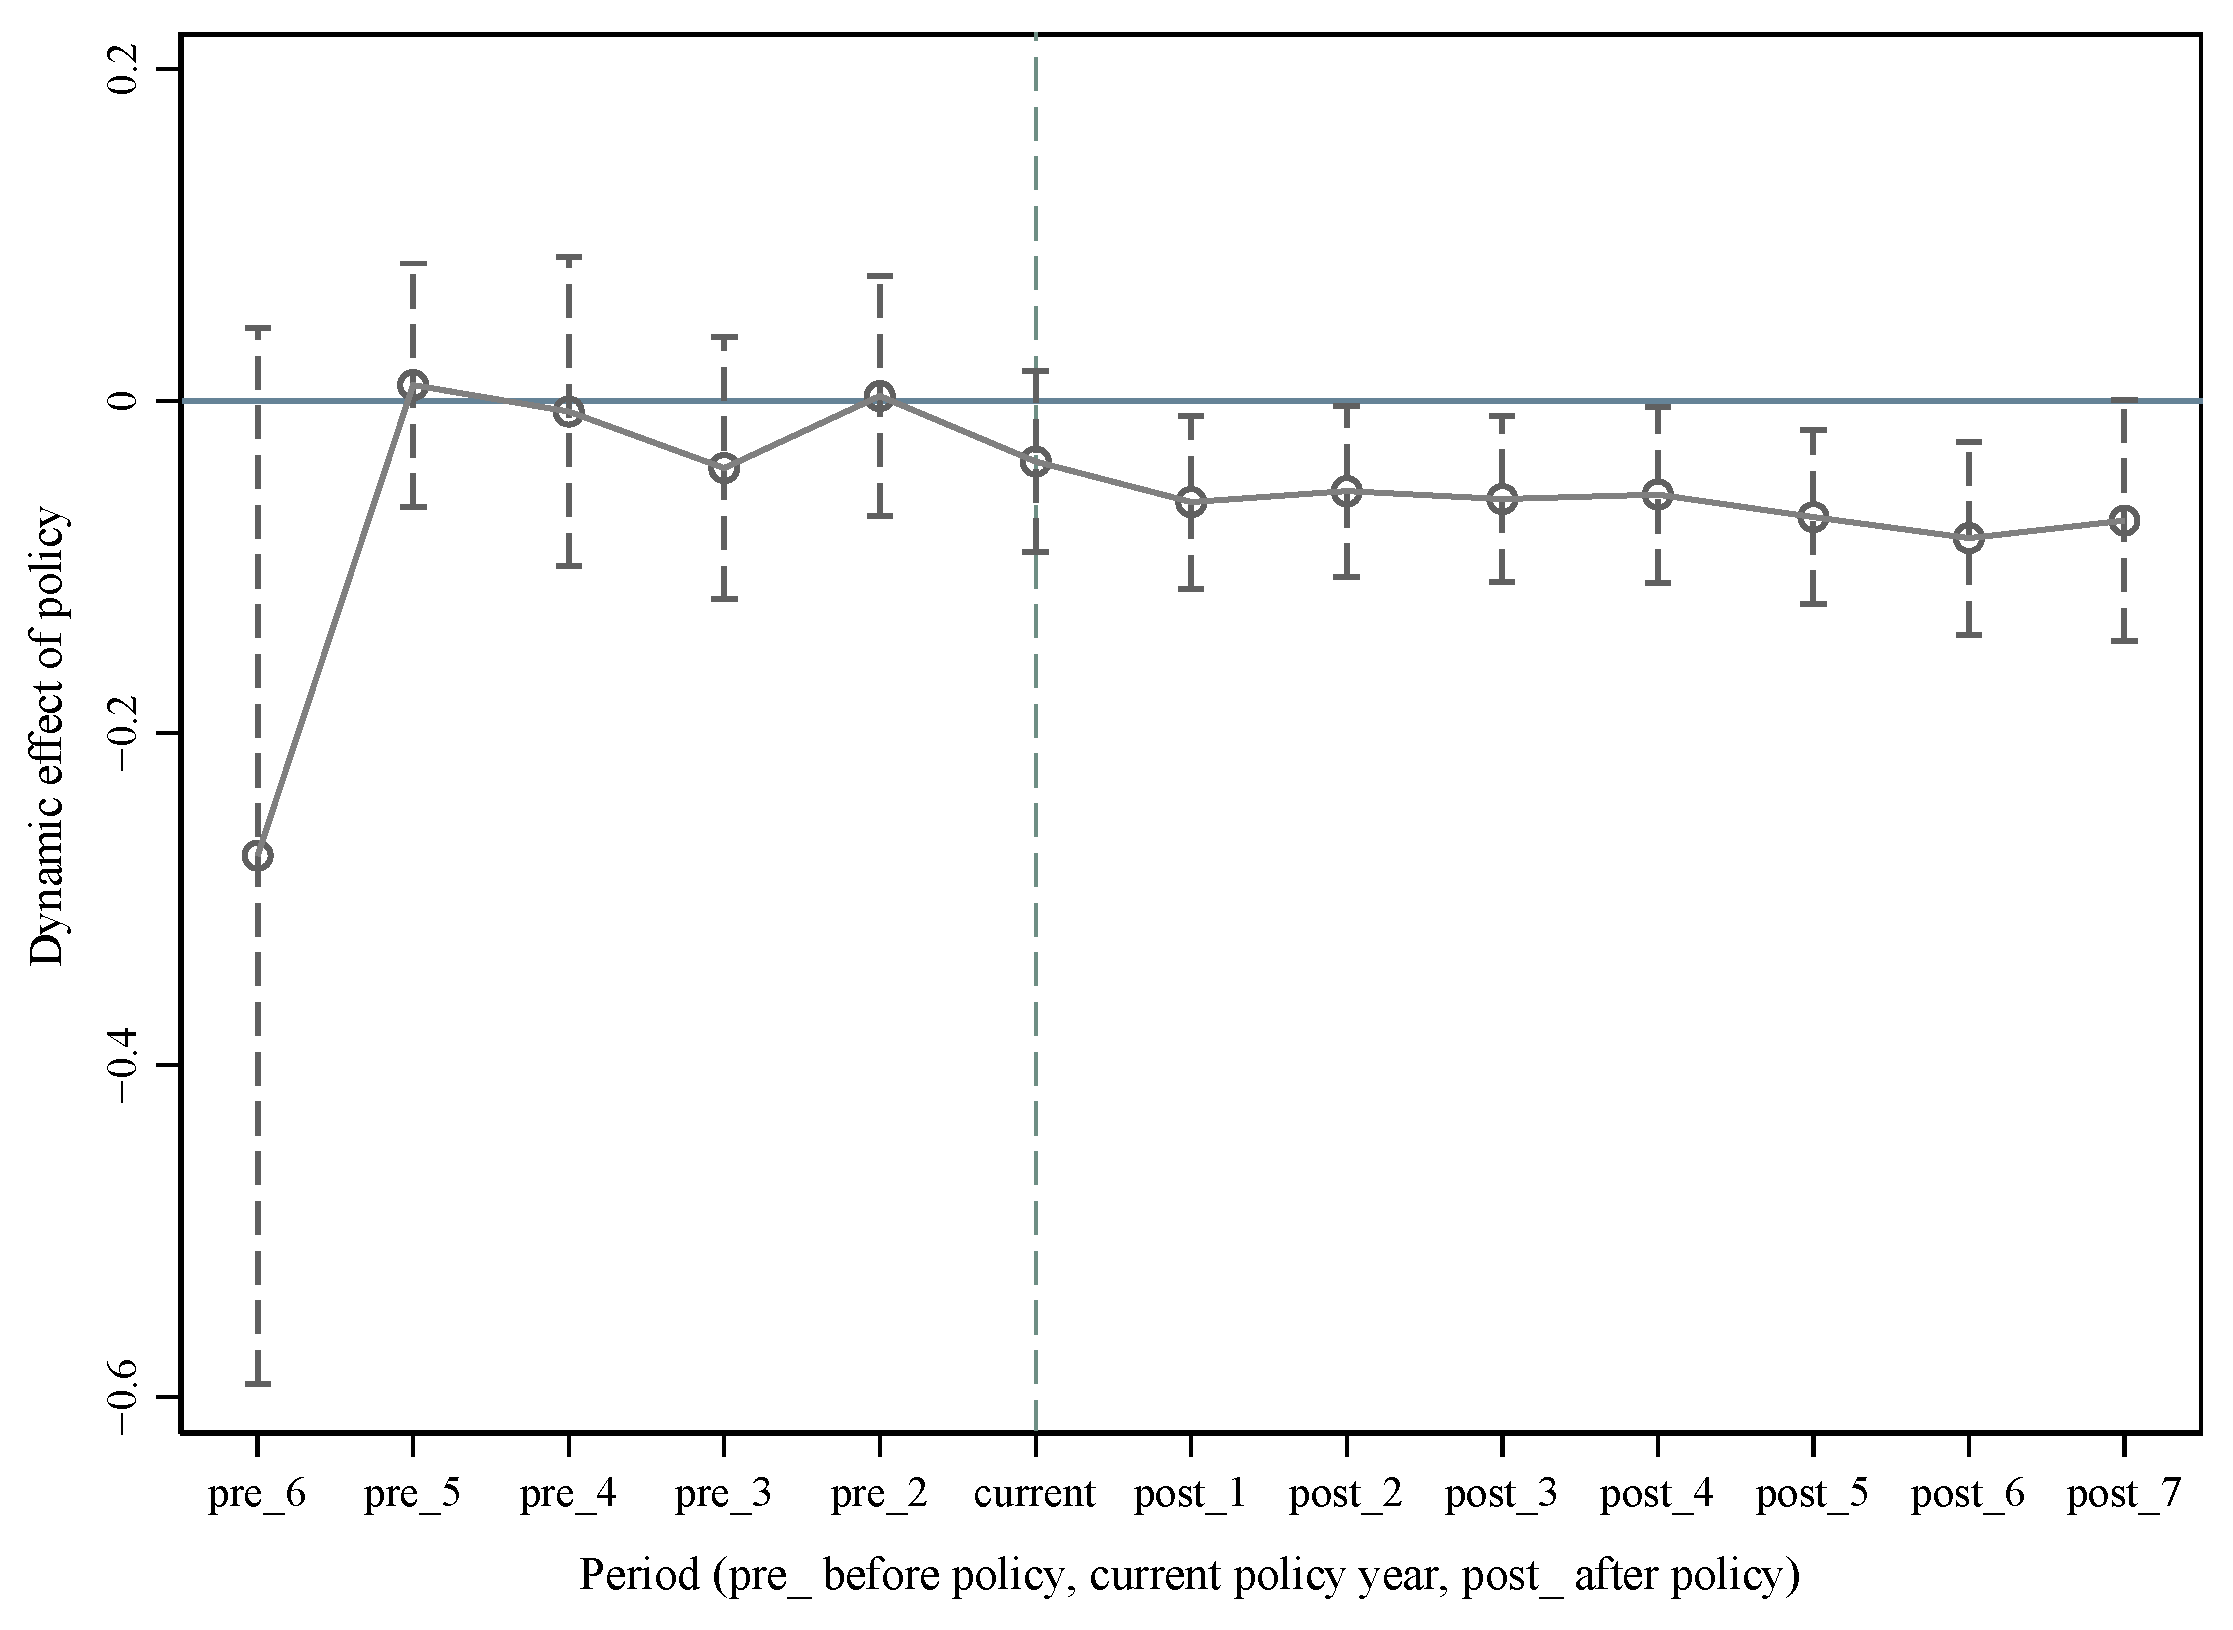
Figure 3.
Parallel trend of farmers’ income.

Figure 4.
Parallel trend of the proportion of farmers’ income in Jiangxi Province/Southern counties.
Figure 4.
Parallel trend of the proportion of farmers’ income in Jiangxi Province/Southern counties.

Table 1.
China’s Old Revolutionary Areas revitalization policies development planning.
| Date | Document | Main Content |
|---|---|---|
| 2012 | ⟪Opinions of the State Council on Supporting the Revitalization and Development of Gannan and Other Former Central Soviet Areas⟫ | Policy support and organizational leadership have been strengthened in terms of improving livelihood issues, infrastructure development, cultivation of special industries, ecological and environmental protection, public services, and optimization of institutional reforms. |
| 2013 | ⟪Implementation Programme of the Central State Organ and Related Units’ Oral Support to Gannan and Other Former Central Soviet Areas⟫ | 52 state organs and related units, counterpart support to pick up Ganzhou City, Ji’an City, and Fuzhou City, a total of 31 counties (cities and districts), including talent and technical support, business guidance support, and cracking development problems. |
| 2014 | ⟪Plan for the Revitalization and Development of the Former Central Soviet Area in Gan, Fujian, and Guangdong Province⟫ | Coordinate regional spatial layout; strengthen industrial system construction; basic design construction; increase ecological protection; promote social development and poverty alleviation and development; coordinate urban and rural development; improve regional cooperation mechanisms; and establish safeguards. |
| 2021 | ⟪Work Programme of the Central State Organs and Related Units in Support of Gannan and Other Former Central Soviet Areas in the New Era⟫ | The counterpart support units include 63 central state organs and related units, and the recipient areas include a total of 43 counties (cities and districts) under the jurisdiction of Ganzhou City, Ji’an City and Fuzhou City in Jiangxi Province and Longyan City and Sanming City in Fujian Province. |
| 2021 | ⟪Implementation Opinions on Further Promoting the Revitalization and Development of the Old Revolutionary Areas in Jiangxi in the New Era⟫ | Implementation of the rural revitalization strategy: development of modern agriculture, infrastructure construction, cultivation of advantaged industries, docking of regional strategies, upgrading of ecological quality, green transformation, enhancement of people’s well-being, and strengthening of policy protection. |
Table 2.
Definition of variables.
| Variable | Definition | Mean | Std. Dev |
|---|---|---|---|
| Explained Variables | |||
| GDP per capita | GDP per capita (logarithm) | 9.7440 | 0.6514 |
| Farmers’ income | Disposable income of farmers (logarithm) | 8.7367 | 0.5769 |
| Farmers’ income gap | The proportion of the disposable income of farmers in Jiangxi Province and ORA counties (districts and cities) | 1.2954 | 0.3569 |
| Core Explanatory Variables | |||
| Revitalization Policy | Dummy variable (0, 1) | 0.2166 | 0.4123 |
| Investment Level | Total fixed asset investment per capita (logarithm) | 8.0634 | 1.0570 |
| Resident saving level | Per capita residential savings deposit balance (taking logarithm) | 8.1358 | 0.7914 |
| Fiscal revenue level | Fiscal revenue per capita (logarithm) | 6.2621 | 0.8276 |
| Control Variables | |||
| Government Expenditure | Financial expenditure within the general public budget per capita (logarithm) | 7.0037 | 0.7786 |
| Industrialization level | Value-added of secondary industry per capita (logarithm) | 7.6302 | 0.7804 |
| Advanced industrial structure | Value-added of tertiary industry per capita (logarithm) | 7.3001 | 0.7517 |
| Opening up level | Amount of actual foreign capital utilized per capita (logarithm) | 5.2456 | 0.7431 |
Notes: Our sample covers data from 35 counties in Jiangxi Province between 2006 and 2019, and the sample includes 490 individual-year observations.
Table 3.
Descriptive statistics of main variables.
| Variables | Overall | Experimental Group | Control Group | ||
|---|---|---|---|---|---|
| 2006–2019 | 2006–2011 | 2013–2019 | 2006–2011 | 2013–2019 | |
| Mean | Mean | Mean | Mean | Mean | |
| GDP per capita (yuan) | 21,321.41 (13.44%) | 10,639.54 (15.03%) | 26,718.43 (8.51%) | 11,721.08 (15.65%) | 32,846.64 (9.98%) |
| Farmers’ income (yuan) | 7443.16 (11.64%) | 3194.87 (9.42%) | 8704.51 (11.43%) | 4635.90 (11.29%) | 11,931.28 (8.53%) |
| Investment Level (million yuan) | 735,478.80 (19.59%) | 183,507.80 (24.03%) | 802,029.50 (11.19%) | 357,075.10 (23.23%) | 1,404,346.40 (12.22%) |
| Resident saving level (million yuan) | 672,497.10 (15.48%) | 311,073.20 (18.39%) | 988,522.90 (12.48%) | 302,079.90 (16.06%) | 1,015,485.23 (11.65%) |
| Fiscal revenue level (million yuan) | 103,138.20 (17.37%) | 37,435.03 (19.83%) | 122,271.40 (8.47%) | 44,290.53 (24.41%) | 184,250.60 (8.44%) |
| Government Expenditure (million yuan) | 210,521.60 (17.79%) | 86,178.32 (18.80%) | 311,021.60 (12.20%) | 93,670.78 (23.64%) | 320,784.41 (10.10%) |
| Industrialization level (million yuan) | 392,759.50 (13.94%) | 176,189.70 (19.31%) | 445,231.10 (5.39%) | 232,068.70 (21.18%) | 633,040.12 (7.39%) |
| Advanced industrial structure (million yuan) | 282,038.70 (14.80%) | 144,439.90 (14.57%) | 423,014.20 (11.76%) | 123,570.30 (14.10%) | 413,783.40 (12.83%) |
| Opening up level (million yuan) | 35,090.18 (9.10%) | 26,014.7 (2.37%) | 43,197.85 (10.37%) | 19,001.01 (10.47%) | 50,074.80 (10.72%) |
Notes: The average annual growth rates are reported in parentheses.
Table 4.
Standardized deviations of each variable before and after matching.
| Variable | Experimental Group | Control Group | Standardized Deviation (%) | Decrease (%) | T-Value | p-Value | |
|---|---|---|---|---|---|---|---|
| Revitalization Policy | U | 8.3234 | 7.9791 | 36.6 | 57.8 | 3.13 | 0.002 |
| M | 8.3519 | 8.4971 | −15.4 | −1.06 | 0.292 | ||
| Investment Level | U | 8.5817 | 7.9912 | 84.2 | 89.1 | 7.49 | 0.000 |
| M | 8.5513 | 8.6158 | −9.2 | −0.62 | 0.538 | ||
| Resident saving level | U | 6.6014 | 6.1521 | 64.6 | 81 | 5.31 | 0.000 |
| M | 6.5888 | 6.6743 | −12.3 | −0.93 | 0.352 | ||
| Fiscal revenue level | U | 7.5177 | 6.837 | 106.5 | 88.5 | 8.97 | 0.000 |
| M | 7.4759 | 7.5544 | −12.3 | −0.91 | 0.362 | ||
| Government Expenditure | U | 7.8139 | 7.5706 | 33.7 | 49.3 | 2.99 | 0.003 |
| M | 7.8331 | 7.9565 | −17.1 | −1.18 | 0.239 | ||
| Industrialization level | U | 7.7687 | 7.1482 | 94.7 | 90.3 | 8.4 | 0.000 |
| M | 7.7242 | 7.7846 | −9.2 | −0.69 | 0.488 | ||
| Advanced industrial structure | U | 5.4678 | 5.1736 | 41.6 | 80.8 | 3.82 | 0.000 |
| M | 5.4603 | 5.5169 | −8 | −0.61 | 0.543 |
Notes: In the equilibrium test of farmers’ income, U denotes Unmatched, which means before the match, and M denotes Matched, which means after the match.
Table 5.
Matching quality test of different matching methods.
| Matching Method | Pseudo-R2 | LR Statistic | Mean Value of Deviation (%) | Median Deviation |
|---|---|---|---|---|
| Before matching | 0.352 | 192.22 *** | 66 | 64.6 |
| Nearest Neighbor Matching Method | 0.013 | 3.73 | 4.2 | 4.2 |
| Caliper Matching Method | 0.007 | 1.67 | 6.6 | 7 |
| Kernel Matching Method | 0.012 | 3.5 | 11.9 | 12.3 |
Notes: *** denote significance at 1% levels.
Table 6.
Test of Farmers’ income effect of revitalization policy.
| Variable | (1): Economic Growth | (2): Farmers’ Income | (3): Farmers’ Income Gap | |||
|---|---|---|---|---|---|---|
| Coefficient | Standard Error | Coefficient | Standard Error | Coefficient | Standard Error | |
| Revitalization Policy | −0.0564 *** | 0.0167 | 0.130 *** | 0.0266 | −0.218 *** | 0.0442 |
| Investment Level | 0.0950 *** | 0.0317 | −0.0141 | 0.0506 | 0.0157 | 0.0840 |
| Resident saving level | −0.0625 * | 0.0331 | 0.361 *** | 0.0528 | −0.581 *** | 0.0877 |
| Fiscal revenue level | 0.0270 | 0.0416 | 0.0288 | 0.0664 | −0.0121 | 0.110 |
| Government Expenditure | 0.0666 ** | 0.0338 | −0.135 ** | 0.0539 | 0.221 ** | 0.0896 |
| Industrialization level | 0.431 *** | 0.0273 | 0.143 *** | 0.0435 | −0.233 *** | 0.0722 |
| Advanced industrial structure | 0.171 *** | 0.0164 | −0.0196 | 0.0262 | 0.0226 | 0.0435 |
| Opening up level | −0.0161 | −0.0161 | 0.0922 *** | 0.0256 | −0.153 *** | 0.0426 |
| Constant | 4.339 *** | 0.3940 | 4.623 *** | 0.629 | 6.601 *** | 1.044 |
| Time Effect | Yes | Yes | Yes | |||
| Regional effects | Yes | Yes | Yes | |||
| R2 | 0.990 | 0.9779 | 0.5222 | |||
Notes: *, **, and *** denote significance at different levels (10%, 5%, and 1%, respectively).
Table 7.
Robustness tests for changing the estimation methods.
| Variable | (4): Economic Growth | (5): Farmers’ Income | (6): Farmers’ Income Gap | |||
|---|---|---|---|---|---|---|
| Coefficient | Standard Error | Coefficient | Standard Error | Coefficient | Standard Error | |
| Revitalization Policy | −0.0433 *** | 0.0109 | 0.0869 *** | 0.0185 | −0.164 *** | 0.0290 |
| Investment Level | 0.0153 | 0.0132 | 0.0144 | 0.0223 | −0.0222 | 0.0349 |
| Resident saving level | −0.0424 | 0.0261 | 0.275 *** | 0.0443 | −0.458 *** | 0.0692 |
| Fiscal revenue level | 0.0941 *** | 0.0297 | −0.0433 | 0.0504 | 0.102 | 0.0788 |
| Government Expenditure | 0.0179 | 0.0211 | 0.0328 | 0.0358 | 0.00190 | 0.0559 |
| Industrialization level | 0.479 *** | 0.0186 | 0.0724 ** | 0.0315 | −0.124 ** | 0.0493 |
| Advanced industrial structure | 0.198 *** | 0.0152 | −0.0236 | 0.0258 | 0.0380 | 0.0403 |
| Opening up level | 0.000709 | 0.0101 | 0.0495 *** | 0.0171 | −0.0865 *** | 0.0267 |
| Constant | 4.027 *** | 0.289 | 5.452 *** | 0.489 | 5.074 *** | 0.765 |
| Time Effect | Yes | Yes | Yes | |||
| Regional effects | Yes | Yes | Yes | |||
| R-squared | 0.994 | 0.980 | 0.378 | |||
Notes: The standard errors are reported in parentheses. **, and *** denote significance at different levels (5%, and 1%, respectively).
Table 8.
Robustness tests for changing the policy point in time.
| Variable | (7): Advanced to 2008 | (8): Advanced to 2009 | ||||
|---|---|---|---|---|---|---|
| Economic Growth | Farmers’ Income | Farmers’ Income Gap | Economic Growth | Farmers’ Income | Farmers’ Income Gap | |
| Revitalization Policy | −0.000100 (0.0139) | 0.00275 (0.0237) | −0.0235 (0.0375) | −0.00725 (0.0132) | 0.0160 (0.0225) | −0.0447 (0.0355) |
| Investment Level | 0.00573 (0.0132) | 0.0334 (0.0225) | −0.0572 (0.0356) | 0.00667 (0.0133) | 0.0315 (0.0227) | −0.0526 (0.0358) |
| Resident saving level | −0.0393 (0.0266) | 0.269 *** (0.0454) | −0.445 *** (0.0717) | −0.0384 (0.0266) | 0.267 *** (0.0454) | −0.440 *** (0.0717) |
| Fiscal revenue level | 0.0755 ** (0.0305) | −0.00495 (0.0521) | 0.0210 (0.0824) | 0.0743 ** (0.0300) | −0.00327 (0.0511) | 0.0235 (0.0807) |
| Government Expenditure | 0.0516 *** (0.0199) | −0.0344 (0.0340) | 0.125 ** (0.0537) | 0.0476 ** (0.0210) | −0.0262 (0.0357) | 0.105 * (0.0564) |
| Industrialization level | 0.474 *** (0.0190) | 0.0812 ** (0.0323) | −0.139 *** (0.0511) | 0.475 *** (0.0190) | 0.0797 ** (0.0323) | −0.136 *** (0.0511) |
| Advanced industrial structure | 0.204 *** (0.0154) | −0.0360 (0.0263) | 0.0616 (0.0415) | 0.204 *** (0.0154) | −0.0364 (0.0263) | 0.0627 (0.0414) |
| Opening up level | 0.0157 (0.0101) | 0.0201 (0.0172) | −0.0353 (0.0272) | 0.0133 (0.0105) | 0.0248 (0.0179) | −0.0446 (0.0283) |
| Constant | 3.929 *** (0.297) | 5.640 *** (0.506) | 4.781 *** (0.800) | −0.00725 (0.0132) | 5.608 *** (0.503) | 4.817 *** (0.794) |
| Time Effect | Yes | Yes | Yes | Yes | Yes | Yes |
| Regional effects | Yes | Yes | Yes | Yes | Yes | Yes |
| R-squared | 0.994 | 0.979 | 0.3326 | 0.994 | 0.979 | 0.3344 |
Notes: The standard errors are reported in parentheses. *, **, and ***, respectively, denote significance at different levels (10%, 5% and 1%).
Table 9.
Quantile regression results.
| Variable | (9): Economic Growth | (10): Farmers’ Income | (11): Farmers’ Income Gap | ||||||
|---|---|---|---|---|---|---|---|---|---|
| q25 | q50 | q75 | q25 | q50 | q75 | q25 | q50 | q75 | |
| Revitalization Policy | −0.0497 (0.0362) | −0.0560 ** (0.0262) | −0.0639 * (0.0351) | 0.0987 ** (0.0494) | 0.120 (0.0839) | 0.165 (0.228) | −0.271 * (0.140) | −0.209 *** (0.0800) | −0.170 * (0.0923) |
| Investment Level | 0.123 (0.0778) | 0.0967 * (0.0566) | 0.0630 (0.0756) | −0.0468 (0.0816) | −0.0244 (0.138) | 0.0222 (0.377) | −0.0426 (0.227) | 0.0264 (0.129) | 0.0689 (0.150) |
| Resident saving level | −0.0771 (0.0707) | −0.0633 (0.0513) | −0.0459 (0.0687) | 0.254 *** (0.0849) | 0.327 ** (0.146) | 0.479 (0.394) | −0.770 *** (0.238) | −0.547 *** (0.139) | −0.409 *** (0.157) |
| Fiscal revenue level | 0.0107 (0.0818) | 0.0260 (0.0594) | 0.0455 (0.0795) | 0.0172 (0.110) | 0.0252 (0.186) | 0.0417 (0.509) | −0.0268 (0.308) | −0.00938 (0.175) | 0.00133 (0.203) |
| Government Expenditure | 0.0620 (0.0781) | 0.0663 (0.0567) | 0.0718 (0.0759) | −0.120 (0.0957) | −0.130 (0.162) | −0.152 (0.442) | 0.236 (0.273) | 0.218 (0.155) | 0.208 (0.181) |
| Industrialization level | 0.438 *** (0.0729) | 0.431 *** (0.0529) | 0.423 *** (0.0709) | 0.124 * (0.0664) | 0.137 (0.112) | 0.163 (0.307) | −0.248 (0.185) | −0.230 ** (0.105) | −0.219 * (0.122) |
| Advanced industrial structure | 0.203 * (0.107) | 0.173 ** (0.0776) | 0.134 (0.104) | −0.0166 (0.0403) | −0.0187 (0.0682) | −0.0229 (0.186) | 0.0322 (0.113) | 0.0208 (0.0642) | 0.0137 (0.0747) |
| Opening up level | −0.00731 (0.0422) | −0.0156 (0.0307) | −0.0261 (0.0410) | 0.104 ** (0.0486) | 0.0958 (0.0823) | 0.0794 (0.224) | −0.130 (0.136) | −0.157 ** (0.0776) | −0.174 * (0.0901) |
| Time Effect | Yes | Yes | Yes | Yes | Yes | Yes | Yes | Yes | Yes |
| Regional effects | Yes | Yes | Yes | Yes | Yes | Yes | Yes | Yes | Yes |
Notes: The standard errors are reported in parentheses. *, **, and ***, respectively, denote significance at different levels (10%, 5% and 1%).
Table 10.
Mechanism Test of revitalization policy.
| Variable | Investment Level | Resident Saving Level | Fiscal Revenue Level | Government Expenditure | Industrialization Level | Advanced Industrial Structure | Opening Up Level |
|---|---|---|---|---|---|---|---|
| Revitalization Policy | 0.102 * (0.0550) | −0.0390 (0.0411) | 0.00613 (0.0240) | −0.262 *** (0.0541) | −0.0944 (0.0598) | −0.118 *** (0.0414) | −0.475 *** (0.0778) |
| policy | 1.396 *** (0.0367) | 1.138 *** (0.0227) | 1.244 *** (0.0179) | 1.448 *** (0.0342) | 1.019 *** (0.0507) | 1.133 *** (0.0277) | 0.936 *** (0.0709) |
| dt | −0.726 *** (0.212) | −0.0213 (0.156) | −0.0418 (0.114) | −0.146 (0.124) | −0.318 * (0.177) | 0.125 (0.151) | 0.315 (0.209) |
| Constants | 7.552 *** (0.132) | 7.504 *** (0.0922) | 6.309 *** (0.0791) | 5.561 *** (0.0728) | 7.207 *** (0.0969) | 6.628 *** (0.0896) | 4.692 *** (0.124) |
| Observations | 490 | 490 | 490 | 490 | 490 | 490 | 490 |
| R-squared | 0.7308 | 0.7435 | 0.7621 | 0.7898 | 0.7133 | 0.7223 | 0.6059 |
Notes: The standard errors are reported in parentheses. *, and ***, respectively, denote significance at different levels (10%, and 1%).
Disclaimer/Publisher’s Note: The statements, opinions and data contained in all publications are solely those of the individual author(s) and contributor(s) and not of MDPI and/or the editor(s). MDPI and/or the editor(s) disclaim responsibility for any injury to people or property resulting from any ideas, methods, instructions or products referred to in the content. |
© 2024 by the authors. Licensee MDPI, Basel, Switzerland. This article is an open access article distributed under the terms and conditions of the Creative Commons Attribution (CC BY) license (https://creativecommons.org/licenses/by/4.0/).
Share and Cite
MDPI and ACS Style
Liao, W.; Yuan, R.; Zhang, X.; Li, N.; Qiu, H. Balancing Acts: Unveiling the Dynamics of Revitalization Policies in China’s Old Revolutionary Areas of Gannan. Agriculture 2024, 14, 354. https://doi.org/10.3390/agriculture14030354
AMA Style
Liao W, Yuan R, Zhang X, Li N, Qiu H. Balancing Acts: Unveiling the Dynamics of Revitalization Policies in China’s Old Revolutionary Areas of Gannan. Agriculture. 2024; 14(3):354. https://doi.org/10.3390/agriculture14030354
Chicago/Turabian StyleLiao, Wenmei, Ruolan Yuan, Xu Zhang, Na Li, and Hailan Qiu. 2024. "Balancing Acts: Unveiling the Dynamics of Revitalization Policies in China’s Old Revolutionary Areas of Gannan" Agriculture 14, no. 3: 354. https://doi.org/10.3390/agriculture14030354
Note that from the first issue of 2016, this journal uses article numbers instead of page numbers. See further details here.