
Experimental Study on the Cleaning Performance of Hot Air Flow Cleaning Device

1
Key Laboratory of Modern Agricultural Equipment and Technology, Jiangsu University, Zhenjiang 212013, China
2
School of Agricultural Engineering, Jiangsu University, Zhenjiang 212013, China
*
Author to whom correspondence should be addressed.
Agriculture 2023, 13(9), 1828; https://doi.org/10.3390/agriculture13091828
Submission received: 21 August 2023
/
Revised: 12 September 2023
/
Accepted: 15 September 2023
/
Published: 18 September 2023
(This article belongs to the Section Agricultural Technology)
Abstract
:When processing wet rice, the efficiency of the combine harvester diminishes due to the heightened surface water content of the paddy. To address this, a hot air flow cleaning apparatus was engineered, and the effects of its operational parameters on cleaning performance were investigated. Outlet temperature, fan speed, louver sieve temperature, louver sieve inclination, and eccentric wheel speed were selected as experimental factors, and a single-factor test was carried out, with cleaning loss rate and impurity rate as test indexes. The results of the single-factor test show that louver sieve inclination and eccentric wheel speed had no obvious influence on the cleaning loss rate or impurity rate. The cleaning loss rate decreased with the increase in outlet temperature and louver sieve temperature but increased with the increase in fan speed. The cleaning impurity rate increased with the increase in outlet temperature and louver sieve temperature but decreased with the increase in fan speed. Based on the results of the single-factor test, a central composite rotatable test was adopted to attain the optimal operation parameters of the hot air flow cleaning equipment. Parameters like outlet temperature, fan speed, and louver sieve temperature were established as test factors, with the loss and impurity rates chosen as the evaluation metrics. Optimization using response surface methodology yielded the following parameters: an outlet temperature of 40.7 °C, a fan speed of 1300 rpm, and a louver sieve temperature of 50 °C. Under these conditions, the loss rate was observed to be 0.75% and the impurity rate stood at 1.75%. These findings can guide the design of cleaning mechanisms and the determination of operational parameters.
1. Introduction
Rice represents a significant grain crop, boasting the largest cultivation area in China [1,2]. In southern China, rice harvesting predominantly occurs between July and October. During this period, the moisture content of rice, on a wet basis, typically ranges be-tween 18% and 36% [3]. Concurrently, the moisture content of rice stalks can escalate to 75%, leading to a reduction in the cleaning efficiency of combine harvesters. Rice harvesting is the process of collecting the mature rice crop from the field, which consists of cutting, transferring, threshing, and cleaning. Rice combine harvesters combine all traditional activities, from cutting to hauling, into one machine by cutting the crop and feeding it to a threshing mechanism. Threshed grains are cleaned and discharged into a bulk wagon or directly into bags, whereas straw is usually discharged behind the machine in a windrow [4]. Upon threshing, rice mixtures falling from the drum to the cleaning screen often exhibit a liquid-coated surface. Consequently, energy dissipation upon wet particle collision is heightened relative to dry particles. The air flow, previously adequate for dispersing these threshed rice mixtures, becomes insufficient, leading to increased agglomeration among rice mixture components.
In order to reduce the adhesion of threshed wet rice mixtures on the screen surface, Chen et al. [5] studied the effect of the temperature of the shaking plate on the desorption rate of the threshed wet rice mixtures. The results showed that when the shaking plate was heated at 40 °C and the operating parameters of vibration frequency and amplitude were set to 6 Hz and 40 mm, respectively, the desorption rate exceeded 65%. Chen et al. [6] also investigated the effects of linear vibration, circular vibration, and reciprocating vibration on the desorption performance of the threshed wet rice mixtures. The results showed that the peak value of the central acceleration of the working face of the linear vibration was significantly higher than that of the circular vibration and reciprocating vibration, so the desorption effect of the linear vibration was the best. It was concluded that the adhesive mass could be rapidly reduced by increasing the vibration frequency. Furthermore, Chen et al. [7] studied the influence of vibration amplitude, vibration frequency, and vibration angle on the interface adhesion characteristics of threshed rice mixtures with high humidity. Through an orthogonal test, it was concluded that the optimal parameter combination was a 50 mm amplitude, a 7 Hz vibration frequency, and a 50° vibration angle. Xu et al. [8] applied the laser-modified surface to the vibrating screen of a rape harvester, and the test proved that the non-smooth screen surface had a remarkable viscosity-reducing and -desorbing effect and had strong stability and applicability. However, the processing technology of the non-smooth screen surface is complicated and the production cost is high. Ma et al. [9] studied the microscopic mechanism of reducing rapeseed adhesion via a bionic sieve with non-smooth protrusions. The results showed that the contact between the fine threshed rape material and the non-smooth sieve surface was reduced, so the adhesion of wet rape to the sieve surface could have been diminished.
Previous investigations have demonstrated that the adhesion of wet particles to the screen surface can be reduced by a heat sieve or surface-modified screen. However, the relationship between the cleaning performance of wet rice and hot air flow has not yet been analyzed.
In order to improve the cleaning quality of a combine harvester, Hubner [10] designed a rotary cleaning unit, and Rothaug et al. [11] invented a circular oscillating grain-cleaning unit and compared it with a standard linear oscillating cleaning section. Ren et al. [12] analyzed the two-phase flow law of air and debris particles in the threshing cleaning diverter by employing the two-phase flow mechanics theory, and the kinematic differential equation of debris particle flow was established. Dilin et al. [13] developed and applied a computational model using the k-ε turbulence model to predict flow separation at the volute tongue of two radial-flow fan volutes and to recommend design improvements for the volute. Wang et al. [14] integrated the analysis of the vibrating screen mechanism, the motion analysis of the ejector on the screen, and the optimization of the mechanism parameters to create a virtual design of the vibrating screen. Tong et al. [15] improved the single-duct fan-cleaning device through three-dimensional numerical simulation. Three factors, including fan speed, fan incidence angle, and louver sieve inclination, were orthogonally optimized for the improved cleaning device, and the influence of each factor on the air flow field were analyzed. The optimal parameter combination was obtained: When the fan incidence angle was 30°, the louver sieve inclination was 40°, and the fan speed was 1900 r/min, it was more conducive to high load and high-efficiency cleaning. As cited in Srivastava et al. [16], the influence of the lip angles on the cleaning shoe performance was investigated. Design parameters such as air volume and oscillation frequency were optimized. Miu [17] introduced a mathematical model of grain segregation and separation over the screen length. The theory points out a bi-dimensional function that describes the vertical grain distribution within any longitudinal cross-section of the material layer. Previous studies have mainly studied the influence of the working parameters of the cleaning device on the cleaning process of dry rice, but investigations on the cleaning performance of wet rice have not yet been carried out.
The purpose of this paper is to develop a hot air flow cleaning device and obtain the optimal combination of operational parameters to improve the cleaning performance of the rice combine harvester. Five factors, including outlet temperature, fan speed, louver sieve temperature, louver sieve inclination, and eccentric wheel speed, were taken as test factors in the single-factor test, and the cleaning loss rate and impurity rate were selected as test indexes. Factors that have significant impact on cleaning performance were identified through analysis of variance (ANOVA). The mathematical model of cleaning performance and test factors was established, and the optimal combination of working parameters was obtained through response surface analysis. The results of the study can be used as theoretical guidance for the parameter optimization of the cleaning units of combine harvesters.
2. Materials and Methods
2.1. Hot Gas Flow Cleaning Device and Working Principle
The hot air flow cleaning device is composed of a multi-duct cleaning fan, a heating fan, a double-layer vibrating screen, and so on, as shown in Figure 1. The air flow rate of the multi-duct cleaning fan is 10,332 m3/h, and its specific structure and working parameters can be found in the literature [18]. An electric heater with a power of 80 kW and a 4–72 4.5 A centrifugal fan were selected to form the heating fan to provide hot air flow on both sides of the multi-duct cleaning fan. The heating fan and the multi-duct cleaning fan are connected by two high-temperature-resistant hoses. Because the air flow from the centrifugal fan through the heater and hose generates one-way resistance, resulting in airflow velocity loss, the airflow flow rate of the heating centrifugal fan is 11,852 m3/h, which is greater than that of the multi-duct cleaning fan. Polyurethane foam insulation materials are attached around the high-temperature-resistant hoses and the cleaning room wall to reduce the heat dissipation of the hot air flow. A 50 K3950 temperature sensor (Shenzhen Minchuang Electronics Co., Ltd., Shenzhen, China) is used to measure the airflow temperature of the upper outlet center of the multi-duct cleaning fan, and the thermostat is used to adjust the hot air flow temperature.
The double-layer vibrating screen includes heating sieves (the upper sieves) and woven sieves (the lower sieves), whose angle can be adjusted through the threaded rod and nuts, which can be seen in Figure 2a. The heating screen has a “sandwich” structure that includes the louver sieve, the heating film, and the cover plate, as seen in Figure 2b. The cover plate is 0.5 mm thick and the size of the heating film is slightly smaller than the louver sieve, with a length of 70 centimeters and a width of 3 centimeters. The heating film is located between the louver sieve and the cover plate that prevents the threshed rice material from directly contacting the high-temperature heating film and then causing danger. The temperature of the heating film is regulated by the ED330L thermostat (Shangfang Instrument Meter Co., Ltd., Zhongshan, China), and the louver sieve temperature can be controlled. Due to the heat loss during heat exchange between the heating film and the louver sieve, the actual temperature of the louver screen surface needs to be calibrated. The relationship between the average temperature of the louver screen surface and the temperature of the heating film after measurement is shown in Table 1. The vibration frequency of the cleaning screen is regulated by the eccentric wheel speed, which is controlled through the variable frequency 1LE0001-1BB2 motor (rated power 4 kW, rated speed 1445 rpm. SIEMENS AG, Munich, Germany).
2.2. Experimental Materials
When the relative humidity in the field was as high as 77.4%, the rice was harvested by hand. Then, it was brought back to the laboratory to be threshed. The indoor temperature and humidity were 19.4 °C and 58.2%, respectively. The self-made threshing device was used for threshing, and the threshed wet rice mixtures with different mass fractions were obtained. The basic characteristics of the threshed rice materials were measured, as shown in Table 2.
2.3. Single-Factor Test Method
In order to explore the influence of the operating parameters of the hot air flow cleaning device on the cleaning performance, the loss rate and the impurity rate were taken as test indexes, and their calculation formulas are shown as Equations (1) and (2).
where P1 is the cleaning loss rate and P2 is the impurity rate. m1 is the grain mass discharged from the tail of the cleaning room, g; m is the total mass of grain fed to the cleaning room, g; m2 is the mass of impurities discharged by the transport grain tube, g; and mr is the collected total mass of grains and impurities discharged by the transport grain tube, g.
The single-factor test was carried out with the outlet temperature, fan speed, louver sieve temperature, louver sieve inclination, and eccentric wheel speed as test factors. The test levels and factors are shown in Table 3. Before the test, the threshed wet rice mixtures were mixed according to the mass fraction in Table 2. Due to the influence of the measurement accuracy and human factors, the sample quality and water content of each configuration were not the same as those in Table 2. However, the quality error was not higher than 1%, and the water content error was not higher than 3% in any sample preparation. Since the mass content of grains with small tails and blight grains was small, their influence was not considered in this paper, so the mass fraction of full grains became 81.51%. The threshed wet rice mixtures were then placed in the feed hopper at a feeding rate of 5 kg/s and then moved backward under the vibration of the grain pan. A tarpaulin was placed at the tail of the test bench to gather the mixtures discharged from the cleaning room. Afterwards, these mixtures were manually screened, and rice grains and impurities were weighed separately.
2.4. Data Processing
The software of SPSS27 was used for the single-factor analysis, and Design Export 8 was used for the orthogonal experiment. The orthogonal experiment method was introduced later in the multi-factor experiment.
3. Results and Discussion
3.1. Results of Single-Factor Test Outlet Temperature
- Outlet temperature
The data pertaining to the loss rate and the impurity rate at a fan speed of 1200 rpm, a louver sieve temperature of 40 °C, a louver sieve surface inclination of 55°, and an eccentric wheel speed of 290 rpm are presented in Table 4.
An analysis of Table 4 and Figure 3 revealed that the grain loss rate decreased as the outlet temperature increased, whereas the impurity rate exhibited an inverse relationship, increasing with wind temperature. When the outlet temperature was 20 °C, the cleaning loss rate was high. The reason is that when the hot air flow temperature was low, the water content on the surface of the threshed wet rice materials was high, and the wet particles had greater energy dissipation after collision with each other and the screen surface. It was easy for impurities to adhere to the screen surface, and the probability of seed penetration was reduced. When the temperature controller was adjusted, the outlet temperature of the cleaning fan gradually increased to 44 °C, the grain loss rate decreased by 43.8%, and the impurity rate increased by 20.5%. When the outlet temperature increased to 52 °C, the average grain loss rate decreased from 0.77% at 44 °C to 0.55%. The average impurity rate increased from 2.12% at 44 °C to 2.23%, increasing by 5.2%. With the increase in airflow temperature at the outlet, the heat and mass transfer rate between the threshed wet rice mixtures and the hot air flow increased, and the surface water content and surface free energy of the impurities decreased, which made it difficult for them to adhere to the screen surface. As a result, the threshed mixtures could be separated by the hot airflow, and the probability of rice seeds and impurities passing through the cleaning screen increased.
Analysis of variance (ANOVA) was performed for the test results, which are shown in Table 5. There was a significant effect of the outlet temperature on the grain loss rate and the impurity rate (p < 0.05).
- 2.
- Fan Speed
The loss rate and the impurity rate at an outlet temperature of 36 °C, a louver sieve temperature of 40 °C, a louver sieve inclination of 55°, and an eccentric wheel speed of 290 rpm are presented in Table 6.
Figure 4 illustrates that as the fan speed increased, the loss rate exhibited an increasing trend, whereas the impurity rate exhibited a decline. Specifically, when the fan speed surged from 1000 rpm to 1400 rpm, the loss rate escalated from 0.88% to 1.28%, marking an increase of 45.5%. Conversely, the impurity rate diminished by 28.8%, moving from 2.22% to 1.58%. This behavior can be attributed to the fact that at lower speeds, the velocity of the hot gas flow remains limited. Consequently, the convective heat transfer coefficient between the surface liquid of the threshed wet rice mixtures and the hot gas is minimized, causing a significant concentration of these mixtures at the forefront of the vibrating screen. This leads to the mixtures being more susceptible to aggregation upon collision and, hence, becoming less amenable to dispersion by the air flow. The outcome is a heightened impurity rate. However, with the augmentation in fan speed, there was a corresponding increase in the hot air flow’s velocity. This enhanced the convective heat transfer rate, facilitating easier dispersion of the threshed wet rice materials due to the combined effects of the cleaning screen surface and the hot air flow. As a result, the movement velocity of the rice seeds along the screen surface accelerated, boosting the likelihood of both seeds and impurities being evacuated from the cleaning chamber. This translated into a heightened grain loss rate and a diminished impurity rate. A similar influence of the fan speed on the impurity rate during rapeseed cleaning was observed [19]. Analysis of variance (ANOVA) was performed on the test results, which are shown in Table 7. There was significant effect of fan speed on the grain loss rate and the impurity rate (p < 0.05).
- 3.
- Louver Sieve Temperature
The results of the grain loss rate and the impurity rate at an outlet temperature of 36 °C, a fan speed of 1200 rpm, a louver sieve surface inclination of 55°, and an eccentric speed of 290 rpm are presented in Table 8.
As can be seen from Table 8 and Figure 5, with the increase in louver sieve temperature, the loss rate decreased and the impurity rate increased gradually. When the surface temperature was increased to 60 °C, the loss rate decreased by 47.8% and the impurity content increased by 37.5%. The reason is that when the louver sieve temperature was low, the heat and the mass transfer rate between the threshed wet rice mixtures and the sieve surface were relatively slow. Then, it was easy for the wet fine particles to stick to the screen surface after colliding, reducing the effective cleaning area of the cleaning screen. Therefore, it was difficult for the mixtures to disperse on the screen surface, and the high rate of loss was caused by the seeds being carried out of the machine. With the increase in the louver screen temperature, it was easy for the wet fine particles to desorb from the screen surface, and the sieve penetration probability of grains and impurities increased.
Analysis of variance (ANOVA) was performed for the test results, which are shown in Table 9. There was significant impact of the louver sieve temperature on the grain loss rate and the impurity rate (p < 0.05).
- 4.
- Louver Sieve Inclination
The data pertaining to the loss rate and the impurity rate at an outlet temperature of 36 °C, a fan speed of 1200 rpm, a louver sieve temperature of 40 °C, and an eccentric wheel speed of 290 rpm can be found in Table 10.
Based on the data in Table 10 and the observations in Figure 6, a trend emerged: As the inclination of the louver sieve increased, the loss rate initially declined and subsequently increased, whereas the impurity rate exhibited a consistent increase. Specifically, as the louver sieve inclination progressed from 45° to 55°, the loss rate dropped from 1.15% to 1.03%, representing a reduction of 10.4%. Conversely, the impurity rate ascended from 1.79 to 2.01, marking a 12.3% increase. This trend can be attributed to the fact that an increased inclination permits greater volumes of hot air to engage in heat exchange with the threshed wet rice materials on the screen surface. Consequently, wet particles undergo effective stratification due to the combined effects of the hot air flow and the heated screen. Larger grains, especially those with elongated stalks, are positioned in the lower strata, enhancing their penetration probability and thereby reducing the grain loss rate while escalating the impurity rate. However, beyond an inclination of 55°, the penetration likelihood of stems and lightweight impurities increases, contributing to a perpetual increase in the impurity rate. Simultaneously, the contact area between the threshed materials and the cleaning screen diminishes, leading to reduced dispersion and an uptick in the grain loss rate. Analysis of variance (ANOVA) was performed for the test results, which are shown in Table 11. There was no remarkable impact of the louver sieve inclination on the grain loss rate or impurity rate (p > 0.05).
- 5.
- Eccentric Wheel Speed
The cleaning loss rate and the impurity rate results under conditions of a hot air flow temperature of 36 °C, a fan speed of 1200 rpm, a louver sieve temperature of 40 °C, and a louver sieve surface inclination of 55° are detailed in Table 12.
As can be seen from Figure 7 and Table 12, with the increase in eccentric wheel speed, the loss rate first decreased and then increased, whereas the impurity rate first increased and then decreased. When the eccentric wheel speed increased from 250 rpm to 310 rpm, the loss rate was reduced by 22.1%. The impurity rate increased by 15.5%, which was due to the strengthening of the heat transfer efficiency between the adhesive and the heating screen surface, and then the wet adhesive could be removed from the screen surface. In addition to that of grains, the probability of other threshed wet rice materials passing through the cleaning screen increased. As the eccentric wheel speed increased to 330 rpm, the grain loss rate increased by 26.3% and the impurity rate decreased by 12% compared with the condition of 310 rpm. The reason is that as the eccentric wheel speed continued to rise, the jumping and rolling of the wet particles on the screen were too violent. Therefore, the collision between the threshed wet rice mixtures intensified, and the residence time of the grains and impurities on the screen was short due to their rapid backward movement.
Analysis of variance (ANOVA) was performed on the test results, which are shown in Table 13. There was no remarkable effect of the eccentric wheel speed on the grain loss rate or the impurity rate (p > 0.05).
3.2. Results of Muti-Factor Experiment
The results of the ANOVA of the single-factor tests showed that the louver sieve inclination and the eccentric wheel speed had relatively insignificant influence on the loss rate and the impurity rate. Therefore, the outlet temperature (x1), fan speed (x2), and louver sieve temperature (x3) were selected as test factors in this paper, and the grain loss rate (P1) and the impurity rate (P2) were taken as indicators to design an orthogonal experiment, as shown in Table 14.
The protocol and the results of the orthogonal test are summarized in Table 15:
Analysis of variance (ANOVA) was performed on the test results to test whether the model was significant. The response surface method (RSM) is a methodology based on the suitability of experimental data to a polynomial equation, which can be well applied in situations where multiple variables influence an answer [20,21,22]. Hence, the impact of the interaction terms of the independent variables x1, x2, and x3 on test indicators P1 and P2 was analyzed by RSM. The results of the ANOVA are shown in Table 16:
As shown in Table 16, the p-values of the regression models of indicators P1 and P2 were all less than 0.0001, indicating that the regression model was significant and that the outlet temperature x1, the fan speed x2, and the louver sieve temperature x3 had extremely significant effects on the loss rate and the impurity rate. The interaction terms x1x3, x2x3, and x12 had significant effects on the cleaning loss rate, whereas the other terms were not significant. The interaction terms x1x3 and x22 had a remarkable impact on the cleaning impurity rate, whereas the other items were not significant. By comparing the F value of each factor, it was concluded that the order of influence on the cleaning loss rate from strong to weak is outlet temperature, fan speed, and louver sieve temperature. The order of influence on the cleaning impurity rate from strong to weak is fan speed, louver sieve temperature, and outlet temperature.
After removing the insignificant regression coefficient items, the multiple regression model of each factor on the test indicators P1 and P2 was obtained as follows:
P1 = 1.11 − 0.37x1 + 0.31x2 − 0.16x3 − 0.23x1x3 − 0.31x2x3 + 0.13x12
P2 = 2.02 + 0.13x1 − 0.38x2 + 0.14x3 + 0.12x1x3 − 0.17x22
3.3. Response Surface Analysis
The contour graph for the grain loss rate as a function of various outlet temperatures and louver sieve temperatures is illustrated in Figure 8a. When the louver sieve temperature was constant, the cleaning loss rate decreased as the wind temperature increased. This is because as the outlet temperature increased, the number of liquid bridges between wet particles decreased, the threshed wet rice mixtures were more easily dispersed and stratified, and the probability of grains passing through the cleaning screen increased. When the outlet temperature was constant, the cleaning loss rate decreased with the increase in louver sieve temperature. This is because the surface energy decreased with the increase in louver sieve temperature and the energy loss of the threshed wet rice mixtures colliding with the cleaning sieve decreased. In addition, the temperature of the hot air flow reaching the screen surface increased with the increase in louver sieve temperature and the heat and mass transfer efficiency increased. Hence, the threshed wet rice material could be effectively separated and stratified, and the penetration probability of the grain also increased. The contour plot for the loss rate as a function of various fan speeds and louver sieve temperatures is shown in Figure 8b. When the louver sieve temperature was constant, the grain loss rate increased with the increase in fan speed. This is because as the fan speed increased, the hot air flow velocity increased and the migration velocity of the grain increased from pre-sieve to post-sieve, resulting in the growth of the grain loss rate.
The interaction rule of the outlet temperature and the louver sieve temperature on the cleaning impurity rate is shown in Figure 9. When the louver sieve temperature was constant, the cleaning impurity rate increased slightly with the increase in outlet temperature. This is because with the increase in outlet temperature, the evaporation rate of the surface water film increased, it was easy for the adhesion between wet particles to break, and the probability of impurities passing through the cleaning screen increased. When the outlet temperature of the cleaning fan was constant, the cleaning impurity rate increased with the increase in louver sieve temperature. This is because with the increase in louver sieve temperature, the threshed wet rice materials were easy to scatter after striking the sieve surface and the probability of impurities passing through the cleaning screen increased.
3.4. Parameter Optimization and Test Validation
To optimize the operational performance of the hot air flow cleaning device, the multi-objective optimization algorithm outlined in reference [23] was employed. The objectives and constraints for this optimization are detailed in Equation (5).
The model predictions yielded the following results: At an outlet temperature of 40.7 °C, a fan speed of 1300 rpm, and a louver sieve temperature of 50 °C, the grain loss rate was projected to be 0.75% and the impurity rate was estimated to be 1.75%. To validate the predictive accuracy of the regression model, bench tests were conducted under these specified optimal parameter conditions. The observed grain loss rate for the hot air flow cleaning unit was 0.79%, representing an error of 5.3%. The observed impurity rate was 1.62%, with an error of 7.4%. These discrepancies suggest that the model’s predictions align closely with the empirical bench test outcomes.
4. Conclusions
Aiming to solve the problem of the cleaning performance of cleaning devices at normal temperatures decreasing due to the high moisture content of the surface of threshed wet rice mixtures, a hot air cleaning apparatus was developed and the influence of different working parameters on the loss rate and the impurity rate was studied. The following conclusions were drawn:
- (1)
- The loss percentage of rice grains decreased with the increase in outlet temperature and louver sieve temperature but increased with the increase in fan speed. The cleaning impurity ratio increased with the increase in outlet temperature and louver sieve temperature but decreased with the increase in fan speed. The influence of the louver sieve inclination and the eccentric wheel speed on the cleaning loss rate and the impurity rate was not obvious.
- (2)
- Based on the central composite rotatable test, encompassing three factors at five levels, it was deduced that the influence hierarchy on the cleaning loss rate was, in descending order, outlet temperature, fan speed, and louver sieve temperature. In terms of the cleaning impurity rate, the sequence from most to least impactful was fan speed, louver sieve temperature, and outlet temperature. Noteworthy interaction effects were observed between the outlet temperature and the louver sieve temperature and between the fan speed and the louver sieve temperature concerning the average grain loss rate. Similarly, interaction effects between the outlet temperature and the louver sieve temperature affected the impurity rate.
- (3)
- Utilizing multi-objective parameter optimization of the test factors, the optimal parameter set for the hot air flow cleaning device was identified as an outlet temperature of 40.7 °C, a fan speed of 1300 rpm, and a louver sieve temperature of 50 °C. Under these conditions, the loss rate was registered at 0.75% and the impurity rate at 1.75%.
The results provide a theoretical basis for a combine harvester to clean high-moisture rice on rainy and foggy days. Further investigation will focus on field tests.
Author Contributions
T.Z. completed the draft writing and data analysis; Y.L. provided the project funds and proposed the development method; G.Y. provided experimental design software guidance and carried out the check of the paper. All authors have read and agreed to the published version of the manuscript.
Funding
This research was funded by [National Natural Science Foundation of China] grant number [51975257].
Institutional Review Board Statement
Not applicable.
Data Availability Statement
Exclude this statement.
Acknowledgments
The authors gratefully acknowledge the National Natural Science Foundation of China via grant. 51975257.
Conflicts of Interest
The authors declare no conflict of interest.
References
- Chai, X.Y.; Zhou, Y.; Xu, L.Z.; Li, Y.; Li, Y.M.; Lv, L.Y. Effect of guide strips on the distribution of threshed outputs and cleaning losses for a tangential-longitudinal flow rice combine harvester. Biosyst. Eng. 2020, 198, 223–234. [Google Scholar] [CrossRef]
- Wang, Q.R.; Mao, H.P.; Li, Q.L. Modelling and simulation of the grain threshing process based on the discrete element method. Comput. Electron. Agric. 2020, 178, 105790. [Google Scholar] [CrossRef]
- Gao, M. Simulation of Heat and Mass Transfer in Rice Kernel during Hot Air Drying Process. Master’s Thesis, Tianjin University of Science & Technology, Tianjin, China, 2017. [Google Scholar]
- Chandrajitha, U.G.; Gunathilakea, D.M.C.C.; Bandaraa, B.D.M.P.; Swarnasiria, D.P.C. Effects of combine harvesting on head rice yield and chaff content of long and short grain paddy harvest in Sri Lanka. Procedia Food Sci. 2016, 6, 242–245. [Google Scholar] [CrossRef]
- Cheng, C.; Fu, J.; Tang, X.L.; Chen, Z.; Ren, L.Q. Heating anti-adhesion experiments of jitter plate of rice harvesting machinery. Trans. Chin. Soc. Agric. Mach. 2019, 50, 110–118. [Google Scholar]
- Cheng, C.; Fu, J.; Tang, X.L.; Chen, Z.; Ren, L.Q. Effect of vibration mode on interface adhesion law of rice threshed mixtures. J. Jilin Univ. (Eng. Technol. E.) 2019, 49, 1228–1235. [Google Scholar]
- Cheng, C.; Fu, J.; Chen, Z.; Ren, L.Q. Influence of vibration parameters of harvester vibrating screen on adhesion characteristics of extractives with different humidity. Trans. Chin. Soc. Agric. Eng. 2019, 35, 29–36. [Google Scholar]
- Xu, L.Z.; Ma, Z.; Li, Y.M. Wettability of rape cleaning screen surface by laser-texture. Trans. Chin. Soc. Agric. Mach. 2011, 42, 168–171. [Google Scholar]
- Ma, Z.; Li, Y.M.; Xu, L.Z. Micro flow field on adjacent screen of bionic nonsmooth cleaning screen. Trans. Chin. Soc. Agric. Mach. 2011, 42, 74–77+79. [Google Scholar]
- Hubner, R. Entwicklung Eines Modells zur Auslegung Einer Rotierenden Reinigungseinrichtung im Mähdrescher. Ph.D. Thesis, TU Dresden, Dresden, Germany, 1997. [Google Scholar]
- Rothaug, S.; Wacker, P.; Yin, W.; Kutzbach, H.D. Capacity increase of cleaning units by circular oscillation. In Proceedings of the International Conference on Crop Harvesting and Processing, Louisville, KY, USA, 9 February 2003. [Google Scholar]
- Ren, S.G.; Xie, F.P.; Wang, X.S.; Liu, D.W.; Li, X.; Chen, L.Y. Gas-solid two-phase separation operation mechanism for 4LZ-0.8 rice combine harvester cleaning device. Trans. Chin. Soc. Agric. Eng. 2015, 31, 16–22. [Google Scholar]
- Dilin, P.; Sakai, T.; Wilson, M.; Whitfield, A. A computational and experimental evaluation of the performance of a centrifugal fan volute. J. Power Energy 1998, 212, 235–246. [Google Scholar] [CrossRef]
- Wang, Z.H.; Chen, C.Y. Virtual design of vibrating sieve of combine harvester based on ADAMS. Trans. Chin. Soc. Agric. Mach. 2003, 34, 53–56. [Google Scholar]
- Tong, S.G.; Shen, Q.; Tang, N.; Jia, Y.P.; Cong, Y.F.; Gu, W. Numerical simulation and optimization experiment of mixed flow field on longitudinal axial flow cleaning device. Trans. Chin. Soc. Agric. Mach. 2016, 47, 135–142. [Google Scholar]
- Srivastava, A.K.; Goering, C.E.; Rohrbach, R.P.; Buckmaster, D.R. Engineering Principles of Agricultural Machines; American Society of Agricultural and Biological Engineers (ASAE): St. Joseph, MI, USA, 2006. [Google Scholar]
- Miu, P.I. Stochastic modeling of separation process on combine cleaning shoe. In Proceedings of the International Conference on Crop Harvesting and Processing, Louisville, KY, USA, 9 February 2003. [Google Scholar]
- Liang, Z.W. Research on Design Method of Multi-Duct Cleaning Device and Cleaning Loss Monitoring and Control Technology. Ph.D. Thesis, Jiangsu University, Zhenjiang, China, 2018. [Google Scholar]
- Zhang, M.; Jin, C.Q.; Liang, S.N.; Tang, Q.; Wu, C.Y. Parameter optimization and experiment on air-screen cleaning device of rapeseed combine harvester. Trans. Chin. Soc. Agric. Eng. 2015, 31, 8–15. [Google Scholar]
- Hundtoft, E.B. Establishing the effects of post-harvest treatment on fresh market papayas by response surface methodology. J. Agric. Eng. Res. 1971, 16, 343–352. [Google Scholar] [CrossRef]
- Mirzazadeh, A.; Abdollahpour, S.; Hakimzadeh, M. Optimized Mathematical Model of a Grain Cleaning System Functioning in a Combine Harvester using Response Surface Methodology. Acta Technol. Agric. 2022, 25, 20–26. [Google Scholar] [CrossRef]
- Bulduk, I. Optimization of extraction techniques and RP-HPLC analysis of anti-parkinson drug levodopa from flowers of Vicia faba L. Acta Chromatogr. 2020, 32, 281. [Google Scholar] [CrossRef]
- Liu, D.W.; Lu, W.; Xie, F.P.; Ren, S.G.; Wang, X.S.; Chen, L.Y. Analysis of grain separation efficiency in cyclone cleaning cylinder of rice effluent. Chin. J. Agric. Sci. Technol. 2017, 19, 55–65. [Google Scholar]
Figure 1.
Schematic diagram of the hot air flow cleaning test bench. 1. Feed hopper. 2. Multi-duct cleaning fan. 3. High-temperature-resistant hose. 4. Grain transport tube. 5. Double-layer vibrating screen. 6. Electric heater. 7. Centrifugal fan.
Figure 1.
Schematic diagram of the hot air flow cleaning test bench. 1. Feed hopper. 2. Multi-duct cleaning fan. 3. High-temperature-resistant hose. 4. Grain transport tube. 5. Double-layer vibrating screen. 6. Electric heater. 7. Centrifugal fan.
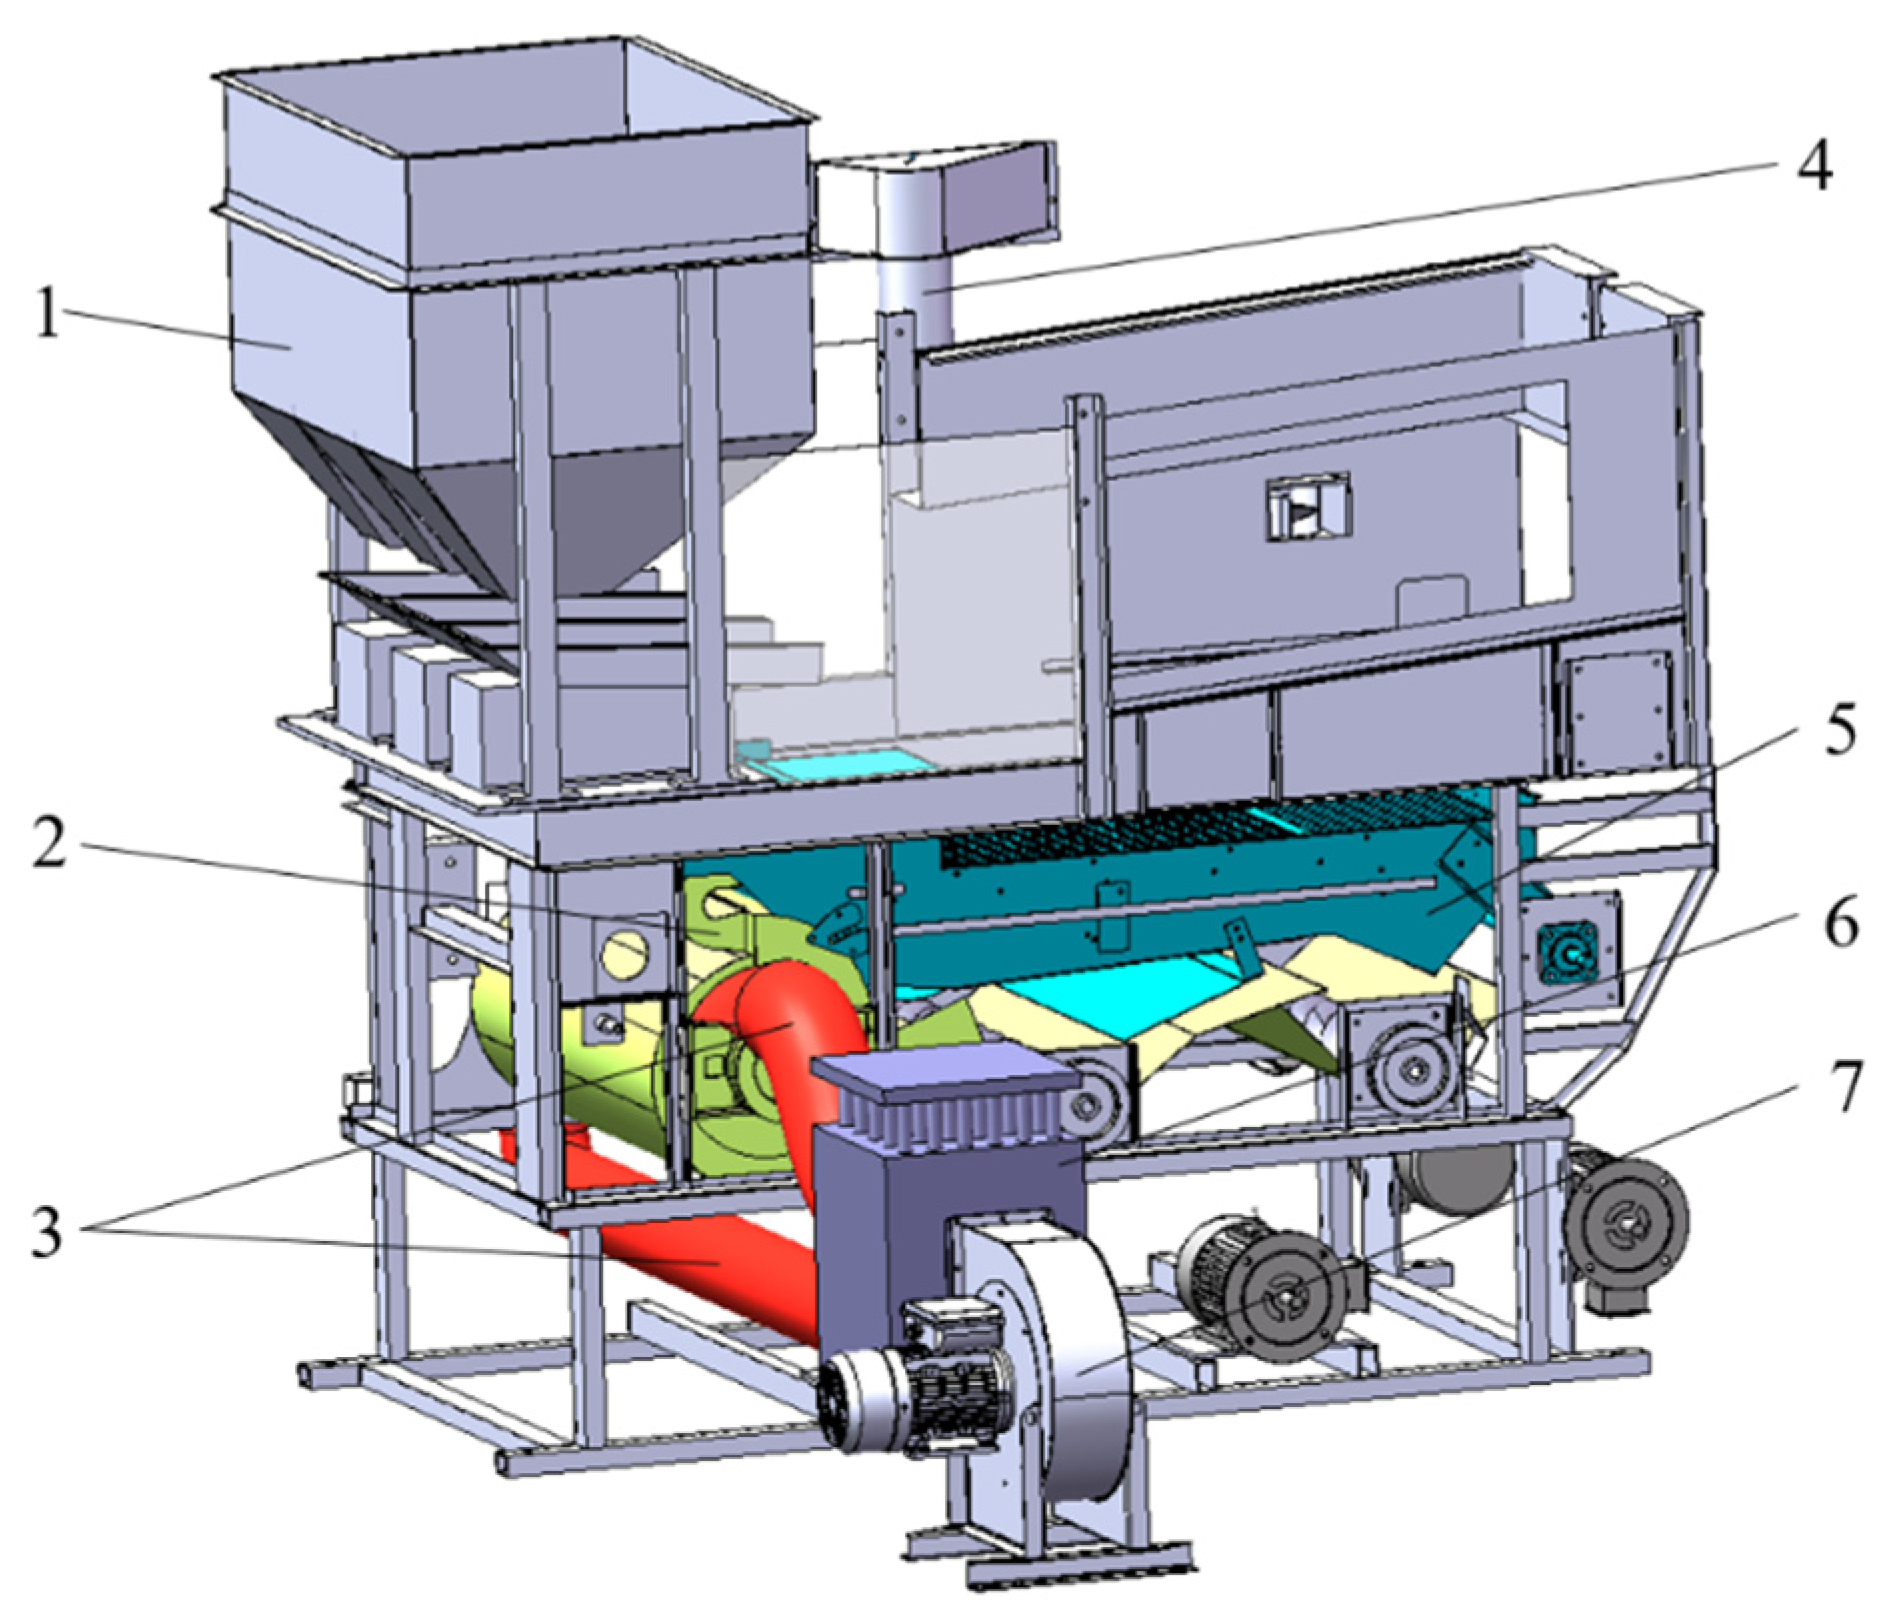
Figure 2.
Schematic diagram of the heated cleaning screen. 1. Grain pan. 2. Heating sieve. 3. Woven sieves. 4. Adjusted threaded rod. 5. Tailing sieves. 6. Nuts.
Figure 2.
Schematic diagram of the heated cleaning screen. 1. Grain pan. 2. Heating sieve. 3. Woven sieves. 4. Adjusted threaded rod. 5. Tailing sieves. 6. Nuts.

Figure 3.
Effect of the outlet temperature on the cleaning performance.

Figure 4.
Effect of the fan speed on the cleaning performance.
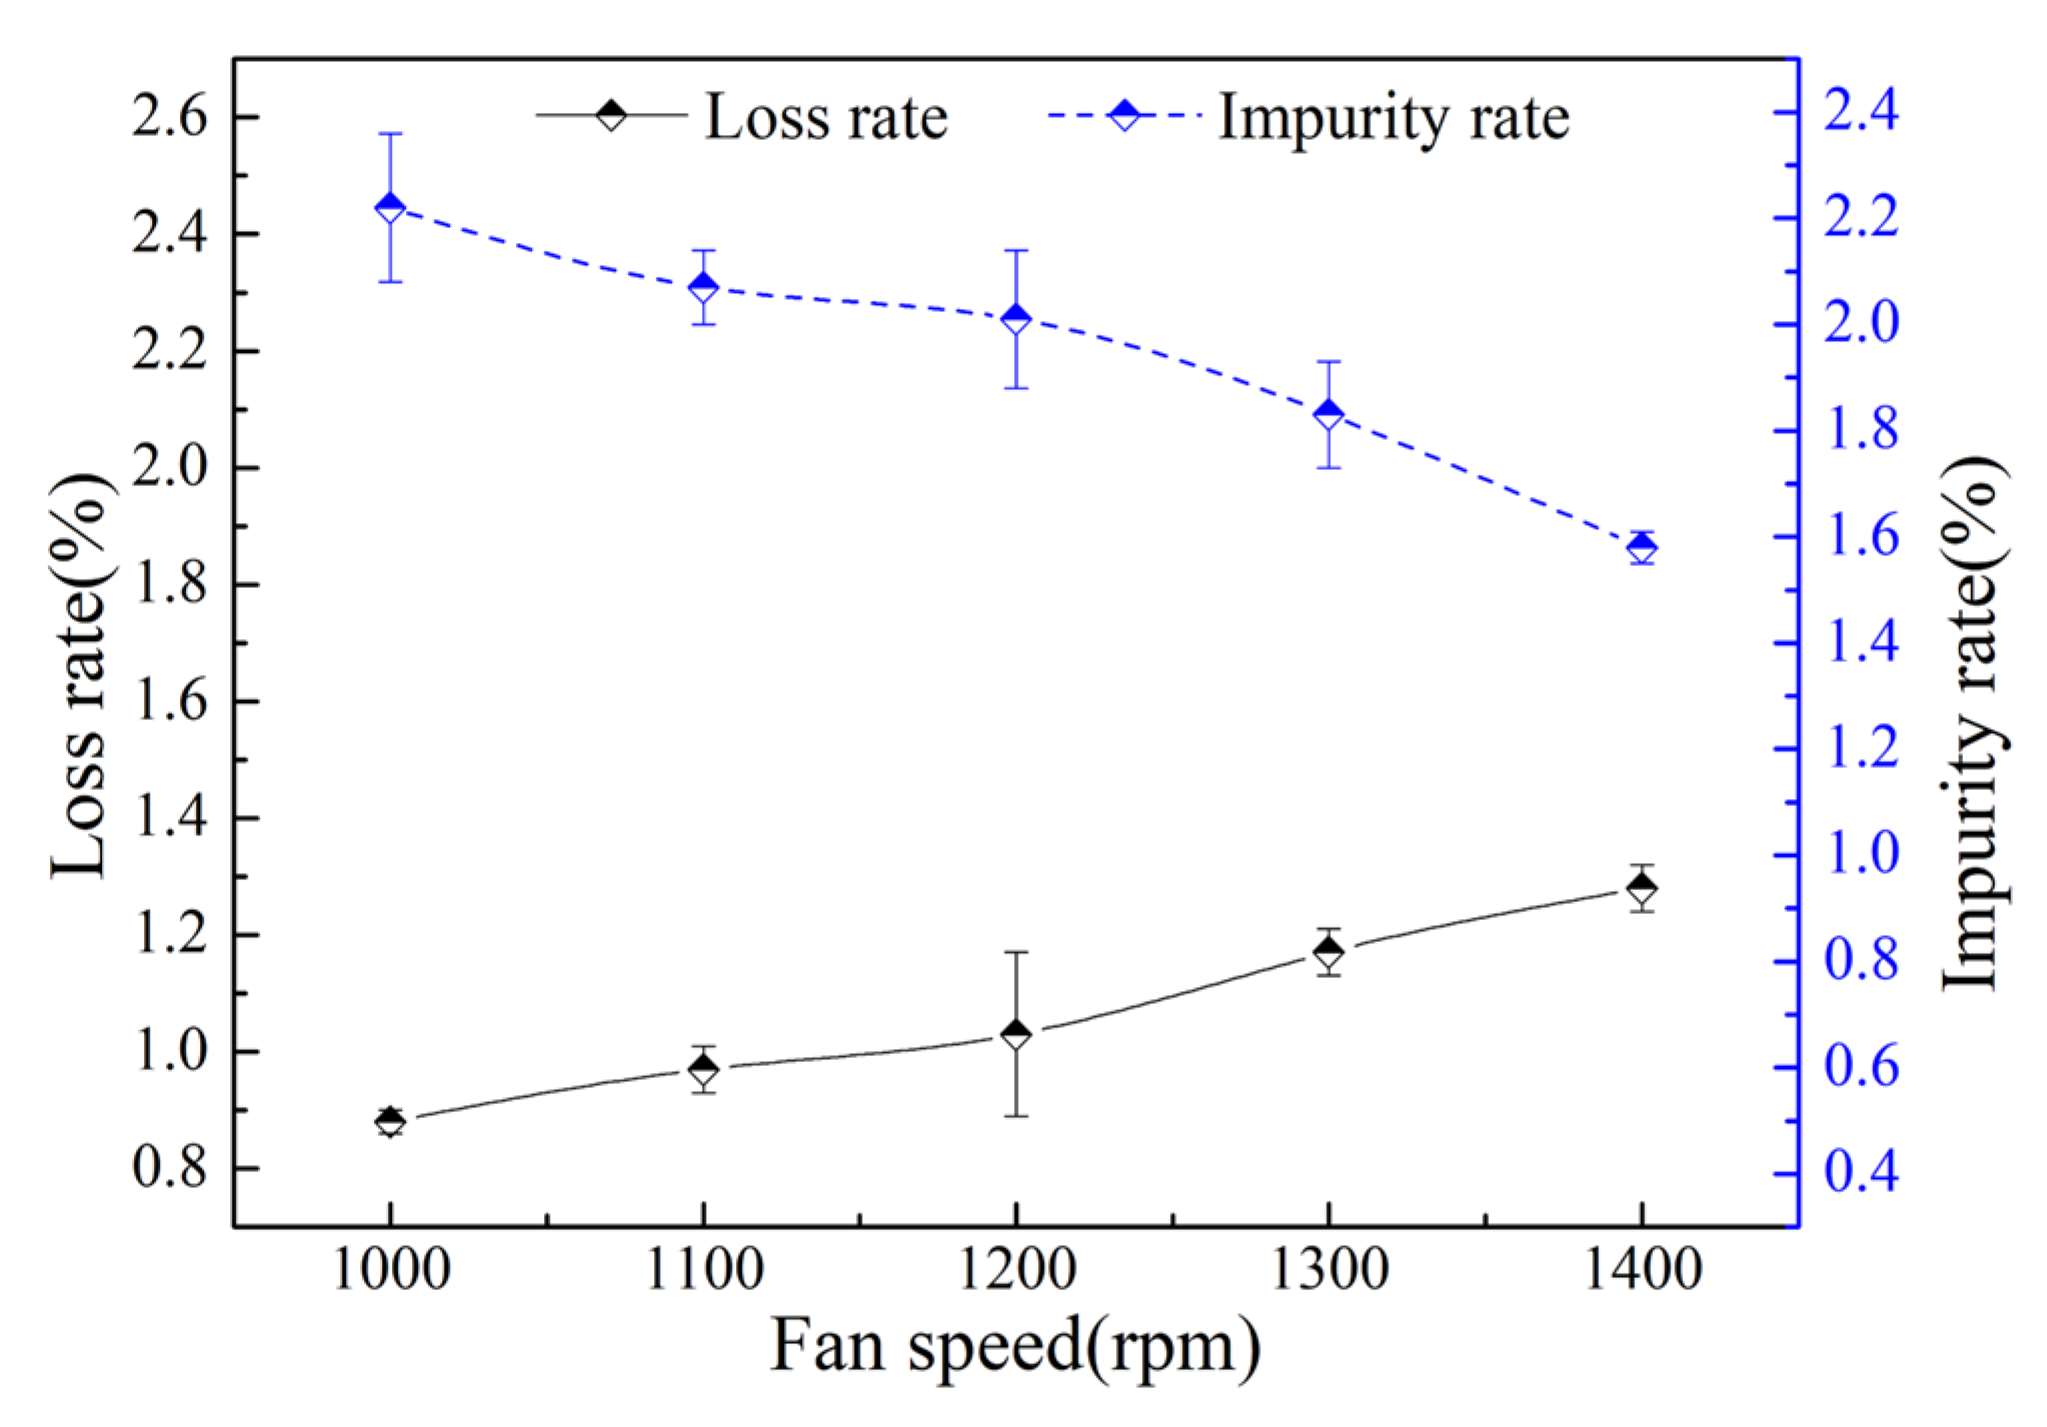
Figure 5.
Effect of the louver sieve temperature on the cleaning performance.

Figure 6.
Effect of the louver sieve inclination on the cleaning performance.

Figure 7.
Effect of the eccentric wheel speed on the cleaning performance.

Figure 8.
Results of the RSM of the loss rate: (a) interaction effect of the outlet temperature and the louver sieve temperature; (b) interaction effect of the louver sieve temperature and the fan speed.
Figure 8.
Results of the RSM of the loss rate: (a) interaction effect of the outlet temperature and the louver sieve temperature; (b) interaction effect of the louver sieve temperature and the fan speed.

Figure 9.
Results of the RSM of the impurity rate.


Table 1.
Screen surface temperature calibration.
| Number | 1 | 2 | 3 | 4 |
|---|---|---|---|---|
| Heating film temperature/°C | 66 | 76 | 86 | 96 |
| Screening temperature/°C | 30 | 40 | 50 | 60 |
Table 2.
Basic characteristics of the threshed wet rice materials.
| Ingredients | Proportion (%) | Moist Content (%) | Density (kg/m3) |
|---|---|---|---|
| Full grains | 76.56 | 28.2 | 1220 |
| Grains with small tails | 3.24 | — | — |
| Blight grains | 1.71 | — | — |
| Straw | 10.02 | 65.5 | 161 |
| Light impurity | 8.47 | 52.4 | 95 |
Table 3.
Table of single-factor tests.
| Factor | |||||
|---|---|---|---|---|---|
| Levels | Outlet Temperature/°C | Fan Speed/rpm | Louver Sieve Temperature/°C | Louver Sieve Angle/° | Eccentric Wheel Speed/rpm |
| 1 | 20 | 1000 | 20 | 45 | 250 |
| 2 | 28 | 1100 | 30 | 50 | 270 |
| 3 | 36 | 1200 | 40 | 55 | 290 |
| 4 | 44 | 1300 | 50 | 60 | 310 |
| 5 | 52 | 1400 | 60 | 65 | 330 |
Table 4.
Results of the cleaning performance at different outlet temperatures.
| Index | Number | Outlet Temperature/°C | ||||
|---|---|---|---|---|---|---|
| 20 | 28 | 36 | 44 | 52 | ||
| Loss rate/% | 1 | 1.55 | 1.30 | 1.20 | 0.87 | 0.48 |
| 2 | 1.10 | 1.19 | 1.02 | 0.64 | 0.66 | |
| 3 | 1.46 | 1.25 | 0.86 | 0.79 | 0.52 | |
| Mean value | 1.37 | 1.25 | 1.03 | 0.77 | 0.55 | |
| Standard deviation | 0.19 | 0.04 | 0.14 | 0.10 | 0.08 | |
| Impurity rate/% | 1 | 1.74 | 1.85 | 2.15 | 2.08 | 2.3 |
| 2 | 1.71 | 1.81 | 1.83 | 2.1 | 2.15 | |
| 3 | 1.82 | 1.78 | 2.05 | 2.19 | 2.24 | |
| Mean value | 1.76 | 1.81 | 2.01 | 2.12 | 2.23 | |
| Standard deviation | 0.05 | 0.03 | 0.13 | 0.05 | 0.06 | |
Table 5.
ANOVA of the single-factor test with different outlet temperatures.
| Index | Sum of Squares | df | Mean Square | F Value | p-Value | |
|---|---|---|---|---|---|---|
| Loss rate/% | Between groups | 1.36 | 4.00 | 0.34 | 15.24 | <0.01 |
| Within groups | 0.22 | 10.00 | 0.02 | |||
| Total | 1.58 | 14.00 | ||||
| Impurity rate/% | Between groups | 0.48 | 4.00 | 0.12 | 14.98 | <0.01 |
| Within groups | 0.08 | 10.00 | 0.01 | |||
| Total | 0.57 | 14.00 |
Note: highly significant (p-value < 0.01); significant (p-value < 0.05).
Table 6.
Results of the cleaning performance at different fan speeds.
| Index | Number | Fan Speed | ||||
|---|---|---|---|---|---|---|
| 1000 | 1100 | 1200 | 1300 | 1400 | ||
| Loss rate/% | 1 | 0.87 | 1.01 | 1.2 | 1.13 | 1.28 |
| 2 | 0.86 | 0.97 | 1.02 | 1.16 | 1.33 | |
| 3 | 0.9 | 0.92 | 0.86 | 1.22 | 1.23 | |
| Mean value | 0.88 | 0.97 | 1.03 | 1.17 | 1.28 | |
| Standard deviation | 0.02 | 0.04 | 0.14 | 0.04 | 0.04 | |
| Impurity rate/% | 1 | 2.42 | 2.09 | 2.15 | 1.7 | 1.62 |
| 2 | 2.13 | 1.97 | 1.83 | 1.92 | 1.59 | |
| 3 | 2.1 | 2.14 | 2.05 | 1.88 | 1.54 | |
| Mean value | 2.22 | 2.07 | 2.01 | 1.83 | 1.58 | |
| Standard deviation | 0.14 | 0.07 | 0.13 | 0.10 | 0.03 | |
Table 7.
ANOVA of the single-factor test with different fan speeds.
| Index | Sum of Squares | df | Mean Square | F Value | p-Value | |
|---|---|---|---|---|---|---|
| Loss rate/% | Between groups | 0.31 | 4.00 | 0.08 | 10.82 | <0.01 |
| Within groups | 0.07 | 10.00 | 0.01 | |||
| Total | 0.38 | 14.00 | ||||
| Impurity rate/% | Between groups | 0.71 | 4.00 | 0.18 | 10.92 | <0.01 |
| Within groups | 0.16 | 10.00 | 0.02 | |||
| Total | 0.87 | 14.00 |
Table 8.
Results of the cleaning performance at different louver sieve temperatures.
| Index | Number | Louver Sieve Temperature/°C | ||||
|---|---|---|---|---|---|---|
| 20 | 30 | 40 | 50 | 60 | ||
| Loss rate% | 1 | 1.34 | 1.12 | 1.2 | 0.81 | 0.82 |
| 2 | 1.41 | 1.24 | 1.02 | 0.89 | 0.66 | |
| 3 | 1.27 | 1.15 | 0.86 | 0.91 | 0.62 | |
| Mean value | 1.34 | 1.17 | 1.03 | 0.87 | 0.70 | |
| Standard deviation | 0.06 | 0.05 | 0.14 | 0.04 | 0.09 | |
| Impurity rate% | 1 | 1.55 | 1.92 | 2.15 | 2.08 | 2.19 |
| 2 | 1.64 | 1.85 | 1.83 | 2.18 | 2.12 | |
| 3 | 1.62 | 1.78 | 2.05 | 2.09 | 2.3 | |
| Mean value | 1.60 | 1.85 | 2.01 | 2.12 | 2.20 | |
| Standard deviation | 0.04 | 0.06 | 0.13 | 0.04 | 0.07 | |
Table 9.
ANOVA of the single-factor test with different louver sieve temperatures.
| Index | Sum of Squares | df | Mean Square | F Value | p-Value | |
|---|---|---|---|---|---|---|
| Loss rate/% | Between groups | 0.75 | 4.00 | 0.19 | 18.11 | <0.01 |
| Within groups | 0.10 | 10.00 | 0.01 | |||
| Total | 0.85 | 14.00 | ||||
| Impurity rate/% | Between groups | 0.68 | 4.00 | 0.17 | 18.71 | <0.01 |
| Within groups | 0.09 | 10.00 | 0.01 | |||
| Total | 0.77 | 14.00 |
Table 10.
Results of the cleaning performance at different louver sieve angles.
| Index | Number | Louver Sieve Inclination/° | ||||
|---|---|---|---|---|---|---|
| 45 | 50 | 55 | 60 | 65 | ||
| Loss rate% | 1 | 1.02 | 1.16 | 1.2 | 1.18 | 1.08 |
| 2 | 1.19 | 1.05 | 1.02 | 1.07 | 1.43 | |
| 3 | 1.23 | 1.03 | 0.86 | 1.14 | 1.51 | |
| Mean value | 1.15 | 1.08 | 1.03 | 1.13 | 1.34 | |
| Standard deviation | 0.09 | 0.06 | 0.14 | 0.05 | 0.19 | |
| Impurity rate% | 1 | 1.94 | 2.09 | 2.15 | 2.31 | 2.03 |
| 2 | 1.75 | 1.7 | 1.83 | 2.01 | 2.45 | |
| 3 | 1.67 | 2.01 | 2.05 | 1.9 | 1.96 | |
| Mean value | 1.79 | 1.93 | 2.01 | 2.07 | 2.15 | |
| Standard deviation | 0.11 | 0.17 | 0.13 | 0.17 | 0.22 | |
Table 11.
ANOVA of the single-factor test with different louver sieve inclinations.
| Index | Sum of Squares | df | Mean Square | F Value | p-Value | |
|---|---|---|---|---|---|---|
| Loss rate/% | Between groups | 0.14 | 4.00 | 0.04 | 1.40 | 0.30 |
| Within groups | 0.25 | 10.00 | 0.03 | |||
| Total | 0.39 | 14.00 | ||||
| Impurity rate/% | Between groups | 0.23 | 4.00 | 0.06 | 1.41 | 0.30 |
| Within groups | 0.41 | 10.00 | 0.04 | |||
| Total | 0.64 | 14.00 |
Table 12.
Results of the cleaning performance at different eccentric wheel speeds.
| Index | Number | Eccentric Wheel Speed/rpm | ||||
|---|---|---|---|---|---|---|
| 250 | 270 | 290 | 310 | 330 | ||
| Loss rate% | 1 | 1.16 | 1.24 | 1.2 | 0.93 | 1.24 |
| 2 | 1.21 | 1.15 | 1.02 | 1.13 | 1.27 | |
| 3 | 1.28 | 0.92 | 0.86 | 0.78 | 1.09 | |
| Mean value | 1.22 | 1.10 | 1.03 | 0.95 | 1.20 | |
| Standard deviation | 0.05 | 0.13 | 0.14 | 0.14 | 0.08 | |
| Impurity rate% | 1 | 1.89 | 1.81 | 2.15 | 2.04 | 1.9 |
| 2 | 1.96 | 2.05 | 1.83 | 2.08 | 1.79 | |
| 3 | 1.58 | 1.87 | 2.05 | 2.15 | 1.84 | |
| Mean value | 1.81 | 1.91 | 2.01 | 2.09 | 1.84 | |
| Standard deviation | 0.17 | 0.10 | 0.13 | 0.05 | 0.04 | |
Table 13.
ANOVA of the single-factor test with different eccentric wheel speeds.
| Index | Sum of Squares | df | Mean Square | F Value | p-Value | |
|---|---|---|---|---|---|---|
| Loss rate/% | Between groups | 0.16 | 4.00 | 0.04 | 1.97 | 0.18 |
| Within groups | 0.20 | 10.00 | 0.02 | |||
| Total | 0.36 | 14.00 | ||||
| Impurity rate/% | Between groups | 0.16 | 4.00 | 0.04 | 2.28 | 0.13 |
| Within groups | 0.18 | 10.00 | 0.02 | |||
| Total | 0.34 | 14.00 |
Table 14.
Factors and levels of the orthogonal test.
| Coded | Factors | ||
|---|---|---|---|
| Air Outlet Wind Temperature (x1)/°C | Fan Speed (x2)/rpm | Louver Sieve Temperature (x3)/°C | |
| 1.682 | 52 | 1400 | 60 |
| 1 | 44 | 1300 | 50 |
| 0 | 36 | 1200 | 40 |
| −1 | 28 | 1100 | 30 |
| −1.682 | 20 | 1000 | 20 |
Table 15.
Protocol and results of center composite rotatable test.
| Number | Experimental Factors | Test Index | |||
|---|---|---|---|---|---|
| Air Outlet Wind Temperature (x1) | Fan Speed (x2) | Louver Sieve Temperature (x3) | Loss Rate (P1) | Impurity Rate (P2) | |
| 1 | 1 (44) | −1 (1100) | −1 (30) | 0.54 | 2.13 |
| 2 | 0 (36) | −1.682 (1000) | 0 (40) | 0.73 | 2.17 |
| 3 | −1 (28) | −1 (1100) | −1 (30) | 1.16 | 2.08 |
| 4 | 1 (44) | −1 (1100) | 1 (50) | 0.42 | 2.68 |
| 5 | 0 (36) | 0 (1200) | 0 (40) | 1.01 | 2.10 |
| 6 | −1.682 (20) | 0 (1200) | 0 (40) | 1.84 | 1.82 |
| 7 | 1 (44) | 1 (1300) | 1 (50) | 0.52 | 1.98 |
| 8 | 0 (36) | 1.682 (1400) | 0 (45) | 1.67 | 0.77 |
| 9 | 1 (44) | 1 (1300) | −1 (30) | 2.06 | 1.33 |
| 10 | 0 (36) | 0 (1200) | 0 (40) | 1.06 | 1.94 |
| 11 | 0 (36) | 0 (1200) | 0 (40) | 0.93 | 2.07 |
| 12 | 0 (36) | 0 (1200) | 0 (40) | 0.94 | 2.03 |
| 13 | −1 (28) | 1 (1300) | 1 (50) | 1.81 | 1.53 |
| 14 | 0 (36) | 0 (1200) | 1.682 (60) | 0.80 | 2.11 |
| 15 | 0 (36) | 0 (1200) | 0 (40) | 1.15 | 1.95 |
| 16 | 0 (36) | 0 (1200) | −1.682 (20) | 1.20 | 1.82 |
| 17 | −1 (28) | 1 (1300) | −1 (30) | 2.23 | 1.31 |
| 18 | −1 (28) | −1 (1100) | 1 (50) | 1.79 | 2.09 |
| 19 | 0 (36) | 0 (1200) | 0 (40) | 1.18 | 1.96 |
| 20 | 1.682 (52) | 0 (1200) | 0 (40) | 0.91 | 2.21 |
Table 16.
Results of the ANOVA.
| Source | Sum of Squares | df | Mean Square | F Value | p-Value |
|---|---|---|---|---|---|
| Clear selection of loss rate (P1) | |||||
| Model | 5.10 | 9 | 0.57 | 25.93 | <0.0001 |
| x1 | 1.84 | 1 | 1.84 | 84.18 | <0.0001 |
| x2 | 1.35 | 1 | 1.35 | 61.65 | <0.0001 |
| x3 | 0.33 | 1 | 0.33 | 15.09 | 0.0030 |
| x1x2 | 0.035 | 1 | 0.035 | 1.61 | 0.2338 |
| x1x3 | 0.44 | 1 | 0.44 | 19.99 | 0.0012 |
| x2x3 | 0.76 | 1 | 0.76 | 34.87 | 0.0001 |
| x12 | 0.29 | 1 | 0.29 | 13.12 | 0.0047 |
| x22 | 0.090 | 1 | 0.090 | 4.13 | 0.0694 |
| x32 | 0.001 | 1 | 0.001 | 0.048 | 0.8316 |
| Residual | 0.22 | 10 | 0.022 | ||
| Lack of fit | 0.16 | 5 | 0.033 | 2.98 | 0.1280 |
| Pure error | 0.055 | 5 | 0.011 | ||
| Clear selection of impurity rate (P2) | |||||
| Model | 3.05 | 9 | 0.34 | 37.10 | <0.0001 |
| x1 | 0.23 | 1 | 0.23 | 24.99 | 0.0005 |
| x2 | 1.97 | 1 | 1.97 | 215.43 | <0.0001 |
| x3 | 0.27 | 1 | 0.27 | 29.48 | 0.0003 |
| x1x2 | 0.004 | 1 | 0.004 | 0.40 | 0.5436 |
| x1x3 | 0.12 | 1 | 0.12 | 12.87 | 0.0049 |
| x2x3 | 0.012 | 1 | 0.012 | 1.31 | 0.2782 |
| x12 | 0.006 | 1 | 0.006 | 0.67 | 0.4334 |
| x22 | 0.43 | 1 | 0.43 | 46.74 | <0.0001 |
| x32 | 0.0001 | 1 | 0.0001 | 0.013 | 0.9115 |
| Residual | 0.091 | 10 | 0.009 | ||
| Lack of fit | 0.068 | 5 | 0.014 | 2.96 | 0.1295 |
| Pure error | 0.023 | 5 | 0.005 | ||
Note: highly significant (p-value < 0.01); significant (p-value < 0.05).
Disclaimer/Publisher’s Note: The statements, opinions and data contained in all publications are solely those of the individual author(s) and contributor(s) and not of MDPI and/or the editor(s). MDPI and/or the editor(s) disclaim responsibility for any injury to people or property resulting from any ideas, methods, instructions or products referred to in the content. |
© 2023 by the authors. Licensee MDPI, Basel, Switzerland. This article is an open access article distributed under the terms and conditions of the Creative Commons Attribution (CC BY) license (https://creativecommons.org/licenses/by/4.0/).
Share and Cite
MDPI and ACS Style
Zhang, T.; Li, Y.; You, G. Experimental Study on the Cleaning Performance of Hot Air Flow Cleaning Device. Agriculture 2023, 13, 1828. https://doi.org/10.3390/agriculture13091828
AMA Style
Zhang T, Li Y, You G. Experimental Study on the Cleaning Performance of Hot Air Flow Cleaning Device. Agriculture. 2023; 13(9):1828. https://doi.org/10.3390/agriculture13091828
Chicago/Turabian StyleZhang, Tao, Yaoming Li, and Guoliang You. 2023. "Experimental Study on the Cleaning Performance of Hot Air Flow Cleaning Device" Agriculture 13, no. 9: 1828. https://doi.org/10.3390/agriculture13091828
Note that from the first issue of 2016, this journal uses article numbers instead of page numbers. See further details here.