Article

Comparative Metabolomics Analysis of Weedy Rice (Oryza spp.) across Peninsular Malaysia

by
Intan Filzah Mahmod
1,
Saharshini Jeyasimman
1,
Muhamad Shakirin Mispan
1,2,
Farahaniza Supandi
1,
Alfi Khatib
3 and
Mohd Zuwairi Saiman
1,2,*
1
Institute of Biological Sciences, Faculty of Science, Universiti Malaya, Kuala Lumpur 50603, Malaysia
2
Centre for Research in Biotechnology for Agriculture (CEBAR), Universiti Malaya, Kuala Lumpur 50603, Malaysia
3
Department of Pharmaceutical Chemistry, Kulliyah of Pharmacy, International Islamic University Malaysia, Kuantan Pahang 25200, Malaysia
*
Author to whom correspondence should be addressed.
Agriculture 2023, 13(6), 1230; https://doi.org/10.3390/agriculture13061230
Submission received: 8 May 2023 / Revised: 3 June 2023 / Accepted: 6 June 2023 / Published: 11 June 2023
(This article belongs to the Special Issue New Traits of Agriculture/Food Quality Interface—2nd Edition)

Abstract

:
Weedy rice (Oryza spp.) is a notorious weed that invades paddy fields and hampers the rice’s production and yield quality; thus, it has become a major problem for rice farmers worldwide. Weedy rice comprises a diverse morphology and phenotypic variation; however, the metabolome and chemical phenotypes of weedy rice grains have not been explored. Therefore, this study is aimed to investigate the metabolite profiles and chemical diversity of Malaysian weedy rice. Thirty-one biotypes of weedy rice grains were collected from selected rice granaries in different states of Peninsular Malaysia, including Selangor, Perak, Penang, Kedah, Perlis, Kelantan, and Terengganu. In addition to the weedy rice samples, four cultivated rice varieties (MR219, MR220, MR220 CL2, and MARDI Siraj 297) were subjected to nuclear magnetic resonance-based metabolomics. The PLS-DA and OPLS-DA models revealed a clear separation between the weedy rice and cultivated rice, which was contributed by the higher level of γ-aminobutyric acid (GABA), α-glucose, fumaric acid, and phenylalanine in the weedy rice, whilst valine, leucine, isoleucine, fatty acids, 2,3-butanediol, threonine, alanine, butyric acid, choline, γ-oryzanol, fructose, β-glucose, sucrose, ferulic acid, and formic acid were found dominant in the cultivated rice. Interestingly, the models also showed a separation between the weedy rice samples collected from the west coast and east coast regions of Peninsular Malaysia. The metabolites responsible for the separation, i.e., threonine, alanine, butyric acid, fructose, β-glucose, and formic acid, were found higher in the west coast samples, and the east coast samples were discriminated by higher levels of valine, leucine, isoleucine, fatty acids, 2,3-butanediol, choline, GABA, γ-oryzanol, α-glucose, sucrose, fumaric acid, ferulic acid, and phenylalanine. This study is the first to provide insights into the metabolite profiles and chemical phenotypes of Malaysian weedy rice that could be influenced by genotype and environmental conditions. The information on the weedy rice metabolome and omics data is important for further research on weed management and crop improvement.

Graphical Abstract

1. Introduction

Rice is one of the major plant crops consumed by more than half of the world’s population. It has become an important agricultural commodity that supplies nutrition and calory intake, specifically for Asian countries. However, the emergence of weedy rice (Oryza spp.) has threatened rice production globally, i.e., weedy rice has infested 75% of the rice fields all over the world [1,2]. In Malaysia, weedy rice emergence was first reported 35 years ago in Selangor and subsequently spread rapidly across Peninsular Malaysia [3,4], which caused more than RM 20 million losses in the early 1990s due to the weedy rice infestation [5].
Weedy rice is a notorious weed grown in rice field areas. It is phylogenetically related to cultivated rice (Oryza sativa) but may also possess genetic characteristics of wild rice (Oryza rufipogon). Thus, weedy rice has diverse anatomical, morphological, and physiological features that make it well-adapted and competent in all rice field environments [6,7,8,9]. These characteristics, along with long-term sympatric distribution, have led to weedy rice as the most difficult weed to control. Weedy rice is known as red rice due to the red pericarp color, while in Malaysia, it is called ‘padi angin’ due to its easy seed shattering. Weedy rice can be characterized by tall stature, seed shattering, a red pericarp, the presence of an awn, a different hull color, and seed dormancy [10,11,12]. These characteristics make weedy rice superior in defeating cultivated rice for water, nutrients, sunlight, and other resources in the field [6]. In recent years, there have been reports on the mimicry of weedy rice morphology to cultivated rice, i.e., it is shorter in height and has a white pericarp color and straw hull color, which has caused lower visibility for the eradication process and makes it worst; some weedy rice has developed herbicide-resistant through the selection of outcrosses [13,14]. Without proper weed control and management, the high infestation of weedy rice will significantly have a negative impact on farmers. Nevertheless, so far, there is no efficient method to eliminate weedy rice.
Studies on weedy rice extensively focus on morphological and genetic characteristics. No or limited studies can be found on the chemical profiles or metabolites of weedy rice. Much metabolomics research has been conducted on rice (e.g., [9,15,16,17,18]), but none has been studied on the weedy rice metabolome. Therefore, the chemical phenotypes and composition of metabolites in diverse weedy rice biotypes remain unclear. The metabolomics and metabolite fingerprinting of weedy rice are crucial to be studied to have insights into the chemical characteristics between weedy rice and cultivated rice, as well as among weedy rice varieties. Metabolite fingerprinting may provide a single or set of chemical patterns that define variation for the quality control of plants and crops. Furthermore, metabolomics studies may reveal chemical traits or biomarkers that relate specific compounds to growth, disease, stress, and environmental changes [19,20], which further deduce a better understanding of grain morphology and physiology.
Nuclear magnetic resonance (NMR) spectroscopy is a powerful tool to elucidate the structural information of chemical compounds and is one of the major platforms used to biochemically profile biological samples. NMR offers several advantages, such as rapidity, reproducibility, and minimal sample preparation [19]. Even though NMR has always been considered as low sensitivity compared to high-resolution mass spectrometry, by using a higher magnetic field and increasing the number of scans, it is very effective at identifying, characterizing, and quantifying metabolites [20]. For example, the NMR technique, coupled with multivariate statistical analysis, was employed to explore the chemical diversity of rice cultivars for a better understanding of their associations with environmental conditions [19,21,22,23].
Weedy rice metabolite profiles are still unknown, and the biochemical differences among weedy rice biotypes have yet to be discovered. Therefore, this study aims to compare the metabolite profiles between weedy rice and cultivated rice, as well as among various weedy rice biotypes across different geographical regions in Peninsular Malaysia. To the best of our knowledge, this is the first report on the metabolomics study of weedy rice.

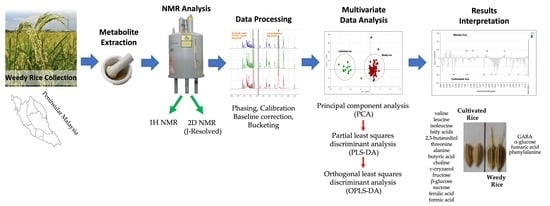
2. Materials and Methods

2.1. Chemicals

Potassium phosphate (KH2PO4), methanol-d4 (CD3OD), 99.8%, deuterated water (D2O), sodium deuteroxide (NaOD), 99.5%, and 3-(trimethylsilyl) propionic-2,2,3,3-d4 acid sodium salt (TSP) were purchased from Merck, Darmstadt, Germany.

2.2. Sample Materials

The field surveys were conducted in seven states of Peninsular Malaysia representing, the west coast region (Selangor, Perak, Penang, Kedah, and Perlis) and the east coast region (Terengganu and Kelantan) (Figure 1). These surveys were carried out during the harvesting stage between July 2017 and October 2018, in which the weedy rice samples were also collected [24]. Briefly, the collection of weedy rice samples was conducted within the survey transect at 30 m intervals, and one plant was collected at each sampling point, with a total of 30 sampling points at each location. However, the sample collection was excluded from the sampling points when there was no weedy rice in the quadrat, a low number of weedy rice seeds due to shattering, and/or comprised of young weedy rice plants with unmatured seeds. The field classification of weedy rice was based on qualitative morphological characteristics (Table S1). Weedy rice was determined when it resembled one of the wild-type characteristics, including a red pericarp, black hull, shattered seeds, the presence of an awn, and/or tall stature (>100 cm). Panicles per plant from each weedy rice sample were randomly collected and kept in labeled paper bags. Then, the seeds were segregated from the panicles, air-dried for three days, and kept at 4 °C until further use.
For the cultivated rice, four rice varieties, i.e., MR219 (accession number: MRGB11633), MR220 (accession number: MRGB11634), MR220 CL2 (accession number: MRGB12132), and MARDI Siraj 297 (accession number: MRGB13019), were obtained from Genebank and Seed Centre, Malaysian Agricultural Research and Development Institute (MARDI), Serdang, Selangor, Malaysia. The seeds were air-dried for three days and stored at 4 °C until further analysis.
Thirty-one biotypes of weedy rice grains and four varieties of cultivated rice were selected and subjected to 1H NMR analysis. Three biological replicates from all biotypes (weedy rice) and cultivar (cultivated rice) seeds were ground with a mortar and pestle under liquid nitrogen and then freeze-dried for 48 h. The dried samples were kept at room temperature in the dark until further extraction.

2.3. Metabolite Extraction

For each sample, a quantity of 200 mg of dry weight was transferred to a 2 mL Eppendorf tube. The samples were extracted with 0.8 mL of methanol-d4 and 0.2 mL of a potassium buffer in deuterium oxide (pH 6) containing 0.1% trimethylsilylpropanoic acid (TSP) as an internal standard. The samples were mixed by vortex for 20 s and sonicated for 15 min at a frequency of 37 kHz using Elmasonic P30 H (Elma Hans Schmidbauer, Singen, Germany) and centrifuged at 13000 rpm for 15 min (Eppendorf type-5424R, Hamburg, Germany). An aliquot of 0.8 mL of the supernatant was transferred into a clean NMR tube.

2.4. NMR Analysis

All 1H NMR spectra were acquired on a 600 MHz NMR (Bruker, Rheinstetten, Germany). MeOH-d4 was used as the internal lock. One dimension of each 1H NMR spectrum consisted of 160 scans for 15 min and 40 s of acquisition time. The parameters were as follows: 0.12 Hz/point, a pulse width of 30° (11.3 µs), and a relaxation delay of 2 s. A pre-saturation sequence was used to suppress the residual water signal with low-power selective irradiation at the H2O frequency during the recycle delay. The free induction decay (FID) was Fourier transformed with a line broadening factor (LB) of 0.3 Hz. Two-dimensional J-resolved NMR spectra consisted of 16 scans per 36 increments for F1 and 296.9 k for F2, with spectral widths of 9973.4 Hz in F2 (chemical shift axis) and 78.1 Hz in F1 (spin–spin coupling constant axis). The relaxation delay was 1.5 s. Datasets were zero-filled to 128 points in F1, and both dimensions were multiplied by sine-bell functions (SSB = 0). The J-resolved spectra were tilted by 45 and symmetrized about F2. All spectra were phased, the baseline was corrected, and the TSP signal (internal standard) was calibrated to 0.0 ppm. The metabolite identification of weedy rice and cultivated rice were analyzed using both 1H NMR and 2D NMR (J-resolved) spectra and based on the previous reports [15,17,19,25].

2.5. Multivariate Data Analysis

The 1H NMR spectra were phased, the baseline was corrected and the TSP signal (internal standard) was calibrated to 0.0 ppm by using a Chenomx NMR Suite 7.6 profiler (Chenomx, Inc., Edmonton, AB, Canada). Regions 4.7–4.9 ppm and 3.2–3.3 ppm that corresponded to water and methanol, respectively, were excluded prior to the normalization and spectrum alignment. The bucketed data were converted to an Excel file and imported into SIMCA version 17.0 (Sartorius Stedim Biotech, Umeå, Sweden) for multivariate analysis. Multivariate analysis of the principal component analysis (PCA), partial least squares discriminant analysis (PLS-DA), and orthogonal least squares discriminant analysis (OPLS-DA) was carried out using unit variance scaling. The quality of the models was determined by R2Y (the goodness of fit) and Q2Y (predictability) values. Furthermore, the PLS-DA and OPLS-DA models were validated by a permutation test and the CV-ANOVA value, respectively. A hierarchical cluster analysis (HCA) was performed by applying Ward’s agglomeration method in a “bottom-up” manner using SIMCA software version 17.0 (Sartorius Stedim Biotech, Umeå, Sweden).

3. Results and Discussion

3.1. Comparative Metabolomics Analysis of Weedy Rice and Cultivated Rice

Thirty-one weedy rice biotypes were collected from selected rice granaries in the west coast region (Selangor, Perak, Penang, Kedah, and Perlis) and east coast region (Terengganu and Kelantan) of Peninsular Malaysia. The seeds of weedy rice and four rice varieties (MR219, MR220, MR220 CL2, and MARDI Siraj 297) were extracted and analyzed using an NMR-based metabolomics approach. Samples were analysed using 1H NMR and 2D NMR (J-resolved), and the assignments of NMR signals were made based on previous reports [15,17,19,25].
Briefly, a 1H NMR spectrum is divided into three regions, i.e., amino acid and organic acid region (0.5–3.0 ppm), sugar region (3.0–5.5 ppm), and aromatic region (5.6–8.5 ppm). The limitation of 1H NMR due to the signals overlapping can be resolved by utilizing two-dimensional J-resolved analysis that provides splitting pattern and coupling constants to assign the identification of metabolite signals. Figure 2A shows the two-dimensional J-resolved spectrum of weedy rice representing the region 0.5–3.0 ppm, in which the identified metabolites are amino acids (valine, alanine, leucine, isoleucine, threonine), organic acids (butyric acid, 2,3-butanediol, γ-aminobutyric acid), and lipids (fatty acids). Figure 2B shows that the metabolites in the region of 3.0–5.5 ppm are sugars (α-glucose, β-glucose, fructose, sucrose) as well as choline and γ-oryzanol. The aromatic region between 6.0 and 8.5 ppm shows signals of ferulic acid, fumaric acid, phenylalanine, and formic acid (Figure 2C). Of these regions, the most intense signals were found in the region 3.0–5.5 ppm, which correspond to sugar compounds, while the peaks in the aromatic region (6.0–8.5 ppm) were relatively lower than those in other regions.
Table 1 summarizes the chemical shifts and coupling constants of the characteristic NMR signals of the identified metabolites. In total, 19 metabolites were identified, in which the metabolites in the aromatic region, i.e., fumaric acid and phenylalanine, are exclusively found in weedy rice. Fumaric acid and phenylalanine, with a characteristic signal at 6.52 ppm (singlet) and 7.38 ppm (triplet, J = 6.2 Hz), respectively, were not detected in cultivated rice seeds. However, the rest of the compounds were detected in both cultivated and weedy rice samples.
To begin the multivariate data analysis, all 1H NMR spectra were bucketed and then exported into SIMCA software. For this study, the standardized area and unit variance scaling method were applied for multivariate data analysis. Figure 3A shows the score plot of principal component analysis (PCA) of weedy rice and cultivated rice. The PCA showed 18.9% variance in principal component 1 (PC1) and 13.2% variance in principal component 2 (PC2). However, the PCA score plot illustrates no distinct separation between weedy rice and cultivated rice. The weedy rice samples were mainly concentrated at the intersection of both components, while the cultivated rice samples were distributed in the negative components of PC1 (Figure 3A). Figure 3B shows that the PCA model generated 15 principal components (Comp[1]–Comp[15]), where the R2 value was 0.85, and the Q2 value was 0.43. To obtain a well-fitted model, the R2 value (how well the model fits the data) should be close to 1, and the Q2 value (how well the model predicts the new data) should be more than 0.5 to explain good predictivity. A poor Q2 value indicates the data have much noise or the model is dominated by a few scattered outliers. As PCA is an unsupervised method, the variation between each sample could be larger compared to the variation between the weedy rice and cultivated rice groups [26]. Therefore, a supervised method using partial least squares discriminant analysis (PLS-DA) was applied to obtain a better separation between the weedy rice and cultivated rice, where the samples would be assigned into two groups, i.e., weedy rice and cultivated rice.
The PLS-DA model (Figure 4A) demonstrated a clear separation between the weedy rice and cultivated rice compared to the PCA model (Figure 3A). The PLS-DA’s score plot shows the cultivated rice (green) was at the far left of PC1 compared to the weedy rice (red). The percentage of variation in PC1 and PC2 are 13.6% and 13.0%, respectively. The PLS-DA model generated six principal components, where the fit value, R2 (0.95), was close to 1, and the predictive value, Q2 (0.79), was more than 0.5, thus indicating that all the data were well-fitted to the PLS-DA model (Figure 4B). A permutation test was conducted to validate the model since PLS-DA is a supervised method in which sample groups are assigned prior to the analysis. Figure 4C shows a permutation result of the PLS-DA model in which the two criteria of the model’s validity have been met: (1) all blue Q2 values to the left are lower than the original points to the right, and (2) the blue regression line of the Q2 points intersects with the vertical axis (on the left), at or below zero. Thus, the PLS-DA model between the weedy rice and cultivated rice was valid and had no overfitting issues. The loading plot (Figure 4D) shows the signals that contributed to the separation between the weedy rice and cultivated rice. It was found that some signals of aromatic compounds (6.0–9.0 ppm) were accumulated in the weedy rice, while the cultivated rice exhibited a higher level of signals at 0.5–3.0 ppm (the amino acid and organic acid regions) and 3.0–5.0 ppm (the sugar region).
Besides PLS-DA, the orthogonal partial least squares discriminant analysis (OPLS-DA) can be applied to obtain better model improvement with the two assigned groups between the weedy rice and cultivated rice [26]. Figure 5A shows the OPLS-DA score plot that distinctly separated the weedy rice (red) from the cultivated rice (green). The CV-ANOVA value of the OPLS-DA model is p = 7.49 × 10⁻²⁹, thus indicating it is a valid model. The column loading plot of the OPLS-DA (Figure 5B) shows the 1H NMR signals that contributed to the separation between the weedy rice (the positive area) and cultivated rice (the negative area). In general, the cultivated rice relatively comprised a higher level of all identified metabolites, except phenylalanine, fumaric acid, γ-aminobutyric acid (GABA), and α-glucose, which were higher in the weedy rice.
The separation of the weedy rice from cultivated rice was expected, as the cultivated rice of the indica and japonica types also showed distinctive seed metabolomes [27,28]. In fact, weedy rice has a different morphology, e.g., a colored pericarp and colored hull, and some have an awn compared to cultivated rice, which has a white pericarp with a straw hull and is awn-less. This justifies the higher signals of some aromatic compounds in weedy rice, which are similar to other studies that showed pigmented rice having higher aromatic compounds than non-pigmented rice [29,30]. Kim et al. [31] revealed that the pigmented rice was mainly attributed to color-related metabolite anthocyanins and their precursors, proanthocyanidins and flavonoids. Sucrose, fructose, and β-glucose were dominant in the cultivated rice, which indicates less starch or lower sugar levels in the weedy rice, probably due to the more carbon channeled to the secondary metabolites’ formation or the efficient usage of energy for environmental adaptation. Some signals of aromatic compounds were also accumulated in the cultivated rice, but the signals were not able to be identified by NMR, and further analysis on other platforms, such as LCMS or GCMS, might aid in the identification of the unknown signals.
Since there is a significant difference between weedy rice and cultivated rice, we wanted to further analyze whether weedy rice can be distinguished according to the geographical locations. At first, we grouped the samples according to the state’s region; however, none of the models produced principal components, and they did not meet the validity criteria. Therefore, we assigned the groups according to the west coast and east coast regions, while the cultivated rice was assigned as another, different group. The PLS-DA score plot (Figure 6A) showed clear separation of cultivated rice from other weedy rice samples, forming a cluster in the positive quadrant of PC1. Interestingly, the weedy rice formed two discriminate groups, where weedy rice from the east coast region of Peninsular Malaysia can be differentiated from weedy rice from the west coast region using this model. Weedy rice samples from the east coast region (Kelantan and Terengganu) were located in the positive area of PC2, while weedy rice samples from the west coast region (Selangor, Perak, Penang, Kedah, and Perlis) were in the negative area of PC2 (Figure 6A). The differentiation of cultivated rice from the weedy rice is influenced by the component in PC1, while the separation of weedy rice from different regions is influenced by the component in PC2. The model variation is 22.7%, of which 13.4% is in PC1, and 9.3% is in PC2. The PLS-DA model generated five principal components with an R2 value of 0.76 and a Q2 value of 0.60, indicating a well-fitted model (Figure 6B). The permutation test showed that the R2 and Q2 values were 0.186 and −0.375, thus confirming the model’s validity (Figure 6C). The metabolites profiles from this model can be separated according to regional locations as visualized in the loading plot (Figure 6D). The weedy rice from the west coast region contained higher levels of amino acid alanine and threonine, as well as β-glucose and butyric acid, while weedy rice from the east coast region accumulated aromatic signals of ferulic acid and phenylalanine, as well as fumaric acid and choline. The cultivated rice was discriminated by high levels of sucrose, fructose, formic acid, and fatty acids. In general, the separation of the weedy rice from the east coast (EC) was due to the accumulation of aromatic compound signals (6.0–9.0 ppm), while the weedy rice from the west coast (WC) was discriminated by amino acid signals (0.5–3.0 ppm), and cultivated rice (CR) was discriminated by the signal of sugars (3.0–5.5 ppm). In addition to the score plot, a hierarchical cluster analysis (HCA) was conducted to display the distance measure and linkage among the samples. Figure 6E shows an HCA dendrogram with four major clusters representing cultivated rice, weedy rice from the east coast, weedy rice from the west coast, and a cluster comprised of weedy and cultivated rice mixtures. The latter contained similar metabolites that were shared together. It is inferred that the weedy rice biotypes from this cluster undergo the process of de-domestication and hybridization between the weedy rice and cultivated rice, producing an admixture of morphological characteristics [32,33]. The separation of the weedy rice samples from the cultivated rice indicates a distinct chemical fingerprint between the weed’s biotype and the domesticated varieties.
An additional analysis was conducted to further define the weedy rice differences between the two regions, i.e., the east coast and west coast regions. Therefore, the cultivated rice samples were excluded and the weedy rice samples from the east coast and west coast regions were analyzed using the PLS-DA model. The result shows a clear cluster separating the samples of the west coast and the east coast region in the positive and negative area of PC1, respectively (Figure 7A). This indicates that weedy rice can produce distinct metabolites according to its geographical locations. The model produced only two principal components, and the PC variation was 19.45% with an R2 value and a Q2 value of 0.72 and 0.55, respectively (Figure 7B). Figure 7C shows a validated PLS-DA model with a permutation test, in which the R2 and Q2 lines intercepted the y-axis at 0.196 and −0.209, respectively. The loading plot of the PLS-DA shows that the west coast region accumulated with amino acid signals (1.0–3.0 ppm), while the east coast region accumulated with aromatic compound signals (6.0–9.0 ppm) (Figure 7D).
This model was further analyzed with the OPLS-DA model, where a distinct separation could be observed in PC1 (Figure 8A). The cross-validation using CV-ANOVA gave significant results (p = 1.77 × 10⁻¹⁷), in which a p-value below 0.05 indicated that the model was validated. Further analysis using a column loading plot explained that the weedy rice from the east coast accumulated more aromatic compounds, including, among others, fumaric acid, ferulic acid, and phenylalanine (Figure 8B), than the weedy rice from the west coast region. Other metabolites, i.e., fatty acids, valine, leucine, isoleucine, 2,3-butanediol, GABA, α-glucose, sucrose, γ-oryzanol, and choline, were also higher in the east coast samples compared to the west coast region. Some identified metabolites that were dominant in the west coast region included threonine, alanine, butyric acid, fructose, β-glucose, and formic acid.
Ferulic acid is a phenolic compound known for its antioxidant properties, providing rigidity to the cell wall and the formation of other organic compounds [34,35]. The phenolics act as radical scavengers to decrease the incidence of oxidative stress-induced damage to large biological molecules [36,37]. Phenylalanine is an amino acid and a precursor for secondary metabolites in phenylpropanoid and flavonoid biosynthesis. These metabolites were reported to have biological functions in pigmentation and defensive activity against biotic and abiotic stresses and act as an anti-inflammatory in plants [16,18].
Furthermore, the HCA dendrogram (Figure 8C) shows that the west coast and east coast regions were well-separated into two clusters, confirming the separation of metabolite profiles between the two regions. The two distinct clusters could be inferred due to geographical and climate factors. The climate conditions were different in both areas, where the east coast region received higher annual rainfall (2500–3000 mm) than the west coast region (1500–2500 mm) (Table S2). Furthermore, the temperature in the east coast region (30–33 °C) was lower than in the west coast region (34–37 °C). This phenomenon could explain the different metabolite profiles between the east coast and west coast weedy rice, especially the more aromatic compounds in the east coast samples, which could be due to abiotic stresses. This finding is in line with studies by Du et al. [21] and Schaarschmidt et al. [23], who showed that climate and low temperatures might affect the rice metabolome. Du et al. [21] showed that phenylpropanoid and flavonoid biosynthesis were activated, and the antioxidant activity was higher in the rice exposed to low temperatures. The weedy rice in the east coast region also contained higher levels of GABA, which plays the role of a stress-induced amino acid transporter that accumulates under environmental stress [15,17,18]. Moreover, the east coast and west coast regions have different agronomic approaches, which may contribute to the chemical and phenotypic differences between weedy rice in the two regions. The east coast region practiced 100% direct seeding, while the west coast region conducted 80% direct seeding and 20% transplanting methods (Table S2).

3.2. Metabolomic Analysis of Malaysian Weedy Rice Associated with Grain Morphology

The pericarp color is one of the characteristics that differentiate weedy rice from cultivated rice. The PLS-DA score plot shows that the weedy rice and cultivated rice are separated based on a red or white pericarp color (Figure S1A). This PLS-DA model generated three principal components, with R2 and Q2 values of 0.60 and 0.41, respectively (Figure S1B). The R2 value is far from 1, and the Q2 value is less than 0.5, indicating a poor PLS-DA model. However, the permutation test shows a good intercept, which validates the PLS-DA model (Figure S1C). Further, the OPLS-DA model was applied to seek better separation of the pericarp color (Figure 9A). The red pericarp samples were clearly clustered in the positive quadrant of PC1, while the white pericarp samples showed distinct distribution in the negative quadrant of PC1. The separation, however, has no correlation with the geographical locations, indicating that metabolites associated with pericarp color have no influence from the environment. The cross-validation using CV-ANOVA gave significant results (p = 1.86 × 10⁻⁹) for the OPLS-DA model. The weedy rice with red pericarp color exhibited higher signals of aromatic region metabolites, such as fumaric acid, ferulic acid, and phenylalanine, among others (Figure 9B). On the other hand, weedy and cultivated rice with white pericarp color displayed more signals from amino acids (valine, leucine, isoleucine, threonine, and alanine), organic acids (2,3-butanediol, butyric acid, GABA, and formic acid), fatty acids, and others (γ-oryzanol and choline). The formic acid contributed to the white pericarps due to its higher level in the cultivated rice compared to the weedy rice. Some signals of the aromatic region at 6.0–10.0 ppm were not able to be identified.
This finding is in line with the fact that the red pericarp color is associated with the accumulation of anthocyanins, proanthocyanidins, and flavonoids, which contain the aromatic group [29,31,38]. A red pericarp is the main characteristic that differentiates weedy rice from cultivated rice, even though they are similar species [32,33]. More bioactive compounds were accumulated in red rice compared to white rice [15,31,39]. Weedy rice with red pericarps was found to be rich in dietary fiber, compared to the white pericarp of the weedy rice and cultivated rice, which is beneficial in the application of the development of functional foods and various other value-added products [40,41]. This was due to less starch and lower sugar content, as well as being rich in antioxidant compounds in red pericarp compared to white pericarp seeds. Interestingly, the metabolite profile of red weedy rice was found to be lower in γ-oryzanol, fatty acids, and choline. Previous studies reported that red-cultivated rice contained higher levels of γ-oryzanol, fatty acids, and choline compared to white-cultivated rice [42,43,44]. γ-oryzanol is the most accessible antioxidant in rice bran (rice hull), which protects rice oil from oxidation and inarguably has health benefits [15,45,46]. In this study, γ-oryzanol was found to be higher in white-cultivated rice, followed by white weedy rice and red weedy rice. The difference could be due to different metabolisms between the red-cultivated rice and red weedy rice.
The subsequent analysis was to explore if the hull colors (brown, brown furrow, black, golden, and straw) could be one of the factors contributing to the differences between cultivated rice and weedy rice. However, the PLS-DA model is not well-fitted, with very low R2 and Q2 values (Figure S2), and the permutation test was not valid. No clear separation in the hull color could be due to the variation among the hull colors, which is not significantly different compared to the red and white pericarps, which are very distinct. Although some of the straw hull and brown hull samples were separated distantly from the other hull colors, which indicates different metabolite profiles, the model is not well-fitted or valid for further use (Figure S2). Similarly, the comparison of the weedy rice and cultivated rice based on awn availability could not generate more than one principal component in the PLS-DA model; thus, it cannot be used for further analysis. A previous study reported that awned biotypes had a high level of protein and a lower level of lipids compared to awn-less biotypes [47]. These may require different approaches using proteomics or lipidomics rather than metabolomics analysis.
Over the past decade, there has been extensive research on metabolomics in rice (Oryza sativa L.), primarily focusing on natural variation and the impacts of biotic or abiotic stresses [16,21,22,23]. While the study of metabolic and chemical fingerprints in cultivated rice is increasing, there is a lack of research in the field of metabolomics in weedy rice, with minimal or no investigation conducted. It is crucial to conduct metabolomics studies on weedy rice in parallel with cultivated rice, given their conspecific nature. This conspecific relationship allows for the direct translation of information gathered from rice metabolomics research to any studies involving weedy rice. Due to this conspecific nature, beneficial characteristics from weedy rice have significant potential to be incorporated to advance the development of rice breeding programs, especially in increasing the quality (aromatic and nutritional values) and improving the performance (a high yield, disease resistance, and abiotic stress tolerance) [24,48,49]. Our current analysis of metabolite profiles in local weedy rice from Malaysia adds further value to these efforts. This study demonstrates that different weedy rice varieties, both morphologically and regionally, exhibit distinct metabolite profiles that can be differentiated from one another. Consequently, it becomes intriguing to explore relevant questions regarding the chemical composition or metabolites present in weedy rice.

4. Conclusions

This metabolomics study has been successfully applied to differentiate weedy rice from cultivated rice based on their metabolite profiles. To the best of our knowledge, no metabolomics study has been conducted on weedy rice, and this is the first report to profile the metabolites produced by weedy rice. Our study reported four major compounds in weedy rice that contribute to its separation from cultivated rice, i.e., GABA, α-glucose, fumaric acid, and phenylalanine. This metabolomics study has also revealed the difference of weedy rice in the west coast and east coast regions of Peninsular Malaysia. The latter was higher in signals of aromatic compounds, which was due to the environmental conditions and abiotic stresses. The comparative metabolomics analysis between the red pericarp and white pericarp colors suggested that the higher level of aromatic compounds, especially phenylalanine in the red pericarp color, was attributed to the accumulation of flavonoids, anthocyanins, and proanthocyanidins. This study provides new insights into the comparison of Malaysian weedy rice versus cultivated rice, as well as different biotypes of weedy rice based on geographical area and pericarp color. The difference in the metabolite profiles of the west coast and east coast regions of Peninsular Malaysia shows the evolution and adaptation of weedy rice in different environmental conditions. However, this study is limited to only weedy rice from Peninsular Malaysia. It is well known that weedy rice is morphologically and genetically diverse. Therefore, comparing metabolites of weedy rice from other Asia-Pacific and temperate regions will provide in-depth information about the metabolite profiles of weedy rice in association with different traits and genetic make-up. Further metabolomics studies using different analytical platforms, such as LCMS and GCMS, may give a better understanding of the weedy rice metabolome. Moreover, multi-omics studies, by combining genomics, transcriptomics, proteomics, and metabolomics data, could improvise weed management strategies and enhance crop improvement programs.

Supplementary Materials

The following supporting information can be downloaded at: https://www.mdpi.com/article/10.3390/agriculture13061230/s1, Table S1: Weedy rice samples collected at several locations in Peninsular Malaysia and their morphological characteristics, Table S2: Location of weedy rice survey across Peninsular Malaysia, Figure S1: Score plot (A) of partial least squares discriminant analysis (PLS-DA) derived from 1H NMR spectra of weedy rice with red pericarp (red dots) and white pericarp (grey dots) color. Summary of fit (B) and permutation test (C) with R2 value (green) and Q2 value (blue). Loading plot (D) of PLS-DA with X variables of 1H NMR signals (grey dots) and Y variables of sample class: red pericarp and white pericarp colors (blue dots), Figure S2: Score plot (A) of partial least squares discriminant analysis (PLS-DA) of different hull colors in weedy rice and summary of fit (B) derived from 1H NMR spectra. BFH: brown furrow hull, BH: black hull, BRH: brown hull, GH: golden hull, SH: straw hull.

Author Contributions

Conceptualization, I.F.M. and M.Z.S.; methodology, I.F.M. and M.Z.S.; software, A.K. and M.Z.S.; validation, I.F.M., A.K. and M.Z.S.; formal analysis, I.F.M., S.J. and M.Z.S.; investigation, I.F.M. and M.Z.S.; data curation, I.F.M., S.J. and M.Z.S.; writing—original draft preparation, I.F.M.; writing—review and editing, I.F.M., S.J., M.S.M., F.S., A.K. and M.Z.S.; visualization, I.F.M. and M.Z.S.; supervision, M.S.M. and M.Z.S.; project administration, M.S.M. and M.Z.S.; funding acquisition, M.S.M., F.S. and M.Z.S. All authors have read and agreed to the published version of the manuscript.

Funding

This research was funded by the Fundamental Research Grant Scheme (FRGS), Ministry of Higher Education Malaysia (Grant no. FRGS/1/2019/STG03/UM/02/17).

Institutional Review Board Statement

Not applicable.

Data Availability Statement

Not applicable.

Acknowledgments

The authors thank MARDI (Malaysian Agricultural Research and Development Institute) for providing cultivated rice seeds. The authors acknowledge the Ministry of Higher Education Malaysia for the Fundamental Research Grant Scheme (Grant no. FRGS/1/2019/STG03/UM/02/17).

Conflicts of Interest

The authors declare no conflict of interest.

References

  1. Saha, S.; Patra, B.C.; Munda, S.; Mohapatra, T. Weedy rice: Problems and its management. Indian J. Weed Sci. 2014, 46, 14–22. [Google Scholar]
  2. Nadir, S.; Xiong, H.B.; Zhu, Q.; Zhang, X.L.; Xu, H.Y.; Li, J.; Dongchen, W.; Henry, D.; Guo, X.Q.; Khan, S.; et al. Weedy rice in sustainable rice production. A review. Agron. Sustain. Dev. 2017, 37, 46. [Google Scholar] [CrossRef]
  3. Wahab, A.; Suhaimi, O. Weedy rice characteristics, adverse effects and methods of its eradication. Teknologi Padi 1991, 7, 21–31. (In Malay) [Google Scholar]
  4. Abdullah, M.Z.; Vaughan, A.; Watanabe, H.; Okuno, K. The origin of weedy rice in Peninsular Malaysia. MARDI Res. J. 1996, 24, 169–174. [Google Scholar]
  5. Anuar, N.S.; Mazlan, N.; Ariff, E.E.; Juraimi, A.S.; Yusop, M.R. A comparative study of vegetative and reproductive growth of local weedy and Clearfield® rice varieties in Malaysia. J. Int. Soc. Southeast Asian Agric. Sci. 2014, 20, 41–51. [Google Scholar]
  6. Cao, Q.; Lu, B.R.; Xia, H.; Rong, J.; Sala, F.; Spada, A.; Grassi, F. Genetic diversity and origin of weedy rice (Oryza sativa f. spontanea) populations found in North-eastern China Revealed by simple sequence repeat (SSR) markers. Annals Bot. 2006, 98, 1241–1252. [Google Scholar] [CrossRef]
  7. Baki, B.B.; Shakirin, M.M. Spatio-temporal distribution pattern of new biotypes of weedy rice (Oryza sativa L.) in Selangor north-west project, Malaysia. Korean J. Weed Sci. 2010, 30, 68–83. [Google Scholar] [CrossRef]
  8. Zhang, L.; Dai, W.; Wu, C.; Song, X.; Qiang, S. Genetic diversity and origin of Japonica- and Indica-like rice biotypes of weedy rice in the Guangdong and Liaoning provinces of China. Genet. Resour. Crop Evol. 2012, 59, 399–410. [Google Scholar] [CrossRef]
  9. Song, E.H.; Kim, H.J.; Jeong, J.; Chung, H.J.; Kim, H.Y.; Bang, E.; Hong, Y.S. A 1H HR-MAS NMR-based metabolomic study for metabolic characterization of rice grain from various Oryza sativa L. cultivars. J. Agric. Food Chem. 2016, 64, 3009–3016. [Google Scholar] [CrossRef]
  10. Chauhan, B.S. Strategies to manage weedy rice in Asia. Crop Prot. 2013, 48, 51–56. [Google Scholar] [CrossRef]
  11. Olajumoke, B.; Juraimi, A.S.; Uddin, M.K.; Husni, M.H.A.; Alam, M.A. Competitive ability of cultivated rice against weedy rice biotypes—A review. Chil. J. Agric. Res. 2016, 76, 243–252. [Google Scholar] [CrossRef]
  12. Sudianto, E.; Neik, T.X.; Tam, S.M.; Chuah, T.S.; Idris, A.A.; Olsen, K.M.; Song, B.K. Morphology of Malaysian weedy rice (Oryza sativa): Diversity, origin and implications for weed management. Weed Sci. 2016, 64, 501–512. [Google Scholar] [CrossRef]
  13. Mohamed, Z.; Terani, R.; Shamsudin, M.N.; Latif, I.A. Paddy farmers’ sustainability practices in granary areas in Malaysia. Resources 2016, 5, 17. [Google Scholar] [CrossRef]
  14. Dilipkumar, M.; Burgos, N.R.; Chuah, T.S.; Ismail, S. Cross-resistance to imazapic and imazapyr in a weedy rice (Oryza sativa) biotype found in Malaysia. Planta Daninha 2018, 36, e018182239. [Google Scholar] [CrossRef]
  15. Pramai, P.; Hamid, N.A.A.; Mediani, A.; Maulidiani, M.; Abas, F.; Jiamyangyuen, S. Metabolite profiling, antioxidant, and α-glucosidase inhibitory activities of germinated rice: Nuclear-magnetic-resonance-based metabolomics study. J. Food Drug Anal. 2018, 26, 47–57. [Google Scholar] [CrossRef] [PubMed]
  16. Uawisetwathana, U.; Graham, S.F.; Kamolsukyunyong, W.; Sukhaket, W.; Klanchui, A.; Toojinda, T.; Vanavichit, A.; Karoonuthaisiri, N.; Elliot, C.T. Quantitative 1H NMR metabolome profiling of Thai jasmin rice (Oryza sativa) reveals primary metabolic response during brown planthopper infestation. Metabolomics 2015, 11, 1640–1655. [Google Scholar] [CrossRef]
  17. Wijaya, D.N.; Susanto, F.A.; Purwestri, Y.A.; Ismoyowati, D.; Nuringtyas, T.R. NMR metaboliote comparison of local pigmented rice in Yogyakarta. Indones. J. Biotechnol. 2017, 22, 68–75. [Google Scholar] [CrossRef]
  18. Zarei, I.; Luna, E.; Leach, J.E.; McClung, A.; Vilchez, S.; Koita, O.; Ryan, E.P. Comparative rice bran metabolomics across diverse cultivars and functional rice gene-bran metabolite relationships. Metabolites 2018, 8, 63. [Google Scholar] [CrossRef]
  19. Kim, H.K.; Choi, Y.H.; Verpoorte, R. NMR-based analysis of plants. Nat. Protoc. 2010, 5, 536–549. [Google Scholar] [CrossRef] [PubMed]
  20. Kim, H.K.; Choi, Y.H.; Verpoorte, R. NMR-based plant metabolomics: Where do we stand, where do we go? Trends Biotechnol. 2011, 29, 267–275. [Google Scholar] [CrossRef]
  21. Du, S.; Cui, M.; Cai, Y.; Xue, A.; Hao, Y.; Huang, X.; Liu, L.; Luo, L. Metabolomic analysis of chilling response in rice (Oryza sativa L.) seedlings by extractive electrospray ionization mass spectrometry. Environ. Exp. Bot. 2020, 180, 104231. [Google Scholar] [CrossRef]
  22. Nam, M.H.; Bang, E.; Kwon, T.Y.; Kim, Y.; Kim, E.H.; Cho, K.; Yoon, I.S. Metabolite profiling of diverse rice germplasm and identification of conserved metabolic markers of rice roots in response to long-term mild salinity stress. Int. J. Mol. Sci. 2015, 16, 21959–21974. [Google Scholar] [CrossRef]
  23. Schaarschmidt, S.; Lawas, L.M.F.; Glaubitz, U.; Li, X.; Erban, A.; Kopka, J.; Jagadish, S.V.K.; Hincha, D.K.; Zuther, E. Season Affects Yield and Metabolic Profiles of Rice (Oryza sativa) under High Night Temperature Stress in the Field. Int. J. Mol. Sci. 2020, 21, 3187. [Google Scholar] [CrossRef]
  24. Mahmod, I.F.; Saiman, M.Z.; Mohamed, Z.; Ishak, M.N.; Mispan, M.S. Morphological variation, distribution and relationship of weedy rice (Oryza sativa L.) in Peninsular Malaysia. Weed Biol. Manag. 2021, 21, 86–99. [Google Scholar] [CrossRef]
  25. Saiman, M.Z.; Mustafa, N.R.; Schulte, A.E.; Verpoorte, R.; Choi, Y.H. Induction, characterization, and NMR-based metabolic profiling of adventitious root cultures from leaf explants of Gynura procumbens. Plant Cell Tissue Organ Cult. 2012, 109, 465–475. [Google Scholar] [CrossRef]
  26. Saiman, M.Z.; Mustafa, N.R.; Choi, Y.H.; Verpoorte, R.; Schulte, A.E. Metabolic alterations and distribution of five-carbon precursors in jasmonic acid-elicited Catharanthus roseus cell suspension cultures. Plant Cell Tissue Organ Cult. 2015, 122, 351–362. [Google Scholar] [CrossRef]
  27. Heuberger, A.L.; Lewis, M.R.; Chen, M.H.; Brick, M.A.; Leach, J.E.; Ryan, E.P. Metabolomic and functional genomic analyses reveal varietal differences in bioactive compounds of cooked rice. PLoS ONE 2010, 5, e12915. [Google Scholar] [CrossRef]
  28. Hu, C.; Shi, J.; Quan, S.; Cui, B.; Kleessen, S.; Nikoloski, Z.; Tohge, T.; Alexander, D.; Guo, L.; Lin, H.; et al. Metabolic variation between japonica and indica rice cultivars as revealed by non-targeted metabolomics. Sci. Rep. 2014, 4, 5067. [Google Scholar] [CrossRef]
  29. Deng, G.F.; Xu, X.R.; Zhang, Y.; Li, D.; Gan, R.Y.; Li, H.B. Phenolic compounds and bioactivities of pigmented rice. Crit. Rev. Food Sci. Nutr. 2013, 53, 296–306. [Google Scholar] [CrossRef]
  30. Mbanjo, E.G.N.; Kretzschmar, T.; Jones, H.; Ereful, N.; Blanchard, C.; Boyd, L.A.; Sreenivasulu, N. The genetic basis and nutritional benefits of pigmented rice grain. Front. Genet. 2020, 11, 229. [Google Scholar] [CrossRef] [PubMed]
  31. Kim, G.R.; Jung, E.S.; Lee, S.; Lim, S.H.; Ha, S.H.; Lee, C.H. Combined mass spectrometry-based metabolite profiling of different pigmented rice (Oryza sativa L.) seeds and correlation with antioxidant activities. Molecules 2014, 19, 15673–15686. [Google Scholar] [CrossRef] [PubMed]
  32. Ferrero, A. Weedy rice, biological features and control. In Weed Management for Developing Countries; Labrada, R., Ed.; FAO: Rome, Italy, 2003; pp. 89–107. [Google Scholar]
  33. Kanapeckas, K.L.; Vigueira, C.C.; Ortiz, A.; Gettler, K.A.; Burgos, N.R.; Fischer, A.J.; Lawton-Rauh, A.L. Escape to ferality: The endoferal origin of weedy rice from crop rice through de-domestication. PLoS ONE 2016, 11, e0162676. [Google Scholar] [CrossRef] [PubMed]
  34. Kumar, N.; Pruthi, V. Potential applications of ferulic acid from natural sources. Biotechnol. Rep. 2014, 4, 86–93. [Google Scholar] [CrossRef]
  35. Goufo, P.; Henrique, T. Rice antioxidants: Phenolic acids, flavonoids, anthocyanins, proanthocyanidins, tocopherols, tocotrienols, γ-oryzanol, and phytic acid. Food Sci. Nutr. 2014, 2, 75–104. [Google Scholar] [CrossRef]
  36. Ghasemzadeh, A.; Karbalaii, M.T.; Jaafar, H.Z.; Rahmat, A. Phytochemical constituents, antioxidant activity, and antiproliferative properties of black, red, and brown rice bran. Chem. Cent. J. 2018, 12, 17. [Google Scholar] [CrossRef]
  37. Yamuangmorn, S.; Prom-u-Thai, C. The potential of high-anthocyanin purple rice as a functional ingredient in human health. Antioxidants 2021, 10, 833. [Google Scholar] [CrossRef]
  38. Liu, M.; Wang, Z.; Yun-Jie, G.U. Caryopsis development and anthocyanidin accumulation of colored rice. Chin. J. Rice Sci. 2011, 25, 392–398. [Google Scholar]
  39. Andriani, R.; Subroto, T.; Ishmayana, S.; Kurnia, D. Enhancement Methods of Antioxidant Capacity in Rice Bran: A Review. Foods 2022, 11, 2994. [Google Scholar] [CrossRef]
  40. Modgil, R.; Rani, U. Effect of Processing on the Nutritional Quality of Red Rice Cultivars. J. Life Sci. 2016, 8, 12–18. [Google Scholar] [CrossRef]
  41. Priya, T.R.; Nelson, A.R.L.E.; Ravichandran, K.; Antony, U. Nutritional and functional properties of coloured rice varieties of South India: A review. J. Ethn. Foods 2019, 6, 11. [Google Scholar] [CrossRef]
  42. Biswas, S.K.; Kim, D.E.; Keum, Y.S.; Saini, R.K. Metabolite profiling and antioxidant activities of white, red, and black rice (Oryza sativa L.) grains. J. Food Meas. Charact. 2018, 12, 2484–2492. [Google Scholar] [CrossRef]
  43. Frank, T.; Reichardt, B.; Shu, Q.; Engel, K.H. Metabolite profiling of coloured rice (Oryza sativa L. ) grains. J. Cereal Sci. 2012, 55, 112–119. [Google Scholar] [CrossRef]
  44. Pereira-Caro, G.; Cros, G.; Yokota, T.; Crozier, A. Phytochemical profiles of black, red, brown, and white rice from the Camargue region of France. J. Agric. Food Chem. 2013, 61, 7976. [Google Scholar] [CrossRef]
  45. Lerma-García, M.J.; Herrero-Martínez, J.M.; Simó-Alfonso, E.F.; Mendonça, C.R.B.; Ramis-Ramos, G. Composition industrial processing and applications of rice bran gamma-oryzanol. Food Chem. 2009, 115, 389–404. [Google Scholar] [CrossRef]
  46. Moongngarm, A.; Saetung, N. Comparison of chemical compositions and bioactive compounds of germinated rough rice and brown rice. Food Chem. 2010, 122, 782–788. [Google Scholar] [CrossRef]
  47. Gealy, D.R.; Bryant, R.J. Seed physicochemical characteristics of field-grown US weedy red rice (Oryza sativa) biotypes: Contrasts with commercial cultivars. J. Cereal Sci. 2009, 49, 239–245. [Google Scholar] [CrossRef]
  48. Jia, Y.; Gealy, D. Weedy Red Rice Has Novel Sources of Resistance to Biotic Stress. Crop J. 2018, 6, 443–450. [Google Scholar] [CrossRef]
  49. Mohd Hanafiah, N.; Cheng, A.; Lim, P.-E.; Sethuraman, G.; Mohd Zain, N.A.; Baisakh, N.; Mispan, M.S. Novel PCR-Based Multiplex Assays for Detecting Major Quality and Biotic Stress in Commercial and Weedy Rice. Life 2022, 12, 1542. [Google Scholar] [CrossRef]
Figure 1. Sample collection of weedy rice in seven states covering the west coast region (Selangor, Perak, Penang, Kedah, and Perlis) and the east coast region (Kelantan and Terengganu) of Peninsular Malaysia.
Agriculture 13 01230 g001
Figure 2. Two-dimensional J-resolved NMR spectra of the weedy rice in the range of 0.5–3.5 ppm (A), 3.0–5.5 ppm (B), and 6.0–8.5 ppm (C). (1) fatty acids (0.88 ppm, d, J = 7.0); (2) butyric acid (0.89 ppm, d, J = 7.0); (3) isoleucine (0.95 ppm, t, J = 7.5); (4) leucine (0.96 ppm, d, J = 6.5); (5) valine (1.01 ppm, d, J = 7.0); (6) 2,3-butanediol (1.12 ppm, d, J = 7.0); (7) threonine (1.33 ppm, d, J = 6.6); (8) alanine (1.47 ppm, d, J = 6.6); (9) γ-aminobutyric acid (2.32 ppm, d, J = 7.5) (10) choline (3.23 ppm, s); (11) γ-oryzanol (3.92 ppm, s); (12) fructose (4.13 ppm, d, J = 8.2); (13) β-glucose (4.53 ppm, d, J = 7.7); (14) α-glucose (5.15 ppm, d, J = 3.7); (15) sucrose (5.4 ppm, d, J = 3.8); (16) fumaric acid (6.52 ppm, s); (17) ferulic acid (7.14 ppm, d, J = 8.0); (18) phenylalanine (7.38 ppm, d, J = 6.2); (19) formic acid (8.48, s).
Agriculture 13 01230 g002
Figure 3. Score plot (A) of principal component analysis (PCA) derived from 1H NMR spectra of weedy rice (red dots) and cultivated rice (green dots). Summary of fit (B) with R2 value (green bar) and Q2 value (blue bar).
Agriculture 13 01230 g003
Figure 4. Score plot (A) of partial least squares discriminant analysis (PLS-DA) derived from 1H NMR spectra of weedy rice (red dots) and cultivated rice (green dots). Summary of fit (B) and per mutation test (C) with R2 value (green) and Q2 value (blue). Loading plot (D) of PLS-DA with X variables of 1H NMR signals (grey dots) and Y variables of the sample class: weedy rice and cultivated rice (blue dots).
Agriculture 13 01230 g004
Figure 5. Score plot (A) of orthogonal partial least squares discriminant analysis (OPLS-DA) derived from 1H NMR spectra of weedy rice (red dots) and cultivated rice (green dots). Column loading plot (B) of OPLS-DA. (1) Valine/leucine/isoleucine, fatty acids; (2) 2,3-butanediol; (3) threonine/alanine; (4) butyric acid; (5) choline; (6) γ-aminobutyric acid (GABA); (7) γ-oryzanol; (8) fructose; (9) β-glucose; (10) α-glucose; (11) sucrose; (12) fumaric acid; (13) ferulic acid; (14) phenylalanine; (15) formic acid.
Agriculture 13 01230 g005
Figure 6. Score plot (A) of partial least squares discriminant analysis (PLS-DA) derived from 1H NMR spectra of cultivated rice (green dots) and weedy rice from east coast (blue dots) and west coast regions (red dots). Summary of fit (B) and permutation test (C) with R2 value (green) and Q2 value (blue). Loading plot (D) of PLS-DA and hierarchical cluster analysis (E) derived from 1H NMR spectra. CR, cultivated rice (Ctr); EC, east coast region; WC, west coast region; CL1-CL4, clusters 1–4.
Agriculture 13 01230 g006
Figure 7. Score plot (A) of partial least squares discriminant analysis (PLS-DA) derived from 1H NMR spectra of weedy rice from east coast (blue dots) and west coast regions (red dots). Summary of fit (B) and permutation test (C) with R2 value (green) and Q2 value (blue). Loading plot (D) of PLS-DA with X variables of 1H NMR signals (grey dot) and Y variables of the sample class: east coast region and west coast region (blue dot).
Agriculture 13 01230 g007
Figure 8. Score plot (A) of orthogonal partial least squares discriminant analysis (OPLS-DA) derived from 1H NMR spectra of weedy rice from east coast (blue dots) and west coast regions (red dots). Column loading plot (B) and hierarchical cluster analysis (C) of OPLS-DA. (1) Valine/leucine/isoleucine, fatty acids; (2) 2,3-butanediol; (3) threonine/alanine; (4) butyric acid; (5) choline; (6) γ-aminobutyric acid (GABA); (7) γ-oryzanol; (8) fructose; (9) β-glucose; (10) α-glucose; (11) sucrose; (12) fumaric acid; (13) ferulic acid; (14) phenylalanine; (15) formic acid. EC, east coast region; WC, west coast region.
Agriculture 13 01230 g008
Figure 9. Score plot (A) of orthogonal partial least squares discriminant analysis (OPLS-DA) of red pericarp (red dots) and white pericarp (grey dots) colors in weedy rice from east coast (EC) and west coast (WC) regions and cultivated rice (Ctr). Column loading plot (B) of OPLS-DA. (1) Valine/leucine/isoleucine, fatty acids; (2) 2,3-butanediol; (3) threonine/alanine; (4) butyric acid; (5) choline; (6) γ-aminobutyric acid (GABA); (7) γ-oryzanol; (8) fructose; (9) β-glucose; (10) α-glucose; (11) sucrose; (12) fumaric acid; (13) ferulic acid; (14) phenylalanine; (15) formic acid.
Agriculture 13 01230 g009
Table 1. The identified metabolites in weedy rice and cultivated rice. s = singlet, d = doublet, t = triplet, m = multiplet, 🗸 = detected, - = undetected.
Metabolites1H NMR Signals of Chemical Shift (ppm)
and Coupling Constant (Hz)
Weedy
Rice
Cultivated
Rice
Fatty acidsδ 0.88 (d, J = 7.0), δ 1.30 (m)🗸🗸
Butyric acidδ 0.89 (d, J = 7.0); δ 1.58 (m)🗸🗸
Isoleucineδ 0.95 (t, J = 7.5), δ 1.03 (d, J = 7.0),🗸🗸
Leucineδ 0.96 (d, J = 6.5), δ 0.98 (d, J = 6.5)🗸🗸
Valineδ 1.01 (d, J = 7.0), δ 1.06 (d, J = 7.0)🗸🗸
2,3-Butanediolδ 1.12 (d, J = 7.0)🗸🗸
Threonineδ 1.33 (d, J = 6.6)🗸🗸
Alanineδ 1.47 (d, J = 6.6)🗸🗸
γ-aminobutyric acid (GABA)δ 1.89 (m), δ 2.32 (d, J = 7.5), δ 2.98 (d, J = 7.5)🗸🗸
Cholineδ 3.23 (s)🗸🗸
γ-oryzanolδ 3.92 (s), δ 5.39 (d, J = 5.9) 🗸🗸
Fructoseδ 4.13 (d, J = 8.2), δ 3.78–3.82 (m)🗸🗸
β-glucoseδ 4.53 (d, J = 7.7)🗸🗸
α-glucoseδ 5.15 (d, J = 3.7)🗸🗸
Sucroseδ 5.4 (d, J = 3.8), δ 4.13 (d, J = 8.5)🗸🗸
Fumaric acidδ 6.52 (s)🗸-
Ferulic acidδ 7.14 (d, J = 8.0), δ 7.27 (s), δ 3.90 (s)🗸🗸
Phenylalanineδ 7.38 (t, J = 6.2)🗸-
Formic acidδ 8.48 (s)🗸🗸
Disclaimer/Publisher’s Note: The statements, opinions and data contained in all publications are solely those of the individual author(s) and contributor(s) and not of MDPI and/or the editor(s). MDPI and/or the editor(s) disclaim responsibility for any injury to people or property resulting from any ideas, methods, instructions or products referred to in the content.

