
Chili Pepper Farmers’ Pesticide Use and Residues under Thailand’s Public Good Agricultural Practices Standard: A Case Study in Chiang Mai Province
 , ,
, , 
Abstract
:1. Introduction
2. Materials and Methods
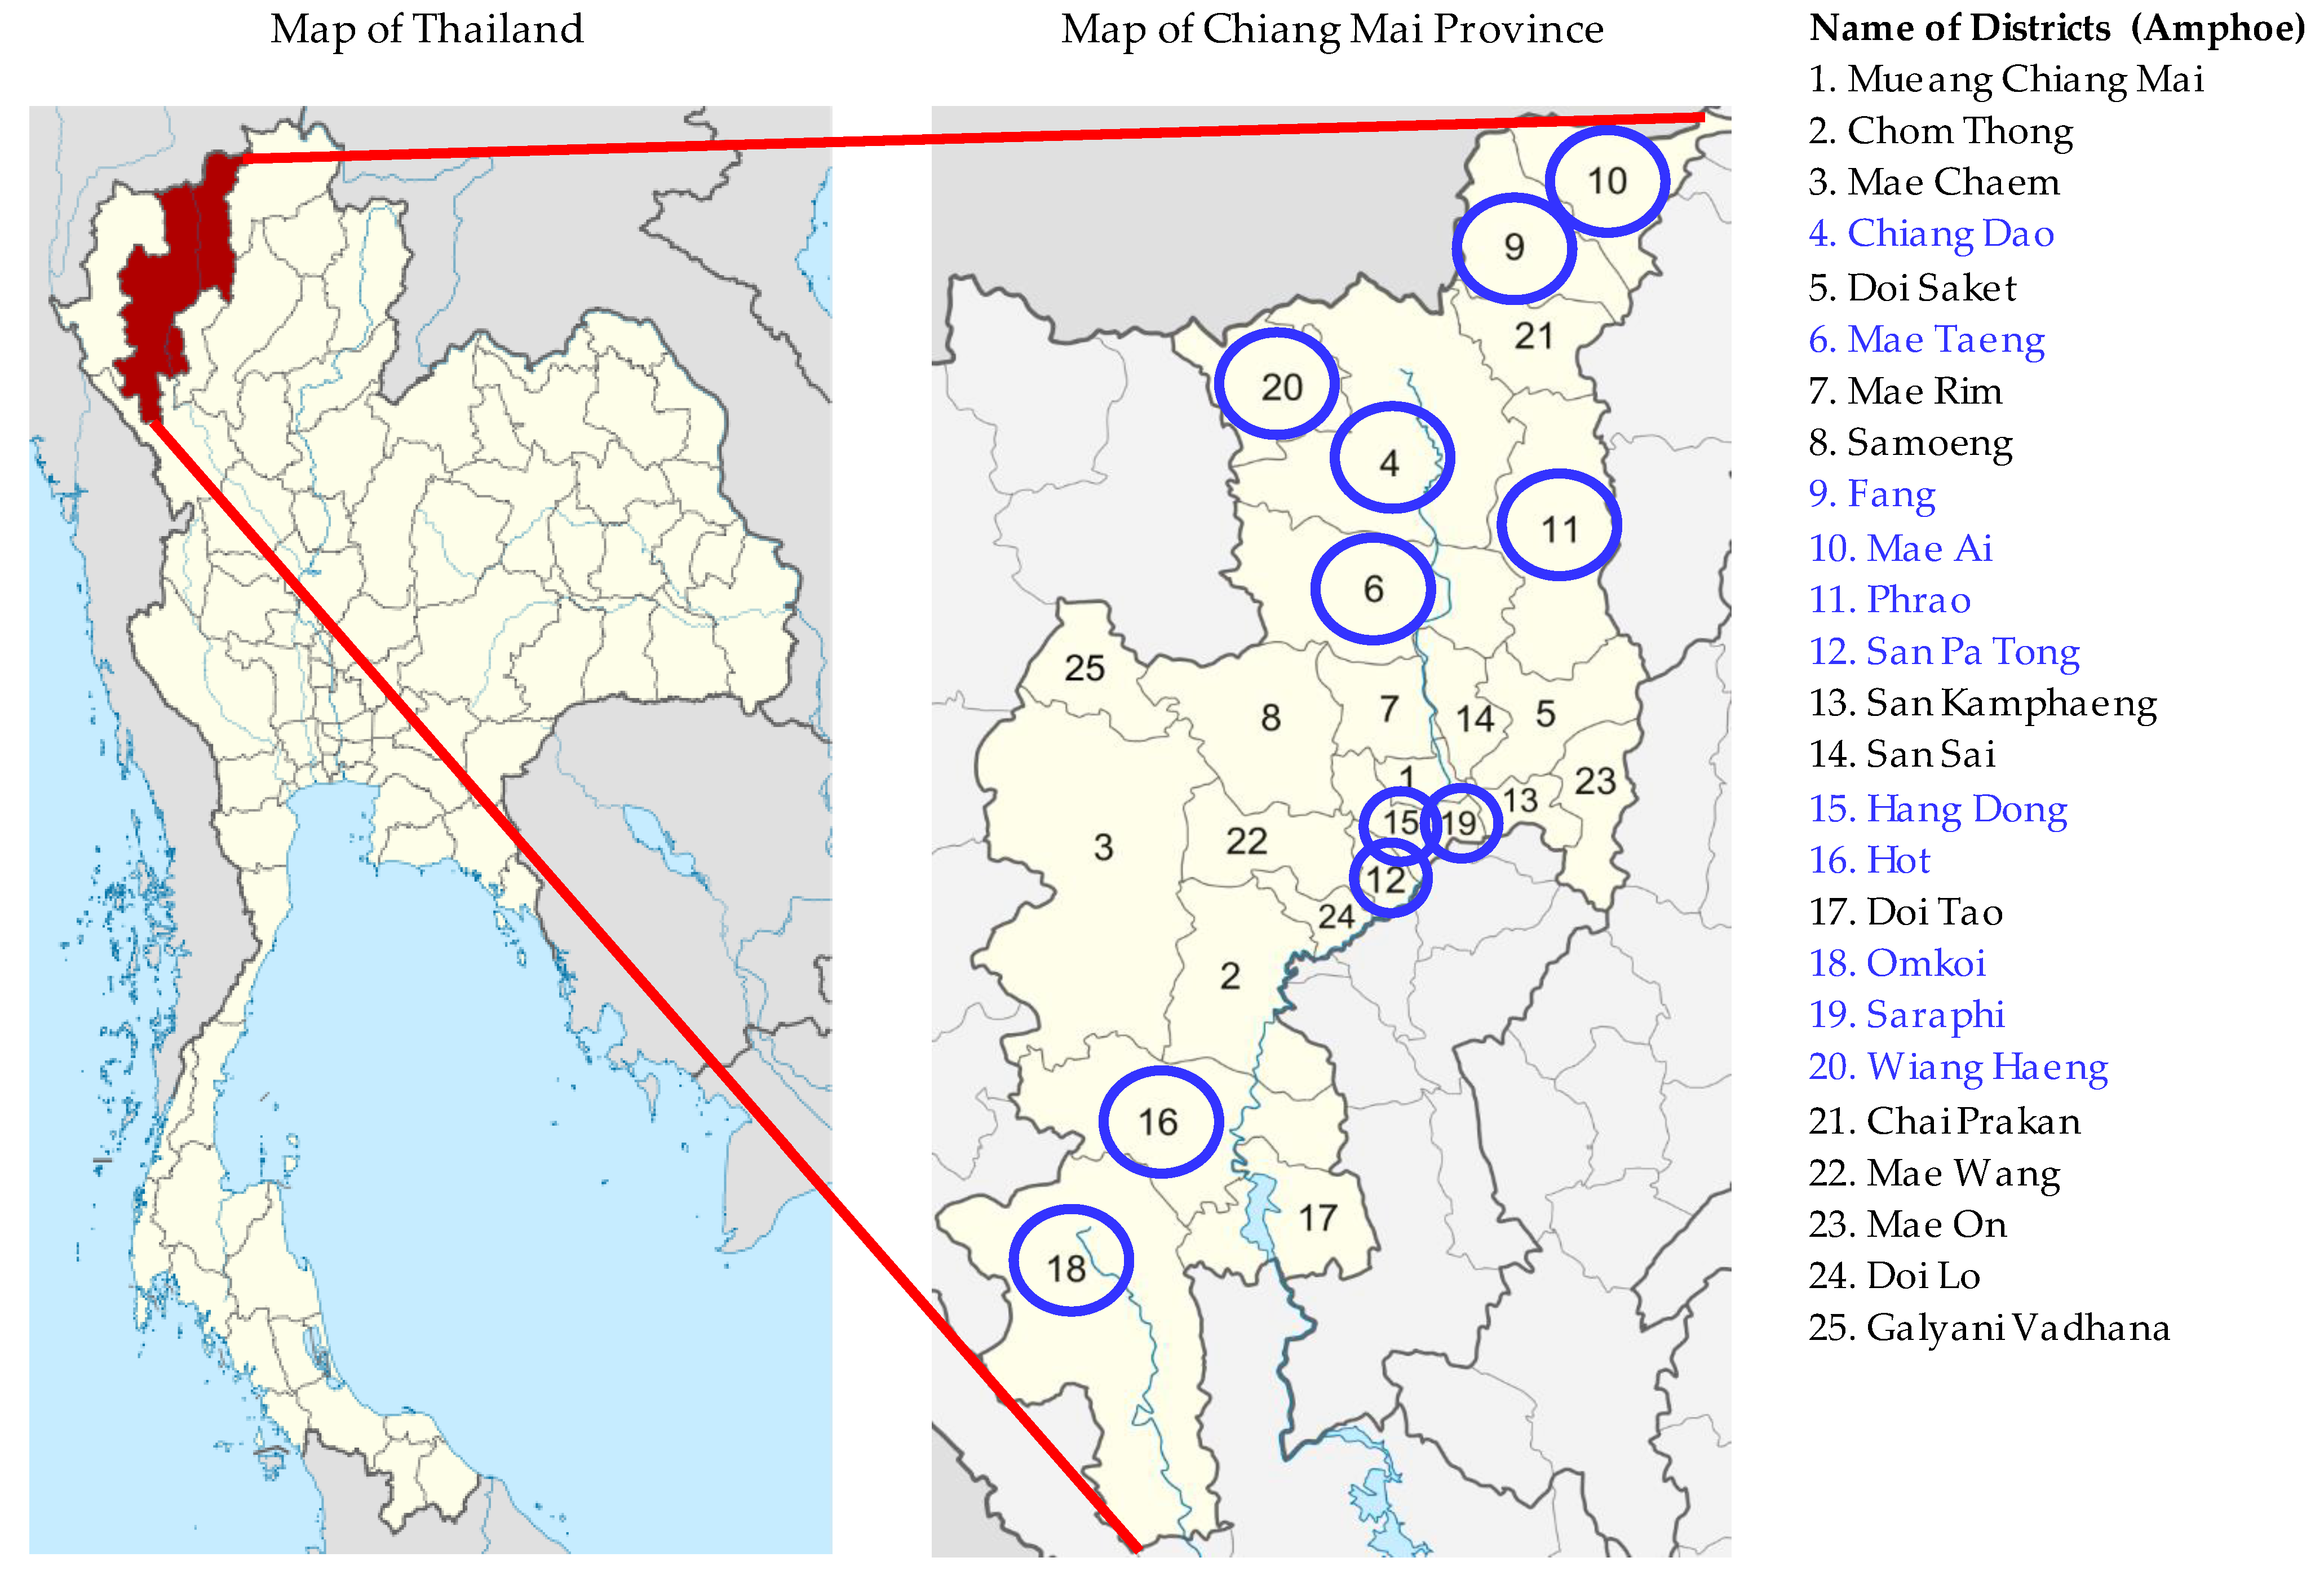
2.1. Sampling Procedures
2.2. Pesticide Residue Analysis
2.3. Statistical Data Processing
3. Results and Discussion
3.1. Socio-Economic Profile of the Farmers Surveyed
3.2. Farmers’ Adoption of Q-GAP Standard
3.3. Farmers’ Perceptions of GAP Policy and Pesticide Use
3.4. Farmers’ Training Experiences
3.5. Certified Farmers’ Experiences of Audit
3.6. Synthetic Pesticide Use
3.7. Detected Pesticide Residue Levels
3.8. Non-Synthetic Pest Management
3.9. Record-Keeping
3.10. Factors Affecting the Adoption of Q-GAP
3.11. Factors Affecting the Quantity of Pesticide Residue
4. Conclusions
- The integrated, multi-dimensional approach used in this study provides valuable and enlightening methodological contributions to food safety research in general, and specifically to the ASEAN public GAP scholarship.
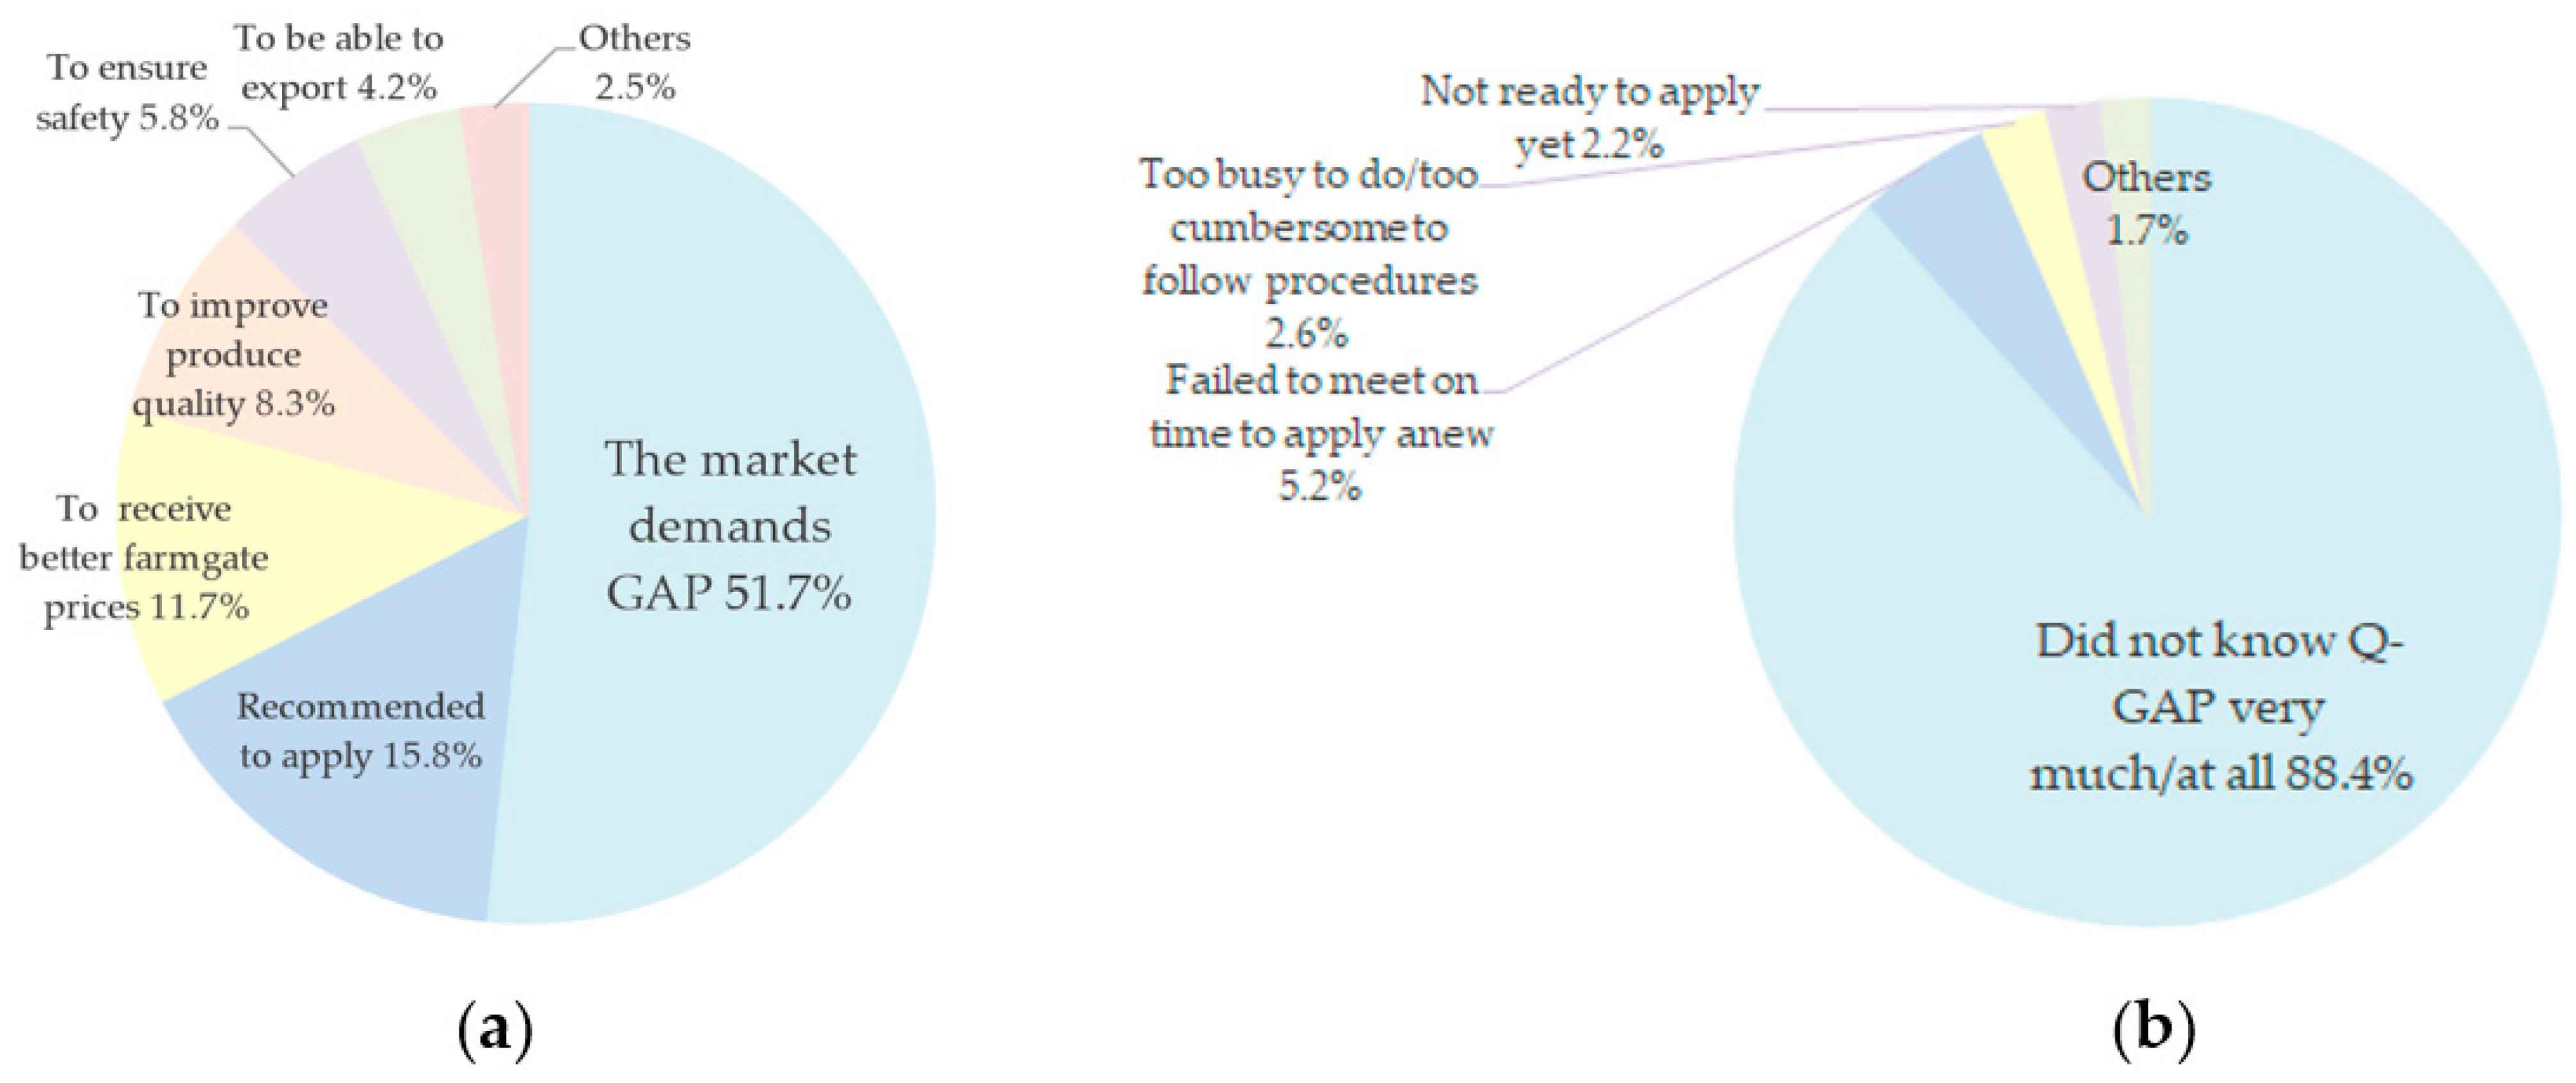
- In domestic-marketing-oriented chili pepper production, safety assurance was not a key motivation for certified growers to participate in Q-GAP. Meeting market requirements was the primary motivation for these chili pepper growers. DoA extension officers should consider this when promoting Q-GAP to chili pepper farmers.
- The certified chili pepper farmers had a significantly lower adoption of insecticides compared to uncertified farmers, but there were no significant differences in fungicide or herbicide adoption. The certified chili pepper farmers had fewer annual pesticide sprayings for all three types of pesticides than their uncertified counterparts. However, the pesticide residue analysis results were mixed, making it difficult to conclude whether the certified farmers had superior control over pesticide residues than the uncertified farmers.
- The probit regression analysis revealed the critical importance of training for Q-GAP adoption, which is consistent with the finding that the uncertified farmers did not apply for Q-GAP due to a lack of knowledge about GAP. However, the MLR results for the certified farmers, regarding the factors affecting the quantity of the detected residues, were mixed for training and contradictory for pesticide use. Further studies are needed to understand these results.
Author Contributions
Funding
Institutional Review Board Statement
Data Availability Statement
Acknowledgments
Conflicts of Interest
Appendix A
Appendix A.1. Certification Procedure of Q-GAP Standard (TAS 9001–2013)
Appendix A.2. Agronomic Features of Chili Pepper

| No. | Common Name | Trade Name | Concentration | IUPAC Name * | Molecular Formula | Chemical Structure Depiction |
|---|---|---|---|---|---|---|
| Insecticides | ||||||
| 1 | Spinetoram | Exalt | 12% w/v SC | (2R,5R,9R,10S,14R,15S,19S)-15-[(2R,5S,6R)-5-(dimethylamino)-6-methyloxan-2-yl]oxy-7-[(2R,3R,4R,5S,6S)-4-ethoxy-3,5-dimethoxy-6-methyloxan-2-yl]oxy-19-ethyl-14-methyl-20-oxatetracyclo [10.10.0.02,10.05,9]docos-11-ene-13,21-dione | C42H69NO10 | 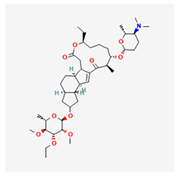 |
| 2 | Abamecti-n | Abam-ectin | 1.8% w/v EC | (1′R,2R,3S,4′S,6S,8′R,10′E,12′S,13′S,14′E,16′E,20′R,21′R,24′S)-2-butan-2-yl-21′,24′-dihydroxy-12′-[(2R,4S,5S,6S)-5-[(2S,4S,5S,6S)-5-hydroxy-4-methoxy-6-methyloxan-2-yl]oxy-4-methoxy-6-methyloxan-2-yl]oxy-3,11′,13′,22′-tetramethylspiro [2,3-dihydropyran-6,6′-3,7,19-trioxatetracyclo [15.6.1.14,8.020,24]pentacosa-10,14,16,22-tetraene]-2′-one;(1′R,2R,3S,4′S,6S,8′R,10′E,12′S,13′S,14′E,16′E,20′R,21′R,24′S)-21′,24′-dihydroxy-12′-[(2R,4S,5S,6S)-5-[(2S,4S,5S,6S)-5-hydroxy-4-methoxy-6-methyloxan-2-yl]oxy-4-methoxy-6-methyloxan-2-yl]oxy-3,11′,13′,22′-tetramethyl-2-propan-2-ylspiro [2,3-dihydropyran-6,6′-3,7,19-trioxatetracyclo [15.6.1.14,8.020,24]pentacosa-10,14,16,22-tetraene]-2′-one | C95H142O28 |  |
| 3 | Cypermethrin | Saima 35 | 35% w/v EC | [cyano-(3-phenoxyphenyl)methyl] 3-(2,2-dichloroethenyl)-2,2-dimethylcyclopropane-1-carboxylate | C22H19Cl2NO3 | 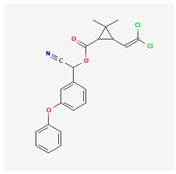 |
| 4 | Triazophos | Triazophos 40 | 40% w/v EC | diethoxy-[(1-phenyl-1,2,4-triazol-3-yl)oxy]-sulfanylidene-lambda5-phosphane | C12H16N3O3PS | 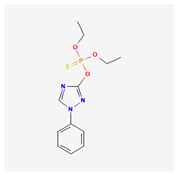 |
| 5 | Fipronil | Fipronil (Thai Base) | 5% w/v SC | 5-amino-1-[2,6-dichloro-4-(trifluoromethyl)phenyl]-4-(trifluoromethylsulfinyl)pyrazole-3-carbonitrile | C12H4Cl2F6N4OS |  |
| 6 | Thiamethoxam | Thana Star | 25% WG | (NE)-N-[3-[(2-chloro-1,3-thiazol-5-yl)methyl]-5-methyl-1,3,5-oxadiazinan-4-ylidene]nitramide | C8H10ClN5O3S | 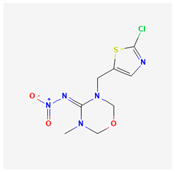 |
| 7 | Amitraz | Maithraj | 20% w/v EC | N′-(2,4-dimethylphenyl)-N-[(2,4-dimethylphenyl)iminomethyl]-N-methylmethanimidamide | C19H23N3 | 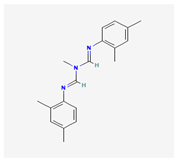 |
| 8 | Amitraz | Maithraj | 20% w/v EC | N′-(2,4-dimethylphenyl)-N-[(2,4-dimethylphenyl)iminomethyl]-N-methylmethanimidamide | C19H23N3 | 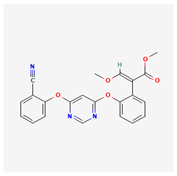 |
| 9 | Carbosulfan | Posz | 20% w/v EC | 2,3-dihydro-2,2-dimethylbenzofuran-7-yl (dibutylaminothio) methylcarbamate | C20H32N2O3S | 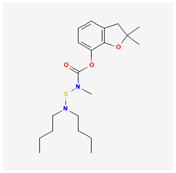 |
| Fungicides | ||||||
| 1 | Azoxystrobin | Stoper | 25% w/v SC | methyl (E)-2-[2-[6-(2-cyanophenoxy)pyrimidin-4-yl]oxyphenyl]-3-methoxyprop-2-enoate | Azoxystrobin | 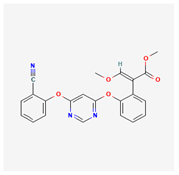 |
| 2 | Copper hydroxide | Funguran | 77% WP | copper;dihydroxide | Copper hydroxide |  |
| 3 | carbendazim | Agben F. | 50% SC | methyl N-(1H-benzimidazol-2-yl)carbamate | carbendazim |  |
| Herbicides | ||||||
| 1 | Fenoxaprop-p-ethyl | Phenosaprop-P-Ethyl 690 | 6.9% w/v EW | ethyl (2R)-2-[4-[(6-chloro-1,3-benzoxazol-2-yl)oxy]phenoxy]propanoate | C18H16ClNO5 |  |
| 2 | Clethodim | Clethodim | 24% w/v EC | 2-[(E)-N-[(E)-3-chloroprop-2-enoxy]-C-ethylcarbonimidoyl]-5-(2-ethylsulfanylpropyl)-3-hydroxycyclohex-2-en-1-one | C17H26ClNO3S |  |
References
- Laosutsana, P.; Shivakotib, G.P.; Soni, P. Comparative advantage and export potential of Thai vegetable products following the integration into the ASEAN Economic Community. Int. Food Agribus. Manag. Rev. 2017, 20, 575–590. [Google Scholar] [CrossRef]
- Ishikawa, K. The ASEAN Economic Community and ASEAN economic integration. J. Contemp. East Asia Stud. 2021, 10, 24–41. [Google Scholar] [CrossRef]
- Fintrac Inc. Study on Mutual Recognition Models for the ASEAN Agricultural Best Practices: Final Report. 2017. Available online: http://aadcp2.org/wp-content/uploads/Study-on-Mutual-Recognition-Models_FINAL-REPORT_REVISED_4-25-178767.pdf (accessed on 21 February 2023).
- FAO. Development of Standards for Scheme for Good Agricultural Practices (GAP) Implementation and Certification Based on ASEANGAP. 2020. Available online: https://www.fao.org/3/cb1303en/CB1303EN.pdf (accessed on 19 February 2023).
- Krasachat, W. The effect of good agricultural practices on the technical efficiency of chili production in Thailand. Sustainability 2023, 15, 866. [Google Scholar] [CrossRef]
- Sareen, S. Implementing ASEANGAP in the Fruit and Vegetable Sector: Its Certification and Accreditation. 2014. Available online: https://www.fao.org/3/i3576e/i3576e.pdf (accessed on 21 February 2023).
- Premier, R.; Ledger, S. Good Agricultural Practices in Australia and Southeast Asia. 2006. Available online: https://journals.ashs.org/horttech/view/journals/horttech/16/4/article-p552.xml (accessed on 19 February 2023).
- Australian Aid. Moving towards Global Recognition of Quality Assurance Systems for ASEAN Fruits and Vegetables. Available online: http://aadcp2.org/wp-content/uploads/ASEAN-GAP-PB-mgm_final.pdf (accessed on 19 February 2023).
- Amekawa, Y.; Bumrungsri, S.; Wayo, K.; Gebre, G.G.; Hongsibsong, S. Pesticide Use under Public Good Agricultural Practices Standard: A Comparative Study in Thailand. Agriculture 2022, 12, 606. [Google Scholar] [CrossRef]
- Department of Agriculture, Thailand. GAP DoA Online. 2023. Available online: http://gap.doa.go.th (accessed on 26 March 2023).
- GlobalG.A.P. History. 2020. Available online: https://www.globalgap.org/uk_en/who-we-are/about-us/history/ (accessed on 20 November 2020).
- GlobalG.A.P. In Europe: Facts and Figures. 2019. Available online: https://www.globalgap.org/uk_en/media-events/news/articles/GLOBALG.A.P.-in-Europe-Facts-and-Figures/ (accessed on 20 November 2020).
- Amekawa, Y.; Chuan, N.C.; Lumayag, L.A.; Tan, G.H.; Wong, C.S.; Abdulra’uf, L.B.; Tan, H.B.; Tai, W.X.; Tan, S.M.; Liu, C.H. Producers’ perceptions of public good agricultural practices and their pesticide use: The case of MyGAP for durian farming in Pahang, Malaysia. Asian J. Agric. Rural Dev. 2017, 7, 1–16. [Google Scholar] [CrossRef]
- Van Bac, H.O.; Nanseki, T.; Chomei, Y. Impact of VietGAP tea production on farmers’ income in Northern Vietnam. Agric. Manag. Res. 2017, 56, 100–105. [Google Scholar]
- Krause, H.; Lippe, R.S.; Grote, U. Adoption and income effects of public GAP standards: Evidence from the horticultural sector in Thailand. Horticulturae 2016, 2, 18. [Google Scholar] [CrossRef]
- Laosutsan, P.; Shivakot, G.P.; Soni, P. Factors influencing the adoption of good agricultural practices and export decision of Thailand’s vegetable farmers. Int. J. Commons 2019, 13, 867–880. [Google Scholar] [CrossRef]
- Loan, L.T.T.; Pabuayon, I.M.; Catelo, S.P.; Sumalde, Z.M. Adoption of good agricultural practices (VietGAP) in the lychee Indistry in Vietnam. Asian J. Agric. Ext. Econ. Sociol. 2016, 8, 1–12. [Google Scholar]
- Pongvinyoo, P.; Yamao, M.; Hosono, K. Cost efficiency of Thai national GAP (QGAP) and mangosteen farmers’ understanding in Chanthaburi Province. Am. J. Rural Dev. 2015, 3, 15–23. [Google Scholar] [CrossRef]
- Mankeb, P.; Limunggura, T.; In-Go, A.; Chulilung, P. Adoption of Good Agricultural Practices by durian farmers in Koh Samui district, Surat Thani Province, Thailand. Soc. Soc. Manag. Sys. Internet J. 2014, 9, 1–6. [Google Scholar]
- Nicetic, O.; van de Fliert, E.; Van Chien, H.; Mai, V.; Cuong, L. Good Agricultural Practice (GAP) as a Vehicle for Transformation to Sustainable Citrus Production in the Mekong Delta of Vietnam. In Proceedings of the 9th European IFSA Symposium, Vienna, Austria, 4–7 July 2010; Available online: http://ifsa.boku.ac.at/cms/fileadmin/Proceeding2010/2010_WS4.4_Nicetic.pdf (accessed on 30 March 2015).
- Suwanmaneepong, S.; Kullachai, P.; Fakkhong, S. An investigation of factors influencing the implementation of GAP among fruit farmers in Rayong Province, Thailand. Int. J. Agric. Technol. 2016, 12, 1745–1757. [Google Scholar]
- Hoang, G.H. Adoption of good agricultural practices by cattle farmers in the Binh Dinh Province of Vietnam. J. Agric. Ext. 2020, 24, 151–160. [Google Scholar] [CrossRef]
- Amekawa, Y.; Hongsibsong, S.; Sawarng, N.; Yadoung, S.; Gebre, G.G. Producers’ perceptions of public GAP standard and their pesticide use: The case of cabbage farming in Chiang Mai Province, Thailand. Sustainability 2021, 13, 6333. [Google Scholar] [CrossRef]
- Maw, T.; Leshan, J.; Aung, H.P. Assessing the adoption of good agricultural practices in muskmelon production in Chaung Oo Township, Myanmar. Asian J. Agric. Ext. Econ. Sociol. 2023, 41, 124–133. [Google Scholar] [CrossRef]
- Tinh, L.; Hung, P.T.M.; Dzung, D.G.; Trinh, V.H.D. Determinants of farmers’ intension of applying new technology in production: The case of VietGAP standard adoption in Vietnam. Asian J. Agric. Rural Dev. 2019, 9, 164–178. [Google Scholar] [CrossRef]
- Banzon, A.; Mojica, L.E.; Cielo, A.A. Adoption of Good Agricultural Practices (GAP): How does the Philippines fare? J. Interdiscip. Netw. 2013, 2, 2–8. [Google Scholar]
- Amekawa, Y. Can a public GAP approach ensure safety and fairness? A comparative study of Q-GAP in Thailand. J. Peasant Stud. 2013, 41, 189–217. [Google Scholar] [CrossRef]
- Schreinemachers, P.; Schad, I.; Tipraqsa, P.; Williams, P.M.; Neef, A.; Riwthong, S.; Sangchan, W.; Grovermann, C. Can public GAP standards reduce agricultural pesticide use? The case of fruit and vegetable farming in northern Thailand. Agric. Hum. Values 2012, 29, 519–529. [Google Scholar] [CrossRef]
- Srisopaporn, S.; Jourdain, D.; Perret, S.R.; Shivakoti, G. Adoption and continued participation in a public Good Agricultural Practices program: The case of rice farmers in the Central Plains of Thailand. Technol. Forecast. Soc. 2015, 96, 242–253. [Google Scholar] [CrossRef]
- Amekawa, Y.; Tiyayon, C.; Treewannakul, P.; Sawarng, N. Mango growers’ compliance with public good agricultural practices standard: A comparative study in Northern Thailand. Asian J. Agric. Rural Dev. 2022, 12, 260–270. [Google Scholar] [CrossRef]
- Chau, T.H.B. Propensity score matching method to estimate impact of VietGAP program on health of farmers in Thua Thien Hue Province. Vietnam. Hue Univ. J. Sci. 2017, 126, 17–31. [Google Scholar]
- Athipanyakul, T.; Pak-Uthai, W. Determinants of good agricultural practices (GAP) adoption in the chili production system in Northeastern Thailand: A case of participatory approach. Int. J. Environ. Rural Dev. 2012, 3, 175–180. [Google Scholar]
- Codex Alimentarius. Codex Pesticide Residues in Food Online Database. 2017. Available online: https://www.fao.org/fao-who-codexalimentarius/codex-texts/dbs/pestres/en/ (accessed on 27 March 2023).
- Sapbamrer, R.; Hongsibsong, S. Organophosphorus pesticide residues in vegetables from farms, markets, and a supermarket around kwan phayao lake of northern Thailand. Arch. Environ. Contam. Toxicol. 2014, 67, 60–67. [Google Scholar] [CrossRef] [PubMed]
- AOAC. Official Methods of Analysis of AOAC International, 19th ed.; AOAC International: Gaithersburg, MD, USA, 2012. [Google Scholar]
- Wooldridge, J.M. Introductory Econometrics: A Modern Approach, 5th ed.; Southwestern Publishing House: Nashville, TN, USA, 2012. [Google Scholar]
- Pakvilai, N.; Prapamontol, T.; Thavornyutikam, P.; Mangklabruks, A.; Chantara, S.; Hongsibsong, S.; Santasup, C. A simple and sensitive GC-ECD method for detecting synthetic pyrethroid insecticide residues in vegetable and fruit samples. Chiang Mai J. Sci. 2015, 42, 196–207. [Google Scholar]
- Department of Agricultural Extension. Agricultural Production Information Service System. 2023. Available online: https://production.doae.go.th/service/site/login (accessed on 24 March 2023).
- Kirana, R.; Anwariudin, M.J.; Setiawati, W. The diversity of chili pepper volatile compounds and its relationship to insect pests. IOP Conf. Ser. Earth Environ. Sci. 2021, 948, 12042. [Google Scholar] [CrossRef]
- Islam, A.H.M.S.; Schreinmachers, P.; Kumar, S. Farmers’ knowledge, perceptions and management of chili pepper anthracnose disease in Bangladesh. Crop. Prot. 2020, 133, 105139. [Google Scholar] [CrossRef]
- Laohaudomchoka, W.; Nankongnaba, N.; Siriruttanaprukb, S.; Klaimalac, P.; Lianchamroond, W.; Ousape, P.; Jatiketf, M.; Kajitvichyanukulg, P.; Kitanah, N.; Siriwongi, W.; et al. Pesticide use in Thailand: Current situation, health risks, and gaps in research and policy. Hum. Ecol. Risk. Assess. 2021, 27, 1147–1169. [Google Scholar] [CrossRef]
- National Library of Medicine. Explore Chemistry: Quickly Find Chemical Information from Authoritative Sources. 2023. Available online: https://pubchem.ncbi.nlm.nih.gov (accessed on 17 May 2023).

| Variable Description | Certified (N = 100) | Uncertified (N = 229) | p-Value |
|---|---|---|---|
| Age (years) | 55.0 (9.9) | 53.2 (10.5) | 0.152 NS |
| Education (years) | 6.5 (3.2) | 6.5 (2.9) | 0.930 NS |
| Total farm size (ha) | 1.6 (2.1) | 1.4 (1.7) | 0.401 NS |
| Chili pepper farm size (ha) | 1.0 (1.3) | 0.8 (1.2) | 0.160 NS |
| Number of crops to grow other than chili pepper | 1.98 (1.09) | 1.35 (0.94) | 0.000 *** |
| Farms growing certified crops other than chili pepper (1 = yes) (%) | 31.0 | 1.7 | 0.000 *** |
| Permanent worker employment (1 = yes) (%) | 16.0 | 11.8 | 0.297 NS |
| Number of permanently employed workers | 1.25 (4.03) | 1.26 (6.32) | 0.991 NS |
| Variable Description | Certified (N = 100) | Uncertified (N = 229) | p-Value |
|---|---|---|---|
| Annual chili pepper produce (kg) | 3105 (5592) | 4322 (15,632) | 0.449 NS |
| Annual chili pepper yield (kg/ha) | 3708 (3923) | 6553 (23,577) | 0.231 NS |
| Lowest chili pepper price in kg (THB) | 30.88 (29.78) | 21.15 (15.12) | 0.001 *** |
| Average chili pepper price in kg (THB) | 54.52 (42.01) | 40.67 (21.10) | 0.000 *** |
| Highest chili pepper price in kg (THB) | 79.67 (38.77) | 63.53 (34.03) | 0.001 *** |
| Total chili pepper sales (THB) | 101,013 (164,769) | 105,124 (394,486) | 0.920 NS |
| Chili pepper sales per ha (THB/ha) | 209,906 (334,034) | 166,011 (598,942) | 0.585 NS |
| Average export sales (THB) | 9390 (46,863) | 2965 (27,836) | 0.124 NS |
| Variable Description (1 = Yes) | Certified (N = 100) | Uncertified (N = 229) | p-Value |
|---|---|---|---|
| Can relate the goal of the Q-GAP policy to food safety (%) | 97.0 | 70.0 (n = 40) | 0.000 *** |
| Can explain what integrated pest management (IPM) is (%) | 38.0 | 24.5 | 0.012 ** |
| Thinks that pesticides are not very harmful to the health of users when appropriately managed (%) | 77.0 | 68.9 | 0.134 NS |
| Thinks that pesticides are not very harmful to the health of consumers when appropriately managed (%) | 65.0 | 55.5 | 0.107 NS |
| Thinks that pesticides are not very harmful to the environment when appropriately managed (%) | 58.0 | 56.8 | 0.992 NS |
| Thinks that sufficient assistance has been received from local government agencies to obtain agricultural technologies or practices (%) | 58.0 | 14.8 | 0.000 *** |
| Variable Description | Certified (N = 100) | Uncertified (N = 229) | p-Value |
|---|---|---|---|
| 1. Ever received government training on pesticide use (1 = yes) (%) | 74.0 | 36.7 | 0.000 *** |
| 2. Number of days taken for participation in government training on agricultural pesticides | 1.61 (0.99) (n = 74) | 1.77 (3.22) (n = 84) | 0.671 NS |
| 3. Ever received government training on Q-GAP (1 = yes) (%) | 66.0 | 14.4 | 0.000 *** |
| 4. Number of days taken for participation in government training on Q-GAP | 1.73 (1.16) (n = 66) | 1.70 (0.92) (n = 33) | 0.896 NS |
| 5. Ever received government training on IPM (1 = yes) (%) | 38.0 | 24.4 | 0.012 ** |
| 6. Ever received government training on the use of organic fertilizer (1 = yes) (%) | 64.0 | 44.1 | 0.001 *** |
| Variable Description | Q-GAP-Certified (N = 100) |
|---|---|
| Number of times DoA audit was needed to receive Q-GAP certification | 1.25 |
| Received advance notice on the date of the first audit (1 = yes) (%) | 56.0 |
| Number of days advance notice was made prior to the first audit | 5.6 |
| Time taken for the first audit (minutes) | 43 |
| Checked in audit on the record-keeping of farming practices (1 = yes) (%) | 61.0 |
| Handed chili pepper samples directly to DoA officers for pesticide residue test (1 = yes) (%) | 71.0 |
| Variable Description | Certified (N = 100) | Uncertified (N = 229) | p-Value |
|---|---|---|---|
| Insecticides | |||
| Use (1 = yes) (%) Frequency of insecticide application in the past year | 60.0 2.19 (2.87) | 76.4 5.84 (8.64) | 0.0023 *** 0.0000 *** |
| Frequency of insecticide application in the past year when excluding those who did not use insecticides | 3.65 (2.90) (n = 60) | 7.65 (9.16) (n = 175) | 0.0010 *** |
| Changes (%) in the amount via certification (excluding those who did not use insecticides) | −26.4 (n = 60) | N.A. | N.A. |
| Fungicides | |||
| Use (1 = yes) (%) Frequency of fungicide application in the past year | 52.0 1.61 (2.32) | 60.7 −4.27 (7.60) | 0.141 NS 0.000 *** |
| Frequency of fungicide application in the past year when excluding those who did not use fungicides | 3.09 (2.40) (n = 52) | 7.06 (8.69) (n = 136) | 0.0014 *** |
| Changes (%) in the amount via certification (excluding those who did not use fungicides) | −18.8% (n = 52) | N.A. | N.A. |
| Herbicides | |||
| Use (1 = yes) (%) Frequency of herbicide application in the past year | 68.0 1.83 (2.54) | 75.1 3.28 (6.61) | 0.182 NS 0.0344 ** |
| Frequency of herbicide application in the past year when excluding those who did not use herbicides | 2.68 (2.68) (n = 68) | 4.37 (7.31) (n = 172) | 0.0639 * |
| Changes (%) in the amount via certification (excluding those who did not use herbicides) | −16.4 (n = 68) | N.A. | N.A. |
| Name of Active Chemical Ingredients | Q-GAP-Certified (N = 100) | Uncertified (N = 229) | |||||||||
|---|---|---|---|---|---|---|---|---|---|---|---|
| Mean (mg/kg) | SD | Min (mg/kg) | Max (mg/kg) | Farms Detected (%) | Mean (mg/kg) | SD | Min (mg/kg) | Max (mg/kg) | Farms Detected (%) | p-Value | |
| Diazinon | 0.0006744 | 0.014439 | 0.0181 | 0.0493 | 2.0 | 0.001617 | 0.0169633 | 0.0107 | 0.2067 | 1.31 | 0.5868 NS |
| Dicrotophos | - | - | - | - | 0 | 0.0003516 | 0.004368 | 0.0164 | 0.0641 | 0.87 | N.D. |
| Pirimiphosmetyl | - | - | - | - | 0 | 4.7869 × 10⁻⁷ | 0.0012549 | 0.0190 | 0.0190 | 0.44 | N.D. |
| Chlorpyrifos | 0.0009877 | 0.0002598 | 0.0065 | 0.0206 | 8.00 | 0.0160484 | 0.0796801 | 0.0073 | 1.0392 | 17.03 | 0.0600 * |
| Prothiophos | 0.001415 | 0.0077992 | 0.0227 | 0.0653 | 4.00 | 0.0005669 | 0.004304 | 0.0250 | 0.0374 | 1.75 | 0.2071 NS |
| Methidathion | - | - | - | - | 0 | 0.000138 | 0.001456 | 0.0131 | 0.0185 | 0.87 | N.D. |
| Profenophos | 0.0001011 | 0.0010105 | 0.0101 | 0.0101 | 1.00 | 0.0651415 | 0.454457 | 0.0124 | 5.0857 | 7.86 | 0.1537 NS |
| Ethion | 0.0008523 | 0.003878 | 0.0004 | 0.0252 | 9.00 | 0.0024631 | 0.0167453 | 0.0002 | 0.2244 | 14.85 | 0.3427 NS |
| Triazophos | 0.0042347 | 0.0050483 | 0.0067 | 0.0146 | 43.00 | 0.0050592 | 0.0063247 | 0.0070 | 0.0417 | 44.54 | 0.2498 NS |
| EPN | 0.0002108 | 0.0013552 | 0.0026 | 0.0114 | 3.00 | 0.0000944 | 0.0000944 | 0.0039 | 0.0110 | 1.31 | 0.3563 NS |
| Total | 0.008475 | 0.0137244 | 0.0004 | 0.0653 | 53.00 | 0.0915638 | 0.4690539 | 0.0002 | 5.0857 | 65.94 | 0.0777 * |
| Name of Active Chemical Ingredients | Q-GAP-Certified (N = 100) | Uncertified (N = 229) | |||||||||
|---|---|---|---|---|---|---|---|---|---|---|---|
| Mean (mg/kg) | SD | Min (mg/kg) | Max (mg/kg) | Farms Detected (%) | Mean (mg/kg) | SD | Min (mg/kg) | Max (mg/kg) | Farms Detected (%) | p-Value | |
| Fenpropathrin | 0.0002136 | 0.0011416 | 0.0030 | 0.0084 | 4.00 | - | - | - | - | 0 | N.D. |
| L-Cyhalothrin | 0.0029027 | 0.0194078 | 0.0004 | 0.1930 | 14.00 | 0.0002911 | 0.0024517 | 0.0070 | 0.0282 | 1.75 | 0.0459 ** |
| Permethrin | 0.009738 | 0.0356368 | 0.0048 | 0.2949 | 33.00 | 0.001636 | 0.0071918 | 0.0050 | 0.0620 | 10.48 | 0.0011 *** |
| Cyfluthrin | 0.0058914 | 0.0113009 | 0.0062 | 0.1062 | 52.00 | 0.0060196 | 0.0069016 | 0.0022 | 0.0428 | 54.15 | 0.8997 NS |
| Cypermethrin | 0.0951407 | 0.2427677 | 0.0051 | 1.6356 | 68.00 | 0.0269529 | 0.0794164 | 0.0044 | 0.7861 | 33.62 | 0.0002 *** |
| Fenvalerate | 0.0003851 | 0.0016896 | 0.0074 | 0.0085 | 5.00 | - | - | - | - | 0 | N.D. |
| Esfenvalerate | 0.001105 | 0.0025502 | 0.0066 | 0.0082 | 16.00 | - | - | - | - | 0 | N.D. |
| Deltamethrin | 0.0003071 | 0.0015193 | 0.0072 | 0.0089 | 4.00 | - | - | - | - | 0 | N.D. |
| Total | 0.115682 | 0.2462004 | 0.0004 | 1.6356 | 88.00 | 0.0349009 | 0.0801294 | 0.0022 | 0.0282 | 72.49 | 0.0000 *** |
| Variable Description (1 = Yes) | Certified (N = 100) | Uncertified (N = 229) | p-Value |
|---|---|---|---|
| Farmers that use at least one non-synthetic pest management method (%) | 56.0 | 39.3 | 0.005 *** |
| Adoption of specific method EM pesticides | 4.0 | 2.6 | 0.502 NS |
| Herbal insecticide | 4.0 | 2.2 | 0.353 NS |
| Lamp lighting as insect repellent | 0.0 | 1.3 | 0.250 NS |
| Wood vinegar as insect repellent | 1.0 | 0.0 | 0.130 NS |
| Ashes as insecticide | 0.0 | 1.3 | 0.250 NS |
| Bio-fungicide | 15.0 | 5.7 | 0.005 *** |
| Mowing | 22.0 | 19.2 | 0.560 NS |
| Removing weeds by hand or hoe | 9.0 | 10.0 | 0.769 NS |
| Variable Description (1 = Yes) | Certified (N = 100) | Uncertified (N = 229) | p-Value |
|---|---|---|---|
| Insecticide use (%) | 20.0 (n = 60) | 5.7 (n = 175) | 0.001 *** |
| Fungicide use (%) | 0 (n = 52) | 0 (n = 139) | N.D. |
| Herbicide use (%) | 0 (n = 68) | 0 (n = 172) | N.D. |
| Use of non-synthetic pest management methods (%) | 36.8 (n = 57) | 10.0 (n = 90) | 0.000 *** |
| Use of chemical fertilizers (%) | 29.0 (n = 62) | 24.9 (n = 189) | 0.516 NS |
| Use of other fertilization methods (%) | 36.8 (n = 38) | 4.5 (n = 111) | 0.000 *** |
| Variables | Coef. | Std. Err | p-Value |
|---|---|---|---|
| Socio-economic factors | |||
| Age (years) | 0.013 | 0.012 | 0.811 |
| Education (years) | 0.048 | 0.038 | 0.207 |
| Total farm size (ha) | −0.007 | 0.017 | 0.660 |
| Chili pepper farm size (ha) | 0.021 | 0.024 | 0.369 |
| Chili pepper produce/ha | −0.000 | 0.000 | 0.022 ** |
| Chili pepper sales/ha | 0.000 | 0.000 | 0.000 *** |
| Farmer’s Perceptions of Q-GAP Policy and Certification | |||
| Know about IPM (1 = yes) | 0.255 | 0.267 | 0.339 |
| No harm producer health (1 = yes) | 0.260 | 0.285 | 0.361 |
| No harm consumer health (1 = yes) | 0.273 | 0.279 | 0.326 |
| No harm environment (1 = yes) | −0.282 | 0.280 | 0.313 |
| Received government support (1 = yes) | 0.330 | 0.152 | 0.000 *** |
| Farmer training experiences | |||
| Training on pesticide use (1 = yes) | 0.571 | 0.255 | 0.016 ** |
| Training on Q-GAP (1 = yes) | 0.353 | 0.247 | 0.000 *** |
| Training on organic fertilizer (1 = yes) | −0.286 | 0.276 | 0.299 |
| Number of training days on pesticide use | 0.053 | 0.051 | 0.295 |
| Number of training days on Q-GAP | 0.512 | 0.128 | 0.000 *** |
| Management of synthetic pesticides | |||
| Insecticide use (1 = yes) | 0.064 | 0.343 | 0.852 |
| Fungicide use (1 = yes) | 0.508 | 0.332 | 0.219 |
| Herbicide use (1 = yes) | 0.710 | 0.351 | 0.037 ** |
| Number of times insecticides used | −0.068 | 0.043 | 0.069 * |
| Number of times fungicides used | −0.071 | 0.052 | 0.173 |
| Number of times herbicides used | 0.090 | 0.040 | 0.033 ** |
| _cons | −0.401 | 0.028 | 0.004 |
| Number of observations | 329 | ||
| LR chi2 | 218.25 | ||
| Prob > chi2 | 0.0000 | ||
| Pseudo R2 | 0.7600 | ||
| Variables | Certified | Uncertified | ||||
|---|---|---|---|---|---|---|
| Coef. | Std. Err | p-Value | Coef. | Std. Err | p-Value | |
| Socio-economic factors | ||||||
| Age (years) | −0.000 | 0.000 | 0.973 | −0.001 | 0.003 | 0.841 |
| Education (years) | 0.000 | 0.000 | 0.825 | 0.011 | 0.012 | 0.042 ** |
| Total farm size (ha) | 0.000 | 0.000 | 0.574 | 0.003 | 0.004 | 0.466 |
| Chili pepper farm size (ha) | −0.000 | 0.000 | 0.567 | −0.006 | 0.006 | 0.343 |
| Chili pepper produce/ha | −0.000 | 0.000 | 0.491 | −0.000 | 0.000 | 0.599 |
| Chili pepper sales/ha | −0.000 | 0.000 | 0.845 | 0.000 | 0.000 | 0.566 |
| Farmer’s Perceptions of Q-GAP Policy and Certification | ||||||
| Know about IPM (1 = yes) | 0.002 | 0.003 | 0.507 | 0.046 | 0.080 | 0.576 |
| No harm producer health (1 = yes) | −0.004 | 0.004 | 0.405 | 0.063 | 0.076 | 0.411 |
| No harm consumer health (1 = yes) | −0.003 | 0.005 | 0.538 | −0.093 | 0.078 | 0.237 |
| No harm environment (1 = yes) | −0.000 | 0.005 | 0.969 | 0.027 | 0.080 | 0.737 |
| Received government support (1 = yes) | 0.005 | 0.003 | 0.022 ** | 0.077 | 0.090 | 0.392 |
| Farmer training experiences | ||||||
| Training on pesticide use (1 = yes) | 0.001 | 0.004 | 0.771 | −0.030 | 0.077 | 0.698 |
| Training on Q-GAP (1 = yes) | 0.001 | 0.004 | 0.795 | −0.116 | 0.099 | 0.242 |
| Training on organic fertilizer (1 = yes) | −0.005 | 0.004 | 0.276 | 0.135 | 0.015 | 0.021 ** |
| Number of training days on pesticide use | −0.003 | 0.001 | 0.044 ** | 0.002 | 0.015 | 0.913 |
| Number of training days on Q-GAP standard | 0.000 | 0.001 | 0.799 | −0.031 | 0.048 | 0.513 |
| Management of synthetic pesticides | ||||||
| Insecticide use (1 = yes) | 0.003 | 0.005 | 0.484 | −0.055 | 0.098 | 0.572 |
| Fungicide use (1 = yes) | −0.009 | 0.005 | 0.033 ** | −0.012 | 0.093 | 0.894 |
| Herbicide use (1 = yes) | 0.001 | 0.004 | 0.001 *** | −0.019 | 0.091 | 0.831 |
| Number of times insecticides used | −0.001 | 0.001 | 0.031 ** | −0.005 | 0.008 | 0.488 |
| Number of times fungicides used | 0.003 | 0.001 | 0.002 *** | 0.009 | 0.008 | 0.289 |
| Number of times herbicides used | 0.000 | 0.001 | 0.812 | 0.005 | 0.006 | 0.400 |
| _cons | 0.004 | 0.012 | 0.192 | −0.015 | 0.222 | 0.947 |
| Number of observations | 100 | 229 | ||||
| Prob > F | 0.0265 | 0.0365 | ||||
| R-squared | 0.1972 | 0.1919 | ||||
| Adj R-squared | −0.0389 | −0.0200 | ||||
| Root MSE | 0.07310 | 0.0792 | ||||
| Variables | Certified | Uncertified | ||||
|---|---|---|---|---|---|---|
| Coef. | Std. Err | p-Value | Coef. | Std. Err | p-Value | |
| Socio-economic factors | ||||||
| Age (years) | 0.002 | 0.003 | 0.653 | 0.000 | 0.001 | 0.899 |
| Education (years) | −0.005 | 0.008 | 0.474 | 0.002 | 0.002 | 0.418 |
| Total farm size (ha) | 0.003 | 0.002 | 0.037 ** | −0.000 | 0.001 | 0.512 |
| Pepper farm size (ha) | −0.001 | 0.004 | 0.895 | −0.000 | 0.001 | 0.729 |
| Pepper produce/ha | −0.000 | 0.000 | 0.346 | 0.000 | 0.000 | 0.793 |
| Pepper sales/ha | −0.000 | 0.000 | 0.197 | −0.000 | 0.000 | 0.725 |
| Farmer’s Perceptions of Q-GAP Policy and Certification | ||||||
| Know about IPM (1 = yes) | −0.038 | 0.057 | 0.506 | 0.003 | 0.014 | 0.833 |
| No harm producer health (1 = yes) | 0.033 | 0.072 | 0.646 | −0.031 | 0.013 | 0.003 *** |
| No harm consumer health (1 = yes) | −0.069 | 0.080 | 0.386 | 0.008 | 0.013 | 0.561 |
| No harm environment (1 = yes) | 0.033 | 0.078 | 0.669 | 0.013 | 0.014 | 0.355 |
| Received government support (1 = yes) | 0.008 | 0.051 | 0.882 | 0.003 | 0.014 | 0.462 |
| Farmer training experiences | ||||||
| Training on pesticide use (1 = yes) | 0.036 | 0.062 | 0.564 | −0.002 | 0.013 | 0.891 |
| Training on Q-GAP (1 = yes) | 0.138 | 0.058 | 0.028 ** | −0.015 | 0.017 | 0.388 |
| Training on organic fertilizer (1 = yes) | −0.077 | 0.061 | 0.212 | 0.021 | 0.013 | 0.044 ** |
| Number of training days on pesticide use | −0.007 | 0.024 | 0.766 | 0.001 | 0.003 | 0.653 |
| Number of training days on Q-GAP standard | 0.026 | 0.023 | 0.258 | 0.005 | 0.008 | 0.572 |
| Management of synthetic chemicals | ||||||
| Insecticide use (1 = yes) | −0.134 | 0.080 | 0.036 ** | 0.014 | 0.017 | 0.074 * |
| Fungicide use (1 = yes) | 0.083 | 0.076 | 0.279 | −0.023 | 0.016 | 0.050 * |
| Herbicide use (1 = yes) | −0.041 | 0.069 | 0.554 | −0.014 | 0.015 | 0.355 |
| Number of times insecticides used | 0.030 | 0.016 | 0.030 ** | −0.000 | 0.001 | 0.857 |
| Number of times fungicides used | 0.026 | 0.019 | 0.174 | 0.002 | 0.001 | 0.164 |
| Number of times herbicides used | −0.019 | 0.012 | 0.026 ** | 0.003 | 0.001 | 0.040 ** |
| _cons | 0.112 | 0.190 | 0.559 | 0.028 | 0.038 | 0.460 |
| Number of observations | 100 | 229 | ||||
| Prob > F | 0.0187 | 0.0804 | ||||
| R-squared | 0.4343 | 0.3061 | ||||
| Adj R-squared | 0.1078 | 0.0154 | ||||
| Root MSE | 0.0973 | 0.0710 | ||||
Disclaimer/Publisher’s Note: The statements, opinions and data contained in all publications are solely those of the individual author(s) and contributor(s) and not of MDPI and/or the editor(s). MDPI and/or the editor(s) disclaim responsibility for any injury to people or property resulting from any ideas, methods, instructions or products referred to in the content. |
© 2023 by the authors. Licensee MDPI, Basel, Switzerland. This article is an open access article distributed under the terms and conditions of the Creative Commons Attribution (CC BY) license (https://creativecommons.org/licenses/by/4.0/).
Share and Cite
Amekawa, Y.; Hongsibsong, S.; Sawarng, N.; Gebre, G.G. Chili Pepper Farmers’ Pesticide Use and Residues under Thailand’s Public Good Agricultural Practices Standard: A Case Study in Chiang Mai Province. Agriculture 2023, 13, 1105. https://doi.org/10.3390/agriculture13051105
Amekawa Y, Hongsibsong S, Sawarng N, Gebre GG. Chili Pepper Farmers’ Pesticide Use and Residues under Thailand’s Public Good Agricultural Practices Standard: A Case Study in Chiang Mai Province. Agriculture. 2023; 13(5):1105. https://doi.org/10.3390/agriculture13051105
Chicago/Turabian StyleAmekawa, Yuichiro, Surat Hongsibsong, Nootchakarn Sawarng, and Girma Gezimu Gebre. 2023. "Chili Pepper Farmers’ Pesticide Use and Residues under Thailand’s Public Good Agricultural Practices Standard: A Case Study in Chiang Mai Province" Agriculture 13, no. 5: 1105. https://doi.org/10.3390/agriculture13051105