Article

Optimization of and Experiment on Simulation Parameters for Rotary Hole Filling Corn Precision Metering Device

1
College of Mechanical Electronic Engineering, Fujian Agriculture and Forestry University, Fuzhou 350002, China
2
College of Engineering, Northeast Agricultural University, Harbin 150030, China
*
Authors to whom correspondence should be addressed.
Agriculture 2023, 13(5), 1093; https://doi.org/10.3390/agriculture13051093
Submission received: 27 April 2023 / Revised: 15 May 2023 / Accepted: 18 May 2023 / Published: 19 May 2023
(This article belongs to the Section Agricultural Technology)

Abstract

:
This study is aimed at the special working conditions of seeding on sloping land, combining advanced precision seeding technology and the structure of rotary hole filling corn precision metering device seed rowers at home and abroad, and studying soil entry characteristics, the characteristics of soil particles and the seed transport pattern in the puncture process, in order to improve the seed dispersal qualified index and reduce the coefficient of variation in the process of seeding. The simulation test of the cavity-tying device was carried out using the MBD–DEM coupling method, and it can be seen that the rocker bending angle is 120° when the force is the largest; at this time the rocker and the soil force is the largest, indicating the best effect on soil particle separation and the fastest movement speed. The single-factor test determined that the operating speed of the seed rower ranged from 0.8 to 1.2 m/s, the spring preload force of the seed rower ranged from 5.5 to 25 N, and the operating slope angle of the seed rower ranged from 8° to 16°. The optimal structure and parameter characteristics of the rotary hole filling corn precision metering device were determined with a multi-factor test, and it was proven that the rotary hole filling corn precision metering device has better performance and a higher seed rowing quality, with the qualified index reaching 96.2%. This study can provide a reference for the research of corn precision seeders, enrich the form of corn precision seeders, and effectively improve the level of corn mechanized seeding.

1. Introduction

Corn is the most widely grown crop in the world and is widely planted in different regions of the country because of its high drought tolerance, cold tolerance, barrenness tolerance, and environmental adaptability [1]. However, the development of precision seeding technology in China is seriously restricted by the high operational difficulty, poor moisture retention capacity, and unsuitability of large farming tools on sloping land. In Northeast China, sloping land accounts for more than 60% of the total cultivated area [2,3,4], among which corn, as the main crop of sloping land, has a direct impact on its operational quality on food security in China, so it is important to ensure the quality of corn sowing under sloping land working conditions [5].
According to different corn varieties, agronomic requirements, and sowing methods, researchers at home and abroad have conducted a lot of production and experimental research on corn seeders [6,7,8,9,10]. Among them, precision sowing technology allows seeds to be sown to predetermined positions according to agronomic requirements, with mulching suppression and proper fertilization and irrigation to ensure smooth and neat development and growth of the crop [11,12,13]. This method saves on seed dosage, avoids interplanting work, has the advantage of cost savings and labor intensity reduction, and is widely used in corn sowing operations in many countries.
Amirkhani et al. [14] designed a double-disc pneumatic seed rower to achieve an increase in seeding speed while decreasing the circumferential speed of the disc and reducing the grain spacing coefficient of variation to improve field workability. Inderpal et al. [15] studied and designed a tilting disc-type precision seeder, selected tilt angle and corn seed type as test factors, and conducted bench tests with the grain spacing conformity index and coefficient of variation as evaluation indexes to finally determine the optimal combination of parameters. Dylan et al. [16] analyzed the air-priming seed disperser through performance test studies, using hole diameter, number of holes, and sowing operation speed as influencing factors, and pass, reseed, and miss rates as performance indicators for bench tests. Rajaiah et al. [17] investigated the effect of different mounting angles of seeding discs on seeding performance with a seed rower, and the best combination of parameters was obtained through multifactorial tests. Devesh et al. [18] designed and studied a seed rower for sowing soybean, which overcame the uneven distribution of seeds. Foreign research on precision seeders is becoming more and more mature, and many different series of precision seeders have been developed. However, the pneumatic seed meter is not suitable for working on sloping cultivated farmland with undulating terrains due to its complex structure and the need to be equipped with fans and large agricultural machinery [19,20,21]. The mechanical seed meter has become the most widely used seed rower in sloping cultivated land because of its simple structure, high reliability and the ability to work with small and medium-sized farm equipment. Wang et al. [22] designed a standard finger-clamp and scoop-clamp type of corn precision seeder to improve the operational quality and suitable sowing range of mechanized corn seeders and improved and optimized the structural parameters of the key components of a finger-spoon seed disc and the limit of guide assembly. Lu et al. [23,24] developed a duckbill precision seeder for agronomic patterns and sowing requirements in Xinjiang, which can realize the precision sowing of highly dense and ultra-narrow row crops. However, the mechanical seed meter has shortcomings such as poor seeding quality, missed seeding and serious seed damage, which seriously restricts the development of precision seeding technology. In response to this problem, it is important to design a kind of corn precision seed rowing device applicable to sloping land environments.
In this study, a rotary hole filling corn precision metering device was optimized to meet the agronomic requirements of sloping land and to improve seeding quality. The discrete element model of corn seed was established through 3D scanning, while the process of seed rower and burrowing of the duckbill device was investigated using the MBD–DEM coupling method. The soil movement and the force on the rocker were analyzed, and the design rationality and simulation accuracy were verified through bench tests to obtain the optimal performance and structural parameter combination of the rotary hole filling corn precision metering device.

2. Materials and Methods

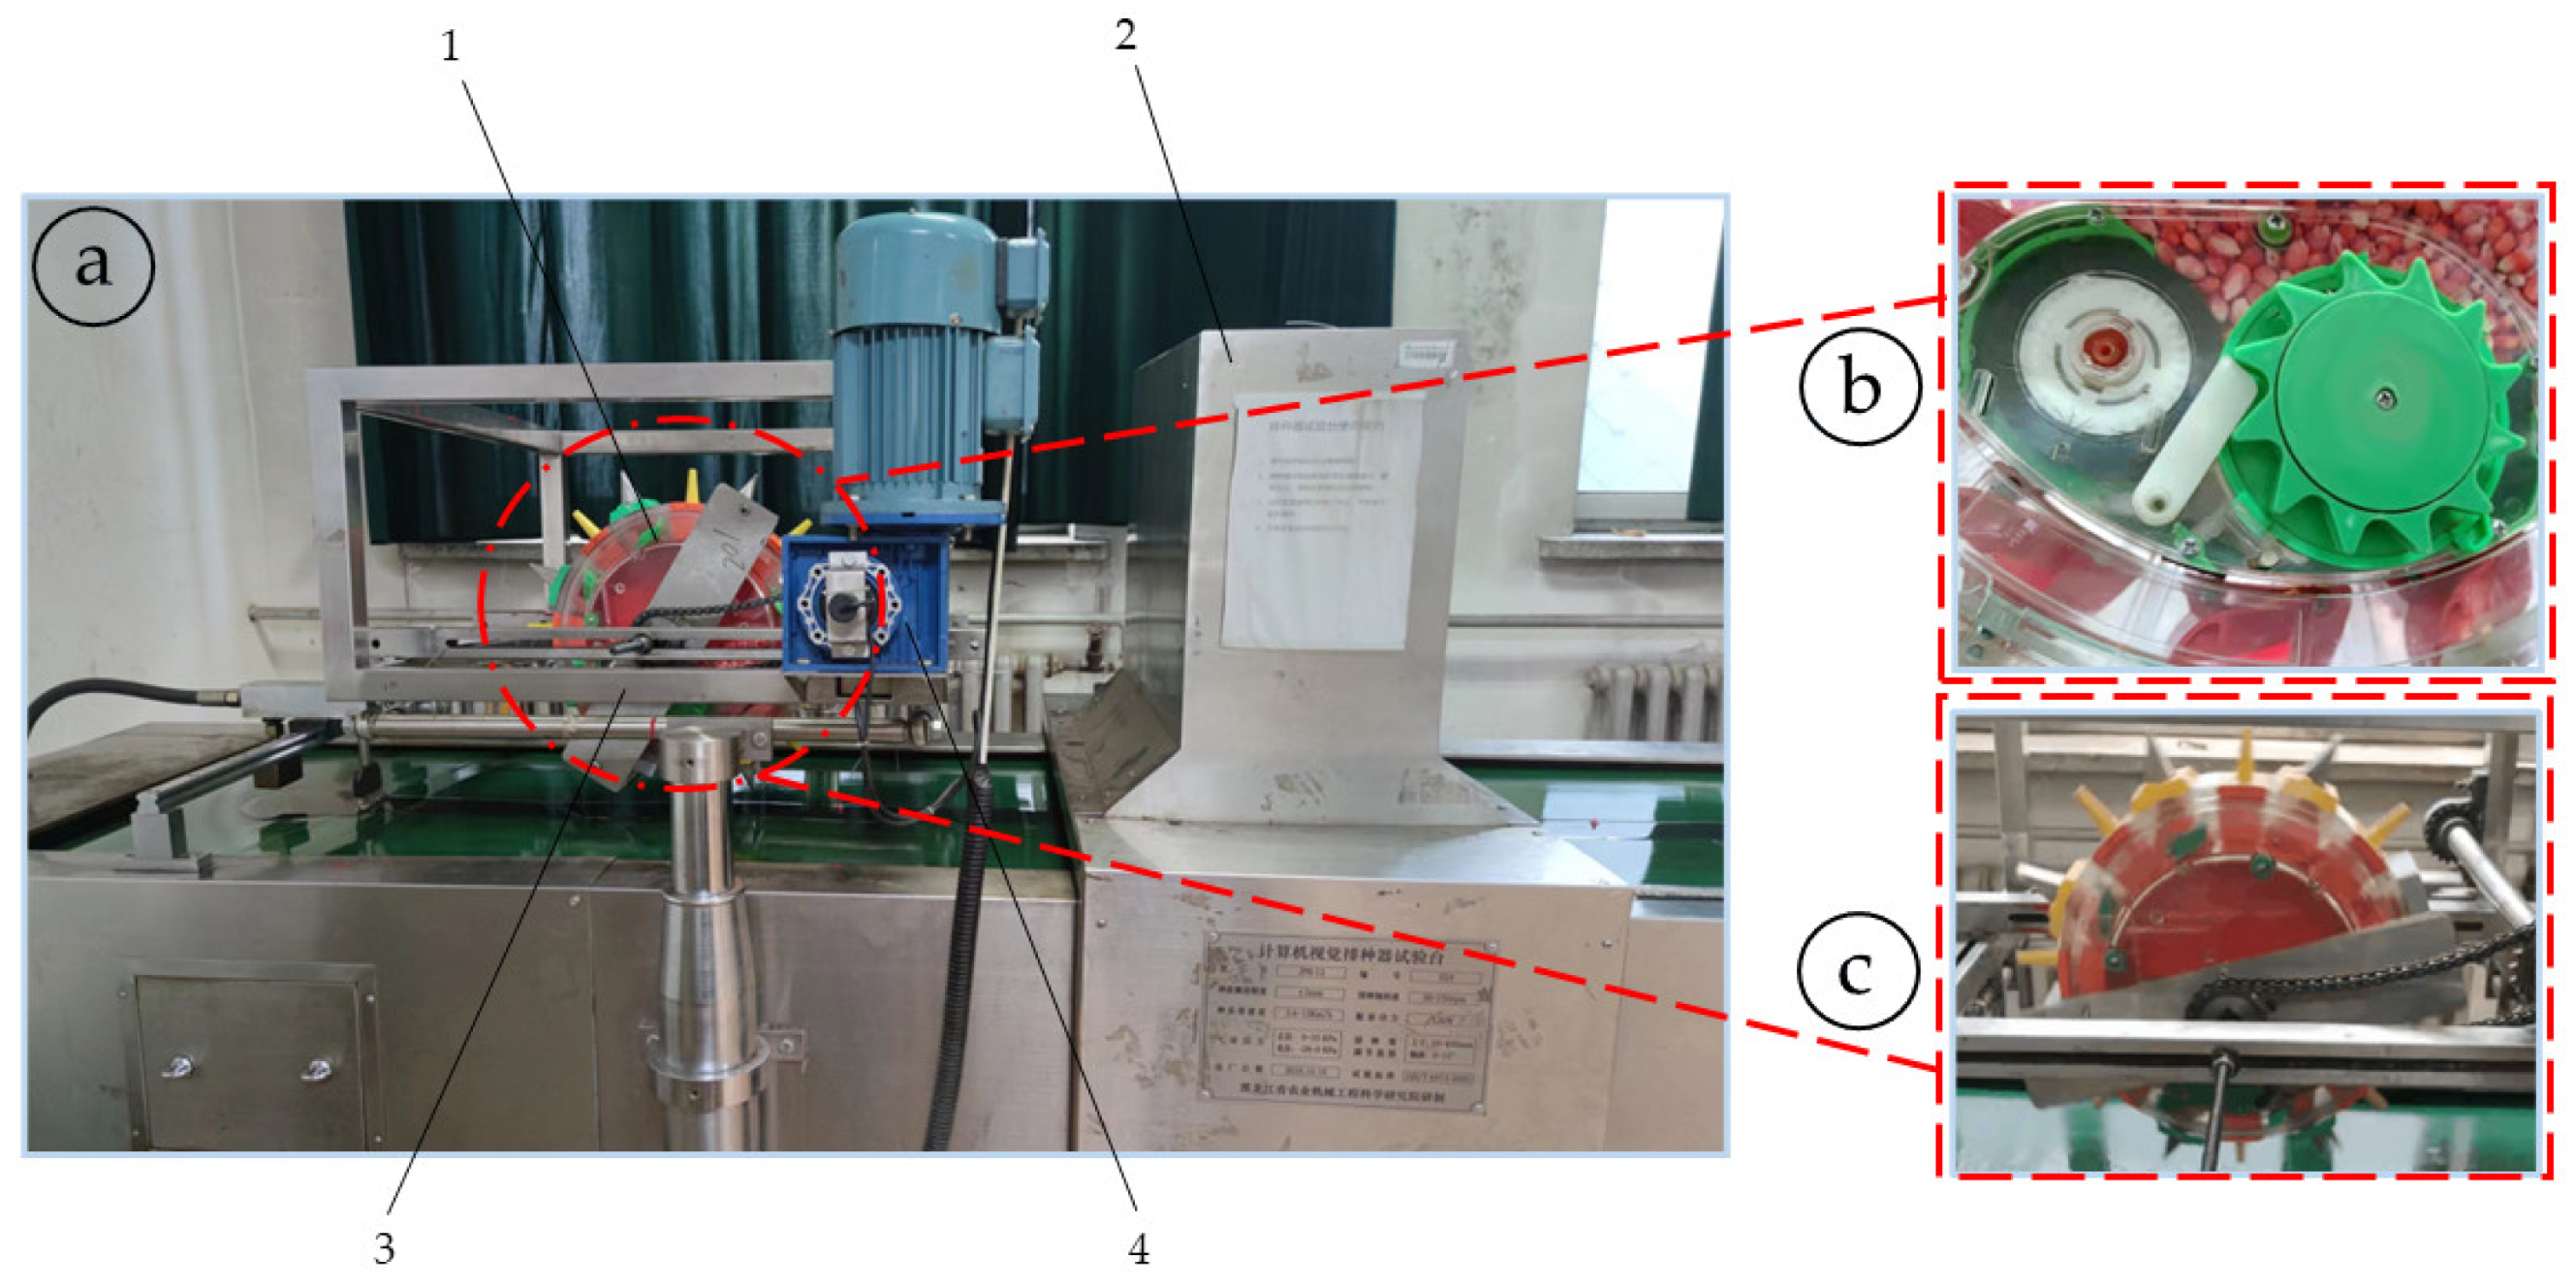
2.1. Structure and Working Principle

The rotary hole filling corn precision metering device mainly consists of a fork, a rocker, a stagnant seed chamber, a seed box, a seed discharge chamber, a right-angle seed guide, a seed guide ring and a duckbill device (Figure 1a). The duckbill device and the stagnant seed chamber are fixed to the connecting disk by the outer disk slide and screws, the rocker is hinged to the duckbill device, the seed guide ring is fixed to the stagnant seed chamber, and the connecting shaft is connected to the rest of the main parts in series and fixed by bolts.
The operation process of the seed rower is mainly divided into four tandem stages: gravity seed filling, seed probing and seed replenishment, stable seed guiding and benchmark seed casting. During the operation process, the seed is filled from the seed box to the seed filling area, and the seed is filled into the discharging nesting roller and replenishing nesting roller by gravity and the nesting support force. The seeds are transported from the seed filling area to the seed replenishment area by the nests, and the discharged seeds are cleared by the crescent-shaped seed rower piece and fall into the seed guide area. With the pure rolling movement of the seed guide ring on the ground, the seeds continuously slide into the seed drop zone under the action of gravity and friction along the right-angle seed guide part before the main end of the right-angle seed guide part is vertical to the horizontal surface. The seeds fall into the duckbill device from the stagnant seed chamber, the duckbill device moves in a circular motion with the seed rower to the seed throwing point, the cams on the fork combine to move the rocker to open and close the duckbill fixed on the rocker, and at the same time, the soil is stripped to form the seed bed and the seeds are discharged into the soil to complete the seed throwing process (Figure 1).

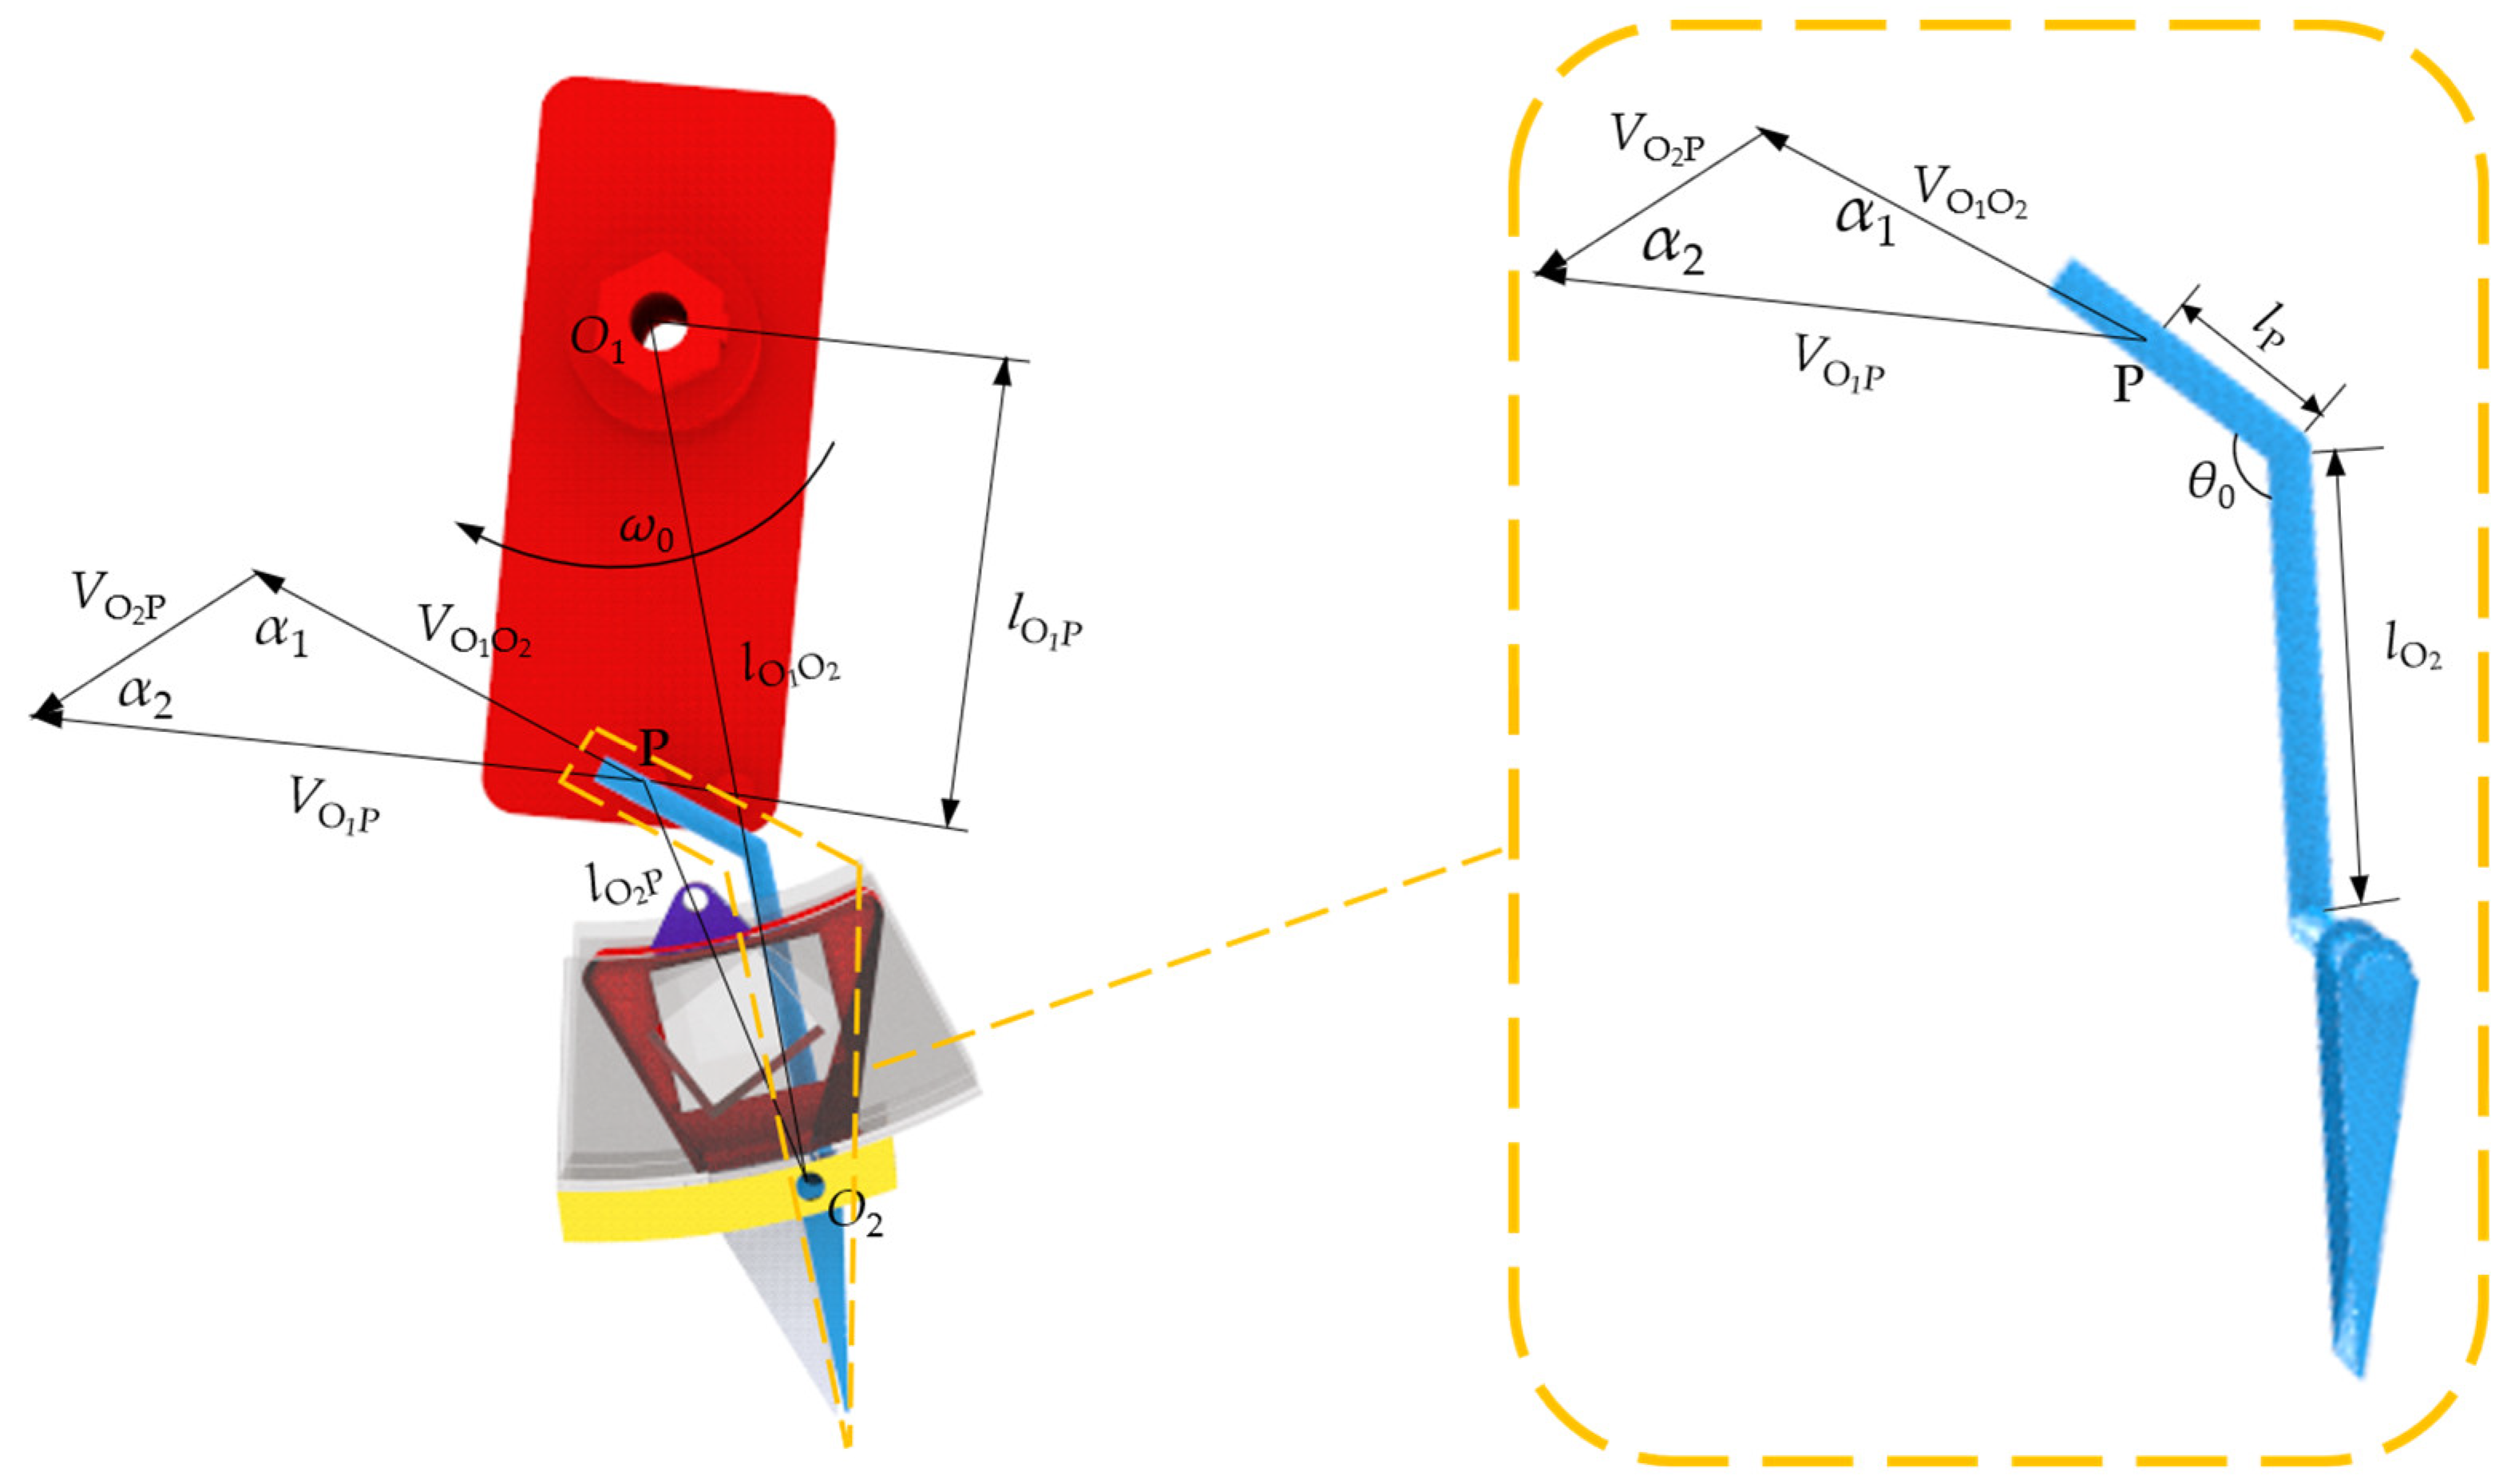
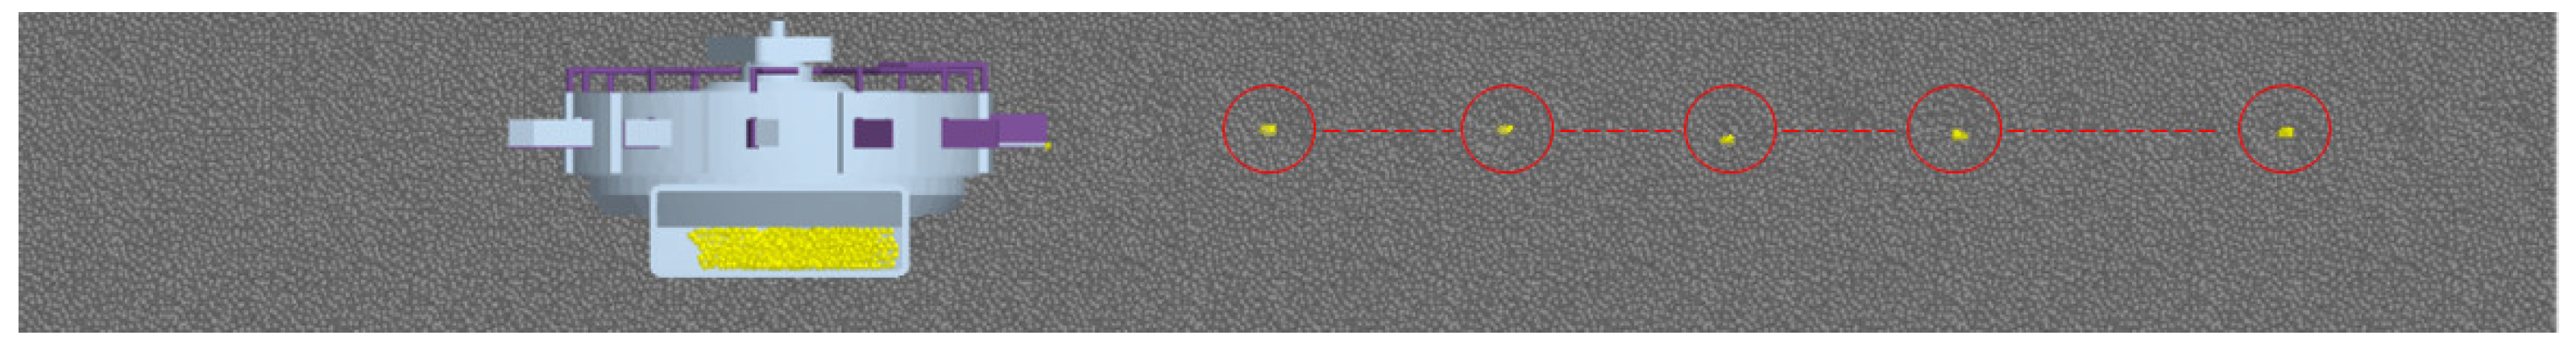
2.2. Characterization of the Movement of Duckbill Tied Cavities into the Soil

During the field operation, the outer ring of the seed rower rolls forward under the action of soil friction, and the fork is fixed to the frame and moves flatly relative to the ground, so the duckbill device on the outer ring of seed rower makes a circular motion and makes contact with the cam on the fork at the same time, and then the duckbill device makes an opening and closing motion to complete the process of tapping into the soil. To analyze this motion process, the frame is fixed as the coordinate system, and the reversal method is used to give the seed rower an equal angular velocity in the opposite direction of the actual motion, when the outer ring of the seed rower is stationary and the fork is rotating around the axis of the connecting shaft at a uniform speed.
Using the point-synthesis motion method to analyze the relationship between the fork cam and the rocker motion, where the point P is the center point of the fork cam, O1 is the center of rotation of the fork, and O2 is the center of rotation of the rocker, according to the geometric relationship, Equation (1) can be obtained:
V O 1 P = V O 2 P + V O 1 O 2
where V O 1 P is the absolute velocity of rocker at the fork cam midpoint, P, in m/s; V O 2 P is rotation speed of the cam midpoint, P, with respect to O2, in m/s; V O 1 O 2 is the traction speed of the fork and rocker, in m/s.
According to the sine theorem combined with the geometric relationship in Figure 2, the velocity vector triangle angles can be derived as follows:
sin α 1 = l O 1 O 2 l O 2 p sin ( ω 0 t )
cos α 2 = l O 2 l O 2 p sin θ 0
where α 1 is the angle between V O 2 P and V O 1 P (°); α 2 is the angle between V O 2 P and V O 1 O 2 (°); θ 0 is bend angle of the duckbill device (°); l O 1 O 2 is the distance between O1 and O2, in mm; l O 2 p is the distance between O2 and P, in mm; l O 2 is the distance from the center of rotation of the rocker to the turning point, in mm; ω 0 is the angular speed of the fork rotation, in rad/s.
Combining Equations (1)–(3), the following can be obtained:
V O 2 p = sin ( α 1 + α 2 ) sin α 2 V O 1 p
According to the analysis process and Equation (4), it can be seen that the motion form of the duckbill device is related to angle α 1 and α 2 ; that is, it is related to the bending angle of the rocker and the rotation speed. Different bending angles of the rocker will produce different forms of motion, directly affecting the tying effect of the duckbill device and the stability of seeding in the actual operation.

2.3. Simulation Modeling

2.3.1. DEM Modeling

In this study, EDEM software was used to establish a discrete element model to simulate the real situation in the field, and ADAMS software was used for kinematic simulation to establish the seed rower model, corn seed model, soil particle model and soil trough model (Figure 3). Thus, the soil entry characteristics, the characteristics of soil particles and the seed transport pattern during the duckbill tapping process were studied.
(1) Seed rower model
In the process of numerical simulation, the mechanical parameters of the geometric model directly affect the accuracy of the test. The overall structure of the seed rower was designed (Figure 3a), and the materials of each part of the seed rower were set according to the trial requirements of the seed rower. The duckbill device was made of 65 Mn, the shell of seed rower, outer ring of seed rower, fork, and nesting roller of seed rower were made of ABS plastic, and the seed cleaning roller was made of pig bristle. The preprocessing module (Creator) was used to set up the contact mechanic relationships (Table 1). In this study, the Hertz–Mindlin (no slip) contact model was chosen as the contact model between the virtual test seed and the geometric model.
(2) Corn seed model
In this study, the more widespread Demeiya No. 1 corn seeds in the northeast were used as a model to select uniformly shaped and full corn seeds. The specific steps were as follows:
The OKIO 5M Plus 3D scanner (Nanjing Weibu 3D Technology Co., Ltd., Nanjing, China) was used to extract the geometric model of the corn seeds. Based on the scanning results, the scanned data were converted into a 3D model of the corn seeds using automated reverse engineering software (Geomagic Design X, Sichuan, China), and the corn seed model was established (with geometric dimensions of 12.00 mm × 9.20 mm × 4.70 mm) (Figure 3b). The 3D model of the corn seeds was imported into EDEM software and filled by the “spherical element particle aggregation method” and the physical parameters were selected as particle–particle (Table 2).
(3) Soil particle model
In order to simulate the real field environment, soil parameters during the spring sowing period were selected to establish a discrete element model, and the institutional form of fertile soil is sphere-like [25]. Therefore, in this paper, spherical particles were selected to simulate soil particles, and the soil particle model was set to a particle size between 5 mm and 10 mm. Soil particle parameters were set for it (Table 3).
The soil particles were modeled as 250 mm × 100 mm × 400 mm soil blocks by the particle factory, and the computational domain was modified to overlap with the box to avoid gaps between the soil blocks that could affect the simulation results, which were saved to the Transfer Materials material library. In the coupled simulation, a soil tank of a size of 2500 mm × 300 mm × 400 mm was created by applying the block factory method according to the geometric relationship, three groups of soil blocks were placed in the x-axis direction and 10 groups of soil blocks were placed in the y-axis direction (Figure 3c).

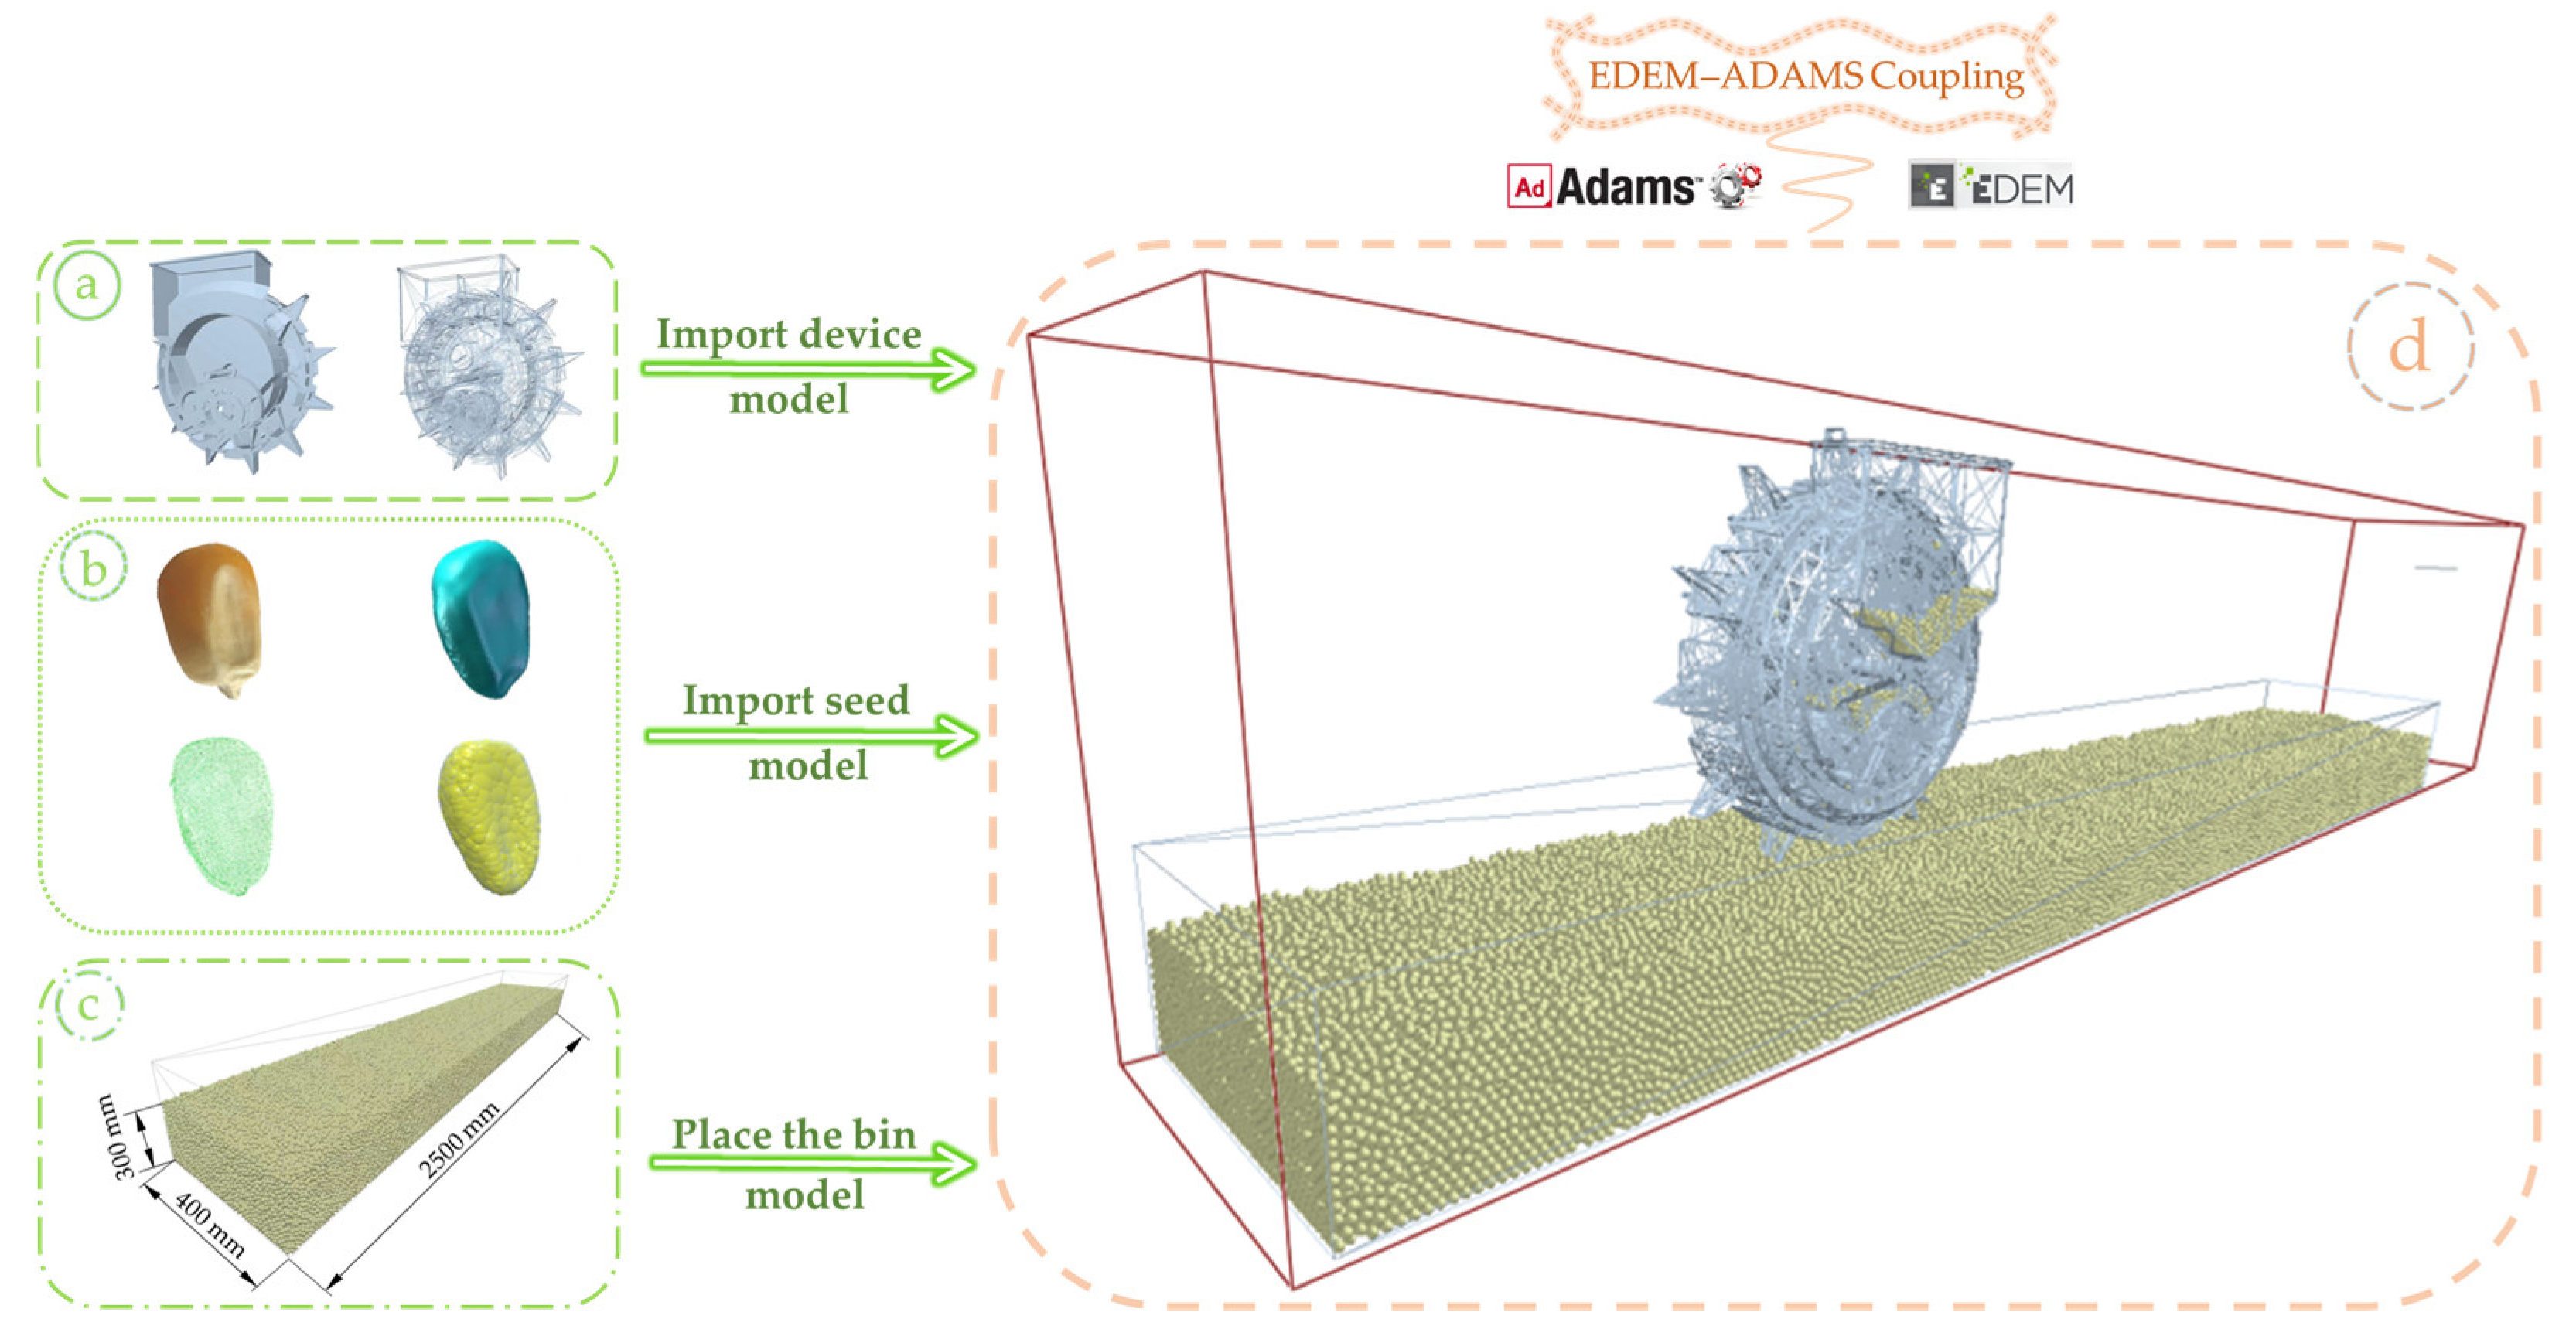
2.3.2. MBD–DEM Coupling Model

In this study, the Co-simulation module in the ADAMS software was used to establish communication links to achieve the purpose of a coupling simulation with EDEM software, and the ADAMS model needed to correspond to the model in EDEM [26].
In order to investigate the effect of rocker bend angle on tying performance, a virtual simulation single-factor test was conducted with the rocker bending angle, θ0, as the test factor and the maximum force of the duckbill device as the index. The bending angle of the rocker was set to 110°, 120°, 130°, 140° and 150° under the operating speed of 1 m/s of the precision seeder.

2.4. Bench Experiment

In order to test the accuracy of the theoretical and simulation analysis, optimize the structure parameters of the seed rower, and determine the better working parameters, a rotary hole filling corn precision metering device was manufactured and processed based on the results of the preliminary analysis, and Demeiya No. 1 corn seeds were used as the test material to ensure that the test seeds were full and uniform, free of pests and diseases. The II—shaped nesting roller of Demeiya No. 1 corn seeds was selected as the nesting roller of the seed rower in the bench test. The bench test was carried out at the seed rower performance testing experiment bench of Northeast Agricultural University [27]. The main equipment consisted of a pilot-processed rotary hole filling corn precision metering device, a connecting stand, and a JPS-12 seed rower performance test bench (Figure 4).

2.4.1. Single-Factor Experiment

In this study, a single-factor test was selected to investigate the seeding performance of the rotary hole filling corn seed rower. The operating speed, spring preload force, and operating slope angle of the seed rower were selected as the test factors, the coefficient of variation and qualified index were used as the test indicators, and the corresponding regression equations were solved. Combining with the agronomic requirements of sloping land and actual production experience, each factor level was set as follows: operating speed from 0.2 to 1.4 m/s; operating slope angle from 0 to 24° to the right; spring preload force of T1–T7 models were 0.5 N, 5.6 N, 10.6 N, 15.2 N, 20.7 N, 24.8 N, and 29.8 N, respectively. The single-factor tests were carried out for the operating speed, spring preload force, and operating slope angle, the data were analyzed and processed by Design-Expert 8.0.6 software to obtain the relevant images and equations, the tests were repeated five times for each group under the premise that the parameters remained unchanged, and the test level table was set for each factor (Table 4).

2.4.2. Multi-Factor Experiment

In the single-factor test, the influence laws of operating speed, spring preload force, and operating slope angle on the qualified index and coefficient of variation were investigated, and the level ranges of different factors were determined. In order to obtain a better combination of operating and structural parameters, a three-factor five-level orthogonal rotary test was conducted. The coding table of factor levels for the multi-factor test was created (Table 5). On the premise of keeping the parameters unchanged, each group of tests was repeated five times, the qualified index and coefficient of variation were calculated and recorded after each test, and the mean value was finally selected as the test result to carry out the multi-factor orthogonal test.

3. Results and Discussion

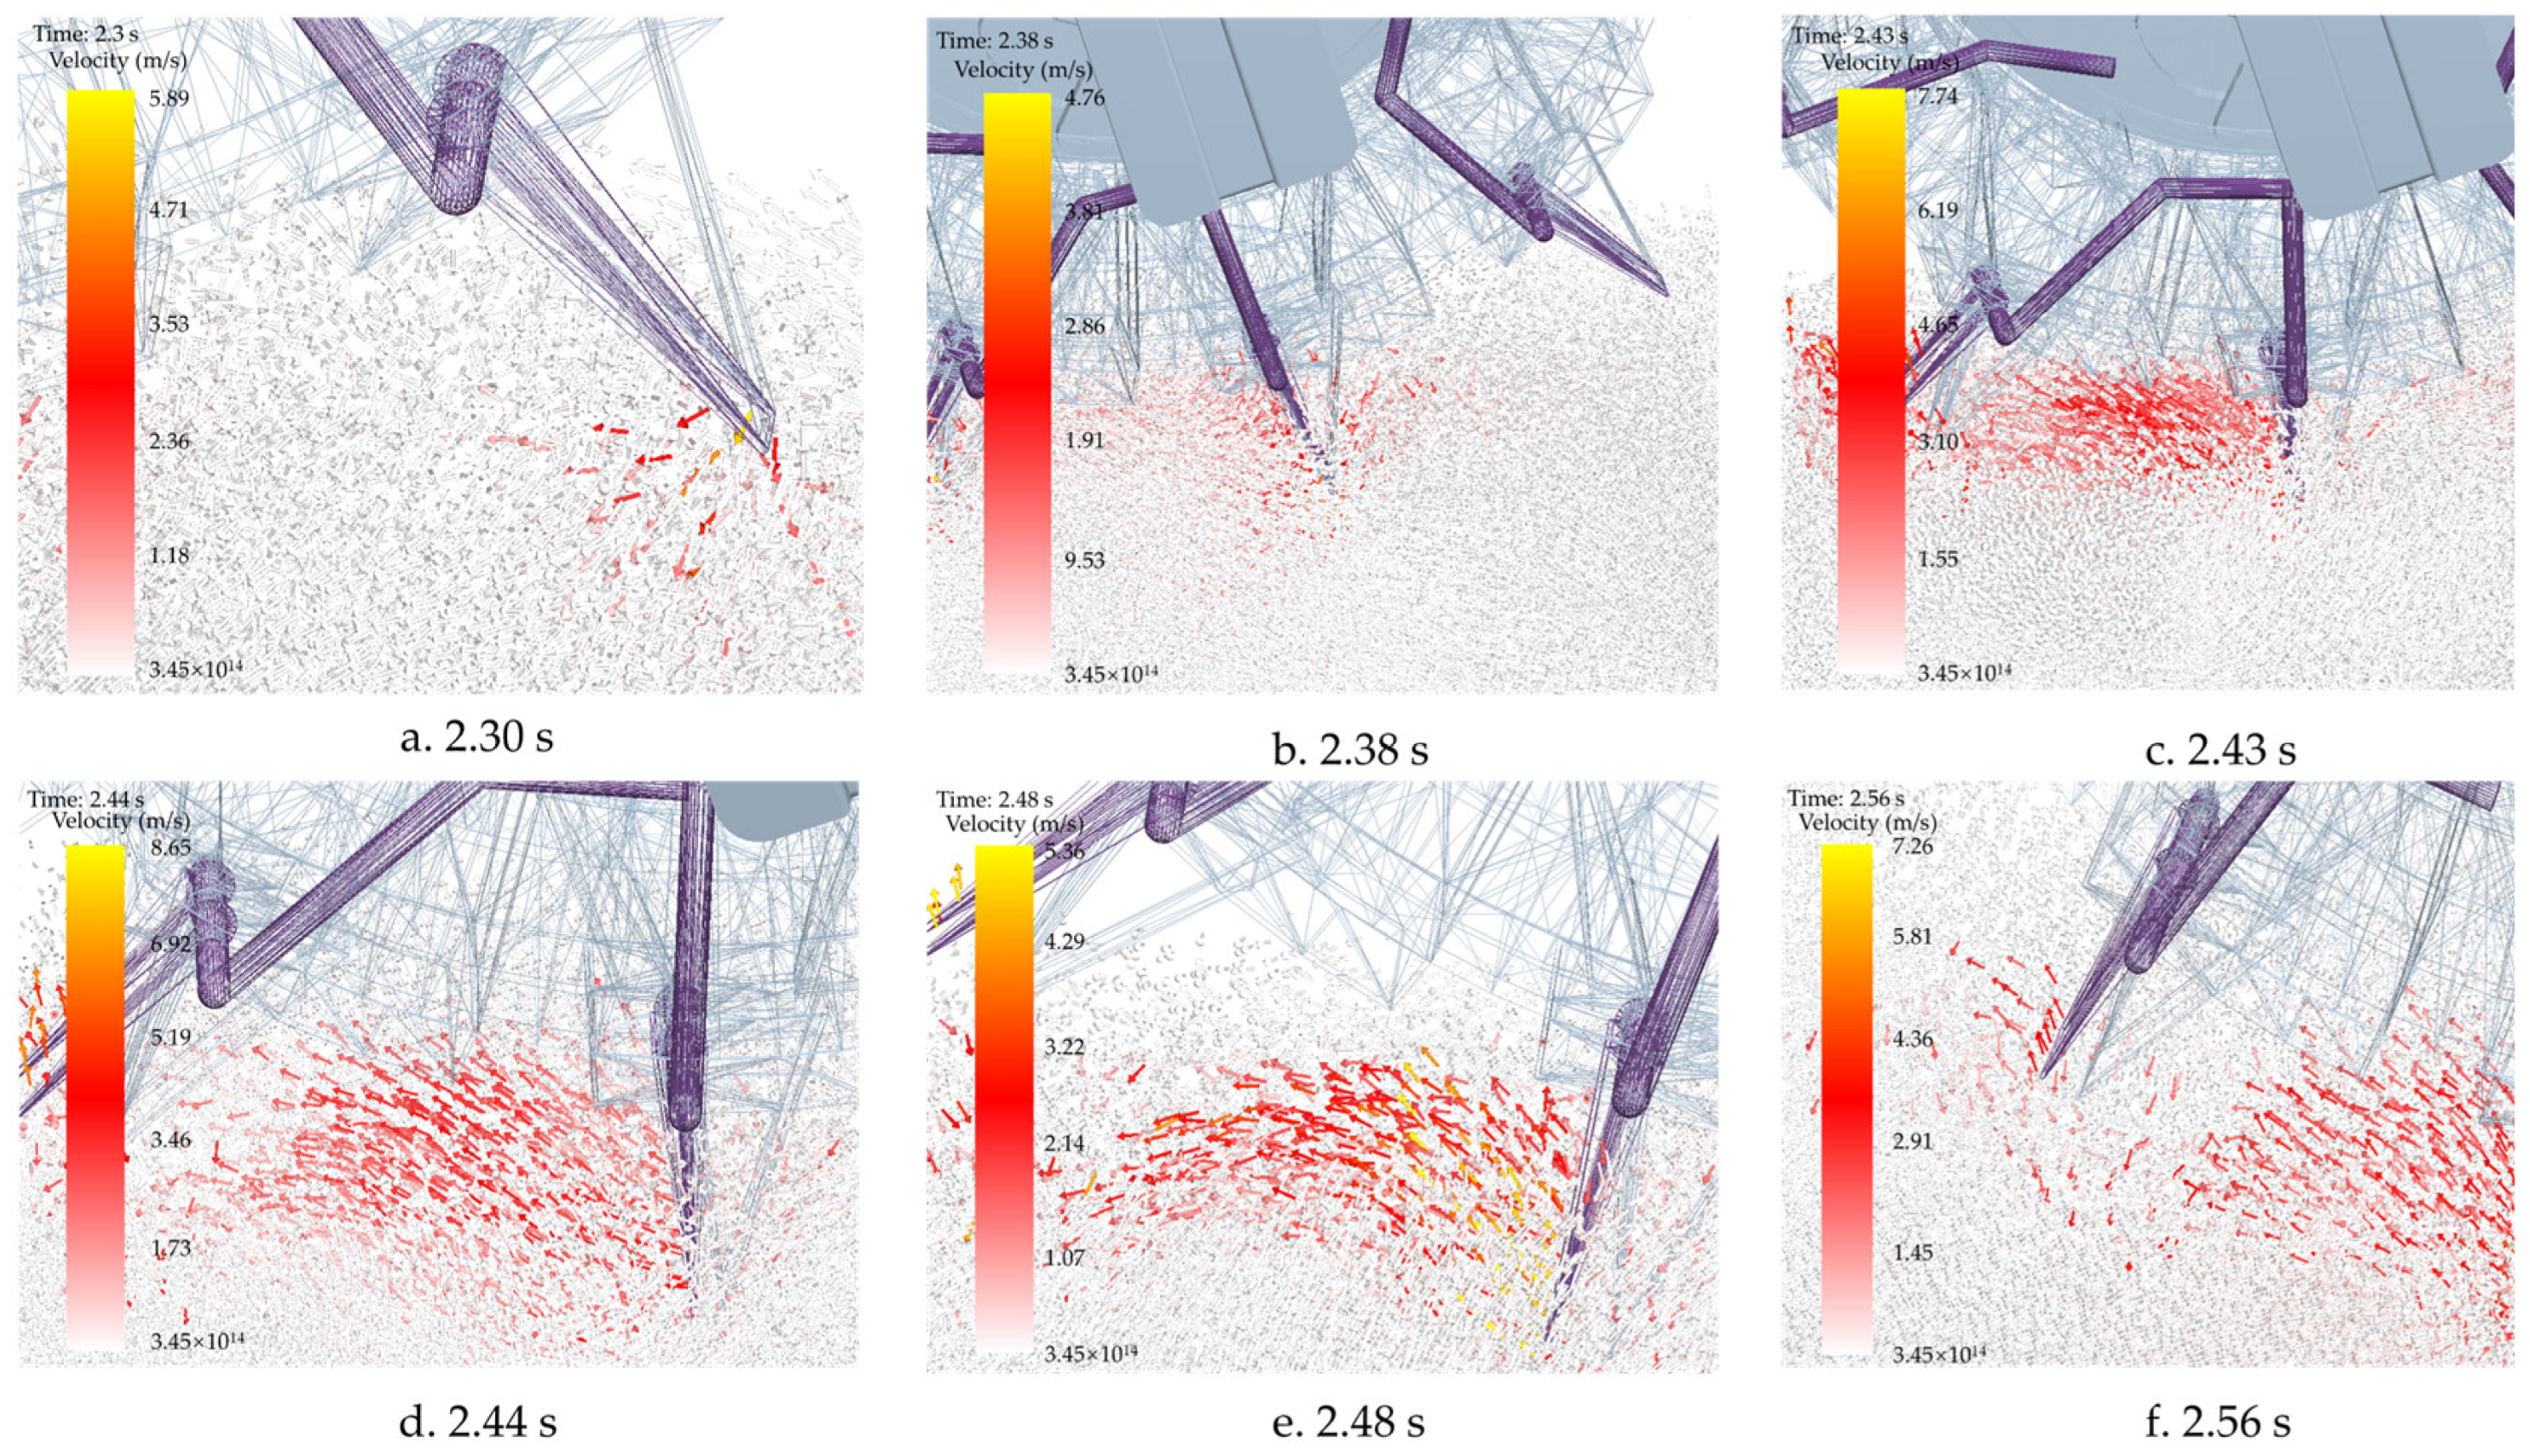
3.1. Coupling Simulation Analysis

In the virtual simulation test process, a 0–2 s moment, 1000 corn seed discrete element model was generated by the particle factory and corn seeds were separated from the population to form an orderly seed flow under the rotation of the seed cleaning roller and seed row disk; at this time, the seeds rotated upwards with the seed guide ring, the corn seeds fell into the stagnant seed chamber under the action of the seed guide piece, and the rocker was opened and closed under the action of the fork cam. At 2 s, the duckbill device was synchronized in the soil groove to tie the seeds; at 4 s, the seed rower stopped moving and the simulation ended (Figure 5).
In order to investigate the influence of soil disturbance on the seeding process, the change in soil particle velocity was observed at each time point (Figure 6). At 2.43 s, the duckbill was stuck into the soil vertically, the soil particles were moving upward, at this time, and the processing of a single cavity was finished; at 2.44 s, the duckbill opened under the action of the fork, and the soil particles were thrown upward at an accelerated rate; at 2.48 s, the opening and closing angle of the duckbill reached its limit, and the speed of the soil particles was extended upward to the maximum; at 2.56 s, the duckbill was detached from the soil, and the front duckbill was thrown upward at the same time. At the same time, the front beak threw the soil particles backward to cover the seed hole, completing the process of entering, exiting, and seeding in a single hole.
Figure 6. Variation in soil particle velocity while tapping into and out of the soil. After the coupling process, the post-processing module in ADAMS software was opened and the simulation result file was imported to process and analyze the data to obtain the force situation of the rocker under different bend angles (Figure 7).
Agriculture 13 01093 g006
Figure 7. Analysis of superposition of forces at each angle.
Agriculture 13 01093 g007
The maximum force on the rocker was 26.2 N when the bend angle of the rocker was 110°, 34.1 N when the bend angle of the rocker was 120°, 30.4 N when the bend angle of the rocker was 130°, 27.1 N when the bend angle of the rocker was 140°, 27.1 N when the bend angle of the rocker was 150°, and 27.5 N when the bend angle of rocker was 120°. The maximum force on the rocker was 27.5 N at 150°, and the maximum force on the rocker was 27.5 N at 120°. It can be seen that the maximum force on the rocker was at 120°, and the maximum force on the rocker and the soil occurred at this time, which indicates the best separation of soil particles, the fastest movement speed, and the best performance of seeding and cavity tying.

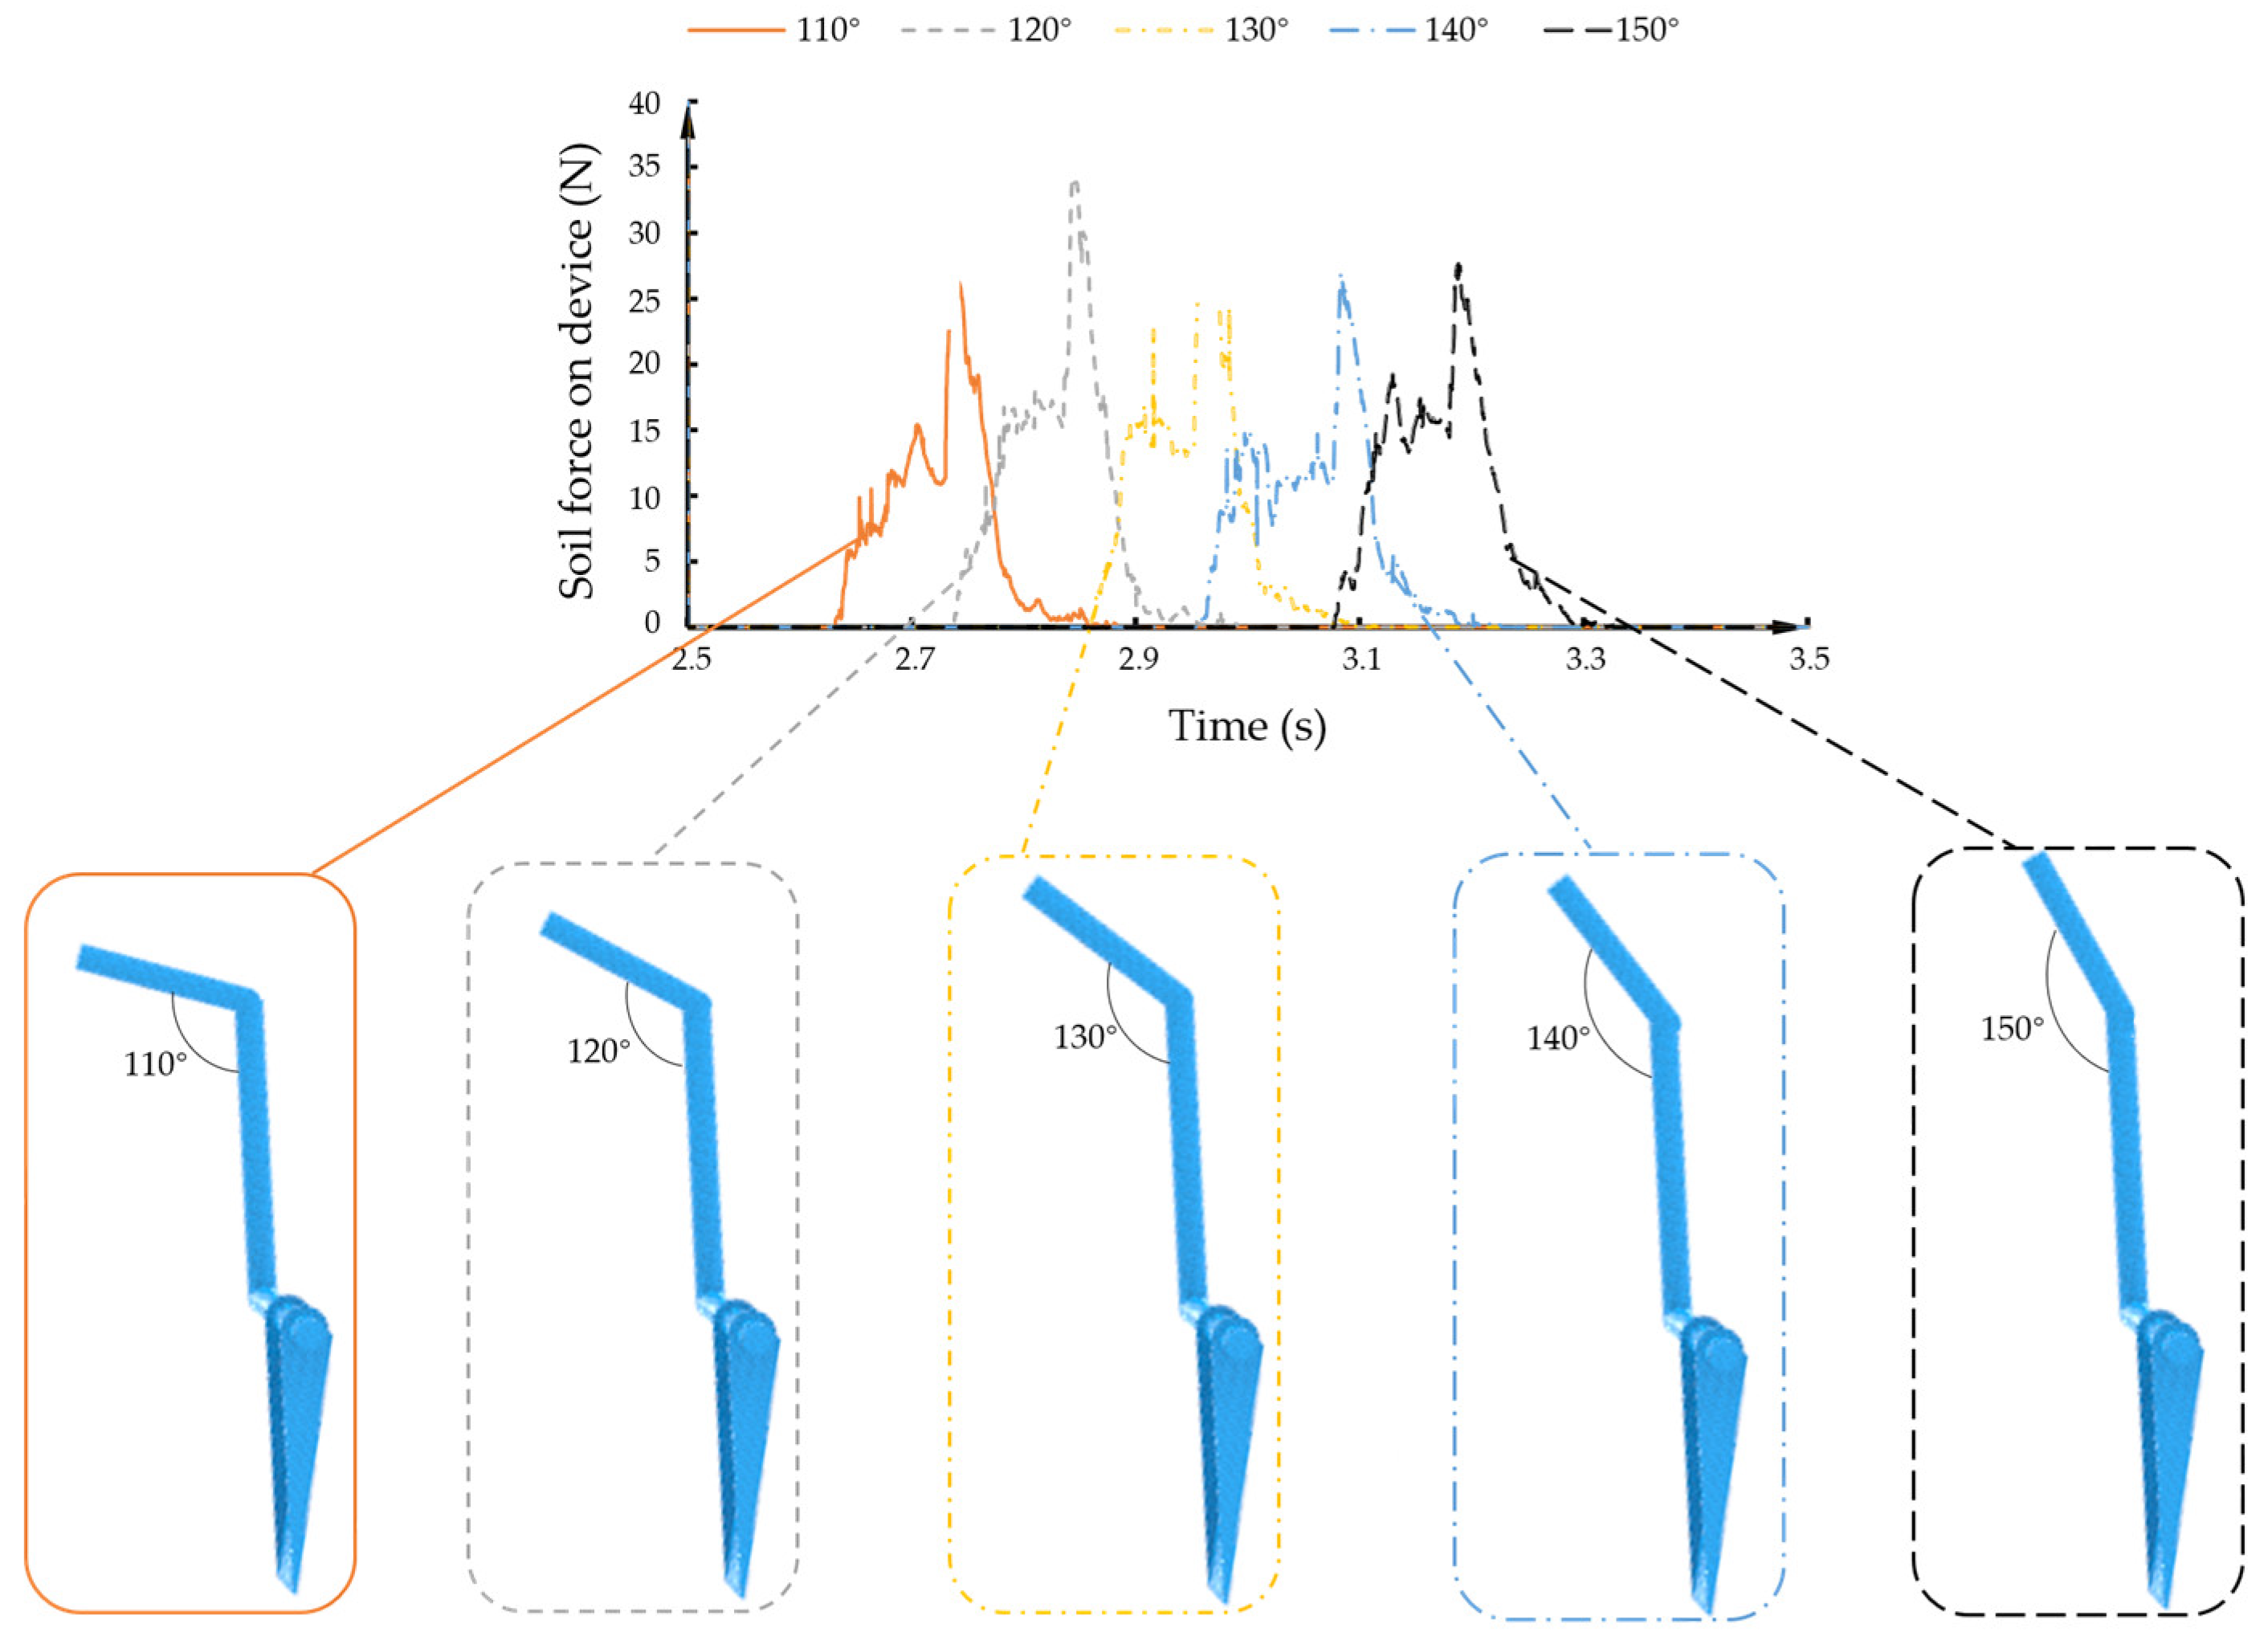
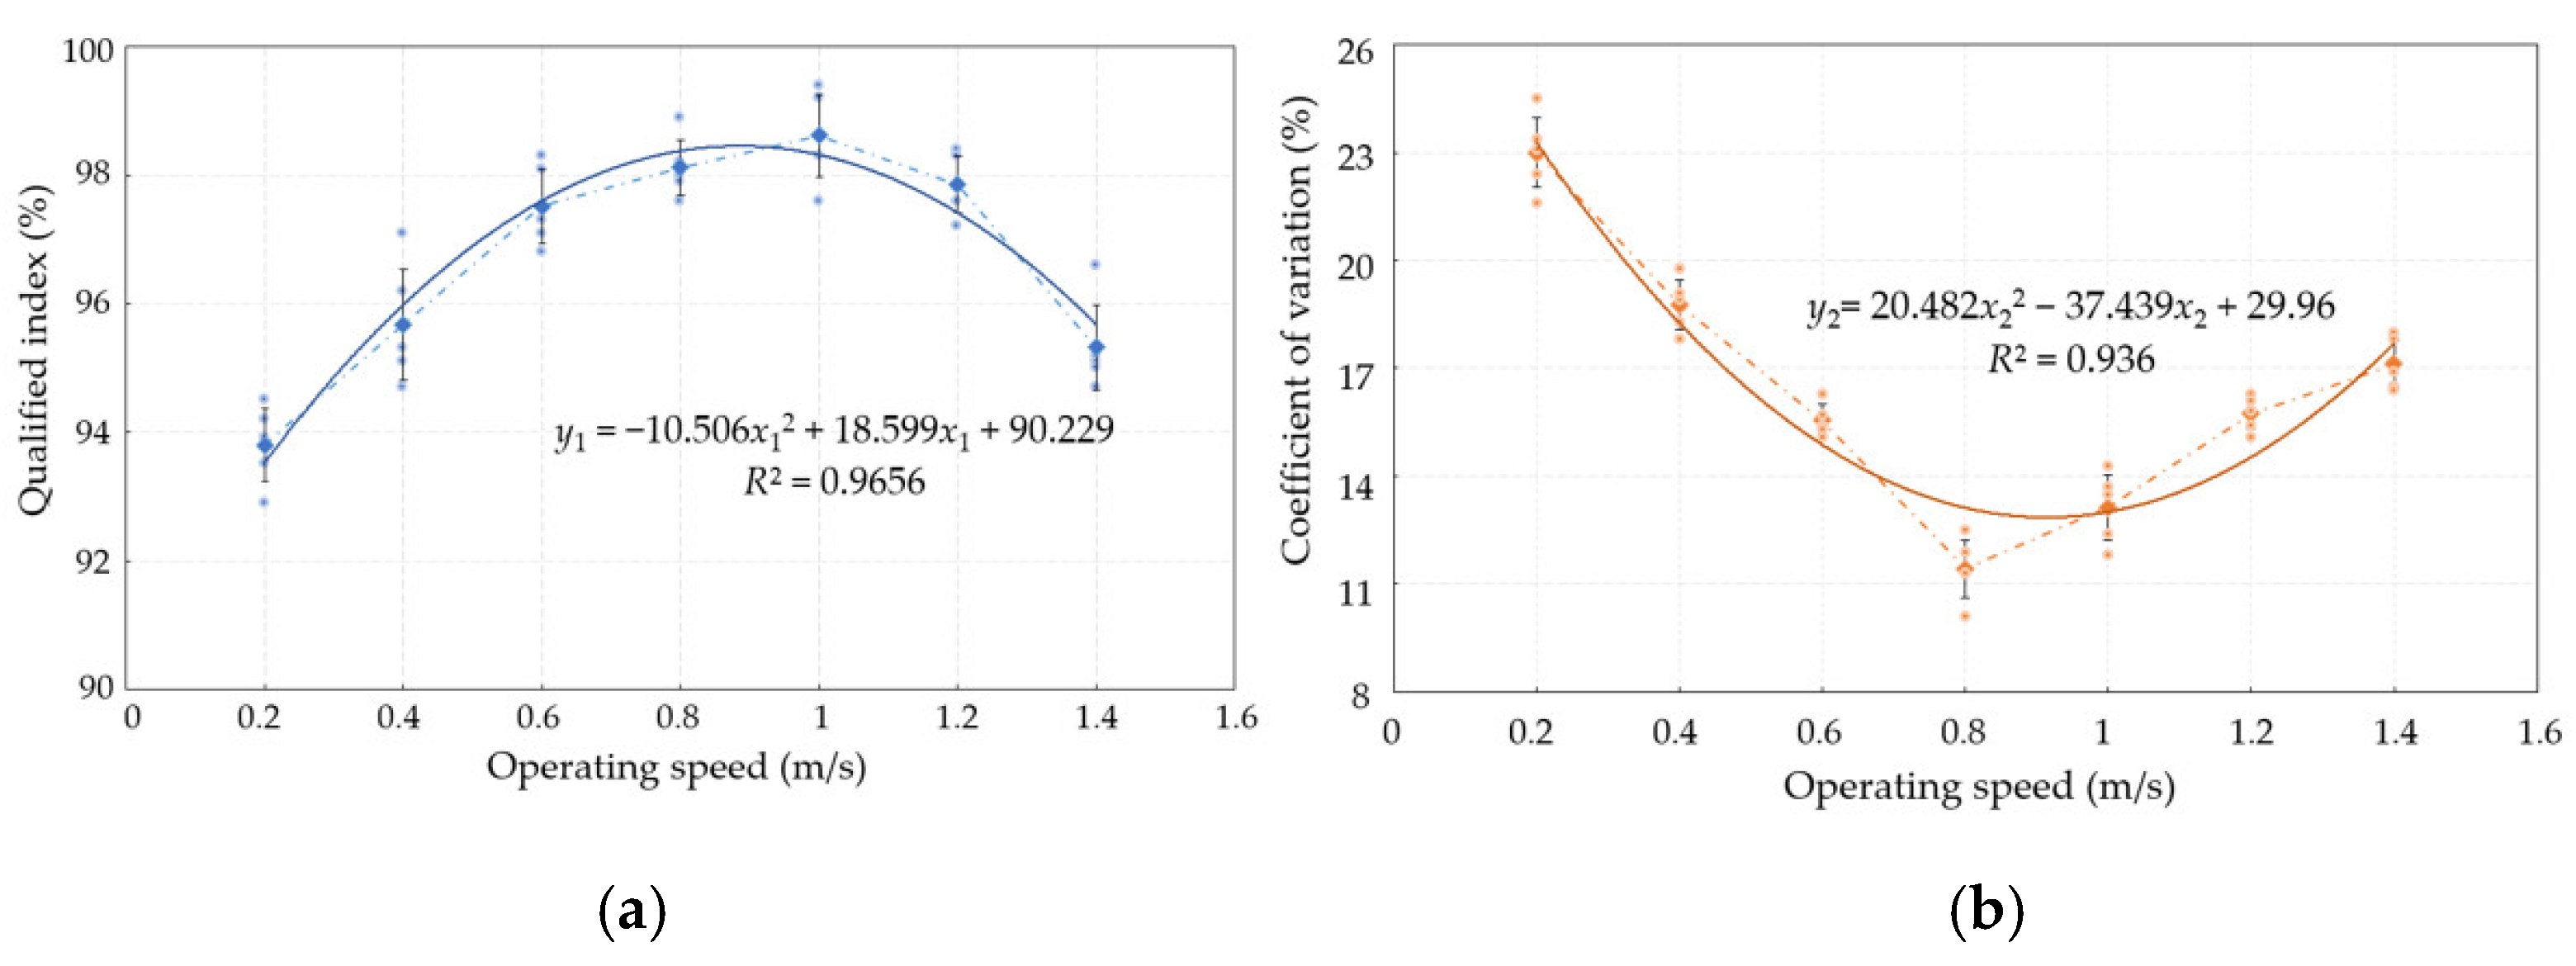
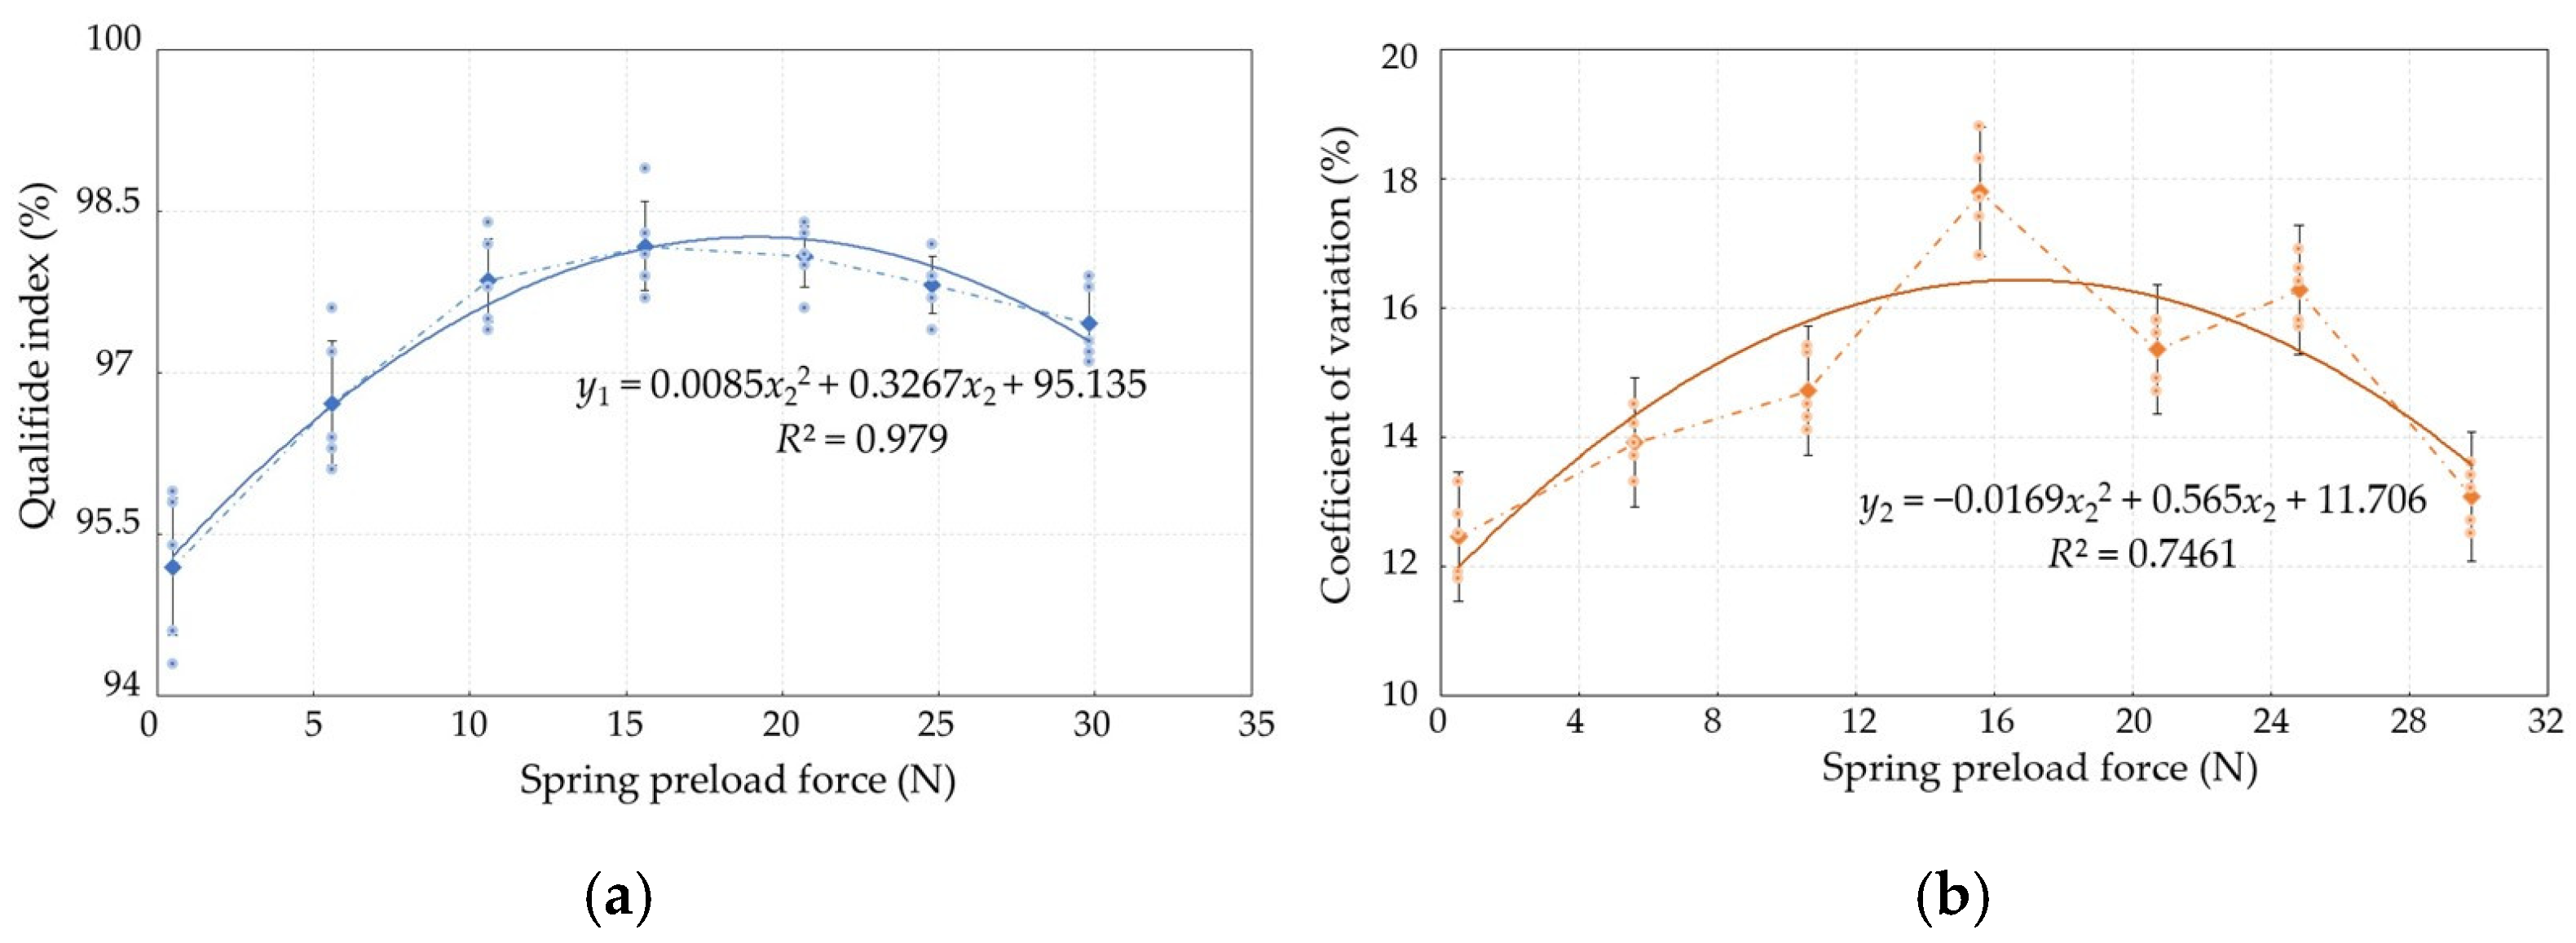
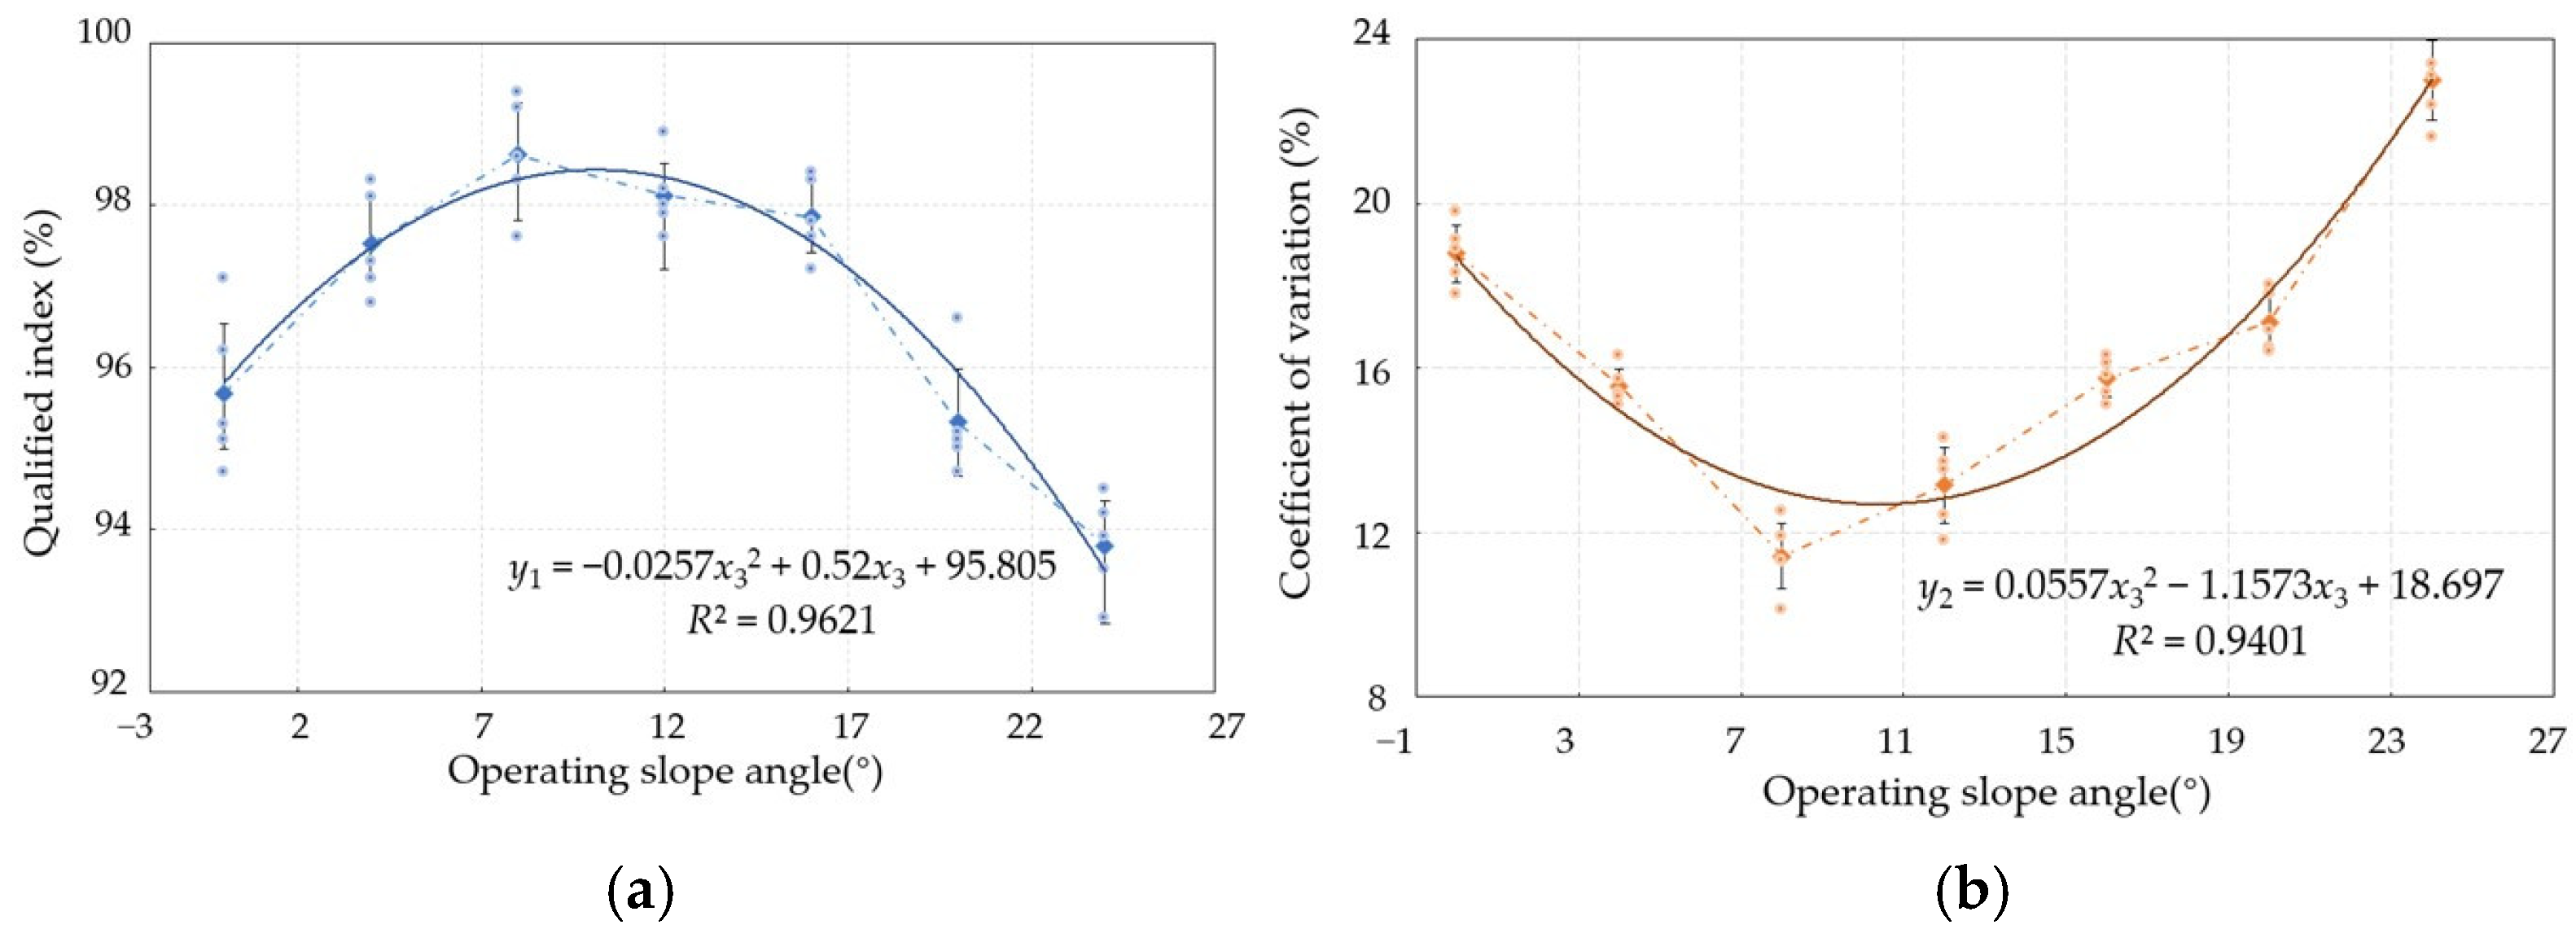
3.2. Analysis of Single-Factor Experiment Results

(1) Impact of operating speed on each indicator
The single-factor test was carried out at the spring preload force of 10.6 N and the operating slope angle of 8°, and the operating speed of the seed rower was set to seven levels: 0.2 m/s, 0.4 m/s, 0.6 m/s, 0.8 m/s, 1.0 m/s, 1.2 m/s, and 1.4 m/s. Under the premise of keeping the parameters constant, five replicate tests were conducted for each group of tests, and the trends of different operating speeds on the qualified index and the coefficient of variation of plant spacing were obtained (Figure 8).
When the operating speed was 1 m/s, the qualified index was the largest, and the coefficient of variation was the smallest when the operating speed was 0.8 m/s. With the increase in operating speed, the qualified index of seeding increased and then decreased, and the coefficient of variation decreased and then increased. The main reason is that when the operating speed was low, the seed filling quality was poor because the seed filling area was poorly disturbed by the nesting roller, and the performance index improved with the increase in operating speed, but the filling time was gradually shortened, and the centrifugal force increased, causing the seed to break away from the right-angled seed guiding parts, and the absolute speed difference between the seed and the duckbill device increased, resulting in violent bouncing, which led to a decrease in the performance index.
In order to establish the mathematical model of the operating speed of the seed rower and the test index of the seed dispersal conformity index and coefficient of variation, the data were fitted and analyzed with the regression equation and coefficient of determination as follows:
y 1 = 10.506 x 1 2 + 18.599 x 1 + 90.229 R 2 = 0.9656 y 2 = 20.482 x 1 2 37.439 x 1 + 29.960 R 2 = 0.9360
where y 1 is the qualified index, in %; y 2 is the coefficient of variation of seeding, in %; x 1 is the operating speed of the seed rower, in m/s.
From Equation (5), the coefficient of determination of the regression equation of the qualified index was equal to 0.9656 and the coefficient of determination of the regression equation of seeding variation was equal to 0.9360, which was within the acceptable range. The data were analyzed via ANOVA to investigate the significance of the operating speed to the seeding performance test index (Table 6).
The regression model of operating speed on the qualified index and coefficient of variation was extremely significant, which shows that operating speed is an important factor affecting seed dispersal performance. Based on the results of the single-factor test, the operating speed level of the seed rower was determined to range from 0.8 m/s to 1.2 m/s.
(2) Effect of spring preload force on the indicators
The seed rower was operated at 0.8 m/s and a 8° slope angle, and the spring preload force was set to 0.5 N, 5.6 N, 10.6 N, 15.2 N, 20.7 N, 24.8 N and 29.8 N. The single-factor test was conducted on seven levels. Under the premise of keeping all parameters constant, each group of tests was repeated five times to obtain the trend of different spring preloads on the qualified index and the coefficient of variation of plant spacing (Figure 9).
When the spring preload force was 15 N, the qualified index was the largest. With the increase in the spring preload force, the qualified index and coefficient of variation showed a trend of rising first and then leveling off. The main reason was that when the spring preload force was larger, the upper rocker’s return time was reduced, the seeding device responded more quickly to improve the seeding quality, and the performance index increased.
In order to establish the mathematical model of the seed releaser’s spring preload force and seed releasing performance test index, the data were fitted and analyzed, and the regression equation and coefficient of determination were as follows:
y 1 = 0.0085 x 2 2 + 0.327 x 2 + 95.135 R 2 = 0.9790 y 2 = 0.0169 x 2 2 + 0.565 x 2 + 11.706 R 2 = 0.7461
where y 1 is the qualified index, in %; y 2 is the coefficient of variation of seeding, in %; x 2 is the spring preload force, in N.
From Equation (6), the coefficient of determination of the regression equation of the qualified index was equal to 0.9790, the coefficient of determination of the regression equation of the seeding variation coefficient was equal to 0.7461, and the coefficient of determination of the conformity index was within the acceptable range. To investigate the significance of the spring preload force to the seeding performance test index, an ANOVA was performed on the data (Table 7).
The regression model of operating speed on the qualified index and coefficient of variation was highly significant, which showed that the spring preload force is an important factor affecting seeding performance. Based on the results of the single-factor test, the range of the seed releaser spring preload force level was determined to be 5.5–25 N.
(3) Impact of operating slope angle on each index
The single-factor test was conducted at an operating speed of 0.8 m/s and a spring preload force of 10.6 N. The operating slope angle was set to seven levels: 0°, 4°, 8°, 12°, 16°, 20° and 24° to the right. Under the premise of keeping the parameters unchanged, each group of tests was repeated five times, and the trend of the variation of the qualified index and the coefficient of variation of plant spacing could be obtained from different operating slope angles (Figure 10).
When the operating slope angle was 8° to the right, the qualified index was the largest and the coefficient of variation was the lowest. As the operating slope angle increased, the qualified index increased and then decreased, and the coefficient of variation decreased and then increased. The main reason is that the seed guiding performance of the right-angle seed guiding part increased, and the seeds were stabilized at the seeding point on the duckbill device earlier, which led to an increase in the performance index; as the operating slope angle continued to increase, the seeds in the seeding area were subjected to the reduced gravitational force of the pointing nest roller, the seed filling performance decreased, and the actual seed landing position moved forward compared to the theoretical seeding point.
In order to establish the mathematical model of the operating slope angle of the seed rower and seeding performance test index, the data were fitted and analyzed, and the regression equation and coefficient of determination used were as follows:
y 1 = 0.0257 x 3 2 + 0.520 x 3 + 95.805 R 2 = 0.9621 y 2 = 0.0557 x 3 2 1.157 x 3 + 18.697 R 2 = 0.9401
where y 1 is the qualified index, in %; y 2 is the coefficient of variation of seeding, in %; x 3 is the operating slope angle of the seed rower (°).
From Equation (7), the coefficient of determination of the regression equation of the qualified index was equal to 0.9621, the coefficient of determination of the regression equation of seeding variation was equal to 0.9401, and the coefficients of determination were within the acceptable range. To investigate the significance of the operating slope angle on the seeding performance test indexes, ANOVA was performed on the data (Table 8).
The effect of the regression model of the operating slope angle on the qualified index and coefficient of variation was extremely significant, which shows that the operating slope angle is an important factor affecting seed discharge performance. Based on the results of the single-factor test, the operating slope angle level of the seed rower was determined to range from 8° to 16°.

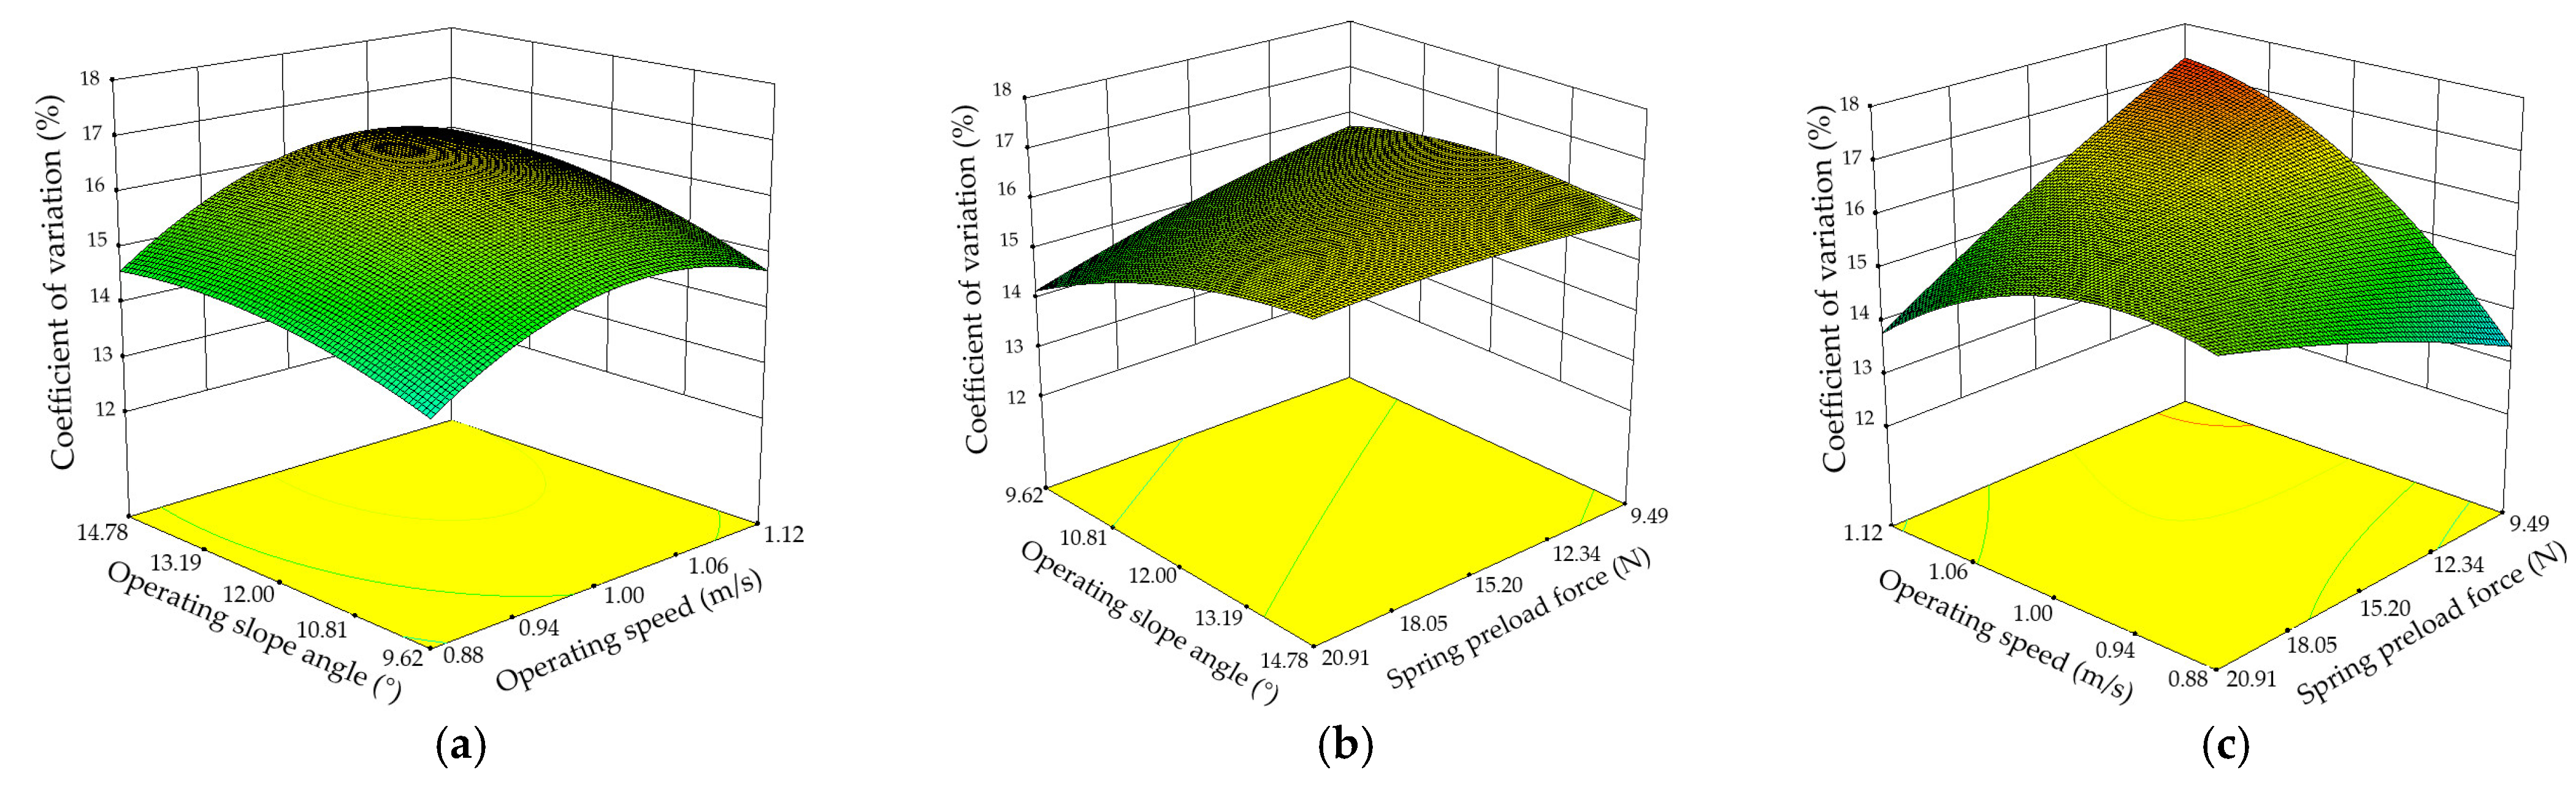
3.3. Analysis of Multi-Factor Test Results

In this study, a three-factor, five-level quadratic orthogonal rotational combination test was used to study the optimal operational performance of the seed rower, and the regression model between factors and indicators was optimized and validated to comprehensively evaluate the uniformity and stability of the seed rower operation. Five replications were conducted for each group of experiments, and the seeding volume of the seeder was stabilized at 1500–2000 seeds, while all other parameters were kept constant.
During the test, the multi-factor quadratic orthogonal rotational combination test scheme was consistent with the test-factor-level coding table, and due to the artificial control of the spring type and operating slope angle, there was a certain error between the test operation value and the theoretical parameter design value, but its maximum was 1.7%, which was within the acceptable range, and the results could be analyzed for the three factors of seed rower operating speed, spring preload force and operating slope angle (Table 9).
(1) Analysis of the influence of various factors on the qualified index of seeding performance
The regression analysis of the experimental data was performed using Design-Expert 8.0.6 software, the factor ANOVA was conducted to screen out the more significant influencing factors and obtain their corresponding response surfaces (Figure 11), and the regression equation between the performance index and the factor coding values was established as the following:
Y 1 = 98.40 0.081 X 1 0.20 X 2 0.21 X 3 + 0.31 X 1 X 2 + 0.12 X 1 X 3 + 0.25 X 2 X 3 0.075 X 1 2
where Y 1 is the qualified index, in %; X 1 is the actual value of the seed rower’s operating speed, in m/s; X 2 is the actual value of the spring preload force, in N; X 3 is the actual value of the operating slope angle of the seed rower (°).
Under the premise that the operating index meets the precision sowing requirement and the working condition of the seed rower is good, the influence law of each factor is analyzed. When the operating speed is certain, the qualified index of the seed rower decreases with the increase in the operating slope angle; when the operating slope angle is certain, the qualified index of the seed rower decreases with the increase in the operating speed; when the operating speed changes, the qualified index of the seed rower changes in a larger range, so the operating speed has a more significant effect on the qualified index (Figure 11a). When the spring preload force is certain, the qualified index of the seed rower decreases with the increase in the operating slope angle; when the operating slope angle is certain, the qualified index of the seed rower increases with the increase in the spring preload force; when the spring preload force changes, the change range of the qualified index of the seed rower is larger, so the influence of the spring preload force on the qualified index is more significant (Figure 11b). When the operating speed is certain, the qualified index of the seed rower increases with the increase in the spring preload force; when the spring preload force is certain, the qualified index of the seed rower decreases with the increase in the operating speed; when the operating speed changes, the change range of the qualified index of the seed rower is larger, so the effect of the operating speed on qualified index is more significant (Figure 11c). In summary, the order of significance of the impact on the seeding performance qualified index is as follows: operating speed, spring preload force, and operating slope angle.
(2) Analysis of the effect of various factors on the coefficient of variation of seeding performance
The statistical analysis software Design-Expert 8.0.6 was used to process and analyze the experimental data, and the regression mathematical equation with the coefficient of variation of seeding performance as the response function and the actual value of each factor level as the independent variable were obtained as follows:
Y 2 = 16 + 0.57 X 1 0.33 X 2 + 0.52 X 3 1.42 X 1 X 2 + 0.13 X 1 X 3 + 0.45 X 2 X 3 0.85 X 1 2 0.15 X 2 2 0.36 X 3 2
where Y 2 is the coefficient of variation of seeding, in %; X 1 is the actual value of the seed rower’s operating speed, in m/s; X 2 is the actual value of the spring preload force, in N; X 3 is the actual value of the operating slope angle of the seed rower (°).
In order to visually analyze the relationship between each test factor and the coefficient of variation of seeding performance, contour plots, and response surface plots were obtained using Design-Expert 8.0.6 software for the effects of the seed rower’s operating speed, spring preload force, and operating slope angle on the coefficient of variation (Figure 12).
Under the premise that the operating index meets the precision sowing requirement and the working condition of the seed rower is good, the influence law of each factor was analyzed. When the operating speed is certain, the coefficient of variation of the seed rower increases with the increase in the operating slope angle; when the operating slope angle is certain, the qualified index of the seed rower increases with the increase in the operating speed; when the operating speed changes, the variation range of the coefficient of variation of the seed rower is larger, so the operating speed has a more significant effect on the coefficient of variation (Figure 12a). The coefficient of variation of the seed rower decreases with the increase in the operating slope angle when the spring preload force is certain; the coefficient of variation of the seed rower increases with the increase in the spring preload force when the operating slope angle is certain; when the spring preload force varies, the variation range of the coefficient of variation of the seed rower is larger, so the influence of the spring preload force on the coefficient of variation is more significant (Figure 12b). When the operating speed is certain, the seed rower coefficient of variation increases with the increase in the spring preload force; when the spring preload force is certain, the seed rower coefficient of variation increases with the increase in operating speed; when the operating speed changes, the variation interval of the seed rower coefficient of variation is larger, so the operating speed has a more significant effect on the coefficient of variation (Figure 12c). In summary, the order of significance of the coefficient of variation on seeding performance is as follows: operating speed, spring preload force, and operating slope angle.

3.4. Multi-Factor Experimental Optimization

According to the results of the multi-factor test, combined with the multi-objective variable optimization method, a parametric mathematical model was established, and the data analysis software Design-Expert 8.0.6 was used to optimize the test data. The established nonlinear programming parameter model is shown in Equation (10).
max   Y 1 min   y 2 s . t .   0.8   m / s X 1   1.2   m / s 5.5 N X 2 25 N   8 X 3   1 6 0 y 1 ( X 1 , X 2 , X 3 )   1 0 Y 2 ( X 1 , X 2 , X 3 )   1  
Through comprehensive analysis, the optimal operating parameter combination of the device was obtained; when the operating speed of the device was 1 m/s, the spring preload force was 15.2 N, and the operating slope angle was 12°; the designed rotary hole filling corn seed rower had better seed rowing performance, with a qualified index of 96.2% and a coefficient of variation of 12.1%.

4. Conclusions

In this study, a rotary hole filling corn precision metering device was designed, and the working reliability and stability of the seed rower were verified through coupled simulation tests and bench tests. Single-factor and multi-factor tests were conducted to analyze the performance of the seed rower, with the following conclusions:
(1) Combined with MBD–DEM coupling simulation technology, the motion process of the seed rower fork and duckbill device was analyzed to obtain the optimal combination of parameters for cavity-tying performance, and the characteristics of soil particles and seed transport pattern during the cavity-tying process were studied isomg a duckbill device. This provided the theoretical basis for the subsequent bench test verification.
(2) The results showed that all three factors had a significant effect on the seed rower qualified index, and the operating speed and operating slope angle had a significant effect on the coefficient of variation of grain distance and determined the optimal parameter range.
(3) The results showed that when the operating speed of the machine was 1 m/s, the spring preload force was 15.2 N, and the operating slope angle was 12°, so the designed rotary hole filling corn seed rower had better seed rowing performance, with a qualified index of 96.2% and a coefficient of variation of 12.1%.

Author Contributions

Conceptualization, W.W.; methodology, H.T., J.W. (Jinfeng Wang) and J.W. (Jinwu Wang); software, C.W.; validation, W.W.; formal analysis, W.W.; investigation, C.W. and Z.G.; resources, W.W., J.W. (Jinwu Wang), J.W. (Jinfeng Wang) and H.T.; data curation, Z.G. and G.Z.; writing—original draft preparation, C.W.; writing—review and editing, C.W., Z.G. and G.Z.; visualization, Z.G.; project administration, W.W., J.W. (Jinwu Wang), J.W. (Jinfeng Wang) and H.T.; funding acquisition, W.W. All authors have read and agreed to the published version of the manuscript.

Funding

This work was supported by the Natural Science Foundation of Heilongjiang Province of China for Excellent Youth Scholars, grant number YQ2021E003 and Key Research and Development Plan Project of Heilongjiang Province, grant number 2022ZX05B02.

Institutional Review Board Statement

Not applicable.

Informed Consent Statement

Not applicable.

Data Availability Statement

All data are presented in this article in the form of figures and tables.

Acknowledgments

The authors would like to acknowledge the College of Mechanical Electronic Engineering, Fujian Agriculture and Forestry University and the College of Engineering, Northeast Agricultural University.

Conflicts of Interest

The authors declare no conflict of interest.

References

  1. Wang, J.; Tang, H.; Zhou, W. Improved Design and Experiment on Pickup Finger Precision Seed Metering Device. Trans. Chin. Soc. Agric. Mach. 2015, 46, 68–76. [Google Scholar] [CrossRef]
  2. Luo, X.; Liao, J.; Hu, L.; Zang, Y.; Zhou, Z. Improving Agricultural Mechanization Level to Promote Agricultural Sustainable Development. Trans. Chin. Soc. Agric. Eng. 2016, 32, 1–11. [Google Scholar] [CrossRef]
  3. Li, F.; Sun, J. Current Situation, Problems and Countermeasures of Rational Development and Utilization System Construction of Sloping Arable Land. China Soil Water Conserv. 2021, 72, 18–20. [Google Scholar] [CrossRef]
  4. Yang, L.; Yan, B.; Zhang, D.; Zhang, T.; Wang, Y.; Cui, T. Research Progress on Precision Planting Technology of Corn. Trans. Chin. Soc. Agric. Mach. 2016, 47, 38–48. [Google Scholar] [CrossRef]
  5. Geng, D.; Sun, Y.; Li, H. Design and Experiment of Crawler Corn Harvester for Sloping Fields. Trans. Chin. Soc. Agric. Eng. 2021, 37, 11–19. [Google Scholar]
  6. Dhok, A.S.; Biwal, V.D.; Ghadge, S.B. Performance Evaluation of Bullock Drawn Planter with Low Cost Metering Device. Int. J. Agric. Eng. 2015, 8, 136–139. [Google Scholar] [CrossRef]
  7. Taghinezhad, J.; Alimardani, R.; Alimardani, R. Development and Evaluation of Three Metering Device Models for Sugarcane Setts. J. Agric. Sci. 2014, 20, 164–174. [Google Scholar] [CrossRef]
  8. Sandip, M.; Prasanna, K.G.V.; Hetal, T. Design and Evaluation of a Pneumatic Metering Mechanism for Power Tiller Operated Precision Planter. Curr. Sci. 2018, 115, 1106–1114. [Google Scholar] [CrossRef]
  9. Anantachar, M.; Kumar, P.; Guruswamy, T. Neural Network Prediction of Performance Parameters of an Inclined Plate Seed Metering Device and its Reverse Mapping for the Determination of Optimum Design and Operational Parameters. Comput. Electron. Agric. 2010, 72, 87–98. [Google Scholar] [CrossRef]
  10. Pareek, C.M.; Tewari, V.K.; Rajendra, M. Optimizing the Seed-cell filling Performance of an Inclined Plate Seed Metering Device Using Integrated ANN-PSO Approach. Artif. Intell. Agric. 2021, 5, 1–12. [Google Scholar] [CrossRef]
  11. Yazgi, A.; Degirmencioglu, A. Measurement of Seed Spacing Uniformity Performance of a Precision Metering Unit as Function of the Number of Holes on Vacuum Plate. Measurement 2014, 56, 128–135. [Google Scholar] [CrossRef]
  12. Kostic, M.; Rakic, D.; Radomirovic, D. Corn Seeding Process Fault Cause Analysis Based on a Theoretical and Experimental Approach. Comput. Electron. Agric. 2018, 151, 207–218. [Google Scholar] [CrossRef]
  13. Abdolahzare, Z.; Mehdizadeh, S.A. Real Time Laboratory and Field Monitoring of the Effect of the Operational Parameters on Seed Falling Speed and Trajectory of Pneumatic Planter. Comput. Electron. Agric. 2018, 145, 187–198. [Google Scholar] [CrossRef]
  14. Amirkhani, M.; Mayton, H.S.; Netravali, A.N.; Taylor, A.G. A Seed Coating Delivery System for Bio-Based Biostimulants to Enhance Plant Growth. Sustainability 2019, 11, 5304. [Google Scholar] [CrossRef]
  15. Inderpal, S.; Anand, G.; Kumar, D. Development and Evaluation of Inclined Plate Metering Mechanism for the Sowing of Corn (Zea mays L) Seed. Curr. J. Appl. Sci. Technol. 2020, 39, 118–128. [Google Scholar]
  16. Dylan, S.J.; Hesterman, D.C.; Guzzomi, A.L. Precision Metering of Santalum spicatum (Australian Sandalwood) Seeds. Biosyst. Eng. 2013, 115, 171–183. [Google Scholar] [CrossRef]
  17. Rajaiah, P.; Mani, I.; Kumar, A.; Lande, S.D.; Singh, A.K.; Vergese, C. Development and Evaluation of Electronically Controlled Precision Seed-Metering Device for Direct-Seeded Paddy Planter. Indian J. Agric. Sci. 2016, 86, 598–604. [Google Scholar]
  18. Devesh, K.; Ashok, T.; Kamal, K. Design and Laboratory Test of a Seed Metering Device of Sowing Soyabean Seeds. Asian J. Multidimens. Res. 2017, 6, 57–66. [Google Scholar]
  19. Li, M. Dynamics Analysis and Simulation of Pneumatic Corn Precision Seed rower. Village Technol. 2021, 12, 119–120. [Google Scholar]
  20. Du, X.; Liu, C.; Jiang, M. Design and Experiment of Self-Disturbance Inner-Filling Cell Wheel Corn Precision Seed-Metering Device. Trans. Chin. Soc. Agric. Eng. 2019, 35, 23–34. [Google Scholar]
  21. Song, Y.; Zhang, H.; Wang, N. High Quality Sowing Technology for Corn in the Three Rivers Plain Area of Heilongjiang Province. Mod. Agric. Technol. 2022, 821, 55–58. [Google Scholar]
  22. Wang, J.; Tang, H.; Wang, J. Numerical Analysis and Performance Optimization Experiment on Hanging Unilateral Ridger for Paddy Field. Trans. Chin. Soc. Agric. Mach. 2017, 48, 72–80. [Google Scholar] [CrossRef]
  23. Lu, Y.; Chen, X.; Yang, H. Experiment of Air-Suction Cotton Precision Metering Mechanism. Guangdong Agric. Sci. 2013, 40, 182–184. [Google Scholar] [CrossRef]
  24. Chen, X.; Zhong, L. Design and Test on Belt-Type Seed Delivery of Air-Suction Metering Device. Trans. Chin. Soc. Agric. Eng. 2012, 28, 8–15. [Google Scholar] [CrossRef]
  25. Zhang, C.; Fan, X.; Li, M. Simulation Analysis and Experiment of Soil Disturbance by Chisel Plow Based on EDEM. J. Agric. Mach. 2022, 53, 52–59. [Google Scholar]
  26. Mohamed, A.; Xavier, P.; Craig, P. DROD: A Hybrid Biomimetic Undulatory and Reciprocatory Drill: Quantitative Analysis and Numerical Study. ACTA Astronaut. 2021, 182, 131–143. [Google Scholar] [CrossRef]
  27. Lü, J.; Yi, S.; Tao, G. Design and Experiment of Precision Air-Suction Type Planter for Potato. Trans. Chin. Soc. Agric. Eng. 2018, 34, 16–24. [Google Scholar]
Figure 1. Whole structure of rotary hole filling corn precision metering device. 1. Seed box; 2. casing; 3. ratchet mechanism; 4. seed discharge chamber; 5. seed guide ring; 6. connecting shaft; 7. connecting disk; 8. right-angle seed guide; 9. stagnant seed chamber; 10. rocker; 11. duckbill device; 12. outer disk; 13. fork. (a) axonometric drawing of seed rower; (b) side view of seed rower; (c) exploded view of seed rower; I. filling area; II. seed replanting area; III. seed guide area; IV. seeding area.
Agriculture 13 01093 g001
Figure 2. Diagram of the relationship between the fork cam and the rocker.
Agriculture 13 01093 g002
Figure 3. EDEM–ADAMS coupled virtual seeding process. (a) seed rower model; (b) corn seed model; (c) soil particle and trough model; (d) coupling simulation process.
Agriculture 13 01093 g003
Figure 4. Seeding performance testing experiment bench. 1. rotary hole filling corn seed rower; 2. image system; 3. connecting pedestal; 4. drive motor. (a) bench experiment stand; (b) ratchet mechanism; (c) seed rower prototype.
Agriculture 13 01093 g004
Figure 5. Simulation results of EDEM–ADAMS coupled virtual seeding.
Agriculture 13 01093 g005
Figure 8. Trend of operating speed on each performance test index. (a) Effect of operating speed on qualified index; (b) effect of operating speed on coefficient of variation.
Agriculture 13 01093 g008
Figure 9. Trend of spring preload force on each performance test index. (a) Effect of spring preload force on qualified index; (b) effect of spring preload force on coefficient of variation.
Agriculture 13 01093 g009
Figure 10. Effect of operating slope angle on the trend of each performance test index (a); the effect of operating slope angle on the qualified index; (b) effect of operating slope angle on the coefficient of variation.
Agriculture 13 01093 g010
Figure 11. Response surface of each factor to the qualified index. (a) Operating speed and operating slope angle; (b) operating slope angle and spring preload force; (c) operating speed and spring preload force.
Agriculture 13 01093 g011
Figure 12. Surface response of each factor to the coefficient of variation. (a) Operating speed and operating slope angle; (b) operating slope angle and spring preload force; (c) operating speed and spring preload force.
Agriculture 13 01093 g012
Table 1. Seed displacer material properties.
Key ComponentsMaterialPoisson’s RatioShear Modulus (Pa)Density
(kg·m−3)
Duckbill device65 Mn0.357.27 × 10107830
The shell of seed rowerABS plastic0.501.80 × 1081176
Outer ring of seed rower
Fork
Nesting rollers
Seed cleaning rollersPig bristle0.401.0 × 1081150
Table 2. Corn seed model discrete element model contact parameters.
ParametersValue
Poisson’s ratio0.400
Shear modulus/(Pa)1.37 × 108
Corn seed density/(kg·m−3)1197
Coefficient of static friction between corn seeds0.275
Coefficient of dynamic friction between corn seeds0.067
Recovery coefficient among corn seeds0.382
Coefficient of static friction between corn seeds and soil particles0.400
Coefficient of kinetic friction between corn seeds and soil particles0.100
Recovery coefficient of corn seeds and soil particles0.700
Coefficient of static friction between corn seeds and duckbill device0.300
Coefficient of dynamic friction between corn seeds and duckbill device0.025
Recovery coefficient of corn seeds with duckbill device0.380
Coefficient of static friction between corn seeds and seed cleaning roller0.530
Coefficient of dynamic friction between corn seed and seed cleaning roller0.120
Recovery coefficients of corn seeds with seed cleaning rolls0.030
Coefficient of static friction between corn seeds and other components0.530
Coefficient of dynamic friction between corn seeds and other components0.120
Recovery factor of corn seeds with other components0.092
Table 3. Soil duckbill device discrete element model contact parameters.
ParametersValue
Recovery coefficient between particles and duckbill device0.30
Soil water content/(%)16
Soil particle density/(kg·m−3)2060
Soil Poisson’s ratio0.38
Soil shear modulus/(Pa)1.05 × 1010
Inter-particle normal contact stiffness coefficient1.20 × 108
Critical normal stress between particles/(MPa)180
Critical inter-particle tangential stress/(Mpa)74
Static friction coefficient between soil particles0.40
Coefficient of dynamic friction between soil particles0.22
Recovery coefficient between soil particles0.20
Table 4. Factor-level coding table of single-factor test.
Level CodeExperimental Factors
Operating Speed
x1/(m/s)
Spring Preload Force x2/(N)Operating Slope Angle x3/(°)
10.20.50
20.45.64
30.610.68
40.815.212
51.020.716
61.224.820
71.429.824
Table 5. Factor-level coding table of multi-factor test.
Level CodeExperiment Factors
Operating Speed
X1/(m/s)
Spring Preload force X2/(N)Operating Slope Angle X3/(°)
1.681.224.816
11.120.714
01.015.212
−10.910.610
−1.680.85.68
Table 6. Operating speed effect on each performance test index determined via ANOVA.
Performance IndicatorsSourceSquare SumDegree of FreedomMean SquareF ValueSignificance
Qualified indexRegression model92.10246.0589.48<0.0001
Factor x117.93117.9334.84<0.0001
Factor x1274.17174.17144.12<0.0001
Error16.47320.51
Sum108.5734
Coefficient of variationRegression model403.932201.97140.36<0.0001
Factor x1122.021122.0284.80<0.0001
Factor x12281.921281.92195.92<0.0001
Error46.04321.44
Sum449.9834
Table 7. Spring preload on each performance test index determined via analysis of variance.
Performance IndicatorsSourceSquare SumDegree of FreedomMean SquareF ValueSignificance
Qualified indexRegression model32.58216.2967.94<0.0001
Factor x114.37114.3759.92<0.0001
Factor x1217.85117.8574.44<0.0001
Error7.67320.24
Sum40.2634
Coefficient of variationRegression model68.00234.0034.26<0.0001
Factor x145.65145.6546.00<0.0001
Factor x1221.63121.6321.80<0.0001
Error31.76320.99
Sum99.7634
Table 8. Operating slope angle on each performance test index determined via analysis of variance.
Performance IndicatorsSourceSquare SumDegree of FreedomMean SquareF ValueSignificance
Qualified indexRegression model26.72213.3665.77<0.0001
Factor x34.3214.3221.27<0.0001
Factor x3222.40122.40110.26<0.0001
Error6.50320.20
Sum33.2334
Coefficient of variationRegression model330.252165.12227.80<0.0001
Factor x3273.561273.56377.40<0.0001
Factor x3256.69156.6978.20<0.0001
Error23.20320.72
Sum353.4434
Table 9. Multi-factor test protocol and results.
No.Test FactorsPerformance Indicators
Operating Speed
X1/(m/s)
Spring Preload Force
X2/(N)
Operating Slope Angle
X3/(°)
Qualified Index
Y1/(%)
Coefficient of Variation
Y2/(%)
1−1−1−196.2412.13
21−1−187.9012.86
3−11−188.9814.23
411−185.7914.35
5−11191.0315.28
61−1191.6913.94
7−11189.9013.58
811195.8915.79
9−1.680093.2815.38
101.680085.7613.17
110−1.68092.5612.81
1201.68086.4213.21
1300−1.6891.5615.81
14001.6893.0216.31
1500090.7615.97
1600091.6216.32
1700088.1415.57
1800090.5216.07
1900089.9716.61
2000091.2515.55
2100090.9514.98
2200091.5516.05
2300090.2415.89
Disclaimer/Publisher’s Note: The statements, opinions and data contained in all publications are solely those of the individual author(s) and contributor(s) and not of MDPI and/or the editor(s). MDPI and/or the editor(s) disclaim responsibility for any injury to people or property resulting from any ideas, methods, instructions or products referred to in the content.

