
Environmental and Economic Responses to Precision Feed Management in Dairy Cattle Diets

1
Department of Animal Science, Cornell University, Ithaca, NY 14853, USA
2
Department of Agriculture, Forestry and Food Science, University of Turin, 10095 Grugliasco, Italy
*
Author to whom correspondence should be addressed.
Agriculture 2023, 13(5), 1032; https://doi.org/10.3390/agriculture13051032
Submission received: 10 April 2023
/
Revised: 2 May 2023
/
Accepted: 5 May 2023
/
Published: 9 May 2023
(This article belongs to the Special Issue Farm Animals Rumen Digestion, Nutrition and Feed Management)
Abstract
:The dairy industry is under pressure to reduce its environmental impact while producing more milk to meet society’s needs. Precision feed management (PFM) is one tool that can be used to meet this challenge. A simple definition of PFM is to provide adequate, but not excessive, nutrients to meet animal requirements. There has been an industry trend to decrease diet nitrogen (N) and phosphorus (P) in the last 20 years. New York herds lowered diet N by 10.8% between 1999 and 2019. Milk per cow increased by 40% during this time, while total manure N excretion decreased by 8.1%. Research results from on-farm trials have consistently indicated that lowering diet crude protein (CP) decreases manure N excretion while improving profitability; in a 3-year study with 8 herds, diet CP was decreased by 9.7%, while manure N excretion was 14% lower. Income over purchased feed cost increased by $137/cow/year. Carbon footprint (CF) has also decreased. A decrease of 19% between 2007 and 2017 was reported for the United States dairy industry. The dairy industry has already made significant strides in improving milk production while lowering its impact on the environment; however, there are additional opportunities to further reduce nutrient excretion and emissions into the environment and increase the efficiency of nutrient use.
1. Introduction
The dairy industry is under continuing pressure to improve efficiency, sustainability, and lower its environmental impact. At the same time, demand for milk and milk products are expected to increase. The world population is projected to increase to 9.7 billion by 2050 [1]. Agricultural food production needs to increase by 50 to 70% to meet the needs of this expanded population. Per capita milk consumption is projected to increase by 16% by 2030 [2]. Global milk production needs to increase by 35% by 2030 to meet this demand. A second paper projected that the demand for dairy products in 2050 will be double the demand in 2000 [3]. The increased demand projections are a combination of two factors: One is the increase in population. The second factor is the increased consumption of cheese, yogurt, ice cream and other dairy products as the economic status of families improves.
Milk and dairy products are high-quality sources of nutrients. Milk provides 13 essential nutrients required in human diets. These include protein, calcium, iodine, and B-vitamins. Animal proteins have been reported to have a bioavailability 1.4 times greater than plant protein sources [4]. Protein quality and the upgrading of plant amino acids by dairy cattle also needs to be considered when evaluating the importance of milk and dairy products in human diets [5,6]. A recent paper reported that one-half of the total protein supply needs to be from animal-based proteins to meet nutrient requirement recommendations [7]. Animal proteins are also needed to provide required nutrients at a minimum cost [8]. The value of milk and dairy products in the diets of different age groups has been reviewed [9]. It is also important to recognize that livestock have social and economic roles in developing countries [10].
Precision feed management (PFM) is one tool that the dairy industry can use to address concerns about environmental impact. The simple definition of PFM is to provide adequate, but not excess nutrients, to support animal health and productivity. In New York, there is a PFM work group. This includes university faculty, cooperative extension employees, representatives of regulatory agencies, nutrition consultants and feed industry personnel. This group has expanded the PFM definition to include forage system management. The current definition of PFM used in New York is “The continual process of providing adequate, but not excess, nutrients to the animal and deriving a majority of the nutrients from the homegrown feeds through the integration of feeding and crop management for the purpose of maintaining farm environmental and economic sustainability.” The PFM work group has developed benchmark guidelines used in evaluating dairy diets. These include forage neutral detergent fiber (NDF) intake ≥ 0.9% of body weight, ration phosphorus (P) < 110% of requirements, diet crude protein (CP) < 16.5% and milk urea nitrogen (MUN) of 8–12 mg/dL. A key concern in the United States is to manage farm nutrients to minimize manure nutrients leaving the farm and impairing water quality on a watershed basis [11]. A trial was conducted comparing a control total mixed ration (TMR) with a treatment group in which the total mixed ration (TMR) was adjusted weekly for each individual cow [12]. There were significant increases in milk, energy-corrected milk (ECM) and feed efficiency for cows in the treatment group. Precision feed management can improve the efficiency of producing milk [13]. An overview of the role of precision dairy farming in the Australasia region is available [14]. This group defined some focus areas needed to increase the use and adoption of precision dairy farming. These include better industry coordination and leadership, defining the value of precision dairying, increasing technology available to farms, and providing educational and training opportunities for dairy producers.
Whole farm nutrient management (WFNM) plans are an integral component of a comprehensive PFM program. These plans are targeted to minimize nutrient excretion to the environment. A key concern is the impact of excess nutrients on water quality [15]. In the United States, these plans are a combination of federal and state regulations. These plans include an inventory of all nutrient sources on the farm, nutrient imports, nutrient exports, determination of crop nutrient needs based on soil test results, and crop yields to supply nutrients to minimize environmental impact while maximizing the agronomic benefits. Plans are developed by a certified nutrient management planner and detailed farm records need to be maintained to verify compliance. Herds are audited to verify compliance. The steps on developing nutrient management plans have been outlined [16,17].
The aim of this review is to present and describe successful on-farm precision feed management research, highlighting the importance of adequate diet balancing and the issues regarding optimal N and P diet provision and their impact in environmental and economic responses.
2. Nitrogen and Ammonia
Nitrogen (N) is an environmental concern for both water and air quality. Excess N intake is expensive and lowers the efficiency of converting intake N into milk. Ruminants can convert simple N sources, such as urea, into high-quality amino acids [18]. In addition, ruminants can also recycle N within the animal [19,20,21]. Dairy cows can also convert low-quality human-inedible proteins into high-quality edible protein (HEP) for use in human diets [22,23]. A study in Sweden replaced cereal grains and soybean meal with co-product feeds including beet pulp, distiller’s grain, and rapeseed meal [24]. Cows fed the co-product diets produced 2.56 to 2.68 times more HEP than consumed. The next step is to include human-digestible amino acids in the calculation [5,6].
Nitrogen-use efficiency (NUE), milk nitrogen efficiency (MNE), and efficiency of nitrogen use (ENU) are the common metrics used to assess the efficiency of N use [25,26,27]. This is calculated as the grams of N in the milk produced divided by the grams of dietary N intake. If dietary N intake is 730 g and milk N is 234 g, then NUE = 32%. The range of NUE observed in commercial dairy herds is 20 to 40%. The theoretical maximum NUE from research literature is 40–45%. The estimated MNE for 85 New York dairy farms in 2004 had an average of 28.8% with a range of 21.4 to 35.8 [28]. A recent paper surveyed 28 United States dairy farms and concluded that milk yield was optimized at a NUE of 34.7% [29]. This same study had data on 285 pens on these farms. The average pen NUE was 27.8% with a range of 14.2 to 46.7%. The relationship of NUE, milk production and profitability in eastern Canadian dairy herds was investigated [30]. Data were obtained from 100 herds and organized in clusters with NUE values of 22, 27, 30, and 36%. Diet CP decreased from 16 to 14.2% as NUE increased. This indicates an opportunity in dairy herds to improve efficiency of N use by the better balancing of diets. Milk and fat-corrected milk (FCM) production were significantly lower in the cluster herds with 22% NUE. Income over feed cost (IOFC) increased as NUE increased.
A classic trial examined diet CP and N flows in dairy cattle [31]. Diets fed ranged from 13.5 to 19.4% CP. Milk yield was not significantly different between the diets for cows producing 36 to 38 kg. Fecal N excretion was lower for a 15% CP diet but similar for the other diets. Urinary N (UN) excretion increased linearly as diet CP increased. The urinary urea N (UUN), as percent of UN, increased from 55.4% for a 13.5% CP diet to 81.8% for a 19.4% CP diet. The percent of N intake captured in milk protein decreased from 36.4% to 25.3% as diet CP increased from 13.5 to 19.4%. This indicates a lower efficiency of N use as N intake increased. Urinary urea N increased from 86 to 320 g/d as diet CP increased from 15 to 21% [32]. The increase in urinary N excretion and lower efficiency of N use has been reported in other papers [33,34,35]. A review paper reported that decreasing diet CP from 20 to 15% reduced annual fecal N excretion by 21% and urine N by 66% [36]. Rumen N metabolism and the relationships to N excretion papers are available [37,38,39].
The importance and use of amino acids has been described [39,40,41]. The effect of postruminal infusion of casein was reported [42]. Milk production was 1–4 kg/d higher, and there was a 10–15% increase in milk protein yield when casein was administered. These results indicate a potential benefit to amino acid supplementation. A multi-university study using rumen-protected methionine and lysine in diets based on corn silage and corn grain was reported [43]. The protein sources used were soybean meal or corn gluten meal and urea. Milk protein yield and milk production were higher on the corn gluten meal diets when the rumen protected amino acids (RPAA) were supplemented. Milk yield was not improved for cows fed soybean meal when RPAA were added. A second paper [44] followed the same experimental design. Added RPAA did not increase milk production or milk protein yield in cows fed soybean meal. Milk and milk protein yields were higher when rumen-protected amino acids were supplemented to the corn gluten meal diet. There have been several meta-analysis papers published when rumen-protected methionine (RPM) was used [45,46,47]. There was an increase of milk protein yield of 2.23 g of protein for each gram of MP methionine intake before the breakpoint [46]. A multiple regression analysis indicated that milk production and milk protein percent were significantly higher when RPM was fed [47]. Amino acids have also been reported to have benefits for reproduction, transition cow health and heat stress [48,49,50,51].
Milk urea nitrogen (MUN) is one tool that can be used at the farm level to assess the efficiency of diet N use [52,53,54,55,56,57]. MUN increased from 7.7 to 15.6 mg/dL as diet CP increased from 13.5 to 19.4% [31]. A second trial reported that MUN increased from 7.9 to 24.5 mg/dL as diet CP went from 15 to 21% CP (32). There is also a linear relationship between MUN and urinary N excretion [53,54]. UUN can also be predicted from MUN [32,52]. One equation was UUN g/d = −48.6 + 16.2 × MUN when MUN was between 5 and 16 mg/dL [52]. The current guideline for MUN in dairy herds in the New York PFM program is 8–12 mg/dL. Many U.S. dairy herds receive daily bulk tank MUN values from milk processors. This provides a tracking tool to flag changes that may have occurred in the forage or feeding program.
Ammonia emissions from dairy farms can have health implications for both animals and humans. The effect is due to the irritant effect of ammonia on the eyes and lungs. Ammonia is involved with the formation of fine particles (PM2.5) which are a risk for human health [58]. The relationship between diet CP and ammonia emissions has been reported [59,60,61,62,63]. Ammonia emissions decreased by 66% on a diet with 14% CP compared to a 19% CP diet [60]. A second paper reported that a one-unit increase in diet CP resulted in an increase of 10.2 g/cow/day in NH3 emissions [60]. The same paper indicated that NH3 emission increased by 16.3 g/cow/day when dry matter intake (DMI) increased by one unit. Manure ammonia emissions were higher as diet CP increased [64,65]. Diets with higher levels of fermentable carbohydrates were reported to lower rumen NH3 production [66]. The relationships of diet and management factors on ammonia emissions have been summarized [67,68,69]. A review paper on ammonia emissions for dairy cattle is available [70].
3. Phosphorus
Phosphorus is an environmental concern for water quality. Excess diet P increases P excretion, which can result in higher soil P levels and an increased risk of P leaching to water supplies. There can also be P in manure runoff, which can cause eutrophication and algae growth in surface waters. An additional concern is a potential shortage of mineral P sources in the future. There is an increase in both total and water-soluble P content of manure when cows are fed P above requirements [71]. This increase in P content of manure would require more hectares of land to apply manure based on nutrient management guidelines. One reason for feeding excess P in dairy herds has been a perception that higher diet P levels improve reproduction. A second reason is to provide a safety factor in diet formulation to assure that P requirements are met. A review paper reported that surveys in the United States in the 1990′s found that diet P levels were often 25% above requirements [72].
There have been numerous research trials examining the relationships between milk production and reproductive performance, and diet P. A two-lactation trial reported that a diet P level of 0.28% was adequate for cows producing 9000 kg of milk [73,74]. Two trials using diet P levels of 0.31, 0.40 and 0.49% were conducted by the same group [75]. Fecal P increased as diet P increased. A reduction of fecal P excretion of 23% was observed when diet P decreased from 0.49 to 0.40%. There was no difference in milk production between the three diet P levels for cows producing 11,000 kg of milk. A two-year trial with diet P of 0.38 and 0.48% reported no differences in milk production or reproduction between the diets [76]. The other trial had data from cows fed with 0.31, 0.40 and 0.49% diet P levels for 2 or 3 years [77]. The authors concluded that there was a decrease in bone P content but that this did not affect bone strength. Bone P content or strength was not affected in cows on a 0.39% P diet. Cows producing >11,900 kg may be borderline deficient when fed a 0.32% P diet. Reproduction was not reduced in these trials. A 2-year lactation trial was conducted with diet P levels of 0.35 and 0.42% [78]. There was no difference in milk production in cows averaging 36 kg of milk. Fecal P was significantly higher for cows fed the 0.42% P diet (0.84 versus 0.62%). A 4-year trial using diet P of 0.36 and 0.49% in the winter months was conducted [79,80]. In the summer months, diet P levels were 0.36 and 0.42%. No significant difference in milk production, milk composition or reproduction between the diets were detected in this study. The low P diet provided about 80% of the 1991 United Kingdom feeding standard.
No differences in reproductive performance were observed in cows fed diets with 0.37 or 0.57% P and producing 35 kg of milk [81,82]. There was no effect on estrus intensity or duration when diets with 0.38 or 0.48% P were fed [83]. No effect on ovarian activity, reproduction or milk production was detected in cows fed diets with 0.35 or 0.47% P [84]. Reducing diet P from 0.41 to 0.35% was estimated to save CAD 20/cow/year [85].
The trend in the United States is to feed lower P diets. One reason is that the research results described above provide confidence that feeding diet P close to requirements does not impair milk production or reproductive performance. A second reason is the increased use of nutrient management plans to comply with environmental regulations. An evaluation of changes in diet P in New York herds between 1999 and 2019 was conducted [86]. During this time, the number of cows decreased 10.5% while milk/cow increased by 40.4%. Total New York milk production increased 26%. Diet P went down 18.8%, while manure P/cow/year was 9.2% lower. On a statewide basis, total manure P excretion decreased by 18.8%, and whole farm P mass balance was 51% lower. A similar analysis was done for the Vermont dairy industry [87]. Cow numbers dropped by 21%, and milk/cow increased by 26%. Total Vermont milk was 4.8% lower. Diet P decreased from 0.48 in 1999 to 0.39% in 2019. Total Vermont manure P excretion was 21% lower. These results indicate that lowering the overfeeding of dietary P can reduce the environmental impact of the dairy industry on a statewide basis.
4. Methane
Methane (CH4) is a natural product of carbohydrate fermentation in the rumen. In 2020, methane accounted for 10.9% of all greenhouse gas emissions in the United States [88]. Agriculture accounted for 9.9% of all GHG emissions. Enteric methane was 2.9% of total GHG emissions, while enteric CH4 from dairy cows was 0.73%.
Factors that determine the amount of methane produced in the rumen include DMI, milk production, forage type and quality, carbohydrate sources and processing method, fatty acid profile of fats, amount and ratio of the volatile fatty acids produced during fermentation and feed additive use [89]. Feed intake and the total quantity of carbohydrates digested in the rumen are key drivers of enteric CH4 [90,91]. Mitigation strategies and the use of feed additives to alter methane emissions have been recently reviewed [92,93,94,95,96]. A meta-analysis of the impact of 3-nitrooxypropanol (3-NOP) on enteric CH4 emissions was recently published [97]. Methane emissions were reduced by 30.9 to 32.7% in the diets when 3-NOP was added.
5. On-Farm Research
A vital component of the PFM program is conducting on-farm research. This is essential before implementing research results. This is also a crucial step in model development as a beta test before making models available for use by nutrition consultants and feed companies for routine use in evaluating and formulating diets. There is also the value of on-farm demonstration research to instill confidence into nutritionists and dairy producers to adopt and utilize new concepts.
5.1. Dairy Sustainability Trial
This was a project conducted on two dairy herds to assess tools and methods to develop a process to improve sustainability on dairy farms. This project was initiated in 1993 and included 16 Cornell faculty and 5 graduate students from 6 academic departments [98,99]. One herd was used over a 12-month period to evaluate a beta version of the Cornell Net Carbohydrate and Protein System (CNCPS) model on a commercial dairy herd [100]. This was done in cooperation with the feed company nutritionist working with the farm. The Cornell group formulated diets monthly for the high group. Diet CP was lowered from 20.3 to 18.3%, while diet MP increased from 2807 to 2971 g/day. The amount of alfalfa silage and high-moisture ear corn in the diet was increased. Diet levels of soybean meal and tallow were reduced, and a heat-treated soybean meal was added to the diet. Home-produced feeds increased from 56 to 63% of diet DM. Milk production increased from 43.4 to 46.5 kg. Diet feed cost went from USD 4.58 to USD 4.21/cow/day. Net farm income increased by USD 40,198 per year for this group. Total manure N was 34% lower, while manure ammonia N went down by 48%. The results of this trial confirmed that the CNCPS model can be used on commercial herds to lower CP, improve efficiency of N use, lower N excretion into the environment and improve profitability.
5.2. Washington State Herd
A trial with three experiments was conducted on a dairy herd in the state of Washington [101]. The objective was to evaluate the use of high-quality rumen-undegraded protein (RUP) sources or rumen-protected amino acids (RPAA) on NUE and manure ammonia emissions. Diets were formulated using the Agricultural Modeling and Training Systems Cattle Professional (AMTS) program [102]. This is a commercial program with a license for using CNCPS biology. Trial 1 and 2 used multiparous dairy cows while trial 3 used primiparous cows. A control diet and a diet balanced with methionine and lysine were formulated. Table 1 contains the results of this study. The authors concluded that feeding lower CP diets decreased manure N excretion and NH3 emissions while increasing NUE.
5.3. Western New York Herds
Two dairy herds were used in an 8-month study to validate recent changes in the CNCPS model [103]. These changes increased the sensitivity of the model to N intake and adjusted the requirement calculations [104]. The CNCPS model was used to formulate diets monthly for the high group diet. The nutritionist working with each herd was involved in identifying potential diet adjustments in cooperation with the Cornell group. Table 2 contains the results of this study. In herd B, total diet forage had to be decreased due to a limited forage inventory. High-moisture corn, soyhulls and wheat middlings were increased to replace forage. Herd B also stopped using bovine somatotropin during the trial, which lowered milk production. Diet CP was lowered by 4.5 to 5.7% while MP was decreased in herd A, but MP increased in herd B. Feed cost was lower in the final diet in both herds. Income over feed cost and income over purchased feed cost increased in the final diet in both herds. The smaller increase in herd B was associated with the cost of replacing forage in the diet. Predicted daily manure N excretion decreased by 6 to 11.8%. These results indicate that diet CP can be decreased without impacting milk production. Nutrient excretion can be decreased and income over feed cost improved at the same time.
5.4. Whole-Farm Project
A project was conducted over a 5-year period to evaluate the impact of implementing nutrient management practices that integrate animals, crops, and manure management [105]. Diets were formulated using the CNCPS 5.0 model [106]. The total number of animals and cows milked increased during the trial. The portion of the diet from forage increased due to increased crop yields and decreased forage storage losses. Total manure excretion N and P decreased as did N and P per hectare. Table 3 summarizes the results of this study. The results of this study indicate that changes in farm management to reduce nutrient excretion can be made while improving farm profitability.
5.5. Diet CP and Manure Ammonia
Eleven dairy herds in Pennsylvania were used in a study to evaluate the impact of lowering diet CP on ammonia emitting potential (AEP) of manure [107]. Herds were housed in either tie-stall (six herds) or free-stall (five herds) barns. Manure systems used were gutter-scrape (four herds), flush (two herds), scrape (three herds) or gravity flow (two herds). Two trial periods were used. Phase 1 was high CP (HCP), where herds were fed their current diet. Phase 2 used diets adjusted for lower CP (LCP). Diet CP averaged 16.5% for HCP and 15.4% for LCP diets. Diet CP adjustments were done by the nutritionist working with each herd. Milk yield averaged 32.2 kg/cow/day for the HCP herds and 32.5 kg for the low CP herds. Manure N was significantly lower (2.66 vs. 2.42%) for the LCP phase. Ammonia emitting potential (AEP) was determined by incubating the manure at 25 °C with air influx of 2 L/min for 24 h. There was a 23% decrease in AEP when the LCP diets were fed. There were no changes in the methane and carbon dioxide emitting potential between the 2 diets. The results indicate that lowering diet CP can decrease the AEP of manure.
5.6. Herd Best Management Practices
The effect of implementing best management practices (BMPs) was evaluated on 15 Pennsylvania dairy farms [108]. Each herd had an option to select one or more BMPs. This decision was made in cooperation with the herd nutritionist. Seven herds adopted a BMP to lower diet CP. Diet CP was 17.2% in the base period and 15.8% after BMP implementation. Milk yield in both groups was 31.8 kg/cow/day. Fecal N decreased from 2.78% in the base period to 2.64% after BMP implementation (p < 0.03). Urinary N decreased from 0.75% to 0.57% (p < 0.001). Farm N imports, N volatilization, N lost by leaching and ammonia emissions were significantly lower in the LCP phase. Total net return increased significantly from USD 2230 to USD 2286 per cow when the LCP BMP was implemented.
5.7. Delaware County PFM Project
Delaware County Cooperative Extension has had a PFM program in cooperation with Cornell for several years. The 2017 program reported a 23% reduction in manure P and a 7% decrease in manure N excretion in 29 herds [109]. There was an increase of USD 168/cow/year in milk income over purchased feed cost. The 2020 report for 43 herds had a 20.7% reduction in manure P excretion on herds that reduced diet P [110]. These herds also had a 7.8% decrease in manure N excretion and a USD 157/cow/year increase in milk income over purchased feed cost.
5.8. Upper Susquehanna Watershed Project
Eight New York dairy herds were used in a three-year project to evaluate the impact of implementing PFM on nutrient excretion into the environment and farm profitability [111]. This was a cost-share project, in which each herd contributed 10–20% of the project cost. There were three feed companies and two nutrition consultants involved in the project. Diets were formulated by the herd nutritionist in cooperation with the PFM team. All diets were evaluated using the CNCPS program [112]. Herd visits were made 3–4 times per year by the PFM team. A PFM feed management plan was developed for each herd. Table 4 contains data on milk production, diet CP and manure N excretion. There was a 4.3% increase in milk production and a 9.7% decrease in diet CP across all herds. Manure N excretion decreased by 14%. Income over feed cost increased by USD 103/cow/year while income over purchased feed cost was USD137/cow/year higher. The results of this trial confirm that lowering diet CP can reduce manure N excretion to the environment while improving farm profitability.
5.9. Vermont Dairy Farm Sustainability Project
This was a cooperative project initiated in 2000 [113]. Project participants were a milk cooperative, dairy processors, feed companies and the University of Vermont. Eight dairy farms were used, but one of these only had dairy heifers. The cropping program, feeding program and WFNB were evaluated on each farm. An early version of the CNCPS program was used for ration evaluation and formulation. Farm visits were made biweekly, and forages were sampled, and rations were adjusted. Milk production increased by 1.1 kg/cow/day on six of the farms. Milk production on the other farm decreased by 6.7% due to changing milking frequency from 3 to 2 times/day. Diet CP decreased from 17.7 to 17.4%, while MP supply increased by 5.1%. Rumen N balance decreased by 21%, and diet N intake was 21% lower. Diet P decreased from 0.44 to 0.37%. These results indicate that lowering diet N and P intakes improved the efficiency of nutrient use.
5.10. Pennsylvania Herds
Two herds in Pennsylvania were used to assess the impact of lowering diet CP. Herd A changed diet CP from 18 to 16%. Average data for a 10-month period was used to evaluate the response. Milk production (3.5% FCM) was 35.8 kg/cow/d on the 18% CP diet versus 37.8 on the 16% diet. Metabolizable protein (MP) went from 108% of the required to 99% when diet CP decreased. MUN decreased from 10.7 mg/dL to 7.8 as diet CP decreased. NUE increased from 26 to 30% when diet CP decreased. Income over feed cost was USD 0.68/cow/d higher when the 16% CP diet was fed. The comparison in herd B was made over a 3-year period. Diet CP decreased from 18.3 to 16.2% CP, while MP increased from 2978 to 3017 g/day. Milk production increased from 12,040 to 12,212 kg/cow/lactation. Feed cost was USD 0.39/cow/day lower on the 16.2% CP diet. NUE increased from 27 to 30% as diet CP was lowered. The results from these herds indicate that diet CP can be lowered while improving the efficiency of N use and improving profitability.
5.11. University of New Hampshire
A trial was conducted examining the impact of shifting to an LCP diet with a better amino acid balance [114]. The original diet was 18.1% CP and 3071 g of MP. Lysine was 6.37% of MP, and methionine was 1.73%. The adjusted diet was 17.2% CP and 2809 g of MP. Lysine was 6.55% of MP, and methionine was 2.2%. Both diets were fed for 11 months. Milk yield did not change, but milk true protein was 2.7 to 2.8% on the higher CP diet. Milk true protein increased from 3.12 to 3.16% on the lower CP diet. MUN decreased from 14.5 to 12.4 mg/dL when the lower CP diet was implemented. Feed cost increased USD 0.05/cow/d on the lower CP diet; however, income over fed cost increased by USD 0.65/cow/day for cows fed the lower CP diet due to the improvement in milk true protein and milk fat content.
6. Whole-Farm Mass Nutrient Balance
Whole-farm mass nutrient balance (WFMNB) is a tool to assist in precision nutrient imports and exports. A positive balance indicates an accumulation of nutrients on the farm. Imports include feed, fertilizer, animals, and any other nutrient-containing materials. Exports include milk, animals leaving the farm, crops sold and manure (if exported). Results of WFMNBs on 189 New York dairy farms between 2004 and 2013 were reported [115]. Whole-farm N balance (WFNB) decreased from 119 kg N ha−1 to 84 kg ha−1 when N fixation was accounted for. Phosphorus balance went from 10.9 kg ha−1 to 6.4 kg ha−1. This is a 29% decrease for N and 41% for P. The primary driver of this change was decreased feed nutrient imports. Feed N imports accounted for 76% of this reduction, while feed P imports accounted for 74% of the change. There was no change in total farm nutrient exports. The decreases in nutrient imports were a combination of less purchased feed N and P and an increase in farm-produced feed and nutrients.
A second study examined changes in WFMNB on 54 New York dairy farms between 2005 and 2010 [116]. Reduction in mass nutrient balance per hectare was 29% for N when not considering N fixation. The change in P was −36% per hectare. Between 63 to 78% of the farms lowered their WFMNB while increasing milk production. The primary reason for these decreases was a decrease in feed nutrient imports. The results of these studies indicate that feed nutrient imports to dairy farms have a significant impact on mass nutrient balance.
7. Carbon Footprint
Carbon footprint (CF) is a tool that can be used to assess the potential environmental impact of dairy production systems. This approach includes crops, animal, manure management systems and resource inputs such as fuel, electricity, fertilizer and machinery use. Carbon sequestration by crops is also estimated. Life cycle analysis (LCA) is the system used. A paper by Thoma et al. [117] reported a United States average of 1.23 kg CO2 equivalent per kg of fat- and protein-corrected milk (4% and 3.3%, respectively). A second paper reported that the CF per billion kg of milk produced in the United States in 2007 was 37% of the equivalent milk production in 1944 [118]. The carbon footprint of the United States dairy industry decreased by another 19% between 2007 and 2017 [119]. The CF of milk production in the Netherlands was reduced by 35% in 2019 compared to 1990 [120]. A 22% decrease in CF in Ontario dairy herds between 1991 and 2011 was reported [121]. A paper from Denmark reported a 56% decrease in greenhouse gas (GHG) emissions per kg of milk produced between 1980 and 2010 [122]. These reports clearly indicate that the dairy industry has made significant reductions in its C while milk production has increased. A recent paper reported the CF for 19 countries [123]. The range was 0.74 to 5.99. Developed countries had CFs ranging from 0.74 to 1.53. Values from Swedish dairy farms are also available [124].
A simulation study was done using the Integrated Farm System Model (IFSM) to evaluate the impact of adopting BMP on CF in a 1500-cow dairy herd [125]. There were five feed BMPs, four manure systems and six field crop BMP’s. The baseline CF was 0.99 kg CO2 equivalent/kg milk. This decreased to 0.79 when the feed BMPs were implemented. This further decreased to 0.64 when the field crop and manure management BMPs were included. Similar simulations were done for a 150-cow dairy. Implementation of feed BMPs resulted in a reduction from 1.11 CO2 eq./kg milk to 0.86. The addition of the field crop and manure management BMPs lowered this to 0.59. In both simulations, the feed management BMPs accounted for 48–57% of the total whole farm decrease in carbon footprint.
8. Lower Crude Protein Diets
The trend in the dairy industry is to formulate and feed LCP diets. A 1998 survey of the six highest producing herds in Wisconsin reported an average diet CP of 19.4%. Milk production averaged 14,142 kg per lactation in these herds. A 2019 survey of the five highest-producing herds in Wisconsin reported an average diet CP of 16.8%. The average milk production in these herds was 15,534 kg per lactation. Diet CP in New York herds decreased from 18.5 to 16.5% between 1999 to 2019 [126]. Total statewide manure N excretion decreased 8.1% during this time even though manure N excreted per cow increased by 2.7%. There was a 10.5% decrease in cow numbers, a 40.4% increase in milk per cow and a 25.8% increase in total NY milk production. A similar study in Vermont reported a 21% decrease in total manure N excretion [87]. Diet CP in the Netherlands decreased from 19.7 to 16% from 1990 to 2012 but has increased to 17% as of 2020 [127,128,129]. A recent paper reported decreasing diet CP from 17.5 to 15% with two different forage systems [130]. There was no change in milk production, but NUE increased as diet CP was lowered. It has been suggested that diets balanced for 15% CP can support high levels of milk production [131,132,133,134,135].
Table 5 contains survey information on CP in diets for commercial Holstein dairy herds selected for using low CP diets. Herd nutritionists provided the data. Diets were evaluated using the CNCPS model [108]. Diet CP was similar for the 2001 and 2019a herds, even though milk production was higher in 2019. MP and amino acid balances were higher in the 2019 herds. The 2019b herds are from a dataset of high-producing herds [136]. It is interesting that there are herds with diet CP of 15% or lower in these herds. MNE values of 38 or higher indicate that some of these herds are very efficient in using N.
Other papers suggest that diets less than 15% CP may be adequate if the amino acids supplied meet the amino acid requirement [123,126]. A survey of nutritionists reported that 72% of the respondents were formulating diets with lower CP than they were 3–5 years ago [137]. A review paper concluded that diets with 14–15% CP are adequate in supporting health and reproduction [134].
9. Diet Formulation
Crude protein has been the most common approach used in balancing dairy diets. Adjustments made include rumen-degradable (RDP) and rumen-undegradable protein (RUP). The 2001 Dairy NRC publication evaluated the relationship between CP and milk production [138]. An equation using both CP and DMI was used to assess the relationship between CP and milk production. The dataset included 393 treatment means from 82 protein trials. The regression equation for milk production had a r2 of 0.29. This result highlights the fact that dairy cows do not have a CP requirement. They do have requirements for absorbable amino acids at the intestinal level. It was suggested that MP be used to formulate diets rather than CP. Metabolizable protein is composed of microbial protein synthesized in the rumen and RUP. The 2001 NRC did not establish amino acid requirements but did use a break point analysis to estimate lysine and methionine levels in dairy diets to maximize milk protein yield (MPY). The estimated values were 7.2% of MP for lysine and 2.4% for methionine. Further examination of dose response curves resulted in a practical recommendation of 6.6% lysine and 2.3% methionine [114]. Schwab and Ordway (114) evaluated >300 diets from published research trials using the NRC 2001 model. The r2 was 0.65 between actual and predicted MP milk. A second comparison using data from commercial herds reported an r2 of 0.72 between actual and predicted MP milk [113]. These results indicate the value of using MP rather than CP to formulate dairy cattle diets.
The 2021 NASEM nutrient requirement publication suggests moving to formulating diets for individual EAA’s rather than MP [139]. An equation to predict milk protein yield (MPY) using five essential amino acids (EAA) was developed. A review paper outlines the rationale for this approach [140]. The increased use of amino acid balancing is one area that can be expanded [141]. A trial used three diets that were isocaloric and had a positive rumen N balance [142,143]. A neutral diet was targeted to meet EAA requirements. The negative and positive diets were formulated to be one standard deviation below or above the neutral diet in EAA. Milk yield, ECM, milk true protein yield and milk fat yield were significantly higher for the neutral and positive diets than the negative diet. Differences between the neutral and positive diets were not significant. A second trial was done using four diets [144]. The base diet was 13.5% CP, which was adequate for ME but limited in rumen N, methionine, and MP. The positive diet was adequate in ME, MP, rumen N, and balanced for EAA. Two intermediate diets were also formulated. One was adequate in ME and methionine but limited in rumen N and MP. The other diet was adequate in ME, methionine, and rumen N but limited in MP. ECM, milk yield, milk true protein yield and milk fat yield were significantly higher for the positive diet compared to the base diet. In these trials the CNCPS v7 model [145] was used to examine the use of EAA in balancing diets.
A comparison of using MP or three EAA to formulate diets for Canadian dairy farms has been reported [146]. The amino acids used were lysine, methionine and histidine. Using the amino acid approach, a 3.8% decrease in farm N balance and a 4.3% increase in efficiency of N use was reported. Net farm income was 4.5% higher.
10. Diet Formulation Models
The use of diet formulation models provides an opportunity to balance dairy cattle diets to optimize rumen function, decrease excretion to the environment and feed efficiency. A commercial program was used to assess the economic impact of formulating diets weekly or monthly [147]. This program uses CNCPS biology. Return over variable costs were USD 25,000 per year higher when diets were formulated weekly. This is USD 83 per cow per year.
A review of some of the models is available [148]. A recent paper outlined the role and limitations of mechanistic models [149]. There are several formulation models available. These include both linear and non-linear models. Other types of models are response and mechanistic [150,151,152,153,154,155,156,157]. A survey of nutritionists found that about 60% of the respondents used the CNCPS model or one of the commercial programs licensed to use the CNCPS biology [137]. The CNCPS model [112] can provide information on N and P excretion and CH4 and CO2 emissions. Table 6 contains the environmental outputs for a diet balanced for 43 kg of milk with a DMI of 23.8 kg. This diet is 16.6% CP, 31.4% NDF, 5% fat and 26.6% starch and provides 2769 g of MP/cow/d. The diet is 62% forage with 2.7 ratio of corn silage to alfalfa silage. This diet met 103% of the ME and 101% of the MP requirements.
11. Grouping of Dairy Cattle
Grouping strategies on dairy farms provides an opportunity to improve the efficiency of nutrient use, decrease the number of overfed cows, decreases nutrient excretion and lowers feed cost, and can improve income over feed cost. The goal is to decrease the variability of milk production within the group. Several papers have described methods and considerations for grouping [158,159,160,161,162,163]. The challenge is determining the level of milk production to balance the diet for. Balancing for one standard deviation above the group mean should meet the nutrient requirements for 83% of the cows in the group [162]. A diet would be balanced for 50 kg of milk for a group averaging 40 kg milk with a standard deviation of 10 kg of milk. If the standard deviation was 5 kg, then the same group would be balanced for 45 kg of milk.
The impact of cluster or OptiGroup methods of grouping was evaluated on seven Wisconsin dairy farms [160]. The average income over feed cost in a two-group system was USD 8/cow higher using the OptiGroup approach. This increased to USD 12/cow in a three-group system. The impact of nutritional grouping in a herd with 2374 cows and 14 pens was evaluated [161]. Pens were regrouped weekly, and diets were adjusted. There was a USD 31/cow/year lower feed cost using the nutritional grouping strategy. There was also a decrease of 15 g/cow/d in diet N intake. The effect of grouping was examined in a 600-cow New York herd averaging 41 kg of milk. The herd had a fresh-cow and high-cow groups. A late lactation diet was formulated and fed to the herd. There was no change in herd milk production, but feed cost was reduced by USD 0.65 cents per cow per day (USD 237/cow/year). Herd N excretion decreased by 6.2% and P by 2% by adding the third group.
12. Feed Management Systems
A key factor for success in PFM is improving the consistency and reducing the variability of the daily feed management program [164,165,166,167]. Several electronic feed management programs are available for use on dairy farms [168]. Sixteen percent of the farms reported using a feed management system [168]. Ten percent of herds with less than 100 cows used a feed management system. In larger herds (>500 cows), 52% of the herds were using a feed management system. These programs have weigh cells on the mixer wagon and can record the quantity of each ingredient added to the mix. Information on the total quantity of feed delivered to each animal group can be recorded. If feed refusals are collected and weighed, then group DMI can be determined. Table 7 is an actual example of a TMR mixed on a dairy farm. This is an excellent mix with a small variation between the target feed amount and the amount added. Figure 1 contains DMI over a 7-day period for 3 herds and 1 dry cow group. Herd A and the dry cows had a small variation in DMI over the 7-day period. Diets could be formulated with a small safety margin above the requirements in these groups. The larger daily variation in DMI in herds B and C make it difficult to formulate diets with small safety margins and would be expected to have larger variation in herd daily milk production.
13. Role of NIR
Near infrared spectroscopy (NIRS) technology is routinely used in commercial forage-testing laboratories to measure organic constituents in feed and forage samples. This technology is now available in portable devices that can be used on farms for rapid analyses. The initial use was to determine forage dry-matter content [169,170]. The ability to determine nutrients, such as protein and fiber, is now becoming available. A review paper on the potential use of NIRS on dairy farms is available [171].
A second application of NIRS is as part of an integrated feed management system. In this system, a NIRS unit is installed in the front-end bucket used to load silage from bunker silos. This gives a real-time forage DM value that is used to adjust the quantity of wet silage added to the mixer wagon to maintain a constant amount of silage DM in the mix. A trial was conducted on a commercial dairy herd comparing weekly ingredient DM adjustments (control) compared with a treatment group with ingredient DM adjusted for each load of feed mixed [172]. Samples of the TMR and feed refusals were taken weekly for feed analysis. Cows were milked three times per day, while the TMR was fed twice a day. Pens were balanced by milk production and days in milk. Analyzed TMR’s were similar for DM, CP, NDF, starch and ash. Fat content was significantly higher in the control TMR (4.7 vs. 4.4%). There were no significant differences in DMI, milk production, 3.5% FCM, milk fat and protein yield and feed efficiency. Milk production averaged 52.8 kg/day for cows on this trial. The authors indicated that this herd had an excellent feed management program and that the results of using the NIRS system could be different in a herd with a feeding program with more variability. The NIRS based system did a respectable job of detecting changes in forage DM and adjusting the quantity of forage added to maintain the amount of forage DM in the diet.
A second study used seven Italian dairy herds [173]. All herds had a feeding system with the NIRS unit on the TMR wagon. All herds were fed a TMR once per day. This was a crossover trial consisting of two consecutive periods of 14 weeks each. The DM content of silages was determined daily in both periods. The feeding system was switched on/off and off/on between the two periods in each herd. In one period, no adjustment on the quantity of silage added to the mixer wagon was made. In the other period, the quantity of silage added to the mixer wagon was adjusted using the daily DM value. There were no significant differences in diet NDF and starch between the periods. No differences in milk yield or the percentage of milk fat and protein were detected. The variability in the TMR for nutrient content and DM was lower when the NIRS-based feeding system was used. If only the data from the last week of the period when the NIRS-based feeding system was there is considered, then there was an increase of 2.4% in milk production and a 1.3% decrease in the diet DM fed. There was also about a 5% decrease in feed cost per kg of milk.
14. Conclusions
The dairy industry has already made significant strides in improving milk production while lowering its impact on the environment. Milk yield in the United States increased from 2074 kg/year in 1944 to 9193 in 2007 [118]. The carbon footprint to produce 1 billion kg of milk decreased by 37% during this same time. An updated analysis reported that milk yield had increased to 10,406 kg/year in the United States as of 2017 [119]. Greenhouse gas emissions per 1 million metric tons (MMT) of energy-corrected milk in 2017 were 80.8% of 2007. During this time, the amount of land required to produce 1 MMT of milk in 2017 was 79.2% of the land needed and 69.5% of the water. The amount of feed needed in 2017 was 82.7% of that needed in 2007.
A report characterized changes in the California dairy industry between 1964 and 2014 [174]. Milk production per cow increased from 4850 to 10,600 kg/cow/year. Production of 1 kg of ECM resulted in emission of 2.11 kg of CO2 equivalents in 1964 compared with 1.12–1.16 in 2014. This is a 45 to 47% decrease. Methane emissions were 54–56% lower in 2014. Water use was 88–90% lower in 2014 versus 1964. Land required for crop production decreased by 89–89% during the 50-year period. A key factor in reducing the land required for crop growth was the increase in crop yields per hectare.
The results of the on-farm trials reported in this paper have consistently found that decreases in nutrient excretion into the environment can be made while maintaining or improving milk production. Feed cost is usually lower, and income over purchased feed cost is higher when diets are adjusted to lower nutrient excretion and improve efficiency of nutrient use. It is important to point out that most of the diet adjustments made in these trials did not consider amino acid balance. Balancing for amino acids should provide the ability to further lower diet CP. In the on-farm trials reported, diet CP was reduced to 5 to 22% with no negative impact on milk production. MUN was 2–3 units lower in trials where it was measured as diet CP decreased. The efficiency of nitrogen use increased by 2 to 3 units as diet CP decreased. Diet P was lowered to meet requirements with no adverse effects on milk production or reproduction. A key factor in conducting these on-farm trials was the active participation of the herd nutritionist. Being involved gave them more confidence to adjust diets by lowering CP and P. One result was that these nutritionists implemented these diet adjustments in other herds that they worked with.
There are additional opportunities for further diet and management changes to further reduce nutrient excretion and increase the efficiency of nutrient use. There may also be a role for artificial intelligence in identifying potential technologies that could be implemented [175,176]. Increased use of robotic feeding systems is one example that may be advantageous in terms of labor efficiency and precision feeding. A key principle is to reduce variation in the forage and feeding program.
Improvement of models for diet formulation and the herd size (herds larger than 500 cows were 2 to 5 times more likely to adopt precision technologies) will assist in improving efficiency of nutrient use and decreasing nutrients provided above requirements [149,177,178,179,180,181,182,183]. The increased use of amino acid balancing is one area that can be expanded [141,180]. Schwab [141] provided some guidelines for balancing diets for amino acids. The starting point is to provide a blend of rumen-fermentable carbohydrates and physically effective fiber in combination with adequate RDP to maximize microbial protein production. The next step is to use high-lysine protein supplements to meet the lysine requirement. These are often high in rumen-undegradable protein due to heat treatment. The next step is using a rumen-protected methionine source. In the future, there may be machine learning or artificial neural network approaches to diet formulation [149,176].
Sustainability is an important topic regarding the future of the dairy industry [181,184,185,186,187,188,189]. Economic, environmental, and societal concerns are the three common terms used to describe sustainability; however, it has been suggested that animal well-being and health should be added [187]. Precision feed management has a significant role in determining sustainability of a dairy farm. A survey of 171 Italian dairy farms feeding total mixed rations was done to examine relationships between sustainability and milk production [181]. Diet global warming potential (GWP) was calculated for each farm as kg of CO2 equivalents. The average GWP was 13.7 with a standard deviation of 3.71. A GWP of ≥27 was determined in 8.7% of the herds while 28% of the farms had a GWP < 11. A simulation study was done to assess the impact of altering dairy diets on greenhouse gas emissions [190,191]. Carbon footprint was reduced by 20 to 26% when feed, cropping and manure management BMPs were used.
The dairy industry faces several challenges in the future that will impact the ability to further reduce nutrient excretion and emissions to the environment. One of these is the potential impact of climate change on crops and animals [178,179]. Crop yields are projected to decrease in many crops grown for animal feed. Heat stress can have both short- and long-term impacts on animal health and productivity. Drought, water availability, public perception of animal agriculture, labor shortage, the role of robotic milking and feeding systems and economics all will impact the future of the dairy industry. A major factor is national and state regulations. There are several countries that are imposing regulations for N, P, ammonia, and methane. Some of these will potentially have a significant negative impact on the dairy industry. In most cases, these changes in regulations are made without input from the dairy industry. The dairy industry needs to be proactive and bring science-based information into the regulatory discussion. In the United States, the National Milk Producers Federation and the Innovation Center for United States Dairy are both highly active in programs using science-based information to the nutrient management and sustainability discussion.
Author Contributions
Writing—original draft preparation, L.E.C.; writing—review and editing, L.E.C. and R.F. All authors have read and agreed to the published version of the manuscript.
Funding
This research received no external funding.
Institutional Review Board Statement
Not applicable.
Data Availability Statement
Not applicable.
Conflicts of Interest
The authors declare no conflict of interest.
References
- United Nations Department of Economic and Social Affairs, Population Division. World Population Prospects 2022: Summary of Results. UN DESA/POP/2022/TR/No.3. 2022. [Google Scholar]
- IFCN Dairy Outlook 2030. Available online: https://ifcndairy.org (accessed on 15 March 2023).
- Luna, P.G.; Mauricio-Iglesias, M.; Flysjo, A.; Hospido, A. Analysing the interaction between the dairy sector and climate change from a life cycle perspective: A review. Trends Food Sci. Technol. 2022, 126, 168–179. [Google Scholar] [CrossRef]
- Pimentel, D.; Pimentel, M. Sustainability of meat-based and plant-based diets and the environment. Am. J. Clin. Nutr. 2003, 78, 660S–663S. [Google Scholar] [CrossRef]
- Ertl, P.; Knaus, W.; Zollitsch, W. An approach to including protein quality when assessing the net contribution of livestock to human food supply. Animal 2016, 10, 1883–1889. [Google Scholar] [CrossRef] [PubMed]
- Patel, M.; Sonensson, U.; Hessle, A. Upgrading plant amino acids through cattle to improve the nutritional value for humans: Effects of different production systems. Animal 2017, 11, 519–528. [Google Scholar] [CrossRef] [PubMed]
- Vieux, F.; Remond, D.; Peyraud, J.L.; Darmon, N. Approximately half of total protein intake by adults must be animal-based to meet nonprotein, nutrient-based recommendations, with variations due to age and sex. J. Nutr. 2022, 152, 2514–2525. [Google Scholar] [CrossRef] [PubMed]
- Chungchunlam, S.M.S.; Moughan, P.J.; Garrick, D.P.; Drewnowski, A. Animal-Sourced Foods Are Required for minimum-Cost Nutritionally Adequate Food Patterns for the United States. Nat. Food 2020, 1, 376–381. Available online: www.nature.com/natfood (accessed on 15 March 2023). [CrossRef]
- Givens, D.I. MILK Symposium review: The importance of milk and dairy foods in the diets of infants, adolescents, pregnant women, adults, and the elderly. J. Dairy Sci. 2020, 103, 9681–9699. [Google Scholar] [CrossRef]
- Banda, L.J.; Tanganyika, J. Livestock provide more than food in smallholder production systems of developing countries. Anim. Front. 2021, 11, 7–14. [Google Scholar] [CrossRef]
- Beegle, D. Nutrient management and Chesapeake Bay. J. Contemp. Water Res. Educ. 2013, 151, 3–8. [Google Scholar] [CrossRef]
- Maltz, E.; Barbosa, L.F.; Bueno, P.; Scagion, L.; Kanlyamattam, K.; Greco, L.F.; De Vries, A.; Santos, J.E.P. Effect of feeding according to energy balance on performance, nutrient excretion, and feeding behavior of early lactation dairy cows. J. Dairy Sci. 2013, 96, 5249–5266. [Google Scholar] [CrossRef]
- Bach, A. Precision feeding to increase efficiency for milk production. WCDS Adv. Dairy Technol. 2014, 26, 177–189. [Google Scholar]
- Jago, J.; Eastwood, C.; Kerrisk, K.; Yule, I. Precision dairy farming in Australasia: Adoption, risks and opportunities. Anim. Prod. Sci. 2013, 53, 907–916. [Google Scholar] [CrossRef]
- Knowlton, K.F.; Ray, P.P. Water quality concerns associated with dairy farms. In Large Dairy Herd Management, 3rd ed.; Beede, D.K., Ed.; ADSA Foundation: Champaign, IL, USA, 2017. [Google Scholar] [CrossRef]
- Beegle, D. Nutrient Management Planning: An Overview. 2014. Available online: https://extension.psu.edu/nutrient-management-planning-an-overview (accessed on 15 March 2023).
- Harrison, J.; White, R.; Ishler, V.; Erickson, G.; Sutton, A.; Applegate, T.; Richert, B.; Nennich, T.; Koelsch, R.; Burns, R.; et al. Case study: Implementation of feed management as part of whole-farm nutrient management. Prof. Anim. Sci. 2012, 28, 364–369. [Google Scholar] [CrossRef]
- Loosli, J.K.; Williams, H.H.; Thomas, W.E.; Ferris, F.H.; Maynard, L.A. Synthesis of amino acids in the rumen. Science 1949, 110, 144–145. [Google Scholar] [CrossRef] [PubMed]
- Lapierre, H.; Lobley, G.E. Nitrogen recycling in the ruminant: A review. J. Dairy Sci. 2001, 84, E223–E236. [Google Scholar] [CrossRef]
- Reynolds, C.K.; Kristensen, N.B. Nitrogen recycling through the gut and the nitrogen economy of ruminants: An asynchronous symbiosis. J. Anim. Sci. 2008, 86, E293–E305. [Google Scholar] [CrossRef]
- Recktenwald, E.B.; Ross, D.A.; Fessenden, S.W.; Walt, C.J.; Van Amburgh, M.E. Urea-N recycling in lactating dairy cows fed diets with 2 different levels of dietary crude protein and starch with or without monensin. J. Dairy Sci. 2014, 97, 1611–1622. [Google Scholar] [CrossRef]
- Broderick, G.A. Review: Optimizing ruminant conversion of feed protein to human food protein. Animal 2018, 12, 1722–1734. [Google Scholar] [CrossRef] [PubMed]
- Swensson, C.; Lindmark-Mansson, H.; Smedman, A.; Henriksson, M.; Edman, A.K.M. Protein efficiency in intensive dairy production: A Swedish example. J. Sci. Food Agric. 2017, 97, 4890–4897. [Google Scholar] [CrossRef]
- Karlsson, J.; Sporndly, R.; Lindberg, M.; Holtenius, K. Replacing human-edible feed ingredients with by-products increases net food production efficiency in dairy cows. J. Dairy Sci. 2018, 101, 7146–7155. [Google Scholar] [CrossRef]
- Nadeau, E.; Englund, J.E.; Gustafsson, A.H. Nitrogen efficiency of dairy cows as affected by diet and milk yield. Livestock Sci. 2007, 111, 45–56. [Google Scholar] [CrossRef]
- Powell, J.M.; Rotz, C.A. Measures of nitrogen use efficiency and nitrogen loss from dairy production systems. J. Environ. Qual. 2015, 44, 336–344. [Google Scholar] [CrossRef] [PubMed]
- Huhtanen, P.; Hristov, A.N. A meta-analysis of the effects of dietary protein concentration and degradability on milk protein yield and milk N efficiency in dairy cows. J. Dairy Sci. 2009, 92, 3222–3232. [Google Scholar] [CrossRef] [PubMed]
- Chase, L.E. Estimated Nitrogen Excretion in 46 Commercial Dairy Herds in New York. 2004. Available online: http://www.dairyn.cornell.edu/pages/40dairy/410utilization/4216excretion.shtml (accessed on 15 March 2023).
- Vyas, D.; Amaro, F. A survey of N efficiency in dairy farms in the USA. In Proceedings of the Florida Ruminant Nutrition Symposium, Gainsville, FL, USA, 20–22 February 2023. [Google Scholar]
- Fadul-Pacheco, L.; Pellerin, D.; Chouinard, P.Y.; Wattiaux, M.A.; Duplessis, M.; Charbonneau, E. Nitrogen efficiency of eastern Canadian dairy herds: Effect on production performance and farm profitability. J. Dairy Sci. 2017, 100, 6592–6601. [Google Scholar] [CrossRef] [PubMed]
- Olmos Colmenero, J.J.; Broderick, G.A. Effect of dietary crude protein concentration on milk production and nitrogen utilization in lactating dairy cows. J. Dairy Sci. 2006, 89, 1704–1712. [Google Scholar] [CrossRef]
- Burgos, S.A.; Fadel, J.G.; DePeters, E.J. Prediction of ammonia emission from dairy cattle manure based on milk urea nitrogen: Relation of milk urea nitrogen to urine urea nitrogen excretion. J. Dairy Sci. 2007, 90, 5499–5508. [Google Scholar] [CrossRef]
- Gonda, H.L.; Lindberg, J.E. Evaluation of dietary nitrogen utilization in dairy cows based on urea concentrations in blood, urine, and milk, and on urinary concentration of purine derivatives. Acta. Agric. Scand. Sect. A 1994, 44, 236–245. [Google Scholar] [CrossRef]
- Edouard, N.; Hassouna, M.; Robin, P.; Faverdin, P. Low degradable protein supply to increase nitrogen efficiency in lactating dairy cows and reduce environmental impacts at barn level. Animal 2015, 10, 212–220. [Google Scholar] [CrossRef]
- Katongole, C.B.; Yan, T. Effect of varying dietary crude protein level on feed intake, nutrient digestibility, milk production, and nitrogen use efficiency by lactating Holstein-Friesian cows. Animals 2020, 10, 2439. [Google Scholar] [CrossRef]
- Castillo, A.R.; Kebreab, E.; Beever, D.E.; France, J. A review of efficiency of nitrogen utilisation in lactating dairy cows and its relationship with environmental pollution. J. Anim. Feed Sci. 2000, 9, 1–32. [Google Scholar] [CrossRef]
- Bach, A.; Calsamiglia, S.; Stern, M.D. Nitrogen metabolism in the rumen. J. Dairy Sci. 2005, 88, E9–E21. [Google Scholar] [CrossRef] [PubMed]
- Necula, D.C.; Balta, I.; Corcionivoschi, N.; Stef, L. Nutritional and genetical factors influencing nitrogen metabolism and excretion in dairy cows: A review. Anim. Sci. Biotechnol. 2021, 54, 31–38. [Google Scholar]
- Schwab, C.G.; Broderick, G.A. A 100-year review: Protein and amino acid nutrition in dairy cows. J. Dairy Sci. 2017, 100, 10094–10112. [Google Scholar] [CrossRef] [PubMed]
- Kim, J.E.; Lee, H.G. Amino acids supplementation for the milk and milk protein production of dairy cows. Animals 2021, 11, 2118. [Google Scholar] [CrossRef]
- Maynard, L.A. Animal Nutrition, 2nd ed.; McGraw-Hill Book Company, Inc.: New York, NY, USA, 1947. [Google Scholar]
- Clark, J.H. Lactational responses to postruminal administration of protein and amino acids. J. Dairy Sci. 1975, 58, 1178–1197. [Google Scholar] [CrossRef]
- Rogers, J.A.; Pierce-Sandner, S.B.; Papas, A.M.; Polan, C.E.; Sniffen, C.J.; Muscato, T.V.; Staples, C.R.; Clark, J.H. Production responses of dairy cows fed various amounts of rumen-protected methionine and lysine. J. Dairy Sci. 1989, 72, 1800–1817. [Google Scholar] [CrossRef]
- Polan, C.E.; Cummins, K.A.; Sniffen, C.J.; Muscato, T.V.; Vicini, J.L.; Crooker, B.A.; Clark, J.H.; Johnson, D.G.; Otterby, D.E.; Guillaume, B.; et al. Responses of dairy cows to supplemental rumen-protected forms of methionine and lysine. J. Dairy Sci. 1991, 74, 2997–3013. [Google Scholar] [CrossRef] [PubMed]
- Patton, R.A. Effect of rumen-protected methionine on feed intake, milk production, true milk protein concentration, and true milk protein yield, and the factors that influence these effects: A meta-analysis. J. Dairy Sci. 2010, 93, 2105–2118. [Google Scholar] [CrossRef] [PubMed]
- Zanton, G.I.; Bowman, G.R.; Vazquez-Anon, M.; Rode, L.M. Meta-analysis of lactation performance in dairy cows receiving supplemental dietary methionine sources or postruminal infusion of methionine. J. Dairy Sci. 2014, 97, 7085–7101. [Google Scholar] [CrossRef]
- Wei, C.W.; He, T.; Wan, X.; Liu, S.; Dong, Y.; Qu, Y. Meta-analysis of rumen-protected methionine in milk production and composition of dairy cows. Animals 2022, 12, 1505. [Google Scholar] [CrossRef]
- Cardoso, F.C.; Kalscheur, K.F.; Drackley, J.K. Symposium review: Nutrition strategies for improved health, production, and fertility during the transition period. J. Dairy Sci. 2020, 103, 5684–5693. [Google Scholar] [CrossRef]
- Guadagnin, A.; Fehlberg, L.; Thomas, B.; Sugimoto, Y.; Shinzato, I.; Cardoso, F. Effect of feeding rumen-protected lysine through the transition period on postpartum uterine health of dairy cows. J. Dairy Sci. 2022, 105, 7805–7819. [Google Scholar] [CrossRef] [PubMed]
- Pate, R.T.; Luchini, D.; Murphy, M.R.; Cardoso, F.C. Effects of rumen-protected methionine on lactation performance and physiological variables during a heat stress challenge in lactating Holstein cows. J. Dairy Sci. 2020, 103, 2800–2813. [Google Scholar] [CrossRef]
- Toledo, M.Z.; Baez, G.M.; Garcia-Guerra, A.; Lobos, N.E.; Guenther, J.N.; Trevisol, E.; Luchini, D.; Shaver, R.D.; Wiltbank, M.C. Effect of feeding rumen-protected methionine on production and reproductive performance of dairy cows. PLoS ONE 2017, 12, e0189117. [Google Scholar] [CrossRef] [PubMed]
- Wattiaux, M.A.; Ranathunga, S.D. Milk Urea Nitrogen as a Tool to Assess Efficiency of Nitrogen Utilization in Dairy Cows. In Proceedings of the Four-State Dairy Nutrition and Management Conference, Dubuque, Iowa, 15–16 June 2016; Available online: https://store.extension.iastate.edu/product/14613 (accessed on 4 May 2023).
- Nousiainen, J.; Shingfield, K.J.; Huhtanen, P. Evaluation of milk urea nitrogen as a diagnostic of protein feeding. J. Dairy Sci. 2004, 87, 386–398. [Google Scholar] [CrossRef] [PubMed]
- Guilinski, P.; Salamonczyk, E.; Mlynek, K. Improving nitrogen use efficiency of dairy cows relative to urea in milk—A review. Anim. Sci. Pap. Rep. 2016, 34, 5–24. [Google Scholar]
- Burgos, S.A.; Embertson, N.M.; Zhao, Y.; Mitloehner, F.M.; DePeters, E.J.; Fadel, J.G. Prediction of ammonia emission from dairy cattle manure based on milk urea nitrogen: Relation of milk urea nitrogen to ammonia emissions. J. Dairy Sci. 2010, 93, 2377–2386. [Google Scholar] [CrossRef]
- Spek, J.W.; Dijkstra, J.; Van Duinkerkem, G.; Bannink, A. A review of factors influencing milk urea concentration and its relationship with urinary urea excretion in lactating dairy cattle. J. Agric. Sci. 2013, 151, 407–423. [Google Scholar] [CrossRef]
- Powell, J.M.; Wattiaux, M.A.; Broderick, G.A. Short communication: Evaluation of milk urea nitrogen as a management tool to reduce ammonia emissions from dairy farms. J. Dairy Sci. 2011, 94, 4690–4694. [Google Scholar] [CrossRef]
- Hristov, A.N. Technical note: Contribution of ammonia emitted from livestock to atmospheric fine particulate matter (PM2.5) in the United States. J. Dairy Sci. 2011, 94, 3130–3136. [Google Scholar] [CrossRef]
- Frank, B.; Swensson, C. Relationship between content of crude protein in rations for dairy cows and milk yield, concentration of urea in milk and ammonia emissions. J. Dairy Sci. 2002, 85, 1829–1838. [Google Scholar] [CrossRef]
- Frank, B.; Persson, M.; Gustafsson, G. Feeding dairy cows to decrease ammonia emission. Livestock Prod. Sci. 2002, 76, 171–177. [Google Scholar] [CrossRef]
- Swensson, C. Relationship between content of crude protein in rations for dairy cows, N in urine snd ammonia release. Livestock Prod. Sci. 2003, 84, 125–133. [Google Scholar] [CrossRef]
- Kebreab, E.; France, J.; Mills, J.A.N.; Allison, R.; Dijkstra, J. A dynamic model of N metabolism in the lactating dairy cow and an assessment of impact of N excretion on the environment. J. Anim. Sci. 2002, 80, 248–259. [Google Scholar] [CrossRef]
- Bougouin, A.; Leytem, A.; Dijkstra, J.; Dungan, R.S.; Kebreab, E. Nutritional and environmental effects on ammonia emissions from dairy cattle housing: A meta-analysis. J. Environ. Qual. 2016, 45, 1123–1132. [Google Scholar] [CrossRef] [PubMed]
- Lee, C.; Hristov, A.N.; Dell, C.J.; Feyereisen, G.W.; Kaye, J.; Beegle, D. Effect of dietary protein concentration on ammonia and greenhouse gas emitting potential of dairy manure. J. Dairy Sci. 2012, 95, 1930–1941. [Google Scholar] [CrossRef] [PubMed]
- van der Stelt, B.; van Vliet, C.J.; Reijs, J.W.; Temminghoff, J.M.; van Riemsdijk, W.H. Effects of dietary protein and energy levels on cow manure excretion and ammonia volatilization. J. Dairy Sci. 2008, 91, 4811–4821. [Google Scholar] [CrossRef]
- Hristov, A.N.; Ropp, J.K.; Grandson, K.L.; Abedi, S.; Etter, R.P.; Melgar, A.; Foley, A.E. Effect of carbohydrate source on ammonia utilization in lactating dairy cows. J. Anim. Sci. 2005, 83, 408–421. [Google Scholar] [CrossRef]
- Smits, M.C.J.; Monteny, G.J.; van Duinkerken, G. Effect of nutrition and management factors on ammonia emission from dairy cow herds: Models and field observations. Livestock Prod. Sci. 2003, 84, 113–123. [Google Scholar] [CrossRef]
- Aguerre, M.J.; Wattiaux, M.A.; Hunt, T.; Larget, B.R. Effect of dietary crude protein on ammonia-N emission measured by herd nitrogen mass balance in a freestall dairy barn managed under farm-like conditions. Animal 2010, 4, 1390–1400. [Google Scholar] [CrossRef]
- Edouard, N.; Charpiot, A.Z.; Robin, P.; Lorinquer, E.; Dolle, J.B.; Faverdin, P. Influence of diet and manure management on ammonia and greenhouse gas emissions from dairy barns. Animal 2019, 13, 2903–2912. [Google Scholar] [CrossRef] [PubMed]
- Hristov, A.N.; Hanigan, M.; Cole, A.; Todd, R.; McAllister, T.A.; Ndegwa, P.M.; Rotz, A. Review: Ammonia emissions from dairy farms and beef feedlots. Can. J. Anim. Sci. 2011, 91, 1–35. [Google Scholar] [CrossRef]
- Chapula-Lardy, L.; Fiorini, J.; Toth, J.; Dou, Z. Phosphorus concentration and solubility in dairy feces: Variability and affecting factors. J. Dairy Sci. 2004, 87, 4334–4341. [Google Scholar] [CrossRef]
- Satter, L.D.; Klopfenstein, T.J.; Erickson, G.E.; Powell, J.M. Phosphorus and Dairy/Beef Nutrition; Faculty Papers and Publications. 549; University of Nebraska: Lincoln, NE, USA, 2005; Available online: https://digitalcommons.unl.edu/animalscifaculty/549 (accessed on 15 March 2023).
- Valk, H.; Sebek, L.B.J. Influence of long-term feeding of limited amounts of phosphorus on dry matter intake, milk production, and body weight of dairy cows. J. Dairy Sci. 1999, 82, 2157–2163. [Google Scholar] [CrossRef]
- Valk, H.; Sebek, L.B.J.; Beynen, A.C. Influence of phosphorus intake on excretion and blood plasma and saliva concentrations of phosphorus in dairy cows. J. Dairy Sci. 2002, 85, 2642–2649. [Google Scholar] [CrossRef]
- Wu, Z.; Satter, L.D.; Sojo, R. Milk production, reproductive performance, and fecal excretion of phosphorus by dairy cows fed three amounts of phosphorus. J. Dairy Sci. 2000, 83, 1028–1041. [Google Scholar] [CrossRef]
- Wu, Z.; Satter, L.D. Milk production and reproductive performance of dairy cows fed two concentrations of phosphorus for two years. J. Dairy Sci. 2000, 83, 1052–1063. [Google Scholar] [CrossRef] [PubMed]
- Wu, Z.; Satter, L.D.; Blohowiak, A.J.; Stauffacher, R.H.; Wilson, J.H. Milk production estimated phosphorus excretion, and bone characteristics of dairy cows fed different amounts of phosphorus for two or three years. J. Dairy Sci. 2001, 84, 1738–1748. [Google Scholar] [CrossRef]
- Odongo, N.E.; McKnight, D.; Koekkoek, A.; Fisher, J.W.; Sharpe, P.; Kebreab, E.; France, J.; McBride, B.W. Long-term effects of feeding diets without mineral phosphorus supplementation on the performance and phosphorus excretion in high-yielding dairy cows. Can. J. Anim. Sci. 2007, 87, 639–646. [Google Scholar] [CrossRef]
- Ferris, C.P.; Patterson, D.C.; McCoy, M.A.; Kilpatrick, D.J. Effect of offering dairy cows diets differing in phosphorus concentration over four successive lactations: 1. Food intake, milk production, tissue changes and blood metabolites. Animal 2009, 4, 545–559. [Google Scholar] [CrossRef]
- Ferris, C.P.; McCoy, M.A.; Patterson, D.C.; Kilpatrick, D.J. Effect of offering dairy cows diets differing in phosphorus concentration over four successive lactations: 2. Health, fertility, bone phosphorus, reserves, and nutrient utilization. Animal 2009, 4, 560–571. [Google Scholar] [CrossRef] [PubMed]
- Lopez, H.; Kanitz, F.D.; Moreira, V.R.; Wiltbank, M.C.; Satter, L.D. Effect of dietary phosphorus on performance of lactating dairy cows: Milk production and cow health. J. Dairy Sci. 2004, 87, 139–145. [Google Scholar] [CrossRef]
- Lopez, H.; Kanitz, F.D.; Moreira, V.R.; Satter, L.D.; Wiltbank, M.C. Reproductive performance of dairy cows fed two concentrations of phosphorus. J. Dairy Sci. 2004, 87, 146–157. [Google Scholar] [CrossRef]
- Lopez, H.; Wu, Z.; Satter, L.D.; Wiltbank, M.C. Effect of dietary phosphorus concentration on estrous behavior of lactating dairy cows. Theriogenology 2004, 61, 437–445. [Google Scholar] [CrossRef]
- Tallam, S.K.; Ealy, A.D.; Bryan, K.A.; Wu, Z. Ovarian activity and reproductive performance of dairy cows fed different amounts of phosphorus. J. Dairy Sci. 2005, 88, 3609–3618. [Google Scholar] [CrossRef] [PubMed]
- Kebreab, E.; Odongo, N.E.; McBride, B.W.; Hanigan, M.D.; France, J. Phosphorus utilization and environmental and economic implications of reducing phosphorus pollution from Ontario dairy cows. J. Dairy Sci. 2008, 91, 241–246. [Google Scholar] [CrossRef]
- Chase, L.E.; Reed, K.F. Science and Industry Work to Improve Phosphorus Management on New York Dairy Farms; Animal Science Publication Series No. 253; Dept. of Animal Science, Cornell University: Ithaca, NY, USA, 2021; Available online: https://hdl.handle/net/1813/103767 (accessed on 15 March 2023).
- Darby, H.; Chase, L.E. Changes in Nitrogen and Phosphorus Excretion in Vermont dairy herds (1999–2019); University of Vermont Extension: Burlington, VT, USA, 2022. [Google Scholar]
- EPA. Inventory of U.D. Greenhouse Gas Emissions and Sinks. 1990–2020. U.S. Environmental Protection Agency. EPA 430-R=22-003. 2022. Available online: https://www.epa.gov/ghgemissions/draft-inventory-us-greenhouse-gas-emissions-and-sinks-1990-2020 (accessed on 4 May 2023).
- Broucek, J. Production of methane emissions from ruminant husbandry: A review. J. Environ. Prot. 2014, 5, 1482–1493. [Google Scholar] [CrossRef]
- Kriss, M. Quantitative relationship of the dry matter of the food consumed the heat production, the gaseous outgo, and the insensible loss of body weight of cattle. J. Agric. Sci. 1930, 40, 283–295. [Google Scholar]
- Bratzler, J.W.; Forbes, E.B. The estimation of methane production by cattle. J. Nutr. 1940, 19, 611–613. [Google Scholar] [CrossRef]
- Beauchemin, K.A.; Ungerfeld, E.M.; Adballa, A.L.; Alvarez, C.; Arndt, C.; Becquet, P.; Benchaar, C.; Berndt, A.; Mauricio, M.; McAllister, T.A.; et al. Invited review: Current enteric methane mitigation options. J. Dairy Sci. 2022, 105, 9297–9326. [Google Scholar] [CrossRef]
- Hristov, A.N.; Melgar, A.; Wasson, D.; Arndt, C. Symposium review: Effective nutritional strategies to mitigate enteric methane in dairy cattle. J. Dairy Sci. 2022, 105, 8543–8557. [Google Scholar] [CrossRef] [PubMed]
- Arndt, C.; Hristov, A.N.; Price, W.J.; McClelland, S.C.; Pelaez, A.M.; Cueva, S.F.; Oh, J.; Dijkstra, J.; Bannink, A.; Bayar, A.R.; et al. Full adoption of the most effective strategies to mitigate methane emissions by ruminants can help to meet the 1.5 °C target by 2030 but not 2050. Proc. Natl. Acad. Sci. USA 2022, 119, e2111294119. [Google Scholar] [CrossRef] [PubMed]
- Honan, M.; Feng, X.; Tricarico, J.M.; Kebreab, E. Feed additives as a strategic approach to reduce enteric methane production in cattle: Modes of action, effectiveness, and safety. Anim. Prod. Sci. 2022, 62, 1303–1317. [Google Scholar] [CrossRef]
- Seyedin, S.M.V.; Zeidi, A.; Chamanehpour, E.; Nasri, M.H.F.; Vargas-Bello=Perez, E. Methane emission: Strategies to reduce global warming in relation to animal husbandry units with emphasis on ruminants. Sustainability 2022, 14, 16987. [Google Scholar] [CrossRef]
- Kebreab, E.; Bannink, A.; Pressman, E.M.; Walker, N.; Karagiannis, A.; van Gastelen, S.; Dijkstra, J. A meta-analysis of the effects of 3-nitrooxyptropanol on methane production, yield, and intensity in dairy cattle. J. Dairy Sci. 2023, 106, 927–936. [Google Scholar] [CrossRef]
- Klausner, S.D.; Fox, D.G.; Rasmussen, C.N.; Pitt, R.E.; Tylutki, T.P.; Wright, P.E.; Chase, L.E.; Stone, W.C. Improving dairy farm sustainability, I: An approach to animal and crop nutrient management planning. J. Prod. Sci. 1998, 11, 225–233. [Google Scholar] [CrossRef]
- Hutson, J.L.; Pitt, R.E.; Koelsch, R.K.; Wagenet, R.J. Improving dairy farm sustainability II: Environmental losses and nutrient flows. J. Prod. Sci. 1998, 11, 233–239. [Google Scholar] [CrossRef]
- Fox, D.G.; Barry, M.C.; Pitt, R.E.; Roseler, D.K.; Stone, W.C. Application of the Cornell net carbohydrate and protein model for cattle consuming forages. J. Anim. Sci. 1995, 73, 267–277. [Google Scholar] [CrossRef]
- Chen, Y.; Harrison, J.H.; Ndegwa, P.; Wilks, D.; VanWieringen, L.; Chalupa, W.; Sun, F. Case study: Effect of strategic ration balancing on the efficiency of milk protein production and environmental impact of dairy cows in a commercial herd. Prof. Anim. Sci. 2016, 32, 115–133. [Google Scholar] [CrossRef]
- Agricultural Modeling and Training Systems. 2015. Available online: https://wwwagmodelsystems.com (accessed on 15 March 2023).
- Higgs, R.J.; Chase, L.E.; Van Amburgh, M.E. Case study: Application of the Cornell Net Carbohydrate and Protein System as a tool to improve nitrogen utilization in commercial dairy herds. Prof. Anim. Sci. 2012, 28, 370–378. [Google Scholar] [CrossRef]
- Tylutki, T.P.; Fox, D.G.; Durbal, V.M.; Tedeschi, L.O.; Russell, J.B.; Van Amburgh, M.E.; Overton, T.R.; Chase, L.E.; and Pell, A.N. Cornell Net Carbohydrate and Protein System: A model for precision feeding of dairy cattle. Anim. Feed Sci. Tech. 2008, 143, 174–202. [Google Scholar] [CrossRef]
- Tylutki, T.P.; Fox, D.G.; McMahon, M. Implementation of nutrient management planning on a dairy farm. Prof. Anim. Sci. 2004, 20, 58–65. [Google Scholar] [CrossRef]
- Fox, D.G.; Tedeschi, L.O.; Tylutki, T.P.; Russell, J.B.; Van Amburgh, M.E.; Chase, L.E.; Pell, A.N.; Overton, T.R. The Cornell Net Carbohydrate and Protein System model for evaluating herd nutrition and nutrient excretion. Anim. Feed Sci. Tech. 2004, 112, 29–78. [Google Scholar] [CrossRef]
- Hristov, A.N.; Heyler, K.; Schurman, E.; Griswold, K.; Topper, P.; Hile, M.; Ishler, V.; Wheeler, E.F.; Dinh, S. Case study: Reducing dietary protein decreased the ammonia emitting potential of manure from commercial dairy farms. Prof. Anim. Sci. 2015, 31, 68–79. [Google Scholar] [CrossRef]
- Weeks, H.L.; Frederick, T.W.; Hagan, L.M.; Heyler, K.; Oh, J.; Hristov, A.N. Case study: Farm-level evaluation of implementing nitrogen and phosphorus feeding best management practices on Pennsylvania dairy farms. Prof. Anim. Sci. 2015, 31, 473–483. [Google Scholar] [CrossRef]
- Cerosaletti, P.; Dewing, D. 2017 WAP Precision Feed Management Program Nutrient and Economic Impact Report; Delaware County Cooperative Extension: Hamden, NY, USA, 2018. [Google Scholar]
- Lucas, A.W.; Romack, J.; Dewing, D.; Cerosaletti, P. 2020 NYC WAP Precision Feed Management Program Nutrient and Economic Impact Report; Delaware County Cooperative Extension: Hamden, NY, USA, 2021. [Google Scholar]
- Van Amburgh, M.E.; Russomanno, K.L.; Higgs, R.A.; Chase, L.E. Invited review: Modifications to the Cornell Net Carbohydrate and Protein System related to environmental issues- Capability to evaluate nitrogen and phosphorus excretion and enteric carbon dioxide and methane emissions at the animal level. Appl. Anim. Sci. 2019, 35, 101–113. [Google Scholar] [CrossRef]
- Van Amburgh, M.E.; Collan-Saenz, E.A.; Higgs, R.J.; Ross, D.A.; Recktenwald, E.B.; Raffrenato, E.; Chase, L.E.; Overton, T.R.; Mills, J.K.; Foskolos, A. The Cornell Net Carbohydrate and Protein System: Updates to the model and evaluation of version 6.5. J. Dairy Sci. 2015, 98, 6361–6380. [Google Scholar] [CrossRef] [PubMed]
- Weber, G.; Jokela, B. Vermont Dairy Sustainability Project Final Report Foe LNE01-151; University of Vermont: Burlington, VT, USA, 2007; Available online: https://projects.sare.org/sare_project/lne01-151 (accessed on 2 May 2023).
- Schwab, C.G.; Ordway, R.S. Balancing diets for amino acids: Implications on production efficiency and feed cost. In Proceedings of the Penn State Dairy Cattle Nutrition Workshop, Grantville, PA, USA, 2004; pp. 1–6. [Google Scholar]
- Cela, S.; Ketterings, Q.M.; Soberon, M.; Rasmussen, C.; Czymmek, K.J. Upper Susquehanna watershed and New York State improvements in nitrogen and phosphorus mass balances of dairy farms. J. Soil Water Conserv. 2017, 72, 1–11. [Google Scholar] [CrossRef]
- Soberon, M.A.; Cela, S.; Ketterings, Q.M.; Rasmussen, C.N.; Czymmek, K.J. Changes in nutrient mass balances over time and related drivers for 54 New York State dairy farms. J. Dairy Sci. 2015, 98, 5313–5326. [Google Scholar] [CrossRef]
- Thoma, G.; Popp, J.; Nutter, D.; Shonnard, D.; Ulrich, R.; Matlock, M.; Kim, D.S.; Neiderman, Z.; Kemper, N.; East, C.; et al. Greenhouse gas emissions from milk production and consumption in the United States: A cradle-to-grave life cycle assessment circa 2008. Int. Dairy J. 2013, 31, S3–S14. [Google Scholar] [CrossRef]
- Capper, J.L.; Cady, R.A.; Bauman, D.E. The environmental impact of dairy production: 1944 compared with 2007. J. Anim. Sci. 2009, 87, 2160–2167. [Google Scholar] [CrossRef] [PubMed]
- Capper, J.L.; Cady, R.A. The effects of improved performance in the U.S. dairy cattle industry on environmental impacts between 2007 and 2017. J. Anim. Sci. 2020, 98, 1–14. [Google Scholar] [CrossRef]
- Hospers, J.; Kuling, L.; Modernel, P.; Lesschen, J.P.; Blonk, H.; Batlle-Bayer van Straalen, W.; Dekker, S. The evolution of the carbon footprint of Dutch raw milk production between 1990 and 2019. J. Cleaner Prod. 2022, 380, 134863. [Google Scholar] [CrossRef]
- Jayasundara, S.; Wagner-Riddle, C. Greenhouse gas emissions intensity of Ontario milk production in 2011 compared with 1991. Can. J. Anim. Sci. 2014, 94, 155–173. [Google Scholar] [CrossRef]
- Kristensen, T.; Aaes, O.; Weisbjerg, M.R. Production and environmental impact of dairy cattle production in Denmark 1900–2010. Livestock Sci. 2015, 178, 306–312. [Google Scholar] [CrossRef]
- Mazzetto, A.M.; Falconer, S.; Ledgard, S. Mapping the carbon footprint of milk production from cattle: A systematic review. J. Dairy Sci. 2022, 105, 9713–9725. [Google Scholar] [CrossRef] [PubMed]
- Henriksson, M.; Flysjo, A.; Cederberg, C.; Swensson, C. Variation in carbon footprint of milk due to management differences between Swedish dairy farms. Animal 2011, 5, 1474–1484. [Google Scholar] [CrossRef]
- Veltman, K.; Rotz, C.A.; Chase, L.; Cooper, J.; Ingraham, P.; Izaurralde, R.C.; Jones, C.D.; Gaillard, R.; Larson, R.A.; Ruark, M.; et al. A quantitative assessment of Beneficial Management Practices to reduce carbon footprint and reactive nitrogen footprints and phosphorus losses on dairy farms in the US Great Lakes region. Agric. Systems. 2018, 166, 10–25. [Google Scholar] [CrossRef]
- Chase, L.E.; Reed, K. Science and Industry Work to Improve Nitrogen Management on New York Dairy Farms; Animal Science Pub-lication Series No. 255; Dept. of Animal Science, Cornell University: Ithaca, NY, USA, 2021; Available online: http://hdl.handle.net/1813/103766 (accessed on 4 May 2023).
- Van Laar, H.; (Wageningen Livestock Research, Wageningen, The Netherlands). Personal communication, 2022.
- Van Bruggen, C.; Gosseling, M. Dierlijke Mest en Mineralen 1990–2018. 2019. CBS. Available online: https://www.cbs.nl/-/media/_pdf/2019/49/dierlijkemestenmineralen2018.pdf (accessed on 2 May 2023).
- Sullivan, C.; (Univ. of Queensland, St. Lucia, Australia). Reducing Nitrogen Excretion from Dairy Herds through Dietary Manipulation. Personal communication, 2022. [Google Scholar]
- Chowdhury, M.R.; Wilkinson, R.G.; Sinclair, L.A. Feeding lower-protein diets based on red clover and grass or alfalfa and corn silage does not affect milk production but improves nitrogen use efficiency in dairy cows. J. Dairy Sci. 2023, 106, 1773–1789. [Google Scholar] [CrossRef]
- Hanigan, M.D.; Arriola Apelo, S.I.; Aguilar, M. Feeding low crude protein diets to improve efficiency of nitrogen use. In Proceedings of the Western Dairy Management Conference, Reno, NV, USA, 6–8 March 2013; pp. 224–237. [Google Scholar]
- Hristov, A.N.; Giallongo, F. Feeding protein to dairy cows—What should be our target? In Proceedings of the 23rd Tri-State Dairy Nutrition Conference, Fort Wayne, IN, USA, 14–16 April 2014; pp. 75–84. [Google Scholar]
- Chase, L.E. Feeding low crude protein rations to dairy cows—Opportunities and challenges. In Proceedings of the Cornell Nutrition Conference for Feed Manufacturers, East Syracuse, NY, USA, 18–20 October 2011; Cornell University: Ithaca, NY, USA, 2011. [Google Scholar]
- Sinclair, K.D.; Garnsworthy, P.C.; Mann, G.E.; Sinclair, L.A. Reducing dietary protein in dairy cow diets: Implications for nitrogen utilization, milk production, welfare, and fertility. Animal 2013, 8, 262–274. [Google Scholar] [CrossRef]
- Stojanovic, B.; Grubic, G.; Dordevic, N.; Bozickovic, A.; Davidovic, V. Nitrogen Efficiency in Dairy Cattle. In Proceedings of the International Scientific Agricultural Symposium, Jahorinsa, Bosnia, 3–6 October 2019; pp. 1523–1528. [Google Scholar]
- Chase, L.E. What Do High Producing Herds Really Feed? Proc. Cornell. Nutr. Conf. 2019. Available online: https://hdl.handle.net/21813/69483 (accessed on 15 March 2023).
- Prestegaard-Wilson, J.M.; Daley, V.L.; Drape, T.A.; Hanigan, M.D. A survey of United States dairy cattle nutritionists’ practices and perceptions of reducing crude protein in lactating dairy cow diets. Appl. Anim. Sci. 2021, 37, 697–709. [Google Scholar] [CrossRef]
- National Research Council. Nutrient Requirements of Dairy Cattle, 7th ed.; National Academies Press: Washington, DC, USA, 2001. [Google Scholar]
- NASEM (National Academies of Sciences, Engineering, and Medicine). Nutrient Requirements of Dairy Cattle, 8th ed.; National Academies Press: Washington, DC, USA, 2021; Available online: https://dpi.org/10.17226/25806 (accessed on 2 May 2023).
- Lapierre, H.; Martineau, R.; Hanigan, M.D.; van Lingen, H.J.; Kebreab, E.; Spek, J.W.; Ouellet, D.R. Review: Impact of protein and energy supply on the fate of amino acids from absorption to milk protein in dairy cows. Animal 2020, 14, s87–s102. [Google Scholar] [CrossRef]
- Schwab, C. The principles of balancing diets for amino acids and their impact on N utilization efficiency. In Proceedings of the 23rd Ruminant Nutrition Symposium, Durham, NH, USA, 31 January–1 February 2012. [Google Scholar]
- LaPierre, P.A.; Luchini, D.; Ross, D.A.; Van Amburgh, M.E. Effects of Precision Essential Amino Acid Formulation on a Metabolizable Energy Basis for Lactating Dairy Cows. Proc. Cornell Nutr. Conf. 2019. Available online: https://hdl.handle.net/1813/67048 (accessed on 2 May 2023).
- LaPierre, P.A.; Fredin, S.; Ross, D.A.; Van Amburgh, M. Impact of Starch and Energy on Amino Acid Requirements of Lactating Cows. Proc. Cornell Nutr. Conf. 2020. Available online: https://hdl.handle.net/1813/72897 (accessed on 4 May 2023).
- Higgs, R.J.; Chase, L.E.; Schwab, C.G.; Sloan, B.; Luchini, D.; LaPierre, P.A.; Van Amburgh, M.E. Balancing dairy cattle diets for rumen nitrogen and methionine or all essential amino acids relative to metabolizable energy. J. Dairy Sci. 2023, 109, 1826–1836. [Google Scholar] [CrossRef]
- Higgs, R.J.; Van Amburgh, M.E. Evolution of the CNCPS—Development of V7. Proc. Cornell Nutr. Conf. 2016. Available online: https://hdl.handle.net/1813/44752 (accessed on 4 May 2023).
- Binggeli, S.; Lapierre, H.; Charbonneau, E.; Ouellet, D.R.; Pellerin, D. Economic and environmental effects of revised metabolizable protein and amino acid recommendations on Canadian dairy farms. J. Dairy Sci. 2021, 104, 9981–9998. [Google Scholar] [CrossRef]
- White, R.R.; Capper, J.L. Precision diet formulation to improve performance and profitability across various climates: Modelling the implications of increasing the formulation frequency of dairy cattle diets. J. Dairy Sci. 2014, 97, 1563–1577. [Google Scholar] [CrossRef] [PubMed]
- Tedeschi, L.O.; Cavalcanti, L.F.L.; Fonesca, M.A.; Herrero, M.; Thornton, P.K. The evolution and evaluation of dairy cattle models for predicting milk production: An agricultural model comparison and improvement project (AgMIP) for livestock. Anim. Prod. Sci. 2014, 54, 2052–2067. [Google Scholar] [CrossRef]
- Ellis, J.L. The role of mechanistic models in precision dairy nutrition and on-farm decision support. In Proceedings of the Animal Nutrition Conference of Canada (ANCC), Virtual, 10–14 May 2021. [Google Scholar]
- Pacheco, D.; Patton, R.A.; Parys, C.; Lapierre, H. Ability of commercially available dairy ration programs to predict duodenal flows of protein and essential amino acids in dairy cows. J. Dairy Sci. 2012, 95, 937–963. [Google Scholar] [CrossRef]
- da Silva, H.M.; de Oliveira, A.S. A new protein system for dairy cows. J. Dairy Sci. 2023, 106, 1757–1772. [Google Scholar] [CrossRef]
- Lapierre, H.; Larsen, M.; Sauvant, D.; Van Amburgh, M.E.; Van Duinkerken, G. Review: Converting nutritional knowledge into feeding practices: A case study comparing different protein feeding systems for dairy cows. Animal 2018, 12, s457–s466. [Google Scholar] [CrossRef]
- INRA. The INRA Feeding System for Ruminants; Waganingen Academic Publishers: Waganingern, The Netherlands, 2018. [Google Scholar]
- Thomas, C. Feed into Milk: A New Applied Feeding System for Dairy Cows; Nottingham University Press: Nottingham, UK, 2004. [Google Scholar]
- Volden, H. NorFor. The Nordic Feed Evaluation System; Wageningen Academic Publishers: Wageningen, The Netherlands, 2011. [Google Scholar]
- Van Duinkerken, G.; Blok, M.C.; Bannink, A.; Cone, J.W.; Dijkstra, J.; Van Vuuren, A.M.; Tamminga, S. Update of the Dutch protein evaluation system for ruminants: The DVE/OEB2019 system. J. Agric. Sci. 2011, 149, 351–367. [Google Scholar] [CrossRef]
- Bellingeri, A.; Gallo, A.; Liang, D.; Masoero, F.; Cabrera, V. Development of a linear programming model for the optimal allocation of nutritional resources in a dairy herd. J. Dairy Sci. 2020, 103, 10898–10916. [Google Scholar] [CrossRef]
- McGilliard, M.L.; Swisher, J.M.; James, R.E. Grouping lactating cows by nutritional requirements for feeding. J. Dairy Sci. 1983, 66, 1084–1093. [Google Scholar] [CrossRef]
- Cabrera, V.E.; Kalantari, A.S. Economics of production efficiency: Nutritional grouping of the lactating cow. J. Dairy Sci. 2015, 99, 825–841. [Google Scholar] [CrossRef]
- Wu, Y.; Liang, D.; Shaver, R.D.; Cabrera, V.E. An income over feed cost nutritional grouping strategy. J. Dairy Sci. 2019, 102, 4682–4693. [Google Scholar] [CrossRef]
- Barriento-Blanco, J.A.; White, H.; Shaver, R.D.; Cabrera, V.E. Graduate Student Literature Review: Considerations for nutritional grouping in dairy farms. J. Dairy Sci. 2022, 105, 2708–2717. [Google Scholar] [CrossRef]
- Weiss, B. Incorporating diet and pen variation into ration formulation. In Proceedings of the Penn State Dairy Cattle Workshop, Harrisburg, PA, USA, 31 October–1 November 2018. [Google Scholar]
- Barrientos-Blanco, J.A.; White, H.; Shaver, R.D.; Cabrera, V.E. Improving nutritional accuracy and economics through a multiple ration-grouping strategy. J. Dairy Sci. 2020, 103, 3774–3785. [Google Scholar] [CrossRef]
- Letelier, P.; Zanton, G.I.; Wattiaux, M.A. Production performance of Holstein cows at 4 stages of lactation fed 4 dietary crude protein concentrations. J. Dairy Sci. 2022, 105, 9581–9598. [Google Scholar] [CrossRef] [PubMed]
- Liang, D.; Cabrera, V.E. Optimizing productivity, herd structure, environmental performance, and profitability in dairy cattle herds. J. Dairy Sci. 2015, 98, 2812–2823. [Google Scholar] [CrossRef]
- Sather, K.M. Managing the profit centers within a precision feeding system. In Proceedings of the North American Precision Feeding Conference, Rochester, NY, USA, 24–25 June 2015. [Google Scholar]
- Cox, B.G. Experience with feed management software. In Proceedings of the Virginia Tech Feed and Nutritional Management, Cow College, Blacksburg, VA, USA, 16 February 2007. [Google Scholar]
- NAHMS. 2016. Dairy Cattle Management Practices in the United States. 2014. Available online: http://www.aphis.usda.gov/nahms (accessed on 15 March 2023).
- Cherney, J.H.; Digman, M.F.; Cherney, D.J. Handheld NIRS for forage evaluation. Comput. Electron. Agric. 2021, 190, 106469. [Google Scholar] [CrossRef]
- Donnelly, D.M.; Dorea, J.R.R.; Yang, H.; Combs, D.K. Technical note: Comparison of dry matter measurements from a handheld near-infrared units with oven drying at 60 °C for 48 hours and other on-farm methods. J. Dairy Sci. 2018, 101, 9871–9977. [Google Scholar] [CrossRef] [PubMed]
- Evangelista, C.; Basirico, L.; Bernabucci, U. An overview on the use of near infrared spectroscopy (NIRS) on farms for management of dairy cows. Agriculture 2021, 11, 296. [Google Scholar] [CrossRef]
- Litherland, N.; Lobao, D.; Allen, D.; Ghiraldi, A.; Barbi, A. Controlling Variation with Precision Feeding Applications. Available online: https://www.dinamicagenerale.com/public/file/dgMinnesotacasestudydraft-5161.pdf (accessed on 2 May 2023).
- Piccioli-Cappelli, F.; Calegari, F.; Calamari, L.; Bani, P.; Minuti, A. Application of a NIR device for precision feeding in dairy farms: Effect on metabolic conditions and milk production. Ital. J. Anim. Sci. 2019, 18, 754–765. [Google Scholar] [CrossRef]
- Naranjo, A.; Johnson, A.; Rossow, H.; Kebreab, E. Greenhouse gas, water, and land footprint per unit of production of the California dairy industry over 50 years. J. Dairy Sci. 2020, 1–3, 3760–3773. [Google Scholar] [CrossRef]
- De Vries, A.; Bliznyuk, N.; Pinedo, P. Invited review: Examples and opportunities for artificial intelligence (AI) in dairy farms. Appl. Anim. Sci. 2023, 39, 14–22. [Google Scholar] [CrossRef]
- Saxena, P.; Parasher, Y. Application of artificial neural network (ANN) for animal diet formulation modeling. Procedia Comput. Sci. 2019, 152, 261–266. [Google Scholar] [CrossRef]
- Tedeschi, L.O. ASN-ASAS Symposium: Fiture of Data Analytics in Nutrition: Mathematical modeling in ruminant nutrition: Approaches and paradigms, extant models, and thoughts for optimizing predictive analytics. J. Anim. Sci. 2019, 97, 1921–1944. [Google Scholar] [CrossRef]
- Wolfe, D.W.; Ziska, L.; Petzoldt Seamsan, A.; Chase, L.; Hayhoe, K. Projected change in climate thresholds in the Northeastern U.S.: Implications for crops, pests, livestock, and farmers. Mitig. Adapt. Strat. Glob. Chang. 2008, 13, 555–575. [Google Scholar] [CrossRef]
- Veltman, K.; Rotz, C.A.; Chase, L.; Cooper, J.; Forest, C.E.; Ingraham, P.A.; Izaurralde, R.C.; Jones, C.D.; Nicholas, R.E.; Ruark, M.D.; et al. Assessing and reducing the environmental impact of dairy production systems in the northern US in a changing climate. Agric. Systems. 2021, 192, 103170. [Google Scholar] [CrossRef]
- Van Amburgh, M.; Ortega, A.; LaPierre. Modeling and integrating metabolizable energy and protein supply and requirements in lactating dairy cattle to optimize nitrogen utilization. In Proceedings of the Florida Ruminant Nutrition Symposium, Gainsville, FL, USA, 20–22 February 2023. [Google Scholar]
- Gislon, G.; Bava, L.; Colombini, S.; Zucali, M.; Crovetto, G.M.; Sandrucci, A. Looking for high-production and sustainable diets for lactating cows: A survey in Italy. J. Dairy Sci. 2020, 103, 4863–4873. [Google Scholar] [CrossRef]
- Gargiulo, J.I.; Eastwood, C.R.; Garcia, S.C.; Lyons, N.A. Dairy farmers with larger herd sizes adopt more precision dairy technologies. J. Dairy Sci. 2018, 101, 5466–5473. [Google Scholar] [CrossRef]
- Tedeschi, L.O. ASAS-NANP Symposium: Mathematical Modeling in Animal Nutrition: The progression of data analytics and artificial intelligence in support of sustainable development in animal science. J. Anim. Sci. 2022, 100, 1–11. [Google Scholar] [CrossRef] [PubMed]
- von Keyserlingk, M.A.G.; Martin, N.P.; Kebreab, E.; Knowlton, K.F.; Grant, R.J.; Stephenson, M.; Stiffen, C.J.; Harner, J.P.; Wright, A.D.; Smith, S.I. Invited review: Sustainability of the US dairy industry. J. Dairy Sci. 2013, 96, 5405–5425. [Google Scholar] [CrossRef] [PubMed]
- Martin, N.P.; Russelle, M.P.; Powell, J.M.; Sniffen, C.J.; Smith, S.I.; Tricarico, J.M.; Grant, R.J. Invited review: Sustainable forage and grain crop production for the US dairy industry. J. Dairy Sci. 2017, 100, 9479–9494. [Google Scholar] [CrossRef]
- Peterson, C.B.; Mitloehner, F.M. Sustainability of the dairy industry: Emissions and mitigation opportunities. Front. Anim. Sci. 2021, 2, 760310. [Google Scholar] [CrossRef]
- Knapp, J.R. Dairy Sustainability—Using the real facts. In Proceedings of the 24th Tri-State Dairy Nutrition Conference, Fort Wayne, IN, USA, 20–22 April 2015. [Google Scholar]
- Chase, L.E. Dairy Industry Sustainability—Has Progress Been Made? Proc. Cornell Nutr. Conf. 2021. Available online: https://hdl.handle.net/1813/110225 (accessed on 2 May 2023).
- Feil, A.A.; Schreiber, D.; Haetinger, C.; Haberkamp, A.M.; Kist, J.I.; Rempel, C.; Maehler, A.E.; Gomes, M.C.; da Silva, G.R. Sustainability in the dairy industry: A systematic literature review. Environ. Sci. Pollut. Res. 2020, 27, 33527–33542. [Google Scholar] [CrossRef] [PubMed]
- Thoma, G. Feed formulation for sustainable agriculture. In Proceedings of the Animal Nutrition Conference of Canada, Montreal, QC, Canada, 10–12 May 2022. [Google Scholar]
- Kim, D.; Stoddart, N.; Rotz, C.A.; Veltman, K.; Chase, L.; Cooper, J.; Igraham, P.; Izaurralde, R.C.; Jones, C.D.; Gaillad, R.; et al. Analysis of beneficial management practices to mitigate environmental impacts of dairy production systems around the Great Lakes. Agric. Syst. 2019, 176, 102660. [Google Scholar] [CrossRef]
Figure 1.
Daily Dry Matter Intake in Commercial Dairy Herds, kg.
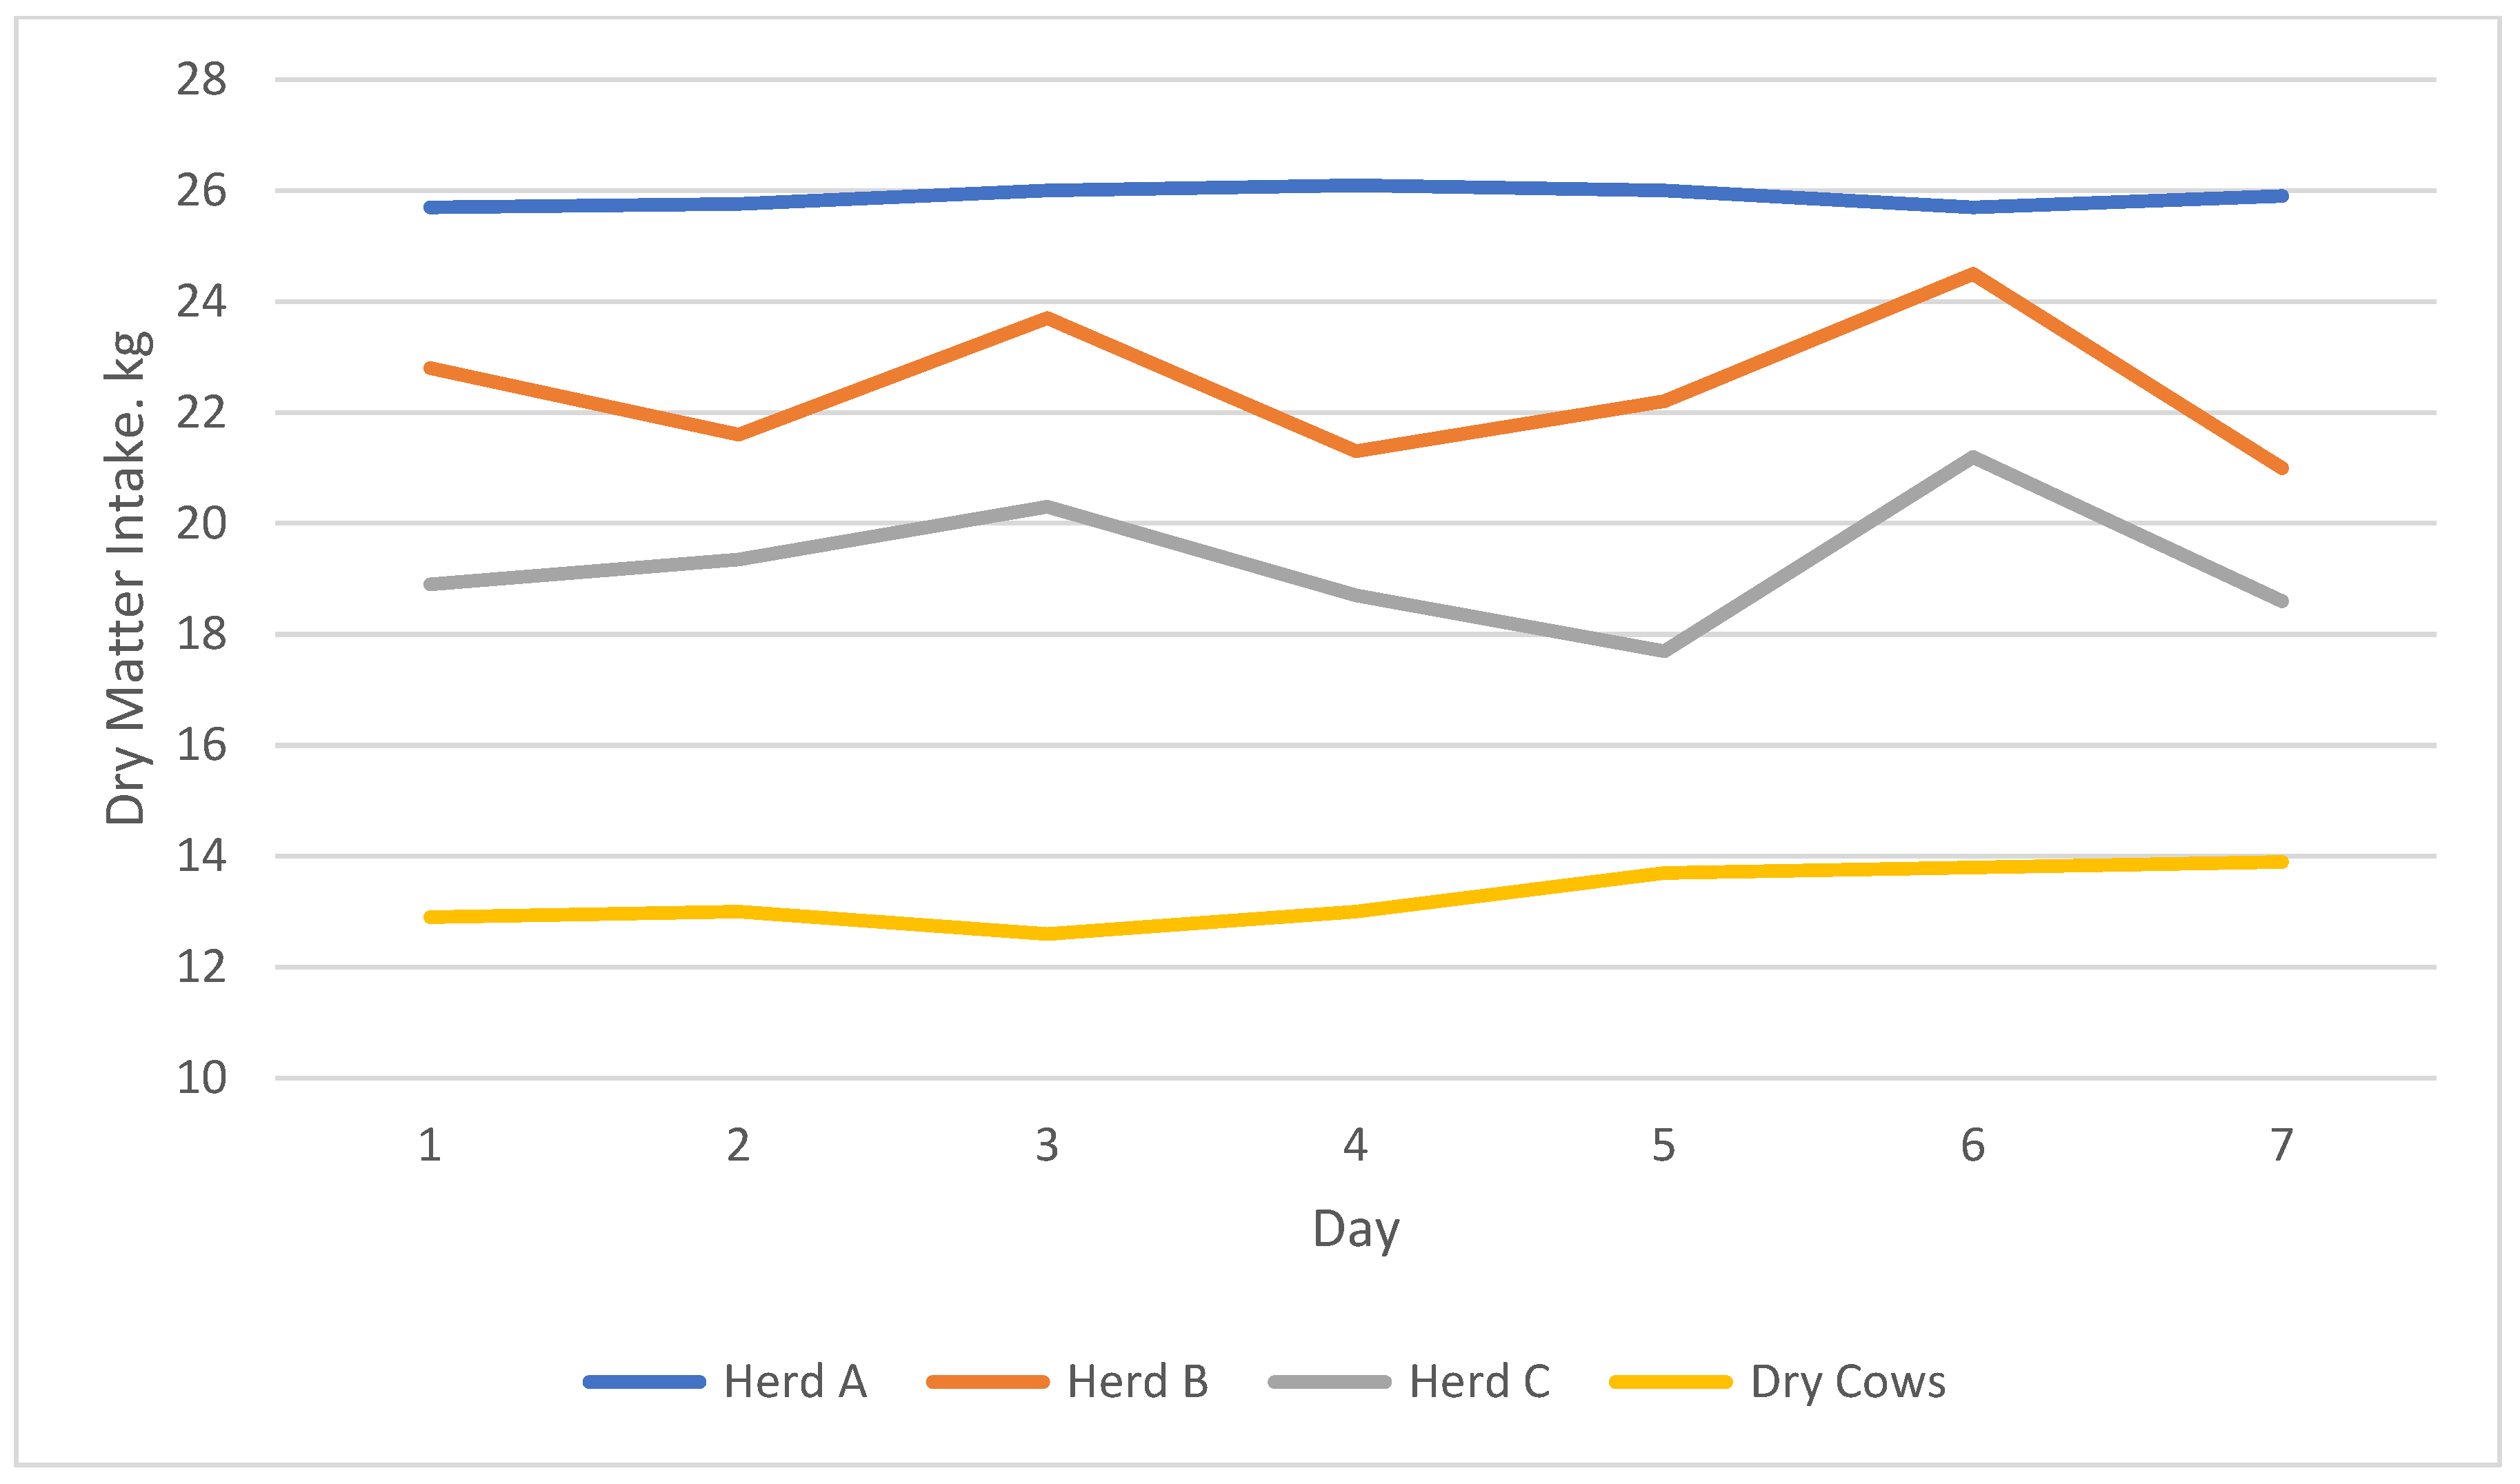

Table 1.
Diet Nutrient Content and Milk Production in a Washington State Dairy Herd a,b.
| Item | Trial 1 | Trial 2 | Trial 3 | |||
|---|---|---|---|---|---|---|
| Control | AA Balanced | Control | AA Balanced | Control | AA Balanced | |
| Diet CP, % | 17.9 | 17.2 | 17.8 | 15.5 | 16.7 | 15.5 |
| MP Intake, g/cow/d | 2641 | 2822 | 2740 | 2796 | 2130 | 1998 |
| Methionine, % of MP | 1.95 | 2.34 | 1.91 | 2.19 | 1.83 | 2.20 |
| Lysine, % of MP | 6.41 | 7.23 | 6.32 | 6.67 | 6.64 | 6.88 |
| Milk Yield, kg/cow/d | 43 | 44.9 | 44.3 | 43.7 | 31.3 | 31.3 |
| NUE, % | 34 | 35.9 | 33.3 | 35.6 | 32.2 | 34.9 |
| Manure N, g/cow/d | 459 | 437 | 476 | 408 | 362 | 322 |
| IOFC (2014), $/cow/d | 15.16 | 15.24 | 14.99 | 13.98 | 11.09 | 11.27 |
a Adapted from Chen et al. [101]. b CP = Crude protein; MP = metabolizable protein; NUE = nitrogen-use efficiency; IOFC = income over feed cost ($/cow/day).
Table 2.
Diet Nutrient Content, Milk Production and Income Over Feed Cost a,b.
| Item | Herd A | Herd B | ||
|---|---|---|---|---|
| Initial Diet | Final Diet | Initial Diet | Final Diet | |
| Diet CP, % | 17.6 | 16.6 | 17.7 | 16.9 |
| MP Intake, g/cow/d | 2950 | 2769 | 2546 | 3090 |
| Forage, % of Diet DM | 54 | 57 | 60 | 48 |
| Milk Yield, kg/cow/d | 35.9 | 36.3 | 37.5 | 36.4 |
| Feed Cost, $/cow/d | 4.07 | 3.35 | 4.37 | 4.12 |
| Income Over Feed Cost, $/cow/d | 5.32 | 6.31 | 4.79 | 4.98 |
| Income Over Purchased Feed Cost, $/cow/d | 6.11 | 7.38 | 5.68 | 5.95 |
| Manure N, g/cow/d | 500 | 441 | 469 | 441 |
| Milk Urea Nitrogen, mg/dL | 15.3 | 12.3 | 13.5 | 12 |
| NUE, % | 28 | 31 | 28 | 30 |
a Adapted from Higgs et al. [103]. b CP = crude protein; MP = metabolizable protein; DM = dry matter; NUE = nitrogen-use efficiency.
Table 3.
Whole-Herd Milk Production, Feed Cost and Nutrient Excretion a.
| Item | Base Year | Year 5 | Change |
|---|---|---|---|
| Crop, ha | 435 | 435 | |
| Total Animals | 852 | 1077 | +26.4 |
| Milk Cows | 408 | 54 | +33.3 |
| Milk, kg/cow/d | 30.9 | 33.5 | +8.74 |
| Herd Total Milk, kg/day | 12,596 | 18,278 | +45 |
| Forage, % of Diet DM | 43 | 59 | +37 |
| Total Feed Cost, $/herd/d | 2200 | 2467 | +12.1 |
| Purchased Feed Cost, $/herd/d | 1813 | 1375 | −24.3 |
| Manure N, kg/herd/year | 140,306 | 116,382 | −17 |
| Manure P, kg/herd/year | 19,720 | 14,161 | −28 |
| Manure N, kg/ha | 322 | 268 | −17 |
| Manure P, kg/ha | 43 | 31 | −28 |
a Adapted from Tylutki et al. [105].
Table 4.
Milk Production, Diet CP and Manure N in Upper Susquehanna Watershed Dairy Herds a,b.
| Herd | Milk, kg/cow/d | Diet CP, % | Manure N, g/cow/d | |||
|---|---|---|---|---|---|---|
| Initial | Final | Initial | Final | Initial | Final | |
| A | 24.0 | 22.7 | 16.0 | 14.9 | 358 | 282 |
| B | 29.5 | 29.5 | 16.3 | 14.9 | 319 | 282 |
| C | 24.0 | 29.5 | 20.5 | 16.0 | 510 | 362 |
| D | 34.0 | 34.0 | 17.1 | 16.0 | 385 | 344 |
| E | 30.9 | 33.6 | 19.0 | 16.2 | 465 | 370 |
| F | 39. | 39.0 | 17.4 | 16.5 | 456 | 423 |
| G | 29.5 | 34 | 16.9 | 16.2 | 422 | 400 |
a Adapted from Van Amburgh et al. [111]. b CP = Crude protein.
Table 5.
Crude Protein, Amino acids and Milk Nitrogen Efficiency in Holstein Herds a.
| Item | 2011 | 2019a | 2019b [136] |
|---|---|---|---|
| Herds | 14 | 26 | 79 |
| Milk Yield, kg/cow/d | 39.6 (32.7–52.6) | 46.6 (39–57) | 50.2 (44.4–58) |
| Milk Fat, % | 3.66 (3.2–4) | 3.73 (3.2–3.95) | 3.71 (3.2–4.2) |
| Milk True Protein, % | 3.08 (2.9–3.2) | 3.06 (2.8–3.2) | 3.06 (2.9–3.2) |
| CP, % | 15.6 (14.3–16.3) | 15.7 (13.4–16.7) | 16.7 (13.9–18.2) |
| MP, g/cow/d | 2665 (2306–3306) | 3080 (2587–3592) | 3191 (2885–3647) |
| Lysine, % of MP | 6.35 (5.8–6.7) | 6.66 (6.2–7) | 6.62 (5.8–7.1) |
| Methionine, % of MP | 2.04 (1.8–2.7) | 2.35 (2.1−2.8) | 2.36 (1.9–2.8) |
| MUN, mg/dL | 9.4 (0–14) | ||
| MNE, % | 34 (28–38) | 32.8 (28–38) | 32.6 (28.9–41.7) |
a CP = Crude protein; MP = metabolizable protein; MUN = milk urea nitrogen; MNE = milk nitrogen efficiency.
Table 6.
CNCPS Environmental Outputs for a Diet Balanced for 45 kg of Milk and a Dry Matter Intake of 25 kg a,b.
Table 6.
CNCPS Environmental Outputs for a Diet Balanced for 45 kg of Milk and a Dry Matter Intake of 25 kg a,b.
| Fecal Excretion kg/cow/d | 43.5 |
| Urine Excretion, kg/cow/d | 20.9 |
| Fecal N, g/cow/d | 242 |
| Urine N, g/cow/d | 183 |
| Total Manure N, g/cow/d | 420 |
| Productive N/Total N, % | 35 |
| Productive N/Urinary N | 1.26:1 |
| Manure N/Total N, % | 65 |
| Fecal P, g/cow/d | 53 |
| Urine P, g/cow/d | 1 |
| Total Manure P, g/cow/d | 54 |
| Productive P/Total P, % | 41 |
| Manure P/Total P, % | 59 |
| CH4, g/kg Milk Yield | 10.1 |
| CO2, g/kg Milk Yield | 323 |
| NH3 Potential c, g | 116 |
a Diet is 16.1% CP, 31.7% NDF, 4.2% fat, 25.3% starch and provides 2863 g of MP/cow/d. b Cornell Net Carbohydrate and Protein System [112]. c Ammonia emission potential set at 65% of urine N (g/cow/d).
Table 7.
Total Mixed Diet Mix Sheet.
| Feed | Target Amount, kg. | Amount Added, kg. | Deviation, % |
|---|---|---|---|
| Corn Silage | 3130 | 3144 | 0.45 |
| Alfalfa Silage | 1283 | 1297 | 1.1 |
| Corn Grain | 402 | 398 | −1.0 |
| Distiller’s Grain | 187 | 189 | 1.06 |
| Protein Mix | 470 | 471 | 0.2 |
| Total | 5472 | 5499 | 0.5% |
Disclaimer/Publisher’s Note: The statements, opinions and data contained in all publications are solely those of the individual author(s) and contributor(s) and not of MDPI and/or the editor(s). MDPI and/or the editor(s) disclaim responsibility for any injury to people or property resulting from any ideas, methods, instructions or products referred to in the content. |
© 2023 by the authors. Licensee MDPI, Basel, Switzerland. This article is an open access article distributed under the terms and conditions of the Creative Commons Attribution (CC BY) license (https://creativecommons.org/licenses/by/4.0/).
Share and Cite
MDPI and ACS Style
Chase, L.E.; Fortina, R. Environmental and Economic Responses to Precision Feed Management in Dairy Cattle Diets. Agriculture 2023, 13, 1032. https://doi.org/10.3390/agriculture13051032
AMA Style
Chase LE, Fortina R. Environmental and Economic Responses to Precision Feed Management in Dairy Cattle Diets. Agriculture. 2023; 13(5):1032. https://doi.org/10.3390/agriculture13051032
Chicago/Turabian StyleChase, Larry E., and Riccardo Fortina. 2023. "Environmental and Economic Responses to Precision Feed Management in Dairy Cattle Diets" Agriculture 13, no. 5: 1032. https://doi.org/10.3390/agriculture13051032
Note that from the first issue of 2016, this journal uses article numbers instead of page numbers. See further details here.