
The Evolution Model of and Factors Influencing Digital Villages: Evidence from Guangxi, China


1
Urban–Rural Construction College, Guangxi Vocational University of Agriculture, Nanning 530007, China
2
College of Civil Engineering and Architecture, Jiaxing University, Jiaxing 314001, China
3
College of Architecture and Urban Planning, Lanzhou Jiaotong University, Lanzhou 730070, China
4
College of Urban and Environmental Sciences, Northwest University, Xi’an 710127, China
5
School of Architecture, Southeast University, Nanjing 210096, China
6
School of Civil Engineering and Architecture, Guangxi University, Nanning 530004, China
*
Authors to whom correspondence should be addressed.
Agriculture 2023, 13(3), 659; https://doi.org/10.3390/agriculture13030659
Submission received: 31 January 2023
/
Revised: 4 March 2023
/
Accepted: 9 March 2023
/
Published: 11 March 2023
(This article belongs to the Special Issue Developing the Evidence Base for Rural Development Policies and Interventions to Address Novel and Emerging Societal Problems)
Abstract
:(1) Background: Digitalization is the key to sustainable village development, posing a new challenge for village planning, construction, and governance in all countries. The construction of digital villages is currently in the stage of experimentation and exploration; China is the largest developing country and a pioneer in the digitization of villages. (2) Methods: Based on a combination of the Boston Consulting Group Matrix and GeoDetector, we conducted an empirical study on 70 counties in Guangxi, aiming to analyze the construction level, evolution model, and driving mechanism of digital villages and to provide a basis for decisions on government investment and social participation. (3) Results: First, Conspicuous disequilibrium in rural digitalization has manifested in Guangxi, and counties at different levels (leader, follower, and straggler) show significant clustering and correlation effects in their geographical distribution. Second, digital village construction in Guangxi has evolves in diversified modes (divided into four types: star, gazelle, cow, and dog), with hot and cold areas forming a center–periphery structure. Third, rural digitalization has a very complex driving mechanism, with high heterogeneity in the direct influencing factors, significant synergistic enhancement of factors, and nonlinear enhancement dominating the interaction’s relationship. (4) Conclusions: According to the results of analysis, we suggest highlighting the government-driven mechanism and regional linkage in the construction of digital villages, formulating differentiated management policies and development plans based on the combination of top-level design and grassroots innovation, establishing joint meetings or development associations and service alliances, and stimulating the enthusiasm of the whole of society, especially farmers and enterprises, in order to achieve rapid and sustainable rural digitalization.
1. Introduction
1.1. Background
Now, the fourth industrial revolution, with digitalization, networking, and intelligence as its main features, is flourishing, and countries around the world generally attach great importance to the development of digital economies, smart cities, and smart villages [1,2]. Rural digitalization is becoming a new challenge for both developed and developing countries, and countries are formulating corresponding policies, such as the “Rural Broadband ReConnect Program” in the United States [3], the “Smart Countryside Initiative” in the European Union [4,5], the “Outline of Digital Rural Development Strategy” in China [6], and the Russian countryside online projects [7]. China had an early start in the field of rural and agricultural digital development, receiving considerable governmental attention, providing a typical example of this process [8]. In the process of urbanization, China’s rural development is facing challenges such as population loss, industrial decline, village decay, ecological damage, and environmental pollution. In order to promote rural revitalization, China has proposed a digital village strategy and regards it as a key to the sustainable development of rural areas. The current research on digital villages is still in its infancy, and quantitative analysis of its development level, change characteristics, and influencing factors is of great value to improvements in the theoretical system and the promotion of the practices.
1.2. Literature Review and Research Gap
Theoretical exploratory studies have focused on the concept and types of digital villages, analyzing the background, situation, significance, and the path of the realization of rural digitalization and the digital or smart development model of special villages [9,10]. First, most of the papers have focused on smart tourist villages [11] and Taobao villages [12], which are market-driven and spontaneously develop. Tourism and Taobao villages have a strong self-generating capacity: tourism and e-commerce are their leading industries, and their financial, human, and material resources for village construction are in better condition. The new generation of information technology is widely used in tourism village infrastructure, public service facilities, house and attraction construction, as well as product production and marketing processes in the context of the development of tourism wisdom and the e-commerce of agricultural products, thus gradually creating a digital or smart village [13,14]. Second, a small number of papers have focused on ancient, cultural, ecological, and poor villages, and villages inhabited by ethnic minorities, whose development is mainly dependent on government investment [15,16]. For example, to better preserve historical sites or promote traditional culture transmission, most of them, especially national traditional villages, create digital archives with the help of state financial support [17].
The practical applied research has focused on policy design and planning cases of national and regional rural digitalization, with analyses of the application of emerging information technologies and solutions in the process of rural digitalization and management [18] methods or models. Currently, most papers have focused on developed countries and regions, such as the United States, the European Union [19], Australia [20], Ireland [21], Poland [22,23], and Slovenia [24], with less attention paid to rural digitalization policies or planning programs in developing countries [25]. In addition, thematic application analysis of different dimensions and technologies for the digital development of villages has also been the focus of scholars, including technical solutions for smart transportation for villages [26,27], smart land [28], smart grid [29], smart metering [30], smart financial [31], smart governance [32], scalable architecture for smart villages [33] and ways and means of applying blockchain [34], Internet of Things [35,36], machine learning [37], artificial intelligence [38], and big data technologies [39].
In general, digital village research is rapidly expanding and has made good progress in both theoretical and practical fields, providing valuable experience for this study. Notably, digital and smart villages originated from smart cities, but the depth and breadth of the research for the former lags far behind that for the latter, and there are still some shortcomings in digital village research [40].
First, from the theoretical and academic perspectives, along with the completion of and changes in digital villages, scholars are still unclear about the factors affecting their formation and evolution and their driving mechanisms, resulting in the lack of necessary constituents for the construction of theoretical systems. In other words, what factors are responsible for the large differences in the levels of rural digitalization and their changes in different regions, and what is the relationship between different factors? Only Zhao et al. [41], Su and Peng [42] have conducted exploratory studies discussing the impact of digital village construction on farmers’ household consumption and the factors influencing farmers’ participation in the rural digitalization process; however, they have not been able to address the question of the influencing factors and their mechanisms of action.
Second, in terms of practical and applied needs, rural digitalization greatly varies in different countries and regions, and the government urgently needs to conduct scientific assessment of the development level of digital villages to provide a basis for management policy design and construction planning. In addition to China, the governments of many other countries and regions are committed to promoting rural digitalization. However, these practices are more empirical and exploratory, with no quantitative or scientific evidence. That is, in terms of the requirements for digital and smart village construction, policy makers lack a systematic set of technical tools to provide a basis for decision making.
1.3. Research Objective, Hypotheses, and Question
The digital village strategy was implemented many years ago and has achieved some results, with widely ranging development levels and change dynamics in different regions. A clear master of the current characteristics, change patterns, and driving mechanisms of rural digital development is a prerequisite for the scientific formulation of digital village development policies and spatial planning. Therefore, we evaluated the development level and regional differences of digital villages in counties of Guangxi Zhuang Autonomous Region, China, based on a combination of BCG and spatial econometric model, and analyzed the factors influencing their formation and evolution to provide a basis for the decision making in Guangxi provincial and county governments.
There are three hypotheses that were empirically tested in this study:
- The current characteristics and changing patterns of digital village development in different regions show large spatial differences, which are the result of the combined effect of many factors.
- The digital development of villages has high spatial heterogeneity and relevance, and the policy design and spatial planning for digital village development should follow the principles of zoning planning and differentiated management.
- Integrating the “grade evaluation–evolution pattern–driving mechanism–policy design” of rural digitalization into a whole framework may provide scientific guidance for governmental evidence-based decision making, which is applicable and inspiring for China and other relevant countries around the world.
This study was devoted to the following questions:
- How should we evaluate the level of development of and changing trends in digital villages in different counties, including grading and pattern classification?
- What factors influence the development differences and change patterns of digital villages in the county, including the direct influence of factors and the interaction of different factors?
- How should we carry out spatial planning and policy design for digital village development in order to improve the accuracy, applicability, and relevance of policy making, including geographic zoning options and differentiated policy recommendations?
2. Research Design
2.1. Study Area: Guangxi Zhuang Autonomous Region
Guangxi Zhuang Autonomous Region is a provincial administrative region in China, located in the southwest, bordering Vietnam, and is the only province in China located along the western border and along the coast (Figure 1). Guangxi is an underdeveloped region in China and is inhabited by ethnic minorities, including Zhuang, Yao, Miao, Dong, Mulao, Maonan, Hui, Jing, Yi, Shui and Gelao. The study covered 70 counties in Guangxi, excluding the municipal districts of 14 prefecture-level cities (Figure 2). Because the municipal districts are the key areas for town construction for which there were no rural digitalization data, they were not included in the study area. Guangxi is the frontier area and core area of China–Association of South East Asian Nations (ASEAN) cooperation and the permanent venue of China–ASEAN Expo. With the in-depth implementation of the Belt and Road initiative and the Regional Comprehensive Economic Partnership Agreement (RCEP), Guangxi’s urban and rural development has experienced new development opportunities.
The reasons for selected Guangxi as the study area were mainly as follows:
First, Guangxi is a large agricultural province with a high proportion of rural population, so the central government attaches great importance to the construction of digital villages in the province and has increased the investment, support, and supervision for the digital development of its villages. The central government has selected Hengzhou City, Gongcheng Yao Autonomous County, Fuchuan Yao Autonomous County, and Pingguo City, which have prominent features with a high level of rural digitalization, as national pilot digital villages and has provided them with special construction funds and special preferential policies for support. Additionally, the state requires these pilot areas to develop detailed timetables and roadmaps for the digital development of villages and to explore a construction model that can be operated, implemented, replicated, and promoted, thereby providing experience and demonstration for the construction of digital villages in Guangxi and other areas with similar features across the country. In addition, seven national ministries and commissions will conduct dynamic monitoring and follow-up evaluation of the pilot areas on a regular basis, and they will be disqualified from the national pilots and corresponding financial investment and policy support if they are found to have violations, major risks, hidden dangers, or unsatisfactory planning and program implementation.
Second, local governments at the provincial, municipal, county, and township levels in Guangxi are actively and enthusiastically involved in rural digitalization, and grassroots innovation models are constantly emerging. At the provincial government level, it has not only incorporated digital villages into the Outline of the Fourteenth Five-Year Plan for National Economic and Social Development of Guangxi Zhuang Autonomous Region and the Visionary Goals for 2035, the Plan for New Type of Urbanization in Guangxi (2021–2035), and the Implementation Opinions on Accelerating Digital Transformation and Deepening the Construction of Digital Guangxi and has promulgated special policies such as the Action Plan for Accelerating the Development of Digital Villages in Guangxi (2019–2022). In addition to the national pilots, the provincial government has selected 10 counties, such as Lingshan and Tian’e, as provincial pilot areas to achieve full coverage of the prefecture-level cities for pilot digital village construction. At the municipal government level, some prefecture-level cities have issued special policies for rural digitalization, such as the Implementation Plan for Liuzhou City to Implement the Action Plan for Accelerating rural digitalization in Guangxi (2019–2022) and the Program for the Coordination Mechanism for rural digitalization in Chongzuo City. At the county and township government levels, different areas are trying to explore digital village construction models and their features according to their own resource advantages, development stages, and needs. For example, Hepu County has developed a digital inspection system for a coastal village; Tianlin County has built the Aishan Grape Manor Smart Agriculture Project; Lingshan County has explored a new model of rural revitalization of integrated digital services for agriculture, culture, and tourism; Pubei County has built a big data service platform for the tangerine peel industry; Ligao Town has developed a meta-universe-based village construction and development system; and Maijiu Town has built a digital village–smart grid management center. As excellent cases of spontaneous bottom-up exploration and innovation, they have all received commendation from provincial government departments.
Third, although the construction of digital villages in Guangxi is relatively lagging behind the national level, it is showing rapid progress and remarkable characteristics. According to the China Digital Village Construction Report 2021: An Assessment Based on Media Big Data jointly released by Peking University and Sichuan Agricultural University, although the overall economic and technological development level of western China lags that of the central and eastern regions, it is struggling to catch up in the new construction field of digital villages; Guangxi, Guizhou, Shaanxi, and Gansu provinces have especially achieved relatively construction results. For example, a digital village research institute was established for the autonomous region, which issued the White Paper on Digital Villages in Guangxi Zhuang Autonomous Region, the first white paper on digital village construction nationwide. Another example is the “Digital Jasmine” platform in Hengzhou City and the new model of digital empowerment and governance in Gongcheng County, which have been selected as excellent national cases.
Fourth, despite the phased results achieved for digital village pilot demonstration work in Guangxi, it is facing problems such as lack of guidance in the process of grassroots construction and imperfect evaluation methods of the effectiveness of digital village development. The Action Plan for the Development of Digital Villages (2022–2025) calls for “the establishment of an evaluation index system for the development of digital villages and the evaluation of digital villages”. Therefore, this study was dedicated to evaluating the effectiveness of rural digitalization using multidisciplinary methods based on a case study of Guangxi, to analyze the factors influencing its development and changes, and to provide references or suggestions for future policy design and planning and construction work. In addition, Guangxi is a typical underdeveloped western province in China, and the research methods, results, and findings in this paper on its digital villages are highly applicable to regions with similar features, such as Yunnan, Guizhou, Qinghai, and Gansu, and can provide valuable insights into the digital development of villages in most Chinese provinces.
2.2. Research Methods
2.2.1. Boston Consulting Group Matrix: BCG
BCG was created by the Boston Consulting Group in the United States and is a common approach in the field of business management. It combines two indices, sales growth rate and market share, and classifies products or businesses into four types: star, question, cow, and dog, in a two-dimensional coordinate system. Referring to the BCG method, this paper also classifies the development trend of digital villages into four types (their names are star, gazelle, cow, and dog) by using the relative share (RS) and growth rate (GR) indices of the digital village index, where RS is based on spatial dimension comparison and represents the regional status of rural digital development; GR is based on time dimension evaluation and represents the growth ability of rural digital development. The calculation equations are as follows [43]:
where t represents time, is the current (2020) observation value for county , is the base period (2018) observation value for county , and is the maximum value for the study area (70 counties). To exclude artificial interference, we used the median of RS and GR as the threshold for the evolutionary pattern division. Star means that RS and GR are both greater than the average value. It represents regions with the best development of digital villages, showing strength and good growth. Cow means RS is greater than the average value but GR is less than the average value, representing that the construction of digital villages in the study area has been at a leading level, but the future growth potential is limited. Gazelle means RS is less than the mean but GR is greater than the mean. This means that the construction of digital villages is still not ideal at present, but the growth is very good, and with reasonable intervention and guidance, there is a high probability that it will grow into a new leader of regional rural digital development in the future. The term “question” in the BCG model was named “gazelle” to better fit the purpose of the analysis of high growth in this study using the concept of gazelle companies [44]. Gazelle companies are start-up SMEs that have crossed the valley of death and entered the high-growth stage, sharing the characteristics of “gazelles”: low relative share and high growth rate [45]. The concept of gazelle companies was first introduced in the 1990s by David Birch, a professor at the Massachusetts Institute of Technology, and the Silicon Valley Index uses the number of gazelle companies as one of the key indicators of economic prosperity in Silicon Valley [46]. Dog means both RS and GR are less than the average. So, at present, the development strength and potential of digital villages are weak, and the government needs to adopt strong intervention policies to improve the rural digital development ability.
2.2.2. Exploratory Spatial Data Analysis (ESDA)
ESDA is a data-driven nonparametric analysis method and a common tool for detecting spatial effects. We analyzed the spatial autocorrelation and agglomeration of rural digitalization using Moran’s I and Getis-Ord [47]. A positive Moran’s I represent positive spatial autocorrelation, while the opposite represents negative spatial autocorrelation. The statistical significance of Getis-Ord was tested using a standardized parameter [48] and used as a basis for classifying the study area into hot, subhot, cold, and subcold types, to reveal spatial aggregation characteristics. Z > 2.58 is a hot area and represents a high-value cluster area. Z < −2.58 is a cold area and represents a low-value cluster area. The parameters 1.96 < Z < 2.58 and −1.96 < Z < 1.96 represent subhot and subcold areas, respectively, indicating isolated distributions of high and low values, i.e., opposite values of the central and peripheral attributes, with central polarization (high center and low periphery) or collapse (low center and high periphery). Moran’s I and Getis-Ord are calculated as follows [49,50]:
where n stands for the number of counties; and are the values of rural digitalization index in counties and , respectively; is the mean value of the rural digitalization index; is the spatial weight matrix; is the sum of spatial weight matrices; and is the standardization of the rural digitalization index. This paper used ArcGIS 10. (Geographical Information System, Environmental Systems Research Institute, Inc., Redlands, CA, USA) and GeoDa 1.18 (State Key Laboratory of Resources and Environmental Information System, Institute of Geographic Sciences and Natural Resources Research, Chinese Academy of Sciences, Beijing, China) for spatial analysis, where the significance level was 0.05, the spatial weight matrix was a distance-based adaptive bandwidth spatial weight matrix (because the municipal districts were not part of the study area, there were voids within the study area, and the adjacency matrix was not applicable), the number of neighbors was set to 8, and all parameters were those that the software provides by default.
2.2.3. GeoDetector
GeoDetector, also known as the q statistic, is one of the most commonly used spatial statistical models and is now widely used in the analysis of influencing factors in natural and social disciplines [51]. In spatial analysis, the software divided the study area into many zonings. If the independent variable () and the dependent variable () tend to be consistent in spatial distribution, there is a statistical correlation between the two, and the strength of the relationship is represented by the q index. The value of q is calculated by dividing the sum of the variances of each partition by the total variance of the study area, with a maximum value of 1 and a minimum value of 0. A higher value means more influence or explanatory power. For Factor Detector, q represents the direct influence (explanatory) power of the independent variable () on the dependent variable () and is generally marked with q (). For Interaction Detector, q represents the combined influence of different independent variables ( and ) acting together on the dependent variable (), generally marked with q (∩). q is calculated as follows [52]:
where h is the number of layers or categories of independent variables; and N are the number of cities in layer h and study area, respectively; and are the variances of dependent variables in layer h and the study area, respectively; SSW is the within sum of squares of variances; and SST is the total sum of squares in the study area. According to the relationship of q (∩) with the minimum direct influence value (Min (q (), q ()), the maximum value (Max (q ()), q ()), and the sum value (q () + q ()), there are five types of interactive influence [53], where nonlinear weakening and single nonlinear weakening are the antagonistic effects between different factors, and measures should be taken to prevent the pairing of the two factors. The bifactor enhancement and nonlinear enhancement imply a synergy effect between different factors, and measures should be taken to push the pairing of the two factors in the policy design [54,55] (Figure 3).
2.3. Study Design and Data Source
2.3.1. Study Design
The study was performed in 4 steps. The first step was the study protocol design. Based on the analysis of the research background, this paper selected the study area based on data accessibility and sample representativeness, and preprocessed the data of the independent and dependent variables. The second step was the rural digitalization level assessment. Using the spatial clustering analysis tool of Geographic Information System, this paper classified the study area into three levels by the quantile method. The third step was the analysis of the evolutionary pattern of rural digitalization. This paper classified the digital development trends of the different counties in the study area into four types based on the BCG model. The fourth step was the analysis of influencing factors. This paper detected spatial effects with a spatial hotspot analysis tool and then used GeoDetector software to analyze the influence of different factors and their interaction to reveal the mechanism driving rural digitalization (Figure 4).
2.3.2. Index Selection and Data Source
In the driving mechanism analysis, the digital village index and evolution model of the digital village index were used as the dependent variables, and the independent variables were chosen combine demand-side and supply-side indices (Table 1). First of all, due to the lack of official data for dependent variables, we needed to compare multisource data to determine the final data source. The government is currently planning how to promote the construction of digital villages and advance the work program for the pilot development of digital villages. The quantitative evaluation and dynamic monitoring of the progress and development level of digital village construction in different regions are important and fundamental tasks [56]. Regarding the construction of an indicator system and statistical evaluation of the level of rural digital development, Chinese government departments, academic groups, and social institutions are conducting exploratory research and have published several influential evaluation reports [57]. At the national level, the Department of Market and Informatization of the Ministry of Agriculture and Rural Affairs and the Information Center of the Ministry of Agriculture and Rural Affairs released the Evaluation Report on the Development Level of Digital Agriculture and Rural Development in the National Counties, and the Informatization Development Bureau of the Office of the Central Cyberspace Affairs Commission and the Department of Marketing and Informatization of the Ministry of Agriculture and Rural Affairs released the Report on the Development of Digital Villages in China jointly with the Expert Advisory Committee on Agricultural and Rural Informatization. At the local level, the Report on the Development of Digital Villages in Jiangsu and the Evaluation Report on the Level of Development of Digital Agriculture and Rural Areas in Zhejiang have been released, and the Guangxi provincial government is promoting the evaluation of rural digitalization. At the level of academic groups and social institutions, the Institute of New Rural Development of Peking University released the County Digital Village Index Research Report jointly with Ali Research Institute. The School of Government and the Institute of Public Governance of Peking University released China Digital Village Construction Report 2021: An Assessment Based on Media Big Data jointly with Sichuan Agricultural University. Xinjiang University, together with a number of agricultural service technology companies, released the Xinjiang Rural Digitalization Research Report (2022). In most of these reports, only the analysis results or pictures are published. With the exception of the County Digital Village Index Research Report, none of the reports have published data. Additionally, in terms of report data completeness, continuity, and social influence, only the County Digital Village Index Research Report has published data for years, which met the needs of the panel data analysis in this study, so this study used its published digital village index as the source data [58]. The 2018 and 2020 editions of the County Digital Village Index Research Report were released in September 2020 and June 2022, respectively (due to data acquisition cycle limitations, there is a gap between the release time of the report and the research period in the report), with data analysis based on the evaluation of counties. The report integrates the use of official national statistics, industry data from social institutions, and Internet big data to provide a more accurate measurement of the actual level of rural digitalization [59,60]. In addition, the report excludes counties, municipal districts, and county-level cities with an agricultural added value of less than 3% of the GDP, and there are no data for municipal districts in the 2018 edition of the report. To maintain data comparability, this paper excluded municipal districts from the study area and set the study period as 2018–2020.
In terms of independent variables, both rural self-development and the overall environment of the county should be considered. Rural digitalization is the result of the joint transformation and innovation of the demand side and the supply side, which provides a direction for the selection of driving factors. The sustainable development of digital villages depends on the digital development needs of villages, mainly manifested in both population demand and industrial demand. Population demand is influenced by the size, density, and structure of the population, with permanent population, population density, and urbanization rate being common indices [61]. Industrial demand is influenced by the combination of economic scale, industrial structure, and consumption level. Gross domestic product (GDP) and per capita GDP are common indices for the government to assess the scale and quality of economic development [62], the added value of primary, secondary, and tertiary industries are classic indices for analyzing industrial structure [63]. The total retail sales of consumer goods and per capita consumption expenditure of farmers are the best indices for analyzing the overall consumption trends and farmers’ consumption status [64]. Because the construction of digital villages is still in its infancy, the support of the government and farmers plays a role that should not be ignored. The government and farmers’ income and expenditure directly affect the state of the digital supply side of villages. Because the government has not announced the specific amount of investment in digital village construction, this paper choses investment in fixed assets to represent the government’s investment in digital village construction and chose financial revenue, financial self-sufficiency rate, and per capita income of farmers to represent the input potential of government and farmers [65]. In addition, influenced by the strategy of common prosperity and rural revitalization, reducing and controlling the urban–rural development gap is one of the goals of rural digital development, and this paper chose the Urban–Rural Income Gap Index to measure the impact of the urban–rural gap on the construction of digital villages [66]. The data in this paper were mainly from Index of Digital Rural County and Guangxi Statistical Yearbook, and some missing data were from City Statistical Bulletin, County Statistics Manual, Work Report of County Government.
3. Results
3.1. Grade Evaluation
Dongxing had the highest digital village index in 2018, at 63.86; Lipu had the lowest, at 23.61, less than 40% of the highest value. Dongxing, Lingchuan, Sanjiang, Pingxiang, Tiandong, Binyang, Yangshuo, Hengxian, Shanglin, Zhongshan, Bama, Luzhai, Luchuan, Mengshan, Lingshan, Heshan, and other counties were the leaders in rural digitalization in Guangxi, clustered in a north–south belt, mostly in the eastern fringe area of Guangxi Beibu Gulf town cluster, and the western fringe area of urban clusters in southeast and northwest Guangxi. Xincheng, Xiangzhou, Cenxi, Dahua, Daxin, Fuchuan, Hepu, Longzhou, Jinxiu, Liucheng, Zhaoping, and Wuxuan counties were followers in rural digitalization in Guangxi, scattered in the periphery of leader counties and relatively concentrated only in the area of the Youjiang town belt. Huanjiang, Tengxian, Longlin, Quanzhou, Xilin, Guanyang, Donglan, Gongcheng, Leye, and Tian’e counties were stragglers in rural digitalization in Guangxi, clustered in a belt-like pattern in the northwest and east of the province (Figure 5).
In 2020, Dongxing still had the highest digital village index, which increased to 76.16; while Tianlin had the lowest value, at 39.70. Compared with 2018, the rural digitalization level and spatial pattern of Guangxi in 2020 remained stable in general, with 72.86% of the counties remaining unchanged, but with large changes in local areas such as Beihai, Baise, and Guilin. Wuxuan, Hepu, Fuchuan, Bobai, Quanzhou, Lipu, Jingxi, Guanyang, and Fengshan witnessed further upgrading in rural digitalization; the counties under the jurisdiction of Guilin were especially increasingly transformed into leaders of rural digital development. It should be noted that Pubei, Pingnan, Mengshan, Luzhai, Heshan, Bama, Ziyuan, Xing’an, Pingguo, and Mashan showed decreases in their development level, and the straggler counties have further clustered in the Youjiang basin (Figure 5).
The Moran’s I value of the digital village index increased from 0.13 (p < 0.01, Z = 2.84) in 2018 to 0.21 (p < 0.01, Z = 4.21) in 2020, indicating a significant positive spatial autocorrelation and the agglomeration of rural digitalization in Guangxi. Specifically, the hot spot areas in 2018 were in a belt-like cluster in the Beibu Gulf town cluster region, and the subhot spots were in its periphery, clustered in the Zuojiang, Youjiang, and Xijiang River basins, and expanding to the city cluster in northern Guangxi. The cold and subcold spot areas were clustered and distributed in northwestern Guangxi in a belt, and in northeastern Guangxi in clusters, mostly inmountainous areas inhabited by ethnic minorities. In 2020, the hot spot areas were clustered in southeastern Guangxi, the subhot spot areas were clustered in northeastern Guangxi, the cold spots were clustered in northwestern Guangxi, and the subcold spots significantly expanded in the Zuojiang and Youjiang River basins and remained stable in northeastern Guangxi in general (Figure 6).
3.2. Evolution Model
The mean value of the digital village index in Guangxi rose from 46.56 in 2018 to 52.73 in 2020, or an increase of 6.17, by up to 13.25%, marking great progress in rural digitalization. Specifically, from the perspective of variation, hot spots clustered in Yulin and Baise, while most of the subhot spot areas were distributed in bands, with a small number distributed in clusters. The cold spot areas clustered in the Zuojiang and Youjiang River basins, while most of the subcold spots clustered in northeastern Guangxi. From the viewpoint of growth rate, there were three hot spot clusters formed with Lipu, Beiliu, and Jingxi as the center; the spatial scope of the subhot spots significantly shrank, but they were still distributed around the hot spot areas. The cold and subcold spots had essentially the same spatial pattern and amount of variation (Figure 7).
The median growth rate and relative share of the digital village index for 2018–2020 were 12.33% and 0.68, respectively; using them as thresholds, this paper classified the rural digitalization trends in the 70 counties of the study area into four types. Counties of the star, cow, gazelle, and dog types were in the ratio of 3:2:2:3, showing a dumbbell structure. Specifically, Hengxian, Liucheng, Sanjiang, Quanzhou, Guanyang, Cangwu, Hepu, Dongxing, Guiping, Rongxian, Luchuan, Bobai, Xingye, Beiliu, Tiandong, Fuchuan, Duan, and Wuxuan were star counties, mostly clustered in the Beihai–Yulin–Guigang development belt. Shanglin, Binyang, Luzhai, Rongan, Yangshuo, Lingchuan, Cenxi, Lingshan, Pubei, Pingnan, Zhaoping, Zhongshan, Bama, and Dahua were cow counties, dispersed in geographical distribution. Rongshui, Longsheng, Pingle, Gongcheng, Lipu, Shangsi, Debao, Napo, Lingyun, Xilin, Jingxi, Fengshan, Luocheng, and Huanjiang were gazelle counties, showing the spatial characteristics of large dispersion and small agglomeration. The border small agglomeration area was centered on Jingxi, and the small agglomeration area of ethnic minorities was centered on Luocheng. Long’an, Mashan, Xing’an, Yongfu, Ziyuan, Tengxian, Mengshan, Leye, Tianlin, Longlin, Pingguo, Nandan, and Tian’e were dog counties, forming belt-like agglomerations in northwestern and southeastern Guangxi and in the central part, and along Tiandeng–Daxin–PingguoXincheng.
The value of Moran’s I was 0.16 (p < 0.05, Z = 3.35), indicating a significant positive spatial autocorrelation and a center–periphery spatial feature in the geographical distribution of cold and hot spots. The hot spot areas clustered and distributed in southeastern Guangxi, including Bobai, Hepu, Pubei, Lingshan, Hengzhou, Bingyang, Xingye, Guiping, Beiliu, Rongxian, Cenxi, and Luchuan. Subhot spots clustered in northwestern Guangxi, including Cangwu, Zhaoping, Zhongshan, Pingle, Lingchuan, Xing’an, Quanzhou, Yongfu, Rong’an, Sanjiang and Rongshui. Cold spots had formed small clusters centered on Tian’e County, including Fengshan, Leye, Nandan, Jinxiu, and Longan. The subcold spots mainly concentrated in the Youjiang River basin, including Longlin, Xilin, Lingyun, Tianlin, Napo, Jingxi, Debao, Tiandeng, Daxin, Tiandong, and Pingguo (Figure 8).
3.3. Influencing Factors
3.3.1. Factor Detector
With the digital village index in 2020 as the dependent variable and as the independent variables, the results of the factor detector analysis obtained using GeoDetector are shown in Table 2. Population density had the greatest influence on rural digitalization, reaching 0.47; added value of secondary industry had the least influence, at 0.08. The gross domestic product was the median, and the direct influence was 0.31; using it as the threshold, this paper classified the direct influence of the factors into high and low. The direct influence of population density, total retail sales of consumer goods, added value of tertiary industry, per capita income of farmers, financial revenue, urban–rural income gap index, and per capita consumption expenditure of farmer were greater than the median. They were high-impact factors and key determinants of the development grade and regional differences in digital villages. The rest were low-impact factors; notably, per capita GDP and added value of secondary industry were weak in direct impact and insignificant (not statistically significant).
With the evolution model of digital village index for 2018–2020 as the dependent variable and as the independent variables, the results of the factor detector analysis obtained using GeoDetector are shown in Table 3. Financial revenue had the largest influence at 0.43; per capita GDP had the smallest influence at 0.08, a difference of 5.38 times. The urban–rural income gap index was the median with a direct influence of 0.32, which we used as a threshold to classify the factor influence into high and low levels. The direct influence of financial revenue, added value of tertiary industry, total retail sales of consumer goods, gross domestic product, added value of primary industry, population density, and per capita income of farmer were greater than the median, and they were high-impact factors. The rest were low-impact factors, and it should be noted that per capita GDP had a weak direct influence and as not significant (not statistically significant).
3.3.2. Interaction Detector
The results of the interaction detector analysis of the digital village index () and the evolution model of digital village index () are shown in Table 4 and Table 5. The two showed greater similarity, and the interactions were all realized as nonlinear enhancement and bifactor enhancement. The different factors showed strong synergistic effects, and the interactive influence was generally much greater than the direct influence. In terms of interaction types: for the digital village index, less than 15% of the 105 factor pairs were characterized by bifactor enhancement, including permanent population ∩ gross domestic product, permanent population ∩ added value of tertiary industry, permanent population ∩ total retail sales of consumer goods, population density ∩ added value of tertiary industry, population density ∩ total retail sales of consumer goods, population density ∩ per capita consumption expenditure of farmer, population density ∩ financial revenue, population density ∩ urban–rural income gap index, added value of secondary industry ∩ added value of tertiary industry, added value of tertiary industry ∩ total retail sales of consumer goods, added value of tertiary industry ∩ investment in fixed asset, total retail sales of consumer goods ∩ per capita income of farmer, per capita consumption expenditure of farmer ∩ per capita income of farmer, and financial revenue ∩ financial self-sufficiency rate. For the evolution model of the digital village index, the proportion of those characterized by bifactor enhancement in the interaction relationship increased to 25%. There were nine factor pairs, the same as for the digital village index, such as permanent population ∩ added value of tertiary industry, population density ∩ added value of tertiary industry, and population density ∩ total retail sales of consumer goods. Eighteen new factor pairs were added, including permanent population ∩ urbanization rate, urbanization rate ∩ population density, and population density ∩ added value of primary industry.
The mean values of the digital village index () and the evolution model of the digital village index () factor pair interactive influence as 0.67 and 0.65, respectively, which were much higher than the mean values of direct influence (0.28 and 0.27), and more than 60% of the factor pairs had more than the mean interactive influence. For digital village index (), the interactive influence of 16 factor pairs was equal to or greater than 0.8. Per capita consumption expenditure of farmer ∩ financial revenue, urbanization rate ∩ urban–rural income gap index, gross domestic product ∩ per capita income of farmer, added value of tertiary industry ∩ per capita income of farmer, population density ∩ gross domestic product, and population density ∩ per capita income of farmer had an interactive influence greater than 0.85. For the evolution model of digital village index (), there were 15 and 7 factor pairs with interactive influence over 0.8 and 0.85, respectively. In particular, financial revenue ∩ urban–rural income gap index, added value of primary industry ∩ total retail sales of consumer goods, and financial revenue ∩ per capita income of farmer had an interactive influence greater than 0.9.
In addition, although per capita GDP and added value of secondary industry have a small direct influence, their interactive effect should not be ignored. For the digital village index (), the interaction between per capita GDP and added value of secondary industry is 0.22, 2.8 times of their direct influence, and the interaction between financial self-sufficiency rate and per capita GDP is even 5.56 times of their direct influence, in terms of the minimum value of interactive influence. From the maximum value of interaction influence, the interactive influence of per capita GDP and per capita income of farmer is 0.72, and the interaction influence of added value of secondary industry and urban–rural income gap index is 0.7, both more than 9 times of their direct influence. It is also true for the evolution model of evolution model of digital village index (). For example, the interactive effect of per capita GDP and added value of secondary industry is the smallest (0.26) and more than three times the direct effect; the interactive influence of per capita GDP with both factors of per capita income of farmer and financial revenue reaches 0.75 (the maximum), more than 9.5 times of the direct influence.
3.4. Policy Suggestions
3.4.1. Combination of Top-Level Design and Grass-Roots Innovation
The construction of digital and smart villages is still in the early pilot exploration stage, and the digitalization of villages show significant spatial correlation. Therefore, top-level design and grassroots innovation should be combined in future research, highlighting government-driven and regional linkages and strengthening the leading and governance roles in rural digital development.
In terms of top-level design, the provincial government should accelerate the development of digital village construction standards or standardized construction guidance programs to clarify the general rules, core technologies, application scenarios, operation, and maintenance mechanisms for the development of digital villages. The municipal government should introduce an overall planning and implementation plan of digital village construction and various supporting policies, set up special funds for rural digital development, and improve the assessment and evaluation projects and mechanisms related to rural digital development for each county under its jurisdiction.
In grassroots innovation, the county government should make full use of the benefits of national and provincial pilot construction and, with the help of higher-level government investment in human, material, and financial resources, combine their own characteristics, boldly explore, accumulate development experience, and strive to create a demonstration model to lead the development of rural digitalization in the surrounding areas. The town governments should strengthen digital literacy training for grassroots cadres, village officials, county sages, farmers, and agribusinesses; strengthen digital security and cyber security education; and enhance the enthusiasm through all social forces to participate in rural digitalization. The pilot villages should explore and develop characteristic digital application scenarios based on their own resource conditions and digital development needs.
In addition, provincial, municipal, county, and township governments should collaborate to establish a mechanism for farmers’ participation and feedback in the construction of digital villages, so as to effectively enhance farmers’ enthusiasm for participation, happiness, and sense of gain. In the current government-driven rural digital development process, farmers are passively involved or participating, so the digital application and platform function design are misaligned with their real needs. Therefore, a coordination and feedback mechanism among the government, farmers, and enterprises needs to be established at an early date to identify the interests and development needs of different participants, especially farmers, so as to effectively improve the quality and effectiveness of rural digital development [67,68].
3.4.2. Increase Support for Construction Funds and Human Resources
It should be noted that because the rural digitalization in Guangxi is still in the early stages, the government needs to increase the financial and human resources support for the construction of a digital countryside, in addition to increasing investment in the areas of policy support, planning, and coordination. Because the construction of digital villages, especially infrastructure digitization projects, requires a large amount of funds, plus limited financial support from the state, whether Guangxi, a less developed region with weak local finance and grassroots financial strength, can successfully raise enough funds for digital village construction has become a key constraint. Therefore, Guangxi provincial, municipal, county, and township governments should try to expand the sources of funding for the construction of digital villages to create a win-win development pattern for the government, enterprises, villagers, and social organizations. On the one hand, government funding should be increased to give full play to the effect of financial special funds. The existing agriculture-related policies and funding channels should be utilized in an integrated manner as stipulated, such as implementing the Opinions of the Central Committee of the Communist Party of China State Council on Realizing the Effective Interface between Consolidating and Expanding the Achievements of Poverty Alleviation and Rural Revitalization, to support the issuance of special bonds for rural revitalization and to create an effective interface between digital entity pilot construction projects and special bonds, with emphasis on the digitalization projects in rural areas, especially remote and lagging areas. On the other hand, a government-led funding model with diversified social input should be established to supplement government funds. It is necessary to mobilize the enthusiasm of telecommunication companies, broadband operators, and other Internet infrastructure construction enterprises by playing the role of the market, coupled with tax relief, preferential rates, increased subsidies, lower loan interest rates, and other measures, to attract e-commerce companies, financial service providers, and software and hardware suppliers to the operation of digital projects such as smart agriculture and rural governance. This can create a multi-win situation in which the government has tax revenue, farmers have income, and enterprises have benefits.
Talent shortage is a limitation facing the construction of a digital countryside in Guangxi. Due to the massive transfer of rural population to cities and towns, there is a large shortage of technological professionals with knowledge of information, agriculture, and e-commerce in rural areas, especially highly educated young people. The construction of a digital countryside involves a wide range of fields and strong professionalism, which contrasts the significantly insufficient talent reserves in Guangxi. In addition to the shortage of front-line talent for digital village construction, the relevant departments are also faced with this dilemma. For example, the Ministry of Internet and Information Technology, the department in charge of digital village construction, currently has no more than 10 staff members in prefecture-level cities and even fewer in counties. Only 1-2 members are engaged in rural digitalization while having to handle other tasks at the same time, which greatly restricts the efficiency of digital construction in rural areas. The support for rural digital talent must be increased, and the endogenous power of digital rural construction needs to be activated by a variety of means in the future. First of all, support should be provided to enterprises, institutions of higher education, and research institutes to establish digital rural research institutions to provide digital solutions for rural revitalization. Second, digital village research institutions should be encouraged to run training courses and organize the participation of key professionals to improve their digital literacy, especially their digital technology application and digital management capabilities. Third, measures such as preferential job promotion can be introduced to mobilize the enthusiasm of selected graduates, college graduate village officials, and the first secretaries, bringing the masses to digital production, networked operation, and intelligent management. Finally, efforts should be made to explore the implementation of the Digital Farmer Talent Program for the New Era to attract migrant workers to return home and local college students to join, and guide the flow of network, information, and other professionals to rural areas to inject new talent into the construction of digital villages.
3.4.3. Design-Differentiated Zoning Management Policy
Unbalanced regional development and different evolution modes are common phenomena in the development of digital and smart villages, and they pose a great challenge for government planning and governance [69]. The government should formulate differentiated management policies according to the differences in digital development capacity and potential, as well as the development needs and goals of different regions, and continuously optimize policies according to the changes in practical work and the development situation to improve the accuracy of governance and the spatial planning for rural digitalization [70]. Differentiated policy formulation and implementation should be based on the development foundation, location conditions, and resource endowment of different regions; digital village construction should be promoted in an orderly manner according to the development rules of different types of villages, with reasonable arrangement of key tasks and projects; and the construction areas should be managed and the pace of construction should be controlled according to the demand to prevent image projects and wastefulness.
First, star counties with the best construction of digital villages should activate their market drive and guide the concentration of social, material, human, and financial investment in the future, and the government should focus on improving the quality of rural digitalization, promoting the synergistic development of digital villages and smart cities, and cultivating them into regional and even national leaders early on in the process [71].
Second, for cow counties with digital village construction already in the leading position, but with weak growth of village digitalization, they should limit or reduce investment under resource-limited conditions but to redirect the saved resources to the leader or gazelle areas to improve the overall efficiency of resource utilization.
Third, for gazelle counties, special research should be conducted to find the reasons for high growth. Then, some counties with good foundation and potential should be identified for special investment and cultivation to develop them into new leaders in the region in the future.
Fourth, the dog counties, especially the autonomous minority counties, mountainous counties, and border counties, are the key areas for the government to govern due to major problems in the current development path. These counties have weak infrastructural, economic, and consumer digital foundations; low demand; a lack of talent; and insufficient funding to support rural digital development. Without external intervention, it will be difficult to make a major breakthrough in the rural digitization process. The government should gather and increase investment in financial, human, and material resources in the future and organize the implementation of a number of major digital platforms, intelligent projects, and smart projects with iconic and common characteristics, such as agricultural and rural big data platforms, digital agricultural parks, e-commerce livestreaming bases, intelligent development bases for buildings, logistics and express parks for agricultural products, and digital twin projects for traditional villages [72], as a catalyst for the digital development of villages, to encourage and guide the construction of digital villages into a virtuous cycle.
3.4.4. Exert Government and Social Forces Based on Driving Mechanism
The mechanism of rural digital development is very complex, and the synergistic effect of different factors is significant. Therefore, the government should promote the construction of digital and smart villages as a systematic task, strengthen systematic planning, and guide the extensive participation of society and market to realize scientific construction.
At the government level, rural digitization is not a task that can be completed by a single department. The government should coordinate multiple departments such as agriculture and rural areas, housing and construction, industry and information technology, transportation and tourism in the future to establish a multidepartmental synergistic promotion mechanism, such as setting up a joint committee for digital village development as a specialized body to manage, guide, and supervise the construction of digital villages.
At the social level, provincial-, municipal-, and county-level digital village social service alliances or industry development associations should be established to guide digital enterprises to carry out service actions in the countryside; establish an expert consultation system and think tanks for rural digital development, such as setting up a digital village development research institute; and guide experts and think tanks to strengthen rural digital development case investigation and theoretical research. Given that the digital economy in the market is the force driving the digitalization of the countryside, it is necessary to focus on boosting the enthusiasm, initiative, and creativity of farmers and agriculture-related enterprises, with the need for rural and agricultural development as the starting point and objective. Most regions in Guangxi have so far failed to digitally upgrade and transform around the supply of major farm products, and they have not been able to effectively integrate the upper, middle, and downstream resources of the industry into a complete industrial chain. Most counties and cities currently focus only on brand-based agricultural production in the development of the rural digital economy, such as digital jasmine planting, digital farming of pigs, and mulberry silkworms, and other low-value-added areas, but are quite weak in high-value-added processing, management, sales, brand building, and other areas. Guangxi should focus on the digital development of its top products and brand enterprises from the perspective of industrial ecosystem in the future to extend upstream and downstream of industrial, value, and supply chains and establish cross-industry cooperation with other advantageous industries in the county, so as to systematically improve the digital service capability of the whole life cycle, such as production, circulation, marketing, and R&D.
In addition, there should be a reasonable understanding of the relationship between the construction of digital villages and the stage of economic development. Based on the empirical and phenomenal perception that rural digitalization is slower for areas with lagging economic development, most governments generally use GDP per capita as an influential reference index when selecting pilot digital villages [73]. In fact, the direct influence of GDP per capita is not prominent, and it is more often combined with other factors to exert an interactive effect. Therefore, the weight of GDP per capita in the decision-making process of digital village pilot selection or rural digital development should be weakened in the future, and the optimal combination of different resources and measures should be promoted according to their interaction with other factors to accelerate the digitalization process and help rural revitalization.
4. Discussion
4.1. Driving Mechanism
The different counties in Guangxi show large differences in the level of rural digital development and evolutionary patterns, with significant spatial effects (agglomeration and autocorrelation), and their mechanisms driving are very complex. By comparing the results of the analysis of the digital village index and the evolution model of the digital village index, the influencomg factors were classified into generic and nongeneric types. In terms of the generic factors, population density (), added value of tertiary industry (), total retail sales of consumer goods (), financial revenue (), and per capita income of farmer () were high-impact factors; permanent population (), urbanization rate (), investment in fixed assets (), and financial self-sufficiency rate () were low-impact factors; per capita GDP () was an interaction factor. Their mechanisms in driving the regional differences and evolutionary patterns of the digital village index are similar and can be left undifferentiated in the policy design process. In terms of nongeneric factors, per capita consumption expenditure of farmers () and the urban–rural income gap index () had a more significant impact on the difference in the level of digital development of villages; gross domestic product () and added value of primary industry () had a stronger influence on the evolution model of the digital village index. It is important to note that the added value of secondary industry () could only exert influence on the digital village index depending on its interactive effects and had both direct and interactive influence on the evolution model of the digital village index (Figure 9).
Some of the findings of this study are supported by those of other scholars. First, in terms of development characteristics, Rey-Alvite and Fernandez-Crehuet [74] found large differences in smart village development goals, needs, current progress, and characteristics between different EU countries; Adamowicz [75], Zhu and Chen [76] found significant differences in the level of smart village/rural digitalization with spatial clustering and autocorrelation between different provinces in Poland and China. We also found that rural digitalization at the county scale in Guangxi shows significant spatial agglomeration, heterogeneity, and correlation in the development level and evolution model, and achieving the balanced development of rural digitalization and intelligence in the future will require considerable work. The great differences in development environment, resource conditions, investment and support intensity, start-up time, and construction mode in different regions mean that rural digital development process inequality is a universal phenomenon [77]. Unlike the aforementioned scholars, this paper focused on the county scale, and the conclusions are more refined than those at national or provincial scales, further enhancing the precision of the research results and providing greater reference value for policy decisions.
Second, in terms of driving mechanisms, Chinn and Fairlie [78], Park [79], Ma et al. [80], and Leng [81] found that income, international trade, urbanization rate, population, education level, government credit support, and employment status are important factors affecting rural digital inequality through empirical studies at the country scale. Li [82] found that population density, industrial structure, and economic development level significantly influence the digital development of provincial villages in China, and Zhang [83] further pointed out that farmers’ income plays a significant positive mediating role in rural digitalization. The findings of these studies corroborate with the results of the analysis in this study and are of significant reference value. Different from them, we discussed the direct influence of different factors and further analyzed the synergistic relationship of factor interaction, which is an original and new exploration [84]. Additionally, most researchers have used statistical regression methods, but we used a spatial econometric model in the analysis process, with consideration of the spatial effects of the development and evolution of rural digitalization, further improving the accuracy of the results.
4.2. Impact of COVID-19
The outbreak of COVID-19 has significantly accelerated rural digitalization, but it was not included in the framework of our quantitative analysis due to data and information limitations. However, its influence should not be ignored, and we could detect it sign in some phenomena.
First, the COVID-19 pandemic has significantly increased the popularity of online shopping in rural areas and accelerated the digitization of the rural economy. The COVID-19 pandemic has restricted and isolated offline shopping and consumption, resulting in the rapid growth of e-commerce in rural areas. In 2021, Guangxi built 607 new service sites and 582 logistics distribution outlets, created 56,500 jobs relying on rural e-commerce, with online retail sales of agricultural products amounting to RMB 8.892 billion, and cultivated 4,678 single agricultural products for online sales (from the data released on the official website of Guangxi government the same applies below). Many middle-aged and elderly villagers have shared their first shopping experience using online trading platforms such as Taobao, Jingdong, Pinduoduo, Suning, and Live Streaming Platform, as well as the joy of harvesting “treasures” in their WeChat Moments and social platforms such as TikTok.
Second, the COVID-19 pandemic has profoundly changed the rural governance model and served as an accelerant of the digital transformation of rural healthcare, education, social security, infrastructure, and public service facilities. Many village, government, and legal affairs are handled through cloud platforms such as DingTalk and Tencent Meeting, which has significantly improved village management efficiency and villagers’ satisfaction. With the help of cloud medical and education apps, the elderly at home with limited mobility can receive remote diagnosis and treatment online, and children quarantined at home have continued their studies.
Of note is that the COVID-19 pandemic and rural digitalization are, to a certain extent, in a two-way promotion relationship, accelerating the bridging of the digital divide between urban and rural development in Guangxi. Notably, the outbreak of COVID-19 has forced the government to increase investment in rural information infrastructure construction. In 2021, Guangxi built 9031 4G base stations to achieve full 4G network coverage in natural villages, and more than 80% of 5G network coverage in administrative villages and all natural villages with more than 20 households were connected to fiber-optic networks. Additionally, Guangxi makes full use of information infrastructure and digital means to carry out regular pandemic prevention and control in rural areas, constantly improving the scientific and precise response to and control of COVID-19 in rural areas.
5. Conclusions
Digitalization is a key way to achieve sustainable rural development [85], and quantitatively measuring the level of development, evolutionary patterns, and driving mechanisms of digital and smart villages is important for the scientific formulation of management policies and spatial planning. The following conclusions were reached from the empirical study of Guangxi: (1) Regional inequalities and imbalances in the level of digital development in rural Guangxi are prominent and show significant spatial clustering and correlation. In this study, the 70 counties in Guangxi were divided into leader, follower and straggler levels according to the level of digital village construction, and the counties at different levels were clustered or banded with positive spatial autocorrelation. (2) The evolution model of the Guangxi digital village index included four types: star, cow, gazelle, and dog, and the geographical distribution of different types showed positive spatial autocorrelation, with the cold and hot spots forming a center–periphery structure. (3) The direct influence of different factors greatly varied, including that of generic and nongeneric factors. The former was further divided into high-impact factors (such as population density) and low-impact factors (such as financial self-sufficiency rate); the latter as further divided into high-impact factors of the digital village index (such as per capita consumption expenditure of farmer) and the evolution model of the digital village index (e.g., gross domestic product). (4) The synergistic effect between different factors was very significant, and the interaction relationship of factor pairs was characterized by nonlinear enhancement and bifactor enhancement, dominated by the former. The interactive influence of different factor pairs was quite different, being much higher than the direct impact (which can be much larger), and the driving mechanism was very complex. Notably, the direct influence of per capita GDP was very weak and not statistically significant. It can be considered to be entirely dependent on interactive effects to produce its impact. (5) Based on the results of the analysis, suggestions for rural digital development of villages were proposed, including highlighting government-driven mechanisms and regional linkages, formulating differentiated management policies, strengthening systematic planning and extensive participation, and steadily promoting the sustainable development of digital villages.
The greatest innovation of this study is the construction of a digital village analysis framework that integrates grade evaluation, an evolution model, the driving mechanisms, and policy design, and the research method and results are applicable not only to China but also to similar countries in the world. Global rural digitization is in the exploratory stage, and the case analysis and empirical study on China can provide a reference and basis for countries and regions that are committed to the construction of smart villages such as the EU, U.K., U.S., Russia, India, Australia, and the UAE [86]. This study also has shortcomings, such as a short study period due to the limitations on data availability and the development stage; the short study period led to an inadequate analysis of the effects of government interventions due to the lag in the effects of policy implementation. In addition, rural digitalization is influenced not only by economic and social factors but also by the natural environment and technological development, ere ware not included in the research framework in this study due to difficulties in accessing data. On the whole, the research framework, methodology, and results of this study provide a quantitative basis for government management and social participation and provide valuable references for analyzing the dynamics of digital village construction, designing development policies, and formulating spatial plans and programs.
Author Contributions
Conceptualization, S.Z. and W.L.; methodology, W.L. and S.Z.; software, K.Z. and S.Z.; validation, W.L., S.Z. and P.Z.; formal analysis, P.Z. and H.C.; investigation, W.L., P.Z. and S.Z.; resources, S.Z., K.Z. and P.Z.; data curation, K.Z. and S.Z.; writing—original draft preparation, W.L., P.Z. and K.Z.; writing—review and editing, S.Z. and H.C.; visualization, S.Z. and K.Z.; supervision, W.L. and H.C.; project administration, P.Z. and H.C.; funding acquisition, P.Z. and H.C. All authors have read and agreed to the published version of the manuscript.
Funding
This research was funded by Natural Science Foundation of Gansu Province (20JR5RA415) and Humanity and Social Science foundation of Ministry of Education of China (22YJAZH006) and National Natural Science Foundation of China (project number: 51768029).
Institutional Review Board Statement
Not applicable.
Informed Consent Statement
Not applicable.
Data Availability Statement
The data used in this paper mainly came from the Gansu Provincial Bureau of Statistics (http://tjj.gansu.gov.cn/tjj/c109464/info_disp.shtml, 11 March 2022).and Peking University Open Research Data Platform (http://tjj.gansu.gov.cn/tjj/c109464/info_disp.shtml, 27 October 2022).
Acknowledgments
All the authors are grateful to the reviewers and editors.
Conflicts of Interest
The authors declare no conflict of interest.
References
- Shuldiner, A. The Smart Village. IEEE Pervasive Comput. 2020, 19, 83–86. [Google Scholar] [CrossRef]
- Chenic, A.S.; Cretu, A.I.; Burlacu, A.; Moroianu, N.; Virjan, D.; Huru, D.; Stanef-Puica, M.R.; Enachescu, V. Logical Analysis on the Strategy for a Sustainable Transition of the World to Green Energy-2050. Smart Cities and Villages Coupled to Renewable Energy Sources with Low Carbon Footprint. Sustainability 2022, 14, 8622. [Google Scholar] [CrossRef]
- Gao, F.; Wang, J. International experience and enlightenment of digital rural construction. Jiangsu Agric. Sci. 2021, 49, 1–8. [Google Scholar] [CrossRef]
- Komorowski, L.; Stanny, M. Smart Villages: Where Can They Happen? Land 2020, 9, 151. [Google Scholar] [CrossRef]
- Visvizi, A.; Lytras, M.D. It’s Not a Fad: Smart Cities and Smart Villages Research in European and Global Contexts. Sustainability 2018, 10, 2727. [Google Scholar] [CrossRef] [Green Version]
- Xing, Z.J. The National Logic of Digital Rural Construction. J. Jishou Univ. (Soc. Sci.) 2021, 42, 58–68. [Google Scholar] [CrossRef]
- Schmidt, H. Digital’nye dereveniki/digital villagers: Russian online projects from the countryside. Stud. East Eur. Thought 2011, 63, 95–109. [Google Scholar] [CrossRef]
- Faxon, H.O. Welcome to the Digital Village: Networking Geographies of Agrarian Change. Ann. Am. Assoc. Geogr. 2022, 112, 2096–2110. [Google Scholar] [CrossRef]
- Satola, L.; Milewska, A. The Concept of a Smart Village as an Innovative Way of Implementing Public Tasks in the Era of Instability on the Energy Market-Examples from Poland. Energies 2022, 15, 5175. [Google Scholar] [CrossRef]
- Budziewicz-Guzlecka, A.; Drozdz, W. Development and Implementation of the Smart Village Concept as a Challenge for the Modern Power Industry on the Example of Poland. Energies 2022, 15, 603. [Google Scholar] [CrossRef]
- Ciolac, R.; Iancu, T.; Popescu, G.; Adamov, T.; Feher, A.; Stanciu, S. Smart Tourist Village-An Entrepreneurial Necessity for Maramures Rural Area. Sustainability 2022, 14, 8914. [Google Scholar] [CrossRef]
- Leong, C.; Pan, S.L.; Newell, S.; Cui, L.L. The Emergence of Self-Organizing E-Commerce Ecosystems in Remote Villages of China: A Tale of Digital Empowerment for Rural Development. MIS Q. 2016, 40, 475–484. [Google Scholar] [CrossRef]
- Hu, X.Q. Optimization of Rural Smart Tourism Service Model with Internet of Things. Secur. Commun. Netw. 2022, 2022, 6004728. [Google Scholar] [CrossRef]
- Li, H. Study on the Development Model of Rural Smart Tourism Based on the Background of Internet of Things. Wirel. Commun. Mob. Comput. 2022, 2022, 9688023. [Google Scholar] [CrossRef]
- Ho, W.S.; Hashim, H.; Lim, J.S. Integrated biomass and solar town concept for a smart eco-village in Iskandar Malaysia (IM). Renew. Energy 2014, 69, 190–201. [Google Scholar] [CrossRef]
- Huang, Z.M.; Liang, Y.M. Digital protection and inheritance of ancient villages in southwest minority areas under the strategy of rural revitalization. Technol. Forecast. Soc. Chang. 2020, 160, 120238. [Google Scholar] [CrossRef]
- Qi, T.J.; Ma, L.Q.; Zhou, W.H.; Dai, L.X. Traditional village digital archival conservation: A case study from Gaoqian, China. Arch. Rec.-J. Arch. Rec. Assoc. 2022, 17. [Google Scholar] [CrossRef]
- Mohanty, S.P. Low-Cost Consumer Technology Can Help to Build Sustainable Smart Villages. IEEE Consum. Electron. Mag. 2021, 10, 4–5. [Google Scholar] [CrossRef]
- Stojanova, S.; Lentini, G.; Niederer, P.; Egger, T.; Cvar, N.; Kos, A.; Duh, E.S. Smart Villages Policies: Past, Present and Future. Sustainability 2021, 13, 1663. [Google Scholar] [CrossRef]
- Randell-Moon, H.E.K.; Hynes, D. ‘Too smart’: Infrastructuring the Internet through regional and rural smart policy in Australia. Policy Internet 2022, 14, 151–169. [Google Scholar] [CrossRef]
- McGuire, R.; Longo, A.; Sherry, E. Tackling poverty and social isolation using a smart rural development initiative. J. Rural Stud. 2022, 89, 161–170. [Google Scholar] [CrossRef]
- Wojcik, M.; Dmochowska-Dudek, K.; Tobiasz-Lis, P. Boosting the Potential for GeoDesign: Digitalisation of the System of Spatial Planning as a Trigger for Smart Rural Development. Energies 2021, 14, 3895. [Google Scholar] [CrossRef]
- Bielska, A.; Stanczuk-Galwiaczek, M.; Sobolewska-Mikulska, K.; Mroczkowski, R. Implementation of the smart village concept based on selected spatial patterns-A case study of Mazowieckie Voivodeship in Poland. Land Use Policy 2021, 104, 105366. [Google Scholar] [CrossRef]
- Zavratnik, V.; Kos, A.; Duh, E.S. Smart Villages: Comprehensive Review of Initiatives and Practices. Sustainability 2018, 10, 2559. [Google Scholar] [CrossRef] [Green Version]
- Li, J. Application of Spatial-Temporal Behavioral Trajectory Analysis in the Space Design of Digital Villages. Wirel. Commun. Mob. Comput. 2022, 2022, 2304820. [Google Scholar] [CrossRef]
- Ogryzek, M.; Krupowicz, W.; Sajnog, N. Public Participation as a Tool for Solving Socio-Spatial Conflicts of Smart Cities and Smart Villages in the Sustainable Transport System. Remote Sens. 2022, 13, 4821. [Google Scholar] [CrossRef]
- Mounce, R.; Beecroft, M.; Nelson, J.D. On the role of frameworks and smart mobility in addressing the rural mobility problem. Res. Transp. Econ. 2020, 83, 100956. [Google Scholar] [CrossRef]
- Francini, M.; Chieffallo, L.; Palermo, A.; Viapiana, M.F. Estimation of the Smart Land Index: Application to the rural context of the Crati Valley. Eur. Plan. Stud. 2020, 28, 749–770. [Google Scholar] [CrossRef]
- Girbau-Llistuella, F.; Diaz-Gonzalez, F.; Sumper, A.; Gallart-Fernandez, R.; Heredero-Peris, D. Smart Grid Architecture for Rural Distribution Networks: Application to a Spanish Pilot Network. Energies 2018, 11, 844. [Google Scholar] [CrossRef] [Green Version]
- Gaggero, G.B.; Marchese, M.; Moheddine, A.; Patrone, F. A Possible Smart Metering System Evolution for Rural and Remote Areas Employing Unmanned Aerial Vehicles and Internet of Things in Smart Grids. Sensors 2021, 21, 1627. [Google Scholar] [CrossRef] [PubMed]
- Dai, W.S. Rural Financial Information Service Platform Under Smart Financial Environment. IEEE Access 2020, 8, 199944–199952. [Google Scholar] [CrossRef]
- Wu, Y.L.; Ma, W.Y. Rural Workplace Sustainable Development of Smart Rural Governance Workplace Platform for Efficient Enterprise Performances. J. Environ. Public Health 2022, 2022, 1588638. [Google Scholar] [CrossRef] [PubMed]
- Murty, V.K.; Shankar, S.S. Towards a Scalable Architecture for Smart Villages: The Discovery Phase. Sustainability 2020, 12, 7580. [Google Scholar] [CrossRef]
- Kaur, P.; Parashar, A. A Systematic Literature Review of Blockchain Technology for Smart Villages. Arch. Comput. Methods Eng. 2021, 29, 2417–2468. [Google Scholar] [CrossRef] [PubMed]
- Ram, S.K.; Das, B.B.; Mahapatra, K.; Mohanty, S.P.; Choppali, U. Energy Perspectives in IoT Driven Smart Villages and Smart Cities. IEEE Consum. Electron. Mag. 2021, 10, 19–28. [Google Scholar] [CrossRef]
- Cvar, N.; Trilar, J.; Kos, A.; Volk, M.; Duh, E.S. The Use of IoT Technology in Smart Cities and Smart Villages: Similarities, Differences, and Future Prospects. Sensors 2020, 20, 3897. [Google Scholar] [CrossRef]
- Flores-Martin, D.; Rojo, J.; Moguel, E.; Berrocal, J.; Murillo, J.M. Smart Nursing Homes: Self-Management Architecture Based on IoT and Machine Learning for Rural Areas. Wirel. Commun. Mob. Comput. 2021, 2021, 8874988. [Google Scholar] [CrossRef]
- Huang, R.L. Construction of Rural Governance Digital Driven by Artificial Intelligence and Big Data. Math. Probl. Eng. 2022, 2022, 8145913. [Google Scholar] [CrossRef]
- Wu, Y.Z. The Path of Agricultural Policy Finance in Smart Service for Rural Revitalization under Big Data Technology. Mob. Inf. Syst. 2022, 2022, 9113683. [Google Scholar] [CrossRef]
- Maja, P.W.; Meyer, J.; Von Solms, S. Development of Smart Rural Village Indicators in Line with Industry 4.0. IEEE Access 2020, 8, 152017–152033. [Google Scholar] [CrossRef]
- Zhao, J.J.; Sun, X.L.; Su, L.L. The Impacts of Digital Rural Development on Rural Household Consumption—Evidence from China family panel studies and digital rural county index. J. China Agric. Univ. (Soc. Sci.) 2022, 39, 114–132. [Google Scholar] [CrossRef]
- Su, L.L.; Peng, Y.L. The evaluation and driving factors of farmers’ participation practice in digital village construction. J. Huazhong Agric. Univ. (Soc. Sci. Ed.) 2021, 226, 168–179+199–200. [Google Scholar] [CrossRef]
- Chen, H.; Zhao, S.; Zhang, P.; Zhou, Y.; Li, K. Dynamics and Driving Mechanism of Real Estate in China’s Small Cities: A Case Study of Gansu Province. Buildings 2022, 12, 1512. [Google Scholar] [CrossRef]
- Kaya, M.C.; Persson, L. A Theory of Gazelle Growth: Competition, Venture Capital Finance and Policy. N. Am. J. Econ. Financ. 2020, 50, 101019. [Google Scholar] [CrossRef] [Green Version]
- Bonilla, J.C.L.; Vidal, J.A. Gazelle Companies: Definition and Characterization. Acad.-Rev. Latinoam. Adm. 2012, 50, 31–43. [Google Scholar]
- Rocha, R.G.; Ferreira, J.J. Gazelles (High-Growth) Companies: A Bibliometric Science Map of the Field. J. Knowl. Econ. 2021, 13, 2911–2934. [Google Scholar] [CrossRef]
- Zhang, P.; Hu, J.; Zhao, K.; Chen, H.; Zhao, S.; Li, W. Dynamics and Decoupling Analysis of Carbon Emissions from Construction Industry in China. Buildings 2022, 12, 257. [Google Scholar] [CrossRef]
- Wang, B.; Zhao, J.; Hu, X.F. Analysison trade-offs and synergistic relationships among multiple ecosystem services in the Shiyang River Basin. Acta Ecol. Sin. 2018, 38, 7582–7595. [Google Scholar] [CrossRef]
- Li, W.; Zhang, P.; Zhao, K.; Zhao, S. The Geographical Distribution and Influencing Factors of COVID-19 in China. Trop. Med. Infect. Dis. 2022, 7, 45. [Google Scholar] [CrossRef]
- Zhao, S.; Zhao, K.; Yan, Y.; Zhu, K.; Guan, C. Spatio-Temporal Evolution Characteristics and Influencing Factors of Urban Service-Industry Land in China. Land 2022, 11, 13. [Google Scholar] [CrossRef]
- Wang, J.F.; Li, X.H.; Christakos, G.; Liao, Y.L.; Zhang, T.; Gu, X.; Zheng, X.Y. Geographical detectors-based health risk assessment and its application in the neural tube defects study of the Heshun region, China. Int. J. Geogr. Inf. Sci. 2010, 24, 107–127. [Google Scholar] [CrossRef]
- Wang, J.F.; Hu, Y. Environmental health risk detection with GeogDetector. Environ. Model. Softw. 2012, 33, 114–115. [Google Scholar] [CrossRef]
- Ma, Y.; Zhang, P.; Zhao, K.; Zhou, Y.; Zhao, S. A Dynamic Performance and Differentiation Management Policy for Urban Construction Land Use Change in Gansu, China. Land 2022, 11, 942. [Google Scholar] [CrossRef]
- Zhao, S.; Zhang, C.; Qi, J. The Key Factors Driving the Development of New Towns by Mother Cities and Regions: Evidence from China. ISPRS Int. J. Geo-Inf. 2021, 10, 223. [Google Scholar] [CrossRef]
- Zhao, S.; Li, W.; Zhao, K.; Zhang, P. Change Characteristics and Multilevel Influencing Factors of Real Estate Inventory—Case Studies from 35 Key Cities in China. Land 2021, 10, 928. [Google Scholar] [CrossRef]
- Zhang, H.; Du, K.W.; Jin, B.Y. Research on Evaluation of Digital Rural Development Readiness under Rural Revitalization Strategy. J. Xi’an Univ. Financ. Econ. 2020, 33, 51–60. [Google Scholar]
- Wu, Y. Research on the construction of evaluation index system for digital rural development. Jiangxi J. Agric. 2022, 34, 236–241. [Google Scholar] [CrossRef]
- Liu, L.H.; Zhang, Y.X.; Bi, Y.M. Digital Village Construction Boosts Rural Revitalization: Internal Mechanism and Empirical Test. World Agric. 2022, 44, 51–65. [Google Scholar] [CrossRef]
- Digital Village Project of Institute of New Rural Development, 2022. Index of Digital Rural County 2020. Peking University Open Research Data Platform, V1, UNF:6: SURFBGrjqDsPNHAsoV4PjQ== [fileUNF]. Available online: https://opendata.pku.edu.cn/dataset.xhtml?persistentId=doi:10.18170/DVN/ZVDQTR (accessed on 6 December 2022).
- Chen, W.; Wang, Q.Z.; Zhou, H. Digital Rural Construction and Farmers’ Income Growth: Theoretical Mechanism and Micro Experience Based on Data from China. Sustainability 2022, 14, 11679. [Google Scholar] [CrossRef]
- Zhao, S.D.; Zhao, K.X.; Zhang, P. Spatial Inequality in China’s Housing Market and the Driving Mechanism. Land 2021, 10, 841. [Google Scholar] [CrossRef]
- Li, L.; Zhao, K.; Wang, X.; Zhao, S.; Liu, X.; Li, W. Spatio-Temporal Evolution and Driving Mechanism of Urbanization in Small Cities: Case Study from Guangxi. Land 2022, 11, 415. [Google Scholar] [CrossRef]
- Zhao, S.; Yan, Y.; Han, J. Industrial Land Change in Chinese Silk Road Cities and Its Influence on Environments. Land 2021, 10, 806. [Google Scholar] [CrossRef]
- Zhang, P.; Li, W.; Zhao, K.; Zhao, S. Spatial Pattern and Driving Mechanism of Urban–Rural Income Gap in Gansu Province of China. Land 2021, 10, 1002. [Google Scholar] [CrossRef]
- Ouyang, D.; Zhu, X.; Liu, X.; He, R.; Wan, Q. Spatial Differentiation and Driving Factor Analysis of Urban Construction Land Change in County-Level City of Guangxi, China. Land 2021, 10, 691. [Google Scholar] [CrossRef]
- Xing, Q.F.; Yao, W.Y. Digital governance and its benchmarking college talent training under the rural revitalization in China-A case study of Yixian County (China). Front. Public Health 2022, 10, 984427. [Google Scholar] [CrossRef]
- Tong, Z.H.; Liu, C.L. County-level promotion, village-level Acceptance and Performance in Rural Governance Digitalization—A comparative study of the five leading counties in Zhejiang Province. J. China Agric. Univ. (Soc. Sci.) 2022, 39, 42–52. [Google Scholar] [CrossRef]
- Zhang, P.; Li, W.; Zhao, K.; Zhao, Y.; Chen, H.; Zhao, S. The Impact Factors and Management Policy of Digital Village Development: A Case Study of Gansu Province, China. Land 2023, 12, 616. [Google Scholar] [CrossRef]
- Escalona-Orcao, A.I.; Escolano-Utrilla, S. Potential for smart development of rural areas. The clusters Activities Creative in Spain. Rev. Geogr. Norte Gd. 2016, 65, 91–107. [Google Scholar] [CrossRef] [Green Version]
- Zhang, X.J.; Zhang, Z.G. How Do Smart Villages Become a Way to Achieve Sustainable Development in Rural Areas? Smart Village Planning and Practices in China. Sustainability 2021, 12, 10510. [Google Scholar] [CrossRef]
- Fennell, S.; Kaur, P.; Jhunjhunwala, A.; Narayanan, D.; Loyola, C.; Bedi, J.; Singh, Y. Examining linkages between Smart Villages and Smart Cities: Learning from rural youth accessing the internet in India. Telecommun. Policy 2018, 42, 810–823. [Google Scholar] [CrossRef]
- Zhao, S.; Zhang, P.; Li, W. A Study on Evaluation of Influencing Factors for Sustainable Development of Smart Construction Enterprises: Case Study from China. Buildings 2021, 11, 221. [Google Scholar] [CrossRef]
- Warren, M. The digital vicious cycle: Links between social disadvantage and digital exclusion in rural areas. Telecommun. Policy 2007, 31, 374–388. [Google Scholar] [CrossRef]
- Rey-Alvite, A.; Fernandez-Crehuet, J.M. Smart Rural: Current status of the intelligent, technological, social, and sustainable rural development in the European Union(dagger). Innov.-Eur. J. Soc. Sci. Res. 2020, 34, 136–158. [Google Scholar] [CrossRef]
- Adamowicz, M. The Potential for Innovative and Smart Rural Development in the Peripheral Regions of Eastern Poland. Agriculture 2021, 11, 188. [Google Scholar] [CrossRef]
- Zhu, H.; Chen, H. Level measurement, spatial-temporal evolution and promotion path of digital village development in China. Agric. Econ. Issues 2022, 7, 210–223. [Google Scholar] [CrossRef]
- Rahoveanu, M.M.T.; Serban, V.; Zugravu, A.G.; Rahoveanu, A.T.; Cristea, D.S.; Nechita, P.; Simionescu, C.S. Perspectives on Smart Villages from a Bibliometric Approach. Sustainability 2022, 14, 10723. [Google Scholar] [CrossRef]
- Chinn, M.D.; Fairlie, R.W. The determinants of the global digital divide: A cross-country analysis of computer and internet penetration. Oxf. Econ. Pap.-New Ser. 2007, 59, 16–44. [Google Scholar] [CrossRef] [Green Version]
- Park, S. Digital inequalities in rural Australia: A double jeopardy of remoteness and social exclusion. J. Rural Stud. 2017, 54, 399–407. [Google Scholar] [CrossRef]
- Ma, W.L.; Qiu, H.G.; Rahut, D.B. Rural development in the digital age: Does information and communication technology adoption contribute to credit access and income growth in rural China? Rev. Dev. Econ. 2022, 27. [Google Scholar] [CrossRef]
- Leng, X. Digital revolution and rural family income: Evidence from China. J. Rural Stud. 2022, 94, 336–343. [Google Scholar] [CrossRef]
- Li, X.J.; Chandel, R.B.S.; Xia, X.L. Analysis on Regional Differences and Spatial Convergence of Digital Village Development Level: Theory and Evidence from China. Agriculture 2022, 12, 164. [Google Scholar] [CrossRef]
- Zhang, L.Y.; Ma, X.C. Analysis on the Path of Digital Villages Affecting Rural Residents’ Consumption Upgrade: Based on the Investigation and Research of 164 Administrative Villages in the Pilot Area of Digital Villages in Zhejiang Province. Comput. Intell. Neurosci. 2022, 2022, 9928030. [Google Scholar] [CrossRef] [PubMed]
- Kalinka, M.; Geipele, S.; Pudzis, E.; Lazdins, A.; Krutova, U.; Holms, J. Indicators for the Smart Development of Villages and Neighbourhoods in Baltic Sea Coastal Areas. Sustainability 2020, 12, 5293. [Google Scholar] [CrossRef]
- Adamowicz, M.; Zwolinska-Ligaj, M. The “Smart Village” as a Way to Achieve Sustainable Development in Rural Areas of Poland. Sustainability 2020, 12, 6503. [Google Scholar] [CrossRef]
- Dumitru, E.A.; Ursu, A.; Tudor, V.C.; Micu, M.M. Sustainable Development of the Rural Areas from Romania: Development of a Digital Tool to Generate Adapted Solutions at Local Level. Sustainability 2021, 13, 11921. [Google Scholar] [CrossRef]
Figure 1.
Location of the study area.
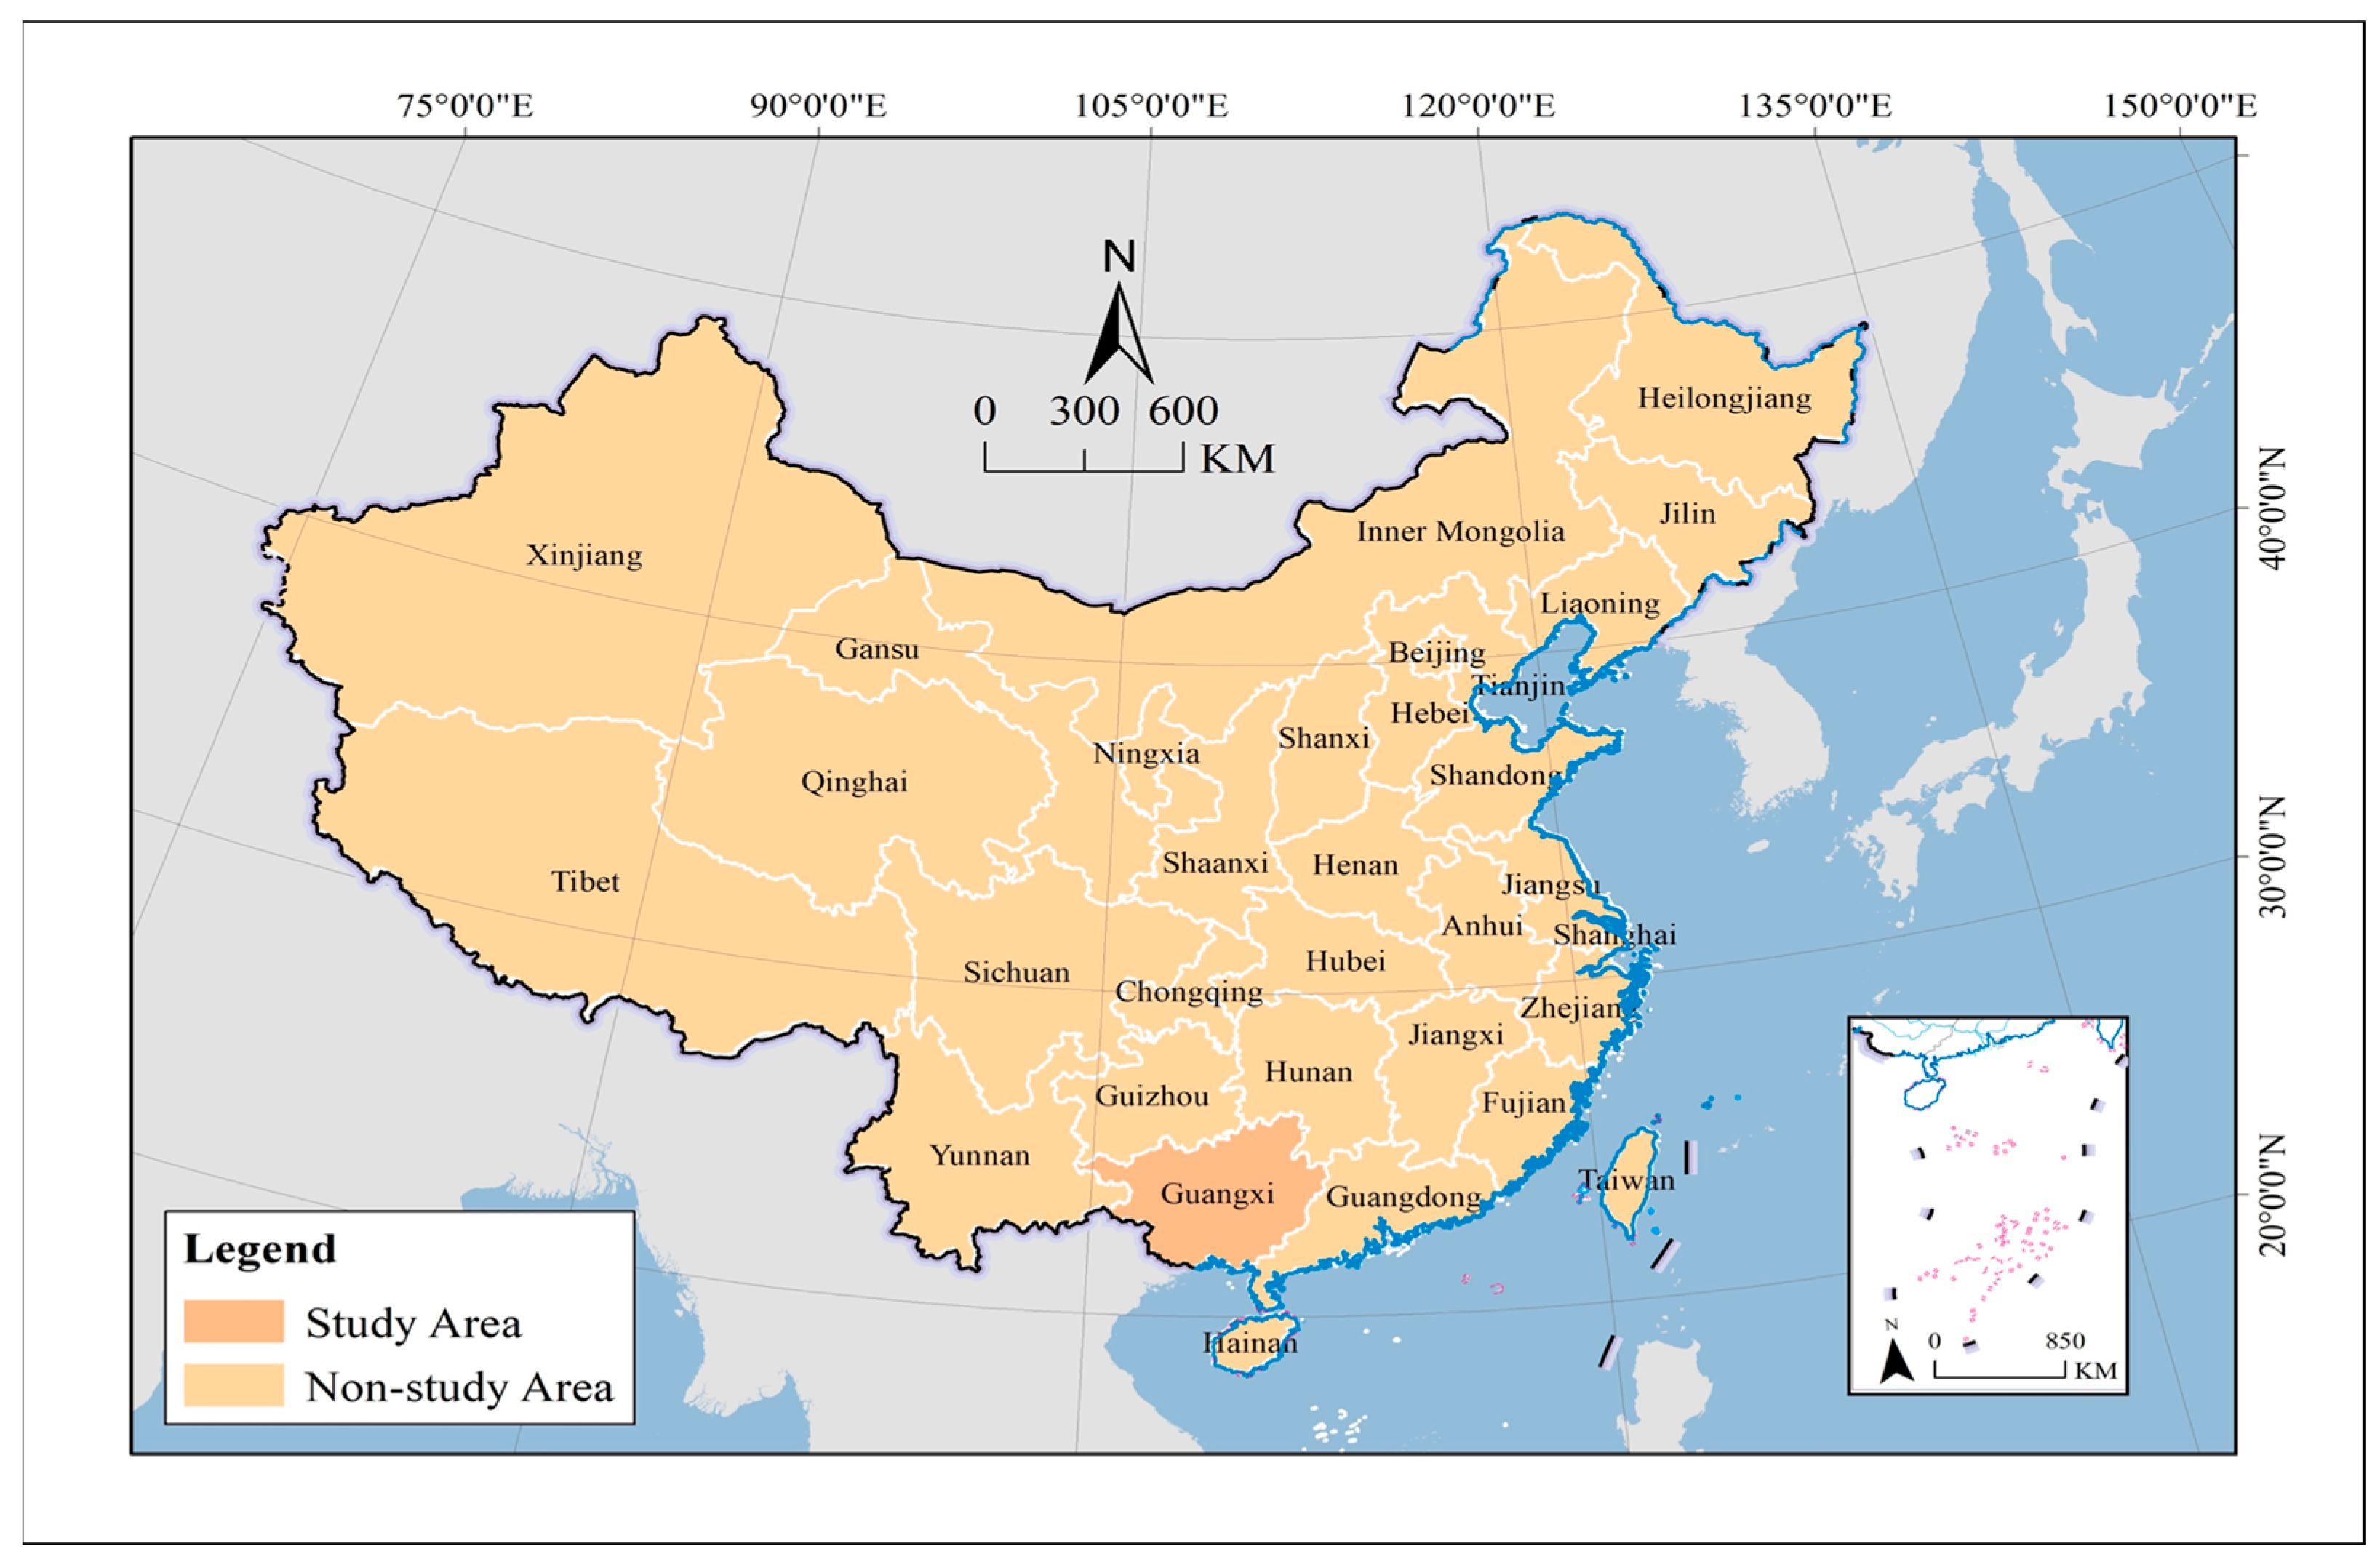
Figure 2.
Study area.
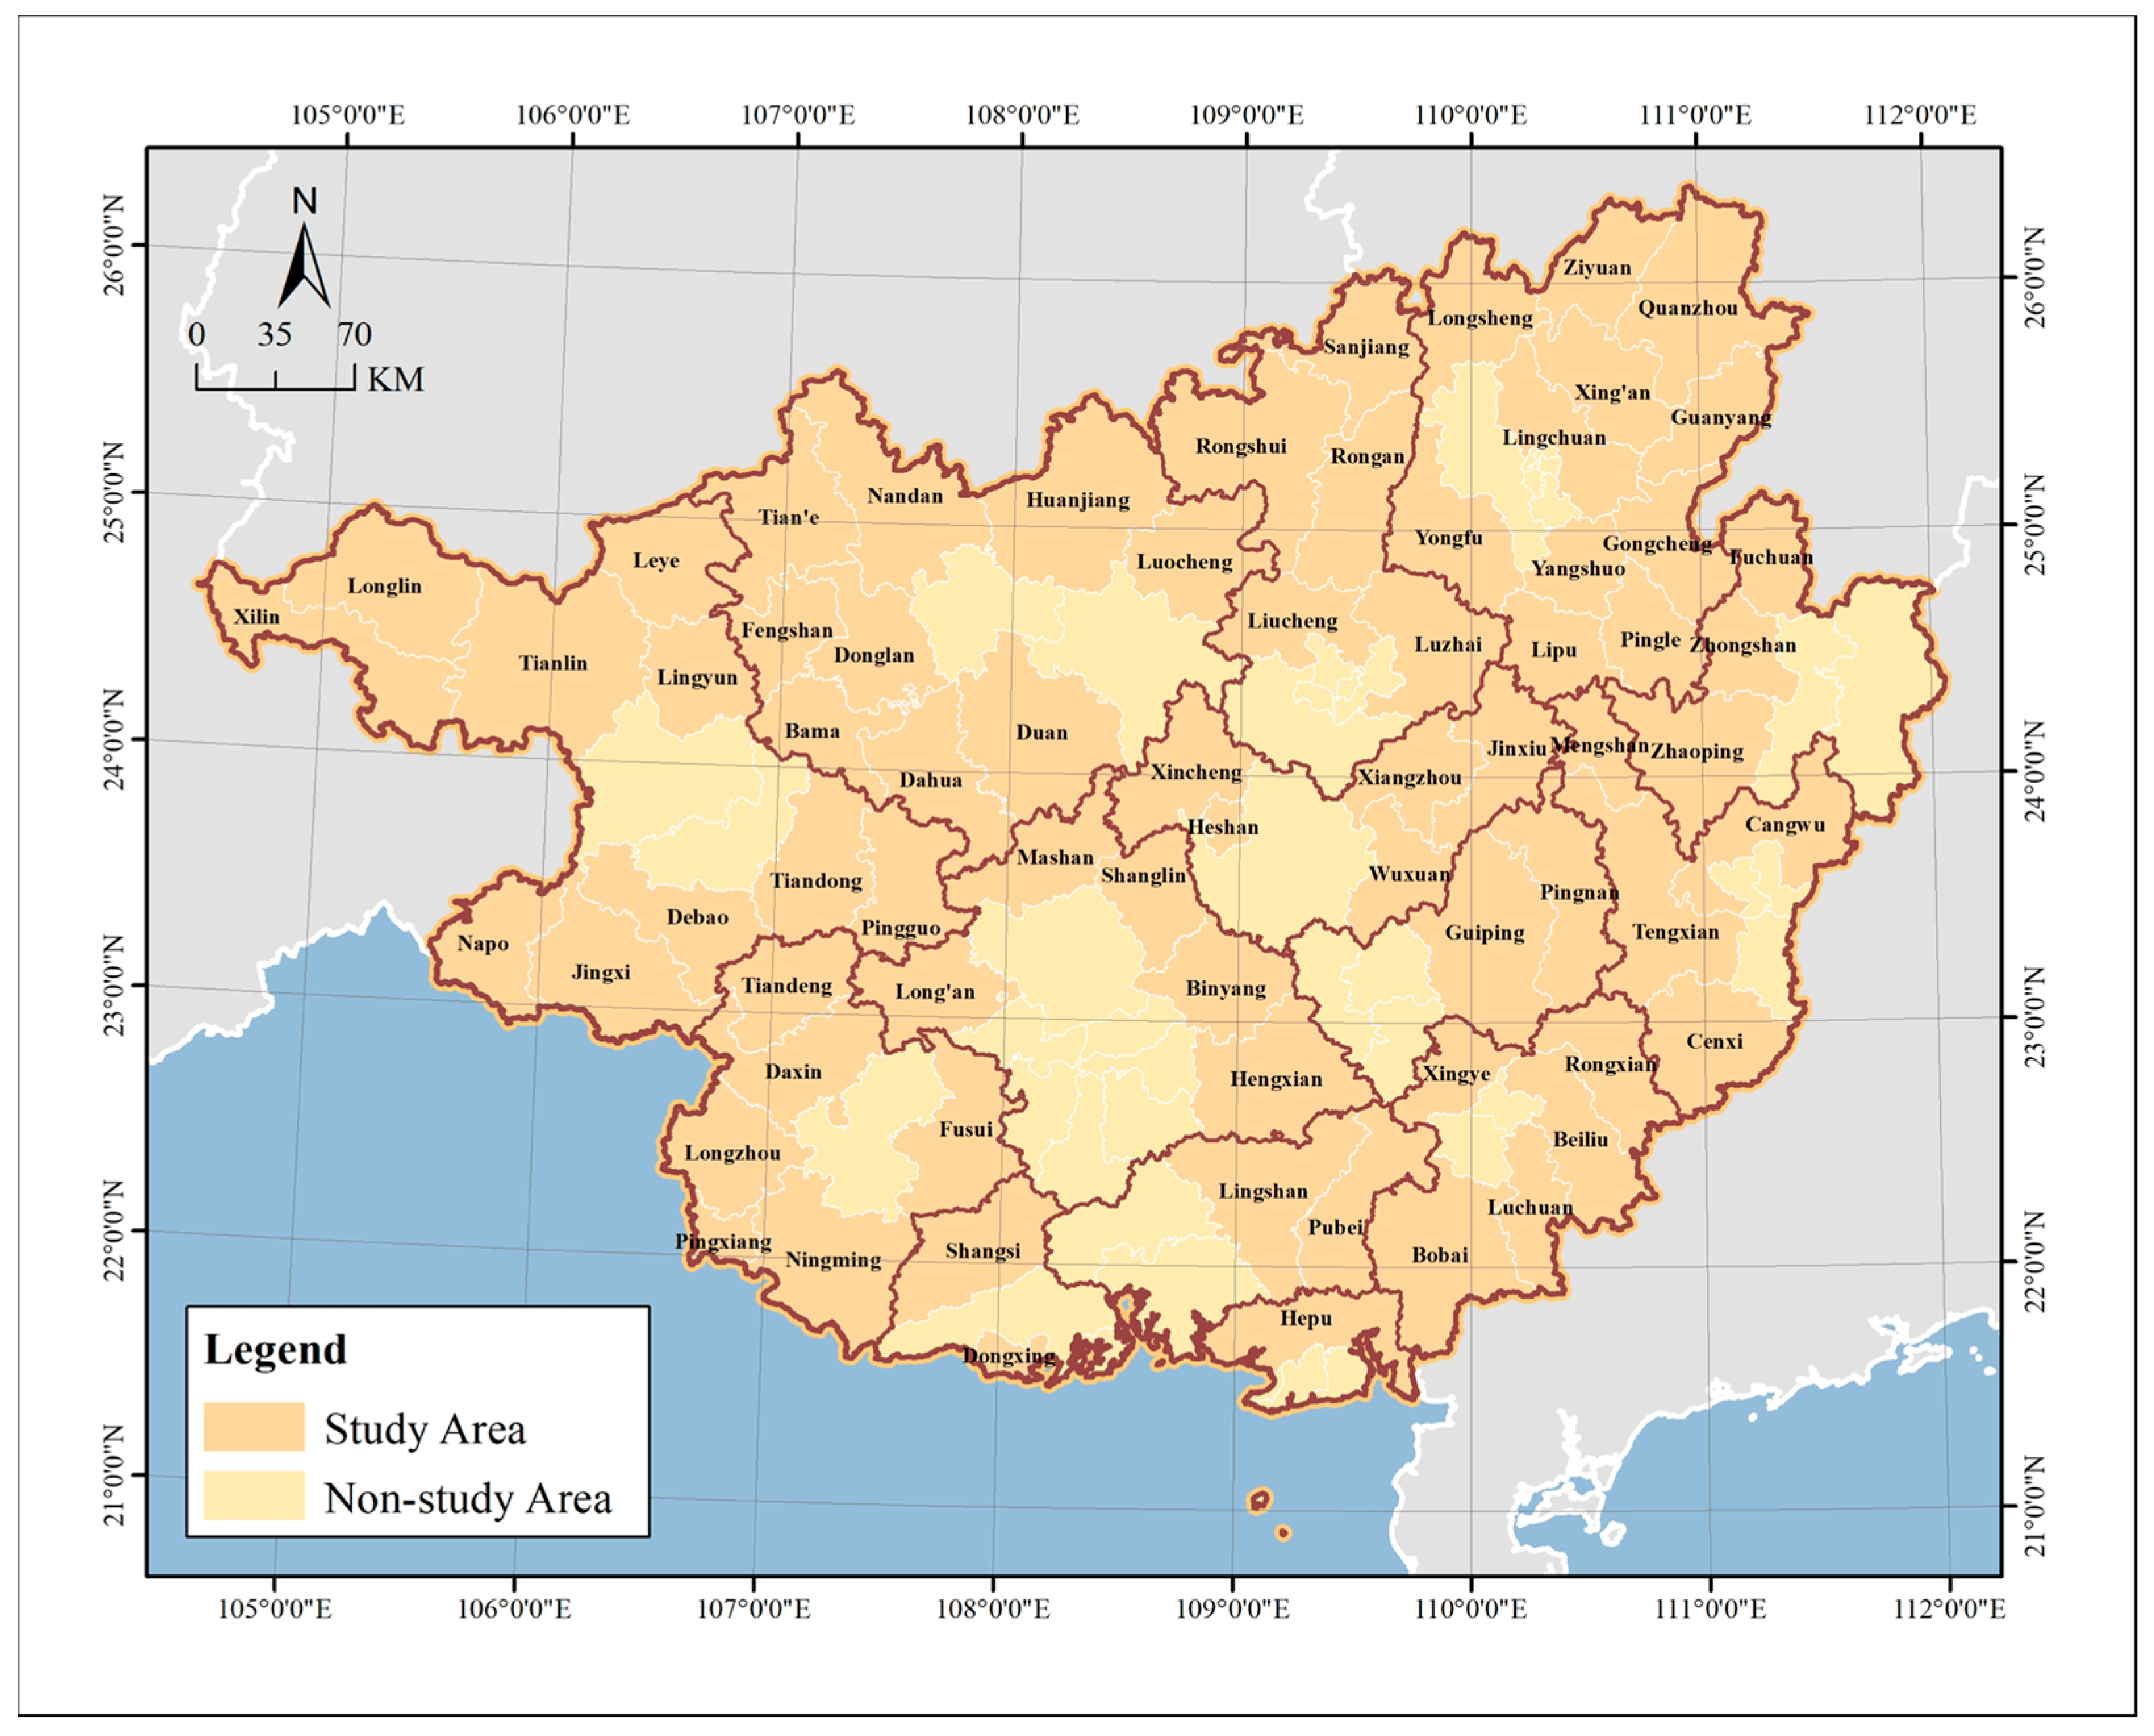
Figure 3.
Factor and interaction detector of GeoDetector.

Figure 4.
Research steps.
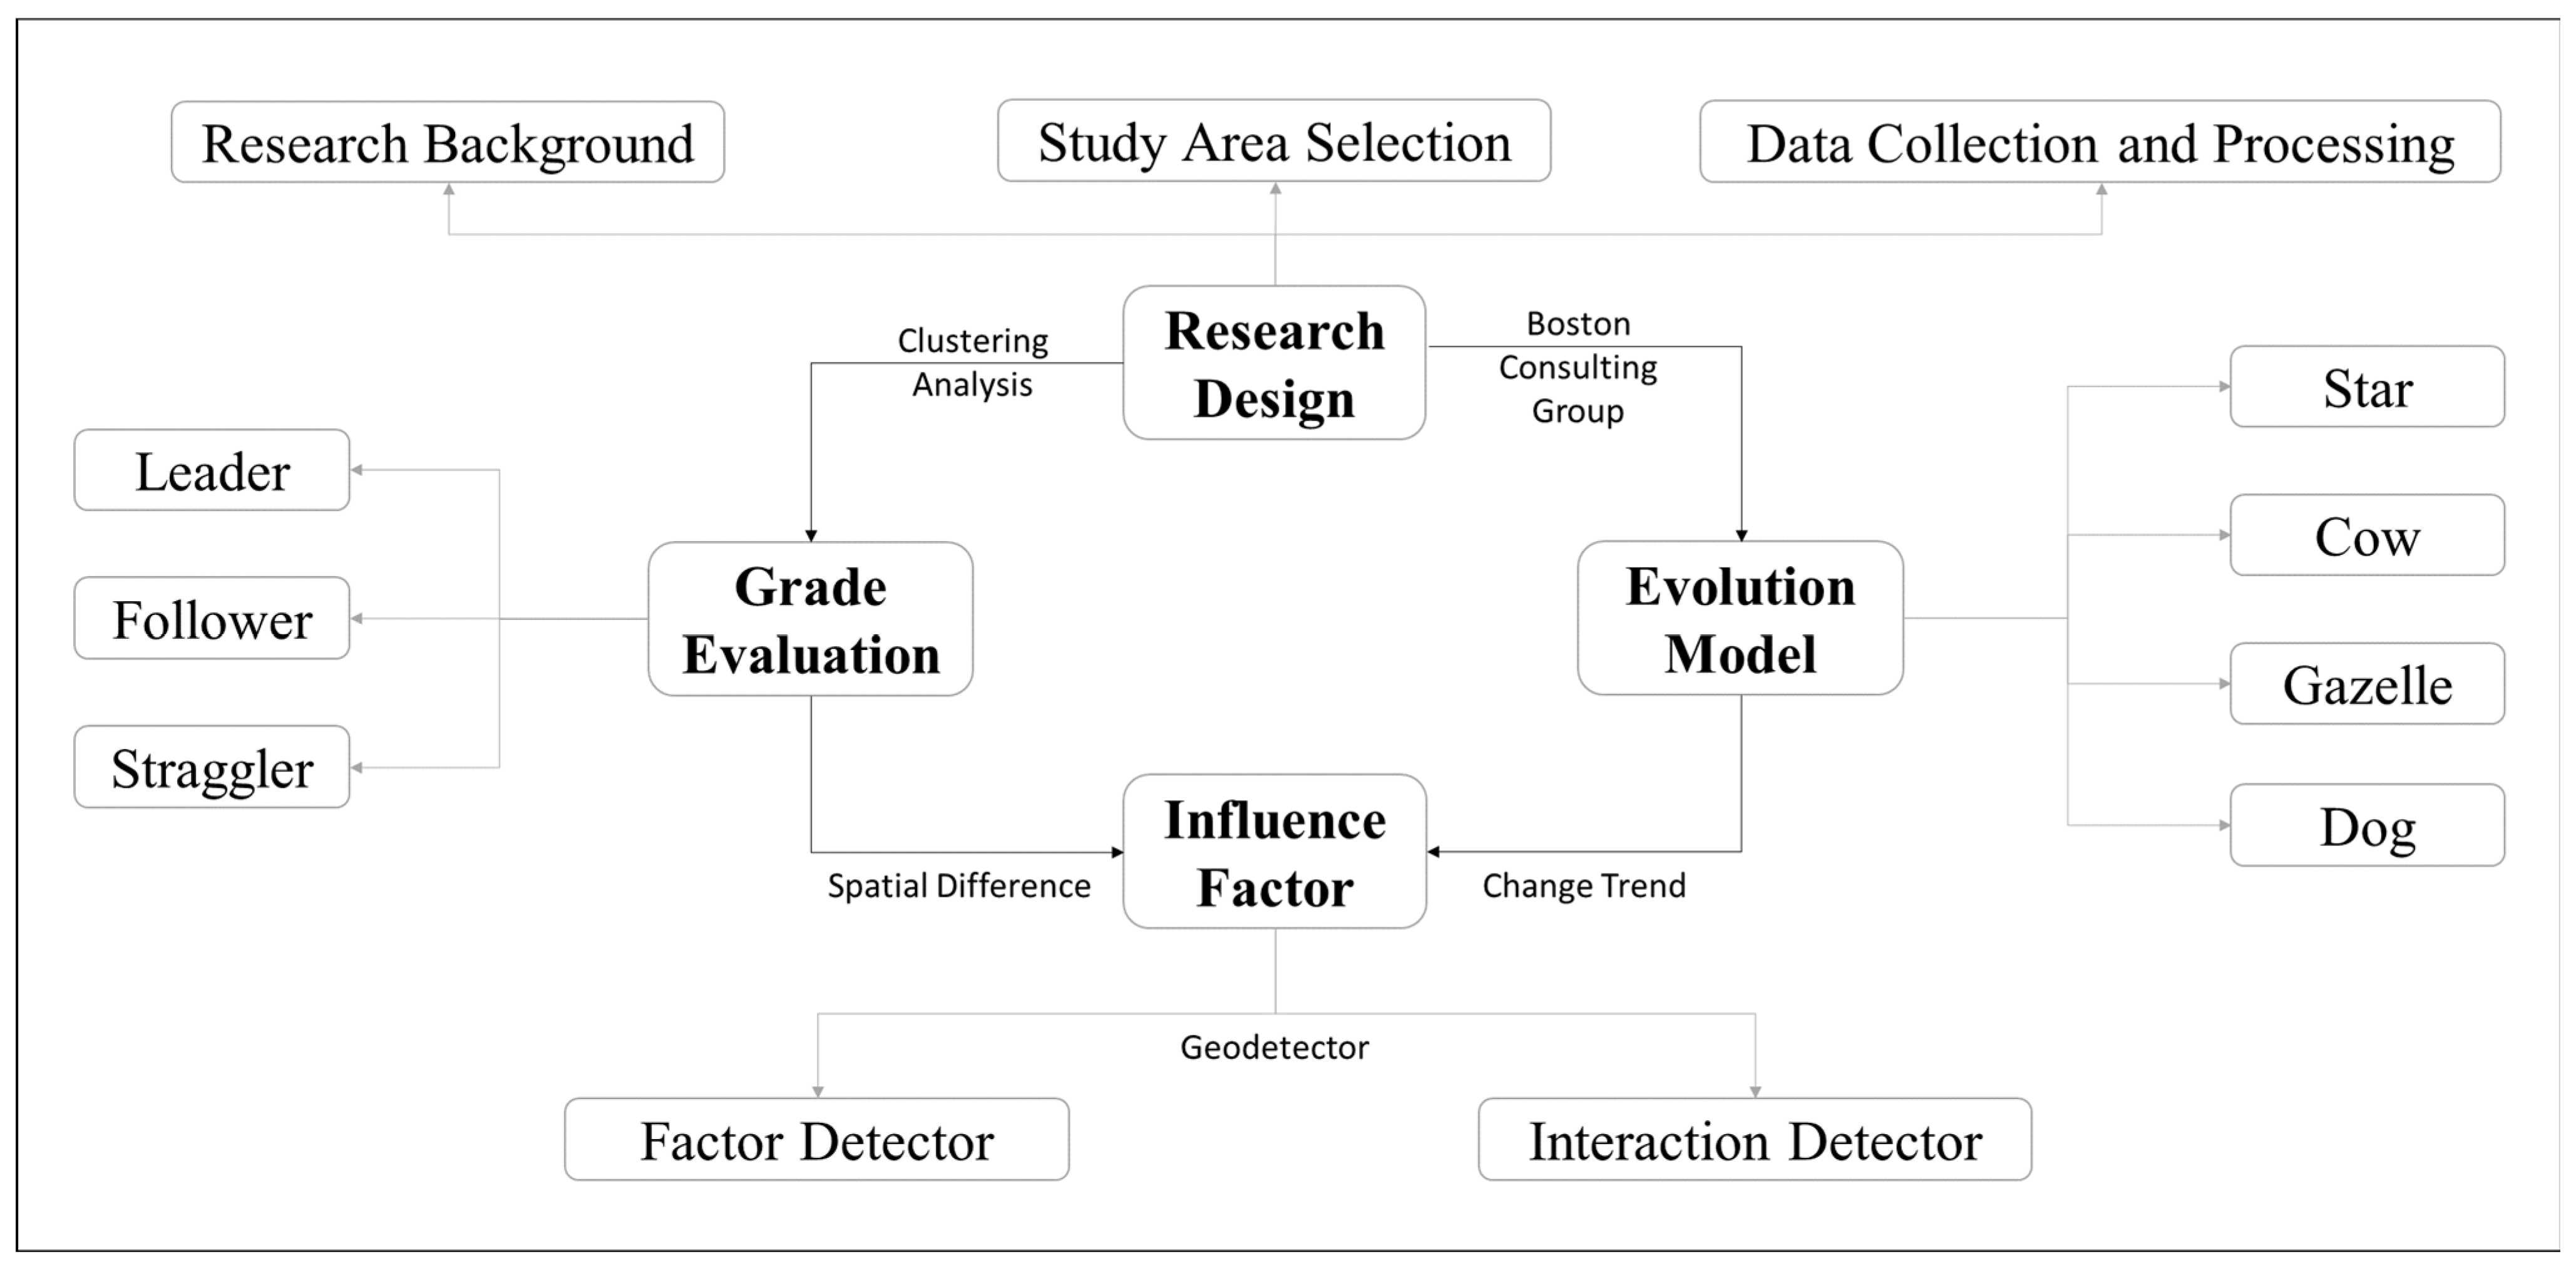
Figure 5.
Analysis of hierarchy of digital village index in 2018 and 2020.

Figure 6.
Analysis of spatial effect of digital village index in 2018 and 2020.

Figure 7.
Analysis of growth rate of digital village index in 2018 to 2020.
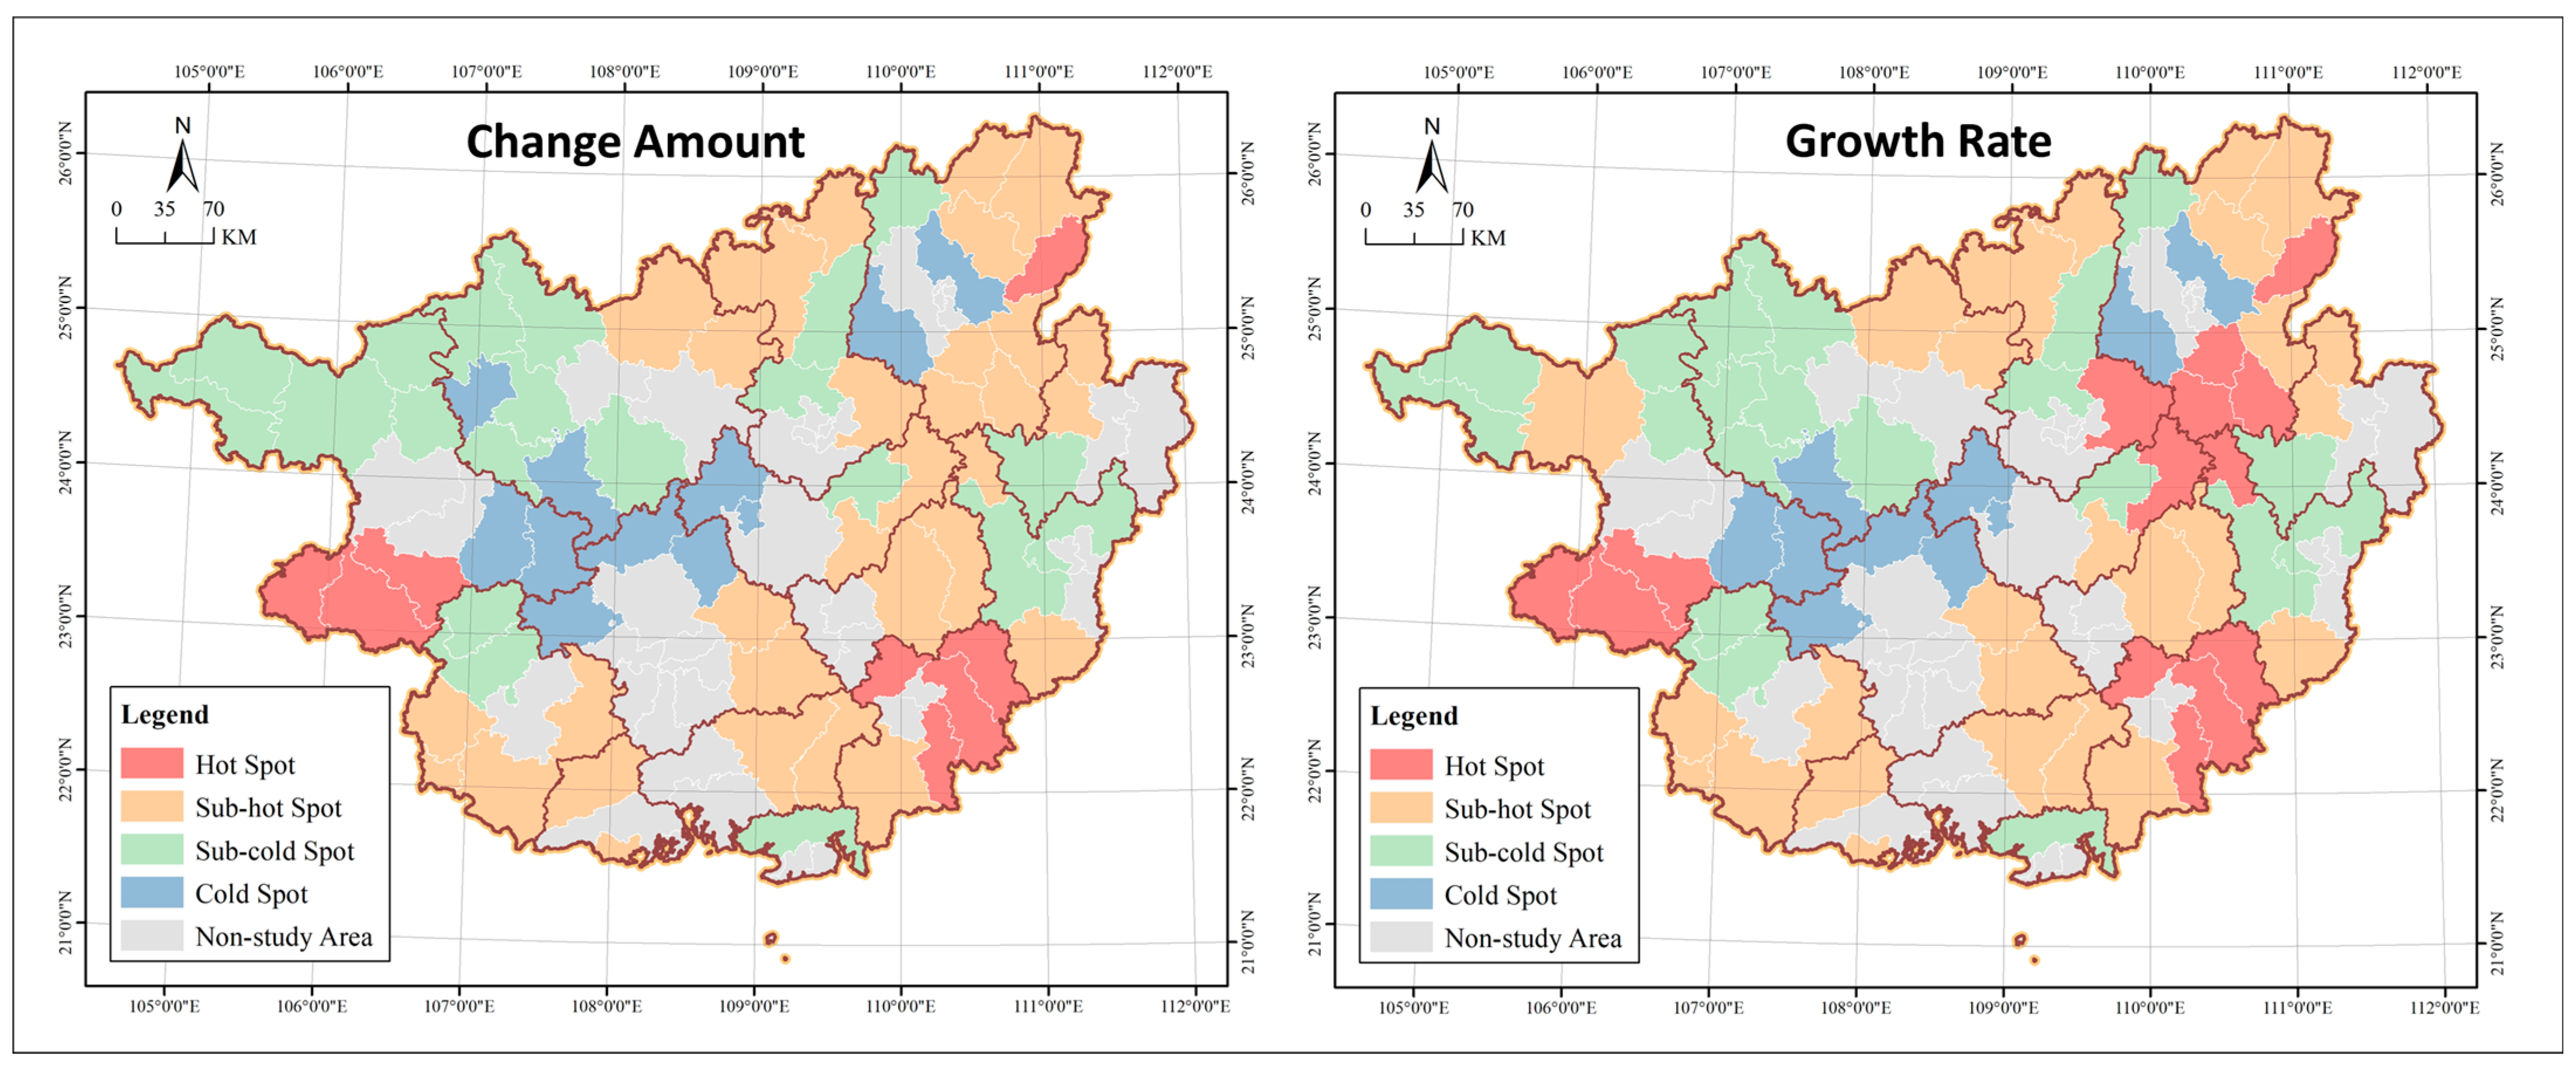
Figure 8.
Analysis of evolution model of digital village index in 2018 to 2020.

Figure 9.
Analysis of the mechanisms driving rural digitalization.


Table 1.
Indicator selection and data source.
| Variable | Indicator | Code | Data Source |
|---|---|---|---|
| Dependent () | Digital Village Index | Index of Digital Rural County 2018 and 2020 | |
| Evolution Model of Digital Village Index | |||
| Independent () | Permanent Population | Guangxi Statistical Yearbook, City Statistical Bulletin, County Statistics Manual, Work Report of County Government | |
| Population Density | |||
| Urbanization Rate | |||
| Gross Domestic Product (GDP) | |||
| Per capita GDP | |||
| Added Value of Primary Industry | |||
| Added Value of Secondary Industry | |||
| Added Value of Tertiary Industry | |||
| Total Retail Sales of Consumer Goods | |||
| Per Capita Consumption Expenditure of Farmer | |||
| Investment in Fixed Asset | |||
| Financial Revenue | |||
| Financial Self-Sufficiency Rate | |||
| Per Capita Income of Farmer | |||
| Urban–Rural Income Gap Index |
Table 2.
Factor detector of .
| Indicator | Code | q | p |
|---|---|---|---|
| Permanent Population | 0.18 | 0.03 | |
| Population Density | 0.47 | 0.00 | |
| Urbanization Rate | 0.21 | 0.05 | |
| Gross Domestic Product (GDP) | 0.31 | 0.03 | |
| Per capita GDP | 0.08 | 0.30 | |
| Added Value of Primary Industry | 0.26 | 0.05 | |
| Added Value of Secondary Industry | 0.08 | 0.09 | |
| Added Value of Tertiary Industry | 0.38 | 0.00 | |
| Total Retail Sales of Consumer Goods | 0.41 | 0.00 | |
| Per Capita Consumption Expenditure of Farmer | 0.32 | 0.01 | |
| Investment in Fixed Asset | 0.26 | 0.01 | |
| Financial Revenue | 0.34 | 0.00 | |
| Financial Self-Sufficiency Rate | 0.23 | 0.01 | |
| Per Capita Income of Farmer | 0.35 | 0.02 | |
| Urban–Rural Income Gap Index | 0.33 | 0.02 |
Table 3.
Factor detector of .
| Indicator | Code | q | p |
|---|---|---|---|
| Permanent Population | 0.30 | 0.01 | |
| Population Density | 0.33 | 0.00 | |
| Urbanization Rate | 0.09 | 0.02 | |
| Gross Domestic Product (GDP) | 0.35 | 0.01 | |
| Per capita GDP | 0.08 | 0.44 | |
| Added Value of Primary Industry | 0.35 | 0.01 | |
| Added Value of Secondary Industry | 0.11 | 0.03 | |
| Added Value of Tertiary Industry | 0.38 | 0.00 | |
| Total Retail Sales of Consumer Goods | 0.37 | 0.01 | |
| Per Capita Consumption Expenditure of Farmer | 0.20 | 0.03 | |
| Investment in Fixed Asset | 0.29 | 0.00 | |
| Financial Revenue | 0.43 | 0.00 | |
| Financial Self-Sufficiency Rate | 0.20 | 0.03 | |
| Per Capita Income of Farmer | 0.33 | 0.03 | |
| Urban–Rural Income Gap Index | 0.32 | 0.02 |
Table 4.
Interaction detector of .
| 0.18 | |||||||||||||||
| 0.70 | 0.47 | ||||||||||||||
| 0.56 | 0.73 | 0.21 | |||||||||||||
| 0.48 | 0.86 | 0.77 | 0.31 | ||||||||||||
| 0.37 | 0.65 | 0.40 | 0.44 | 0.08 | |||||||||||
| 0.46 | 0.78 | 0.75 | 0.66 | 0.49 | 0.26 | ||||||||||
| 0.30 | 0.68 | 0.40 | 0.44 | 0.22 | 0.49 | 0.08 | |||||||||
| 0.57 | 0.83 | 0.66 | 0.72 | 0.58 | 0.70 | 0.48 | 0.38 | ||||||||
| 0.55 | 0.81 | 0.77 | 0.83 | 0.67 | 0.81 | 0.68 | 0.73 | 0.41 | |||||||
| 0.61 | 0.71 | 0.71 | 0.84 | 0.67 | 0.74 | 0.62 | 0.77 | 0.77 | 0.32 | ||||||
| 0.52 | 0.75 | 0.65 | 0.64 | 0.54 | 0.72 | 0.43 | 0.63 | 0.78 | 0.72 | 0.26 | |||||
| 0.55 | 0.82 | 0.65 | 0.74 | 0.57 | 0.76 | 0.58 | 0.74 | 0.78 | 0.88 | 0.75 | 0.34 | ||||
| 0.67 | 0.76 | 0.48 | 0.65 | 0.44 | 0.65 | 0.43 | 0.69 | 0.77 | 0.72 | 0.61 | 0.54 | 0.23 | |||
| 0.67 | 0.85 | 0.81 | 0.88 | 0.72 | 0.75 | 0.63 | 0.87 | 0.69 | 0.60 | 0.69 | 0.84 | 0.75 | 0.35 | ||
| 0.78 | 0.80 | 0.88 | 0.75 | 0.70 | 0.75 | 0.70 | 0.79 | 0.80 | 0.72 | 0.77 | 0.75 | 0.77 | 0.72 | 0.33 |
Table 5.
Interaction detector of .
| 0.30 | |||||||||||||||
| 0.70 | 0.33 | ||||||||||||||
| 0.40 | 0.38 | 0.09 | |||||||||||||
| 0.68 | 0.72 | 0.46 | 0.35 | ||||||||||||
| 0.64 | 0.53 | 0.24 | 0.74 | 0.08 | |||||||||||
| 0.71 | 0.66 | 0.51 | 0.79 | 0.55 | 0.35 | ||||||||||
| 0.47 | 0.53 | 0.18 | 0.46 | 0.26 | 0.64 | 0.11 | |||||||||
| 0.69 | 0.71 | 0.52 | 0.70 | 0.67 | 0.82 | 0.44 | 0.38 | ||||||||
| 0.71 | 0.69 | 0.49 | 0.77 | 0.71 | 0.91 | 0.48 | 0.66 | 0.37 | |||||||
| 0.74 | 0.72 | 0.31 | 0.71 | 0.57 | 0.66 | 0.45 | 0.70 | 0.66 | 0.20 | ||||||
| 0.65 | 0.55 | 0.36 | 0.65 | 0.54 | 0.74 | 0.46 | 0.71 | 0.75 | 0.55 | 0.29 | |||||
| 0.82 | 0.74 | 0.53 | 0.88 | 0.75 | 0.85 | 0.51 | 0.78 | 0.77 | 0.80 | 0.80 | 0.43 | ||||
| 0.69 | 0.67 | 0.38 | 0.75 | 0.56 | 0.70 | 0.42 | 0.63 | 0.69 | 0.61 | 0.54 | 0.63 | 0.20 | |||
| 0.81 | 0.71 | 0.43 | 0.80 | 0.75 | 0.75 | 0.61 | 0.73 | 0.69 | 0.54 | 0.70 | 0.90 | 0.72 | 0.33 | ||
| 0.79 | 0.85 | 0.55 | 0.73 | 0.72 | 0.85 | 0.60 | 0.82 | 0.82 | 0.69 | 0.61 | 0.92 | 0.71 | 0.75 | 0.32 |
Disclaimer/Publisher’s Note: The statements, opinions and data contained in all publications are solely those of the individual author(s) and contributor(s) and not of MDPI and/or the editor(s). MDPI and/or the editor(s) disclaim responsibility for any injury to people or property resulting from any ideas, methods, instructions or products referred to in the content. |
© 2023 by the authors. Licensee MDPI, Basel, Switzerland. This article is an open access article distributed under the terms and conditions of the Creative Commons Attribution (CC BY) license (https://creativecommons.org/licenses/by/4.0/).
Share and Cite
MDPI and ACS Style
Li, W.; Zhang, P.; Zhao, K.; Chen, H.; Zhao, S. The Evolution Model of and Factors Influencing Digital Villages: Evidence from Guangxi, China. Agriculture 2023, 13, 659. https://doi.org/10.3390/agriculture13030659
AMA Style
Li W, Zhang P, Zhao K, Chen H, Zhao S. The Evolution Model of and Factors Influencing Digital Villages: Evidence from Guangxi, China. Agriculture. 2023; 13(3):659. https://doi.org/10.3390/agriculture13030659
Chicago/Turabian StyleLi, Weiwei, Ping Zhang, Kaixu Zhao, Hua Chen, and Sidong Zhao. 2023. "The Evolution Model of and Factors Influencing Digital Villages: Evidence from Guangxi, China" Agriculture 13, no. 3: 659. https://doi.org/10.3390/agriculture13030659
Note that from the first issue of 2016, this journal uses article numbers instead of page numbers. See further details here.