Article

Can Agricultural Production Services Influence Smallholders’ Willingness to Adjust Their Agriculture Production Modes? Evidence from Rural China

1
Institute of Agricultural Economics and Development, Chinese Academy of Agricultural Sciences, Beijing 100081, China
2
Institute of Agricultural Resources and Regional Planning, Chinese Academy of Agricultural Sciences, Beijing 100081, China
*
Author to whom correspondence should be addressed.
Agriculture 2023, 13(3), 564; https://doi.org/10.3390/agriculture13030564
Submission received: 9 January 2023 / Revised: 12 February 2023 / Accepted: 23 February 2023 / Published: 26 February 2023
(This article belongs to the Section Agricultural Economics, Policies and Rural Management)

Abstract

:
The transformation of agricultural production modes is an inevitable trend in China’s agricultural development. It is important to study the willingness of smallholder farmers to adjust their agricultural production modes to promote the transformation of China’s agricultural production modes. Agricultural production services are an effective way to realize the organic linkage between smallholder farmers and modern agriculture. To analyze the impact of agricultural production services on smallholder farmers’ willingness to adjust their agricultural production modes, this study uses data from a thematic study of 590 smallholder farmers in the Huang–Huai–Hai regions in 2022 to measure the extent of smallholder farmers’ full-cycle adoption of agricultural production services from the perspective of regional cropping systems for the first time and analyzes the impact of agricultural production services on farmers’ willingness to adjust their agricultural production modes. The study results show that the extent of full-cycle adoption of agricultural production services significantly affects farmers’ willingness to adjust their agricultural production modes. For each unit increase in the extent of full-cycle adoption of agricultural production services in line with the regional cropping system, the probability of farmers choosing “farmland transfer” and “agricultural production trusteeship” becomes 11.31 and 7.24 times higher than that of choosing “self-growing”, respectively. Based on the research results, this paper proposes the following countermeasures: first, we should pay more attention to the supply and demand of agricultural production services, especially to support the key weak links in developing agricultural production services for the process of grain production. Second, we should undertake more active and effective publicity measures to make full use of expressions that are acceptable to farmers to improve their understanding of productive agricultural services further and enhance their willingness to adopt productive agricultural services.

1. Introduction

With the continuous development of China’s industrialization, urbanization, and informatization, many rural laborers have left agriculture, China’s agricultural industry has improved regarding the materials and technical equipment used, and the level of social services in Chinese agriculture has increased. In addition, the transformation of China’s agriculture production modes (APM) has become an inevitable trend in China’s agricultural development. At present, there are 207 million farming households on contract farmland in China, of which more than 98% operate farmland of fewer than 2 hectares. Smallholder farmers are still the mainstay of Chinese agricultural production [1]. Therefore, it is important to study the smallholder farmers’ willingness to adjust their agriculture production modes to promote the transformation of Chinese agricultural production.
Some scholars have proposed that modern production factors can be introduced into agricultural production by developing agricultural production services that will transform agricultural production modes while guaranteeing the business autonomy of smallholder farmers [2,3,4,5,6].
As Schultz [7] pointed out in Transforming Traditional Agriculture, introducing new modern agricultural production factors is key to transforming traditional agriculture. Agricultural production services can combine and apply production factors such as agricultural technology and equipment, management knowledge and human capital, etc. Focusing on the general small-scale operation of farmers, agricultural production services are an indispensable intermediary and link when applying modern factors to production and operation in smallholder farms, and relying on agricultural production services can promote the transformation of agricultural services and enhance the modernization of agriculture and rural areas.
A large body of literature has been developed regarding the adoption of agricultural production services by farmers, including the following three main areas.
The first focuses on the types or segments of agricultural production services adopted by farmers. Three main methods are used to classify agricultural production services in the current study. First, the segmentation of agricultural production services is based on the agricultural activities used for crop cultivation. The specific classification results vary according to the varieties of crops grown. For example, based on the farming activities in the process of rice cultivation, agricultural production services can be divided into seven segments: land preparation, rice planting, rice transplanting, fertilizer management, irrigation management, pest control, and harvesting [8]. The cultivation process of wheat can be divided into eight segments: tillage, seeding, plant protection, irrigation, fertilization, harvesting, drying, and storage [6]. The production process of litchi does not require land preparation, seedling planting, seedling breeding, etc., but attaches great importance to services such as harvesting, packaging, and preservation [9]. Second, according to the extent of the reliance on labor, technology, capital, and other production factors, various aspects of agricultural activities can be divided into various categories, such as labor-intensive, capital-intensive, technology-intensive, semi-labor, and semi-technology-intensive. Thirdly, the classification is based on specific service contents, which can divide agricultural production services into various categories, such as information services, capital services, insurance services, technical services, agricultural supply services, and marketing services.
The second focuses on the impact of adopting agricultural production services on farm household productivity and farm income. This impact can mainly be expressed in following three ways: first, agricultural production services are used to compensate for the negative impact on smallholder production caused by the decline in the quality and quantity of farm household labor caused by the division of labor [10,11,12,13,14,15]. Relying on agricultural production services can not only liberate household labor and ensure the diversification of farm household income sources, it can also improve the efficiency of agricultural production and achieve an increase in farm household income at a certain agricultural product price level. Some studies have shown that the use of agricultural machinery inputs instead of labor inputs during grain production makes a non-negligible contribution to grain production [16]; machine plowing and harvesting are conducive to improving agricultural production efficiency [3,9,17,18,19,20]. The second is the influence that grain cultivation has farmers’ income by affecting the scale of farmers’ farming operations [21,22]. The third is the reduction in farmers’ agricultural production costs through the economy of scale effect of the service supply, which increases farmers’ income under the given conditions [15,23,24,25].
The third focuses on measuring the adoption of productive agricultural services by farm households. There are two main approaches to measuring the adoption of agricultural production services in recent studies. The first is the proportion of the cost of agricultural production services regarding the total cost [22,26,27], Luan et al. (2019) [22] used the sum of the cost of hired machinery and hired labor services in the wheat-growing process as a proportion of the total cost to indicate the extent of farmers’ adoption of agricultural production services. The second is quantify this by the actual adoption by farmers [28,29,30,31,32], which can be further subdivided as follows. One method measures the extent or scale of agricultural production services by adding up the number of service types. For example, Liu et al. (2016, 2017) [29,30], to examine the adoption of agricultural production services by rice farmers, assigned a value of 1 to each service used and used a value of 0 to indicate that the farmer did not use the service. Then, the mean value of each service was used as a proxy variable for the extent of farmers’ adoption of agricultural production services. The second approach is to examine whether one or several agricultural production services was adopted and then include each service in the model for analysis [33,34]; for example, when studying the factors affecting the scale of farmers’ land operations, Jiang et al. (2016) [33] used a method in which production services such as irrigation and drainage services, machine plowing services, pest control services, production materials purchase services, and planting planning services were included in the model.
There are two obvious shortcomings in the existing studies. First, the existing studies cannot accurately analyze the comprehensive level of smallholder farmers’ use of agricultural production services during the crop production process. Farmers use agricultural production services at several stages in their production practices, and the service behaviors at these different stages usually affect each other, but most of the existing studies focused on only one or selected stages. Second, the existing studies on smallholder farmers’ use of agricultural production services have focused on the production cycle of individual crop varieties, ignoring the influence of regional cropping systems on farmers’ cropping habits and agricultural production modes.
Therefore, to accurately reflect the impact of agricultural production services on farmers’ willingness to adjust their agricultural production modes, we chose to examine the impact that the full-cycle adoption of agricultural production services has on farmers’ willingness to adjust their agricultural production modes in regional farming systems. This study focused on the Huang–Huai–Hai region, with a maturity period that occurs twice a year and a wheat–corn rotation cropping system. Ensuring food security and the safe supply of major agricultural products in China is an important geographical function of the Huang–Huai–Hai region, and studying farmers’ willingness to adjust their agricultural production modes in the Huang–Huai–Hai region is important to promote small farmers’ adjustment to agricultural production modes and advance the transformation of agricultural production modes in China.

2. Methods and Data

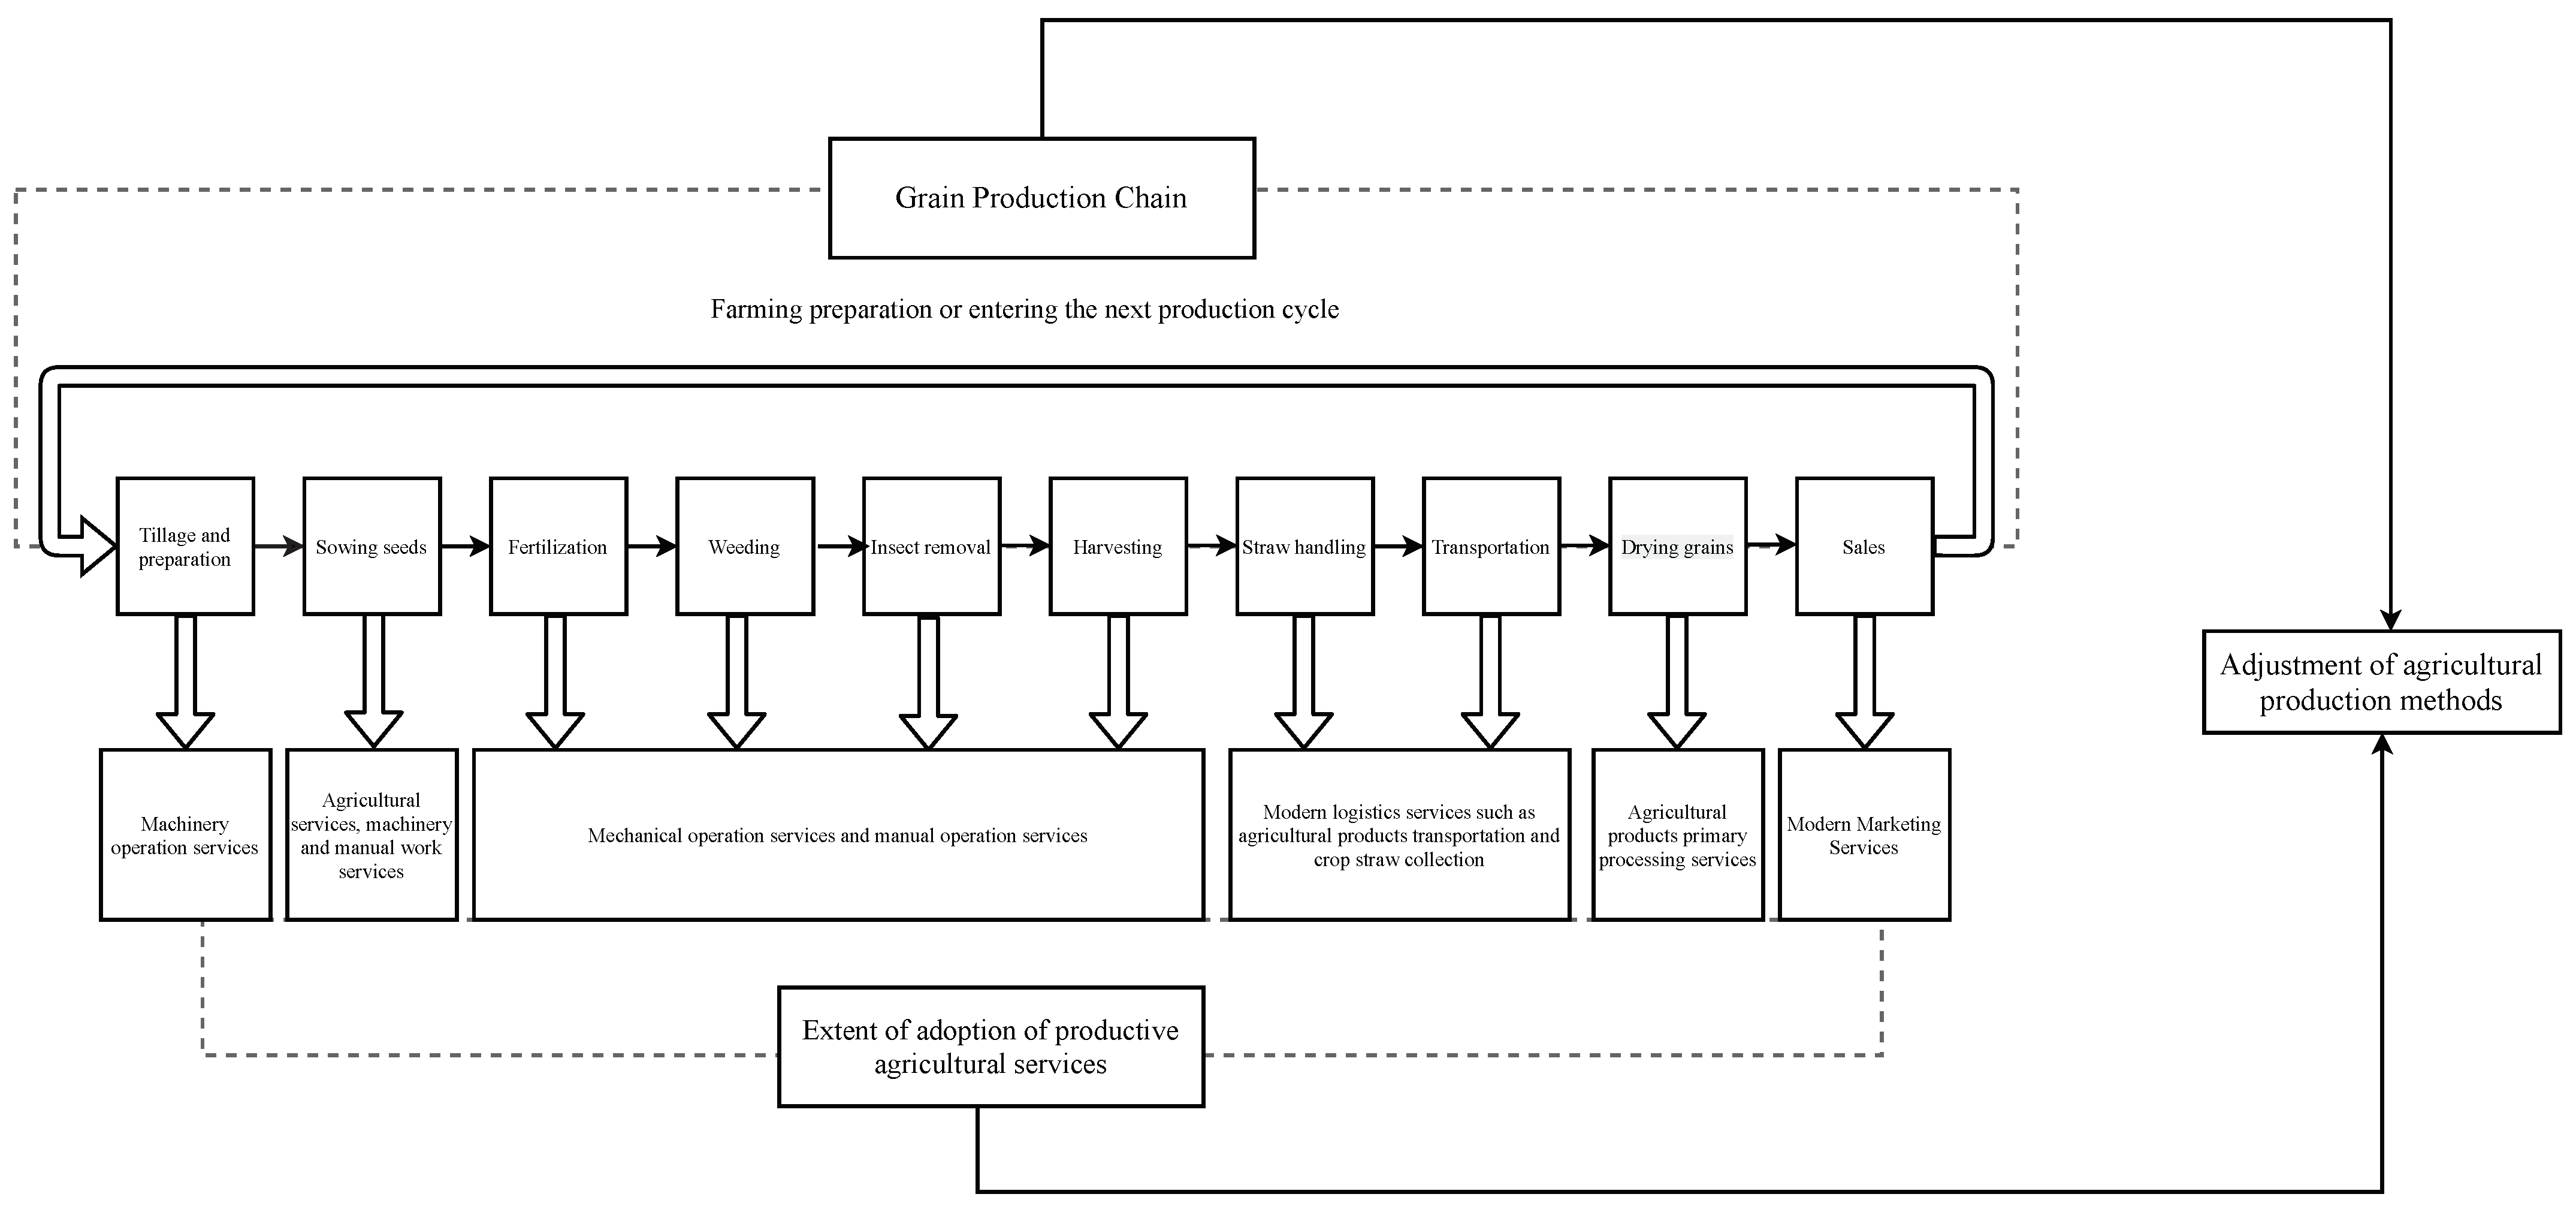
2.1. Theoretical Framework

Goodman and other alternative theorists argue that, although industrial capital cannot standardize agricultural production and processing systems, it can individually transform specific segments of agricultural production through technological improvements and then reintegrate the transformed segments into agricultural production in the form of “agricultural inputs” without agricultural restructuring. This can be achieved without the large-scale concentration of land. There are two types of substitutionism: substitutionism, represented by agricultural mechanization, and substitutionism, represented by biotechnology. The substitutionism represented by the development of biotechnology is a partial substitution of biological and labor processes by changing the natural processes of agricultural production to change the “production time” and “labor time”. The alternativeism represented by the mechanization of agriculture aims to change the “labor process” in agricultural production by transforming the production tools, and, thus, changing the agricultural production modes. For example, smallholder farmers cannot purchase agricultural machinery designed for large-scale operations and have to purchase mechanized services such as harvesting, sowing, plowing, etc. The cash input in agricultural production is replacing the family labor input. Substitutionist theory, when applied to the adoption of agricultural production services by smallholder farmers, means that subject to the objective constraints of natural conditions, capital can promote agricultural transformation through the transformation and reorganization of different aspects of agriculture and agricultural production is divided and controlled by a series of labor processes, such as tool making, capital, equipment, seed production, and irrigation. The division of labor provides the conditions for capital to penetrate agricultural production [35]. The development of agricultural production services is a possible path for the reshaping of agricultural activities by capital, the transformation of agriculture by capital, and the extraction of an accumulation from agriculture. In this process, the social interconfiguration between the agricultural divisions in terms of production, hired labor, and the adoption of new technologies will create a new means of production, which is nested in the innovation of social relations. This will drive the transformation of agricultural production modes.
Changes in resource endowments induce technological changes. When the endowment of one factor (e.g., capital) becomes more abundant relative to another factor (e.g., labor), specific relative factor prices induce technological changes that use more capital and save labor. Building on Hicks’ work [36], Hayami and Ruttan [37] have further stated that “technological development can facilitate the substitution of relatively abundant (and, therefore, cheap) factors for relatively scarce (and, therefore, expensive) factors in the economy”. With socio-economic development, the structure of the resource endowments faced by farm households has also changed, and the factor endowments at their disposal determine the agricultural operations that they adopt [38,39]. With the restructuring of rural factor resource endowments, agricultural production services, a new type of production factor, will penetrate the whole agricultural industry chain and bond different production factors. Taking the compensation and release of labor as an example, with the continuous outflow of surplus agricultural labor, labor will gradually become a scarce resource in agricultural production, and the cost of labor in agricultural production will continue to rise. By purchasing agricultural production services, farmers use factors outside the household to compensate for the shortage of labor factors within the household while releasing labor within the household to engage in non-agricultural industries to generate income. Farmers introduce new factors and technologies to their operations by purchasing services to improve production efficiency, thus, adjusting agricultural production modes [40].
Rational choice theory suggests that rational behavior is a social activity that requires the actor to consider (or calculate) various factors rationally. These factors include two main aspects: first, the scarcity of resources, and second, the system and its structure. First of all, the actor’s behavior is governed by the scarcity of resources (i.e., the control and possession of resources); the more resources the actor has, the easier it is to achieve their goal. Second, social institutions constrain behavior or purpose attainment in ways that encourage or undermine the action [41]. Farmers, as rational economic agents, choose to act in a way that maximizes their benefits regarding the survival of the whole household. Farmers act under specific resource endowments and institutional conditions, and the adjustment of agricultural production modes is a manifestation of this rationality [42].
Based on the theoretical analysis in this section and the literature review in the previous section, we developed the following theoretical framework, as shown in Figure 1.
Based on the analysis above, the following research hypotheses is proposed.
Hypothesis 1.
The extent of the adoption of full-cycle agricultural production services by smallholder farmers significantly affects farmers’ willingness to adjust their agricultural production modes, and the higher the extent of adoption, the stronger farmers’ willingness to adjust their agricultural production modes.

2.2. Model Construction

There are two main views regarding the promotion of the modernization of small farmers in China in academia. One view is that small farmers should be encouraged to transfer their arable land to form large-scale land management; the other view is that agricultural production services for small farmers should be actively developed, and small farmers should be encouraged to use more agricultural production services without changing the area of arable land operated by farmers. In this way, the whole production trust can form a scale of services and thus, transform the agricultural production modes. However, the reality in China is that, by 2020, the rate of agricultural land transfer was only 34.06% [43], the agricultural production trust service included only 70 million small farmers [1], and the majority of farmers were still growing their own produce.
Therefore, based on the results of existing academic studies and the reality of Chinese farmers’ choices, this paper classifies farmers’ willingness to adjust their agricultural production methods into three categories: “self-growing”, “farmland transfer”, and “agricultural production trusteeship”. Farmers’ willingness to adjust their agricultural production modes is divided into three categories: “self-growing”, “farmland transfer”, and “agricultural production trusteeship”. Since the explanatory variables are multivariate discrete variables and there is no significant definite order relationship among each choice, we adopted an unordered multinomial logit (Mlogit) model to investigate the influence that the degree of adoption of agricultural production services has on farmers’ willingness to adjust their production modes.
The multinomial logit model is mainly used to estimate a situation in which individual i makes a choice among J mutually exclusive alternatives models, as in Equation (1).
P ( y i = j | x i ) = e x p ( α j X i ) k = 1 j e x p ( α k X i )
where ( P ( y i = j | x i ) denotes the probability of the i th farmer choosing business method j, X i denotes the factor that influences farmer i when he chooses his business method and denotes the value of the regression coefficient. Subsequently, assuming y i = k to be the reference variable, Equation (1) can be transformed into Equation (2):
P ( y = j | y = k ) = P ( y = j ) P ( y = k ) + P ( y = j ) = e x p ( α j X i ) 1 + e x p ( α j X i )
The corresponding relative risk ratio is Equation (3)
P ( y = j ) P ( y = k ) = e x p ( α j X i ) ln P ( y = j ) P ( y = k ) = α j X i
Substituting the variables into Equation (3), we obtained Equation (4) to adjust farmers’ production modes.
ln P j P k = α 0 + α 1 O S i + m = 2 n α m X i + ϵ
where P j denotes the j th farmer’s choice of business method, O S i denotes the farmer’s adoption of agricultural production services, X i denotes the factors affecting farmer’s intended choice i, and ε is a random disturbance term.

2.3. Data Source

The farm household data used in this study were obtained from a field survey titled “Farm Household Use of Agricultural Production Services”, conducted in March, July, and August 2022 in 24 villages in six cities in the Huang–Huai–Hai region. This is a Chinese rural microeconomic data research website of the Institute of Agricultural Economics and Development, Chinese Academy of Agricultural Sciences. The survey sites were selected scientifically and rationally. Under this theme, 608 valid questionnaires were completed. The Huang–Huai–Hai region has a wheat–corn rotation system and wheat and corn are the main crops grown by farmers in the region; therefore, only data from farmers in the sample whose production mode was wheat–corn rotation, totaling 509 households were retained in this paper. This survey covered the basic information of the sample farm households, as well as the farming land use, food production and operation, and the agricultural production service used by the farm households in 2021. To avoid omitting relevant variables, which could lead to biased estimation results, some control variables were selected in this paper, as described below. The data of these control variables were obtained from the statistical yearbooks of each region.

2.4. Variable Settings

According to the variables included in the above model, the following variables were selected and defined in this paper.

2.4.1. Explained Variables

Willingness to adjust agricultural production modes. In this paper, the three choices of agricultural production modes were used as three indicators of farmers’ willingness to adjust their agricultural production modes: “self-growing”, “farmland transfer”, “agricultural production trusteeship”. These are denoted by P1, P2, and P3 in this study and were assigned values of 1, 2, and 3, respectively.

2.4.2. Core Explanatory Variables

The extent of the full-cycle adoption of an agricultural production service. The extent of the full-cycle adoption of an agricultural production service refers to the extent to which agricultural production services were used to produce all major crops that were compatible with the regional cropping system. Taking the Huang–Huai–Hai region as an example, the extent of the full-cycle adoption of agricultural production services refers to the extent to which agricultural production services were used by farmers in all production stages of wheat and corn crops under wheat–corn rotation system. According to the previous literature, two main modes were used to quantify the extent of the adoption of agricultural production services: one measured the ratio of expenditure costs, that is, the proportion of the cost of the agricultural production services adopted by farmers in each link regarding the total cost of the production link was used for quantification. The second measured this using the proportion of the actual adoption of links. That is, agricultural production, especially crop cultivation, was subdivided into multiple segments, and then each segment was assigned a value of 0 and 1 according to whether the services were adopted, with 1 indicating the adoption of services and 0 indicating no adoption of services. In terms of comprehensiveness, the second quantification method could cover all segments of agricultural production. In terms of variability, the use of agricultural production services could be separately examined, focusing on the farmers in each segment. To consider both the comprehensiveness and variability of smallholder farmers’ use of agricultural production services, this study adopted the second quantification approach. The basic formula used to determine the extent of the full-cycle adoption of agricultural production services used in this study is as follows:
O S i = j = 1 m r i j m
where O S i denotes the extent of the adoption of agricultural production services by the i th farmer in the whole cycle, m denotes the total number of steps in the production of all major crops grown with the regional cropping system, and r i j denotes whether farmer i adopted agricultural production services in the j th step—if so, the value is 1; otherwise, the value is 0. According to the practical situation of agricultural production services adopted by farmers in the study, the cropping process of wheat and maize in the Huang–Huai–Hai region was divided into 24 steps, including the supply of agricultural materials, tillage, sowing, fertilizer application, weeding, drying, and marketing. In each link, a value of 1 is assigned when the service is adopted and a value of 0 is assigned when the service is not adopted.

2.4.3. Control Variables

To avoid omitting relevant variables and obtaining biased estimation results, with reference to similar studies and data availability, this paper selected personal characteristics, farm household characteristics, service–provider selection preferences, farm household farming land characteristics, and regional characteristics as control variables, focusing on five different aspects.
Referring to the studies of [44,45,46,47], personal characteristics mainly included respondents’ gender, age, years of education, physical health level, and attitude toward the adoption of new technology. Differences in gender usually led to differences in agricultural production decisions, age implied differences in life experiences and experiences [48], years of education reflected farmers’ cognitive ability and open-mindedness, and physical health level reflected the condition of the labor force engaged in agricultural production in rural areas [49]. Digital financial payment methods, represented by WeChat payment, can meet farmers’ immediate consumption needs, spread some over-consumption and credit consumption concepts, and prompt farmers to accept emerging technologies [50,51]. Therefore, in this paper, we chose whether WeChat payment had been used in the past 12 months to characterize farmers’ attitudes toward the adoption of emerging technologies.
Farm household characteristics. The main characteristics included the number of people who have dinner at home [52], the degree of part-time employment [53], and social capital. The number of people eating at home indicates how many people live together in rural areas; the degree of part-time employment indicates the importance of farm income to farm households; and social capital mainly determines whether the farmer is a village cadre or a party member [54]. Overall, the better the social capital, the easier it is for farmers to access information and resources, which has important implications for farmers’ rational choices [55].
Household cropland characteristics. Referring to the existing research, this paper selected grain yield and the number of irrigation per hectare to characterize the farmland characteristics of farmers’ households. Grain yield is an important evaluation index of farmland strength, and grain yield per hectare was used to characterize the overall quality of household farmland, with a higher yield indicating better farmland quality [56]. The Huang–Huai–Hai region is the main grain-producing region in China, with a wheat–corn rotation and biannual maturity, which is a highly intensive type of agricultural production. Under the existing irrigation conditions, the drought resistance of arable land increases with the increase in irrigation, improving the land yield of grain crops [57,58,59].
Service subject selection preference. According to Li et al.’s study [60], farmers’ choice of agricultural production services shows a clear preference for “acquaintance services”, which means that small-scale farmers prefer services provided by acquaintances in groups or villages. Therefore, the main source of services used by farmers was used to characterize thefarmers’ preferred service provider.
Regional economic conditions and farming environment. Referring to the study of Shen et al. [61], the per capita disposable income of rural residents was used to characterize the regional economic development. The total power of agricultural machinery is the sum of the rated power of machinery and equipment used for activities such as farming, animal husbandry, fishery, primary processing of agricultural products, agricultural transportation, and farmland infrastructure construction, which represents the overall agricultural machinery in the region. Therefore, referring to the studies of Yang et al. [62] and Zhang et al. [63], the total power of agricultural machinery in the county in which the research site was located was chosen to characterize the agricultural machinery equipment situation. After China completed the village electricity project at the end of 2015, electricity became the most commonly utilized energy source in rural China, and rural electricity consumption reflects the rural energy supply infrastructure and the quality of rural life [64,65,66]. Therefore, rural electricity consumption was selected to characterize the comprehensive rural development level. As data for 2021 were lacking, this study referred to the study by Zhu et al. [67] and supplemented this with the average growth rate in the first five years of these three indicators.
It should be noted that, as we were limited to the availability of price data and the large errors associated with indirect measures such as shadow prices, this paper drew on Ma et al. [68], Kousar et al. [69], and Zhou [70] to quantitatively analyze the impact that smallholder farmers’ adoption of agricultural production services had on their willingness to adjust their agricultural production modes, without controlling for the effect of price factors. This is reasonable in the empirical analysis is reasonable and reduces the impact on the results. The reasons for this are as follows: first, for smallholder agricultural production in a near-perfectly competitive market, market prices are exogenous variables; second, the data used in the analysis in this paper are mainly cross-sectional survey data, and price levels remain largely consistent within the same region.
The specific definitions and assignments of each variable are shown in the table, and descriptive statistical analysis is presented in Table 1.

2.5. Descriptive Statistics

(1) Willingness to adjust agricultural production modes
In the survey sample, the highest percentage of farmers chose to “self-growing” with 60.34%. The proportion of farmers who chose “farmland transfer” was 21.19%. Only 18.47% of farmers chose “agricultural production trusteeship”. This situation is consistent with the actual production practice of Chinese agriculture.
(2) Extent of full-cycle adoption of agricultural production services
In China’s cereal production practice, the whole production line of small farmers growing wheat under a trust (where, except for the drying link, all links use agricultural production services) includes mechanized land tillage, mechanized fertilization, and precision sowing, field plant protection, combined harvesting, straw mechanization treatment, wheat transportation and other agricultural machinery and agronomic integration technologies. The specific technical route is as follows: mechanized straw treatment for combined corn harvest → mechanized land tillage → wheat fertilization and precision sowing → mechanical or manual field plant protection → mechanized, combined wheat harvest straw chopping and returning to the field → wheat seed transportation.
Smallholder farmers planting corn and undergoing the full production process (like planting wheat; except for the drying link, all links use agricultural production services) use technology including mechanical sowing and fertilization, field plant protection, corn joint harvesting, straw mechanized treatment, corn transportation, and other agricultural machinery and agronomic integration technologies. The specific technical route is a corn no-till fertilization precision sowing and herbicide spraying → mechanical or manual field plant protection → combined corn harvesting → straw mechanization treatment → corn transportation.
Based on agricultural production services the sampled farmers adopt at different stages of the study, the process for smallholder farmers growing maize and wheat can be mapped as Figure 2 follows.
Although the actual area of arable land operated by smallholder farmers is very small, the farmers’ demand for agricultural production services is not weak. In addition to the use of agricultural production services for cultivation and harvesting, some farmers also leave the weeding and pest control, fertilization, and even post-harvest grain delivery to service providers. Throughout the whole cycle of wheat–corn rotation, there is a phenomenon of “planting without working in the field”. However, the proportion of small farmers who fully mechanize the wheat–corn rotation cycle is still low, especially in the “field management” link; the number of farmers who choose to pay for this service is still very small. This is because, during field management in wheat and corn planting, only weeding requires more labor, while fertilizer application, especially fertilizer tracking, pest control, and other forms of field management, are typically less labor-intensive and less physically demanding, and even elderly farmers are capable of handling them. Therefore, these processes are still mainly completed by manual labor.
(3) Respondents’ personal characteristics
The interviewees in the survey were family members who were familiar with family agricultural production. They were generally the decision-makers or important participants in household agricultural production. This paper mainly examines the characteristics of individual respondents rather than the characteristics of household heads.
Gender. Male respondents accounted for 68.42% of the total sample and female respondents accounted for 31.09% of the total sample, which is consistent with the reality that decision-makers or important players in Chinese agricultural production are predominantly male.
Age. Different ages represent different labor capacities and different needs and choices regarding agricultural production services. In the survey sample, the average age of respondents was 59.83 years old. A total of 52.30% of respondents were aged 60 and above, and 37.99% of respondents were aged 65 and above; the largest proportion of respondents were aged 50–60 years old, at 32.24%, followed by those aged 60–70 years old, accounting for 31.74% of the total. The third place is occupied by respondents aged 40–50 years old, accounting for 12.34% of the total sample; the number of respondents aged 70 years old and above accounts for 10.86% of the total; and the number of respondents aged 39 years old and below is the lowest, accounting for 3.13% of the total sample. This situation is consistent with the aging characteristics of current Chinese grain production operators.
Education level. The level of education can reflect the information-receiving ability and knowledge reserve level. In the research sample, the average years of education the respondents received was 5.90 years. A total of 16.94% of the respondents had received no education; 42.76% of the respondents had less than 5.90 years of education; and 57.24% of the respondents had more than or equal to 5.90 years of education. Among the farmers with an above-average level of education, the years of education were concentrated in the range of 6–9 years, accounting for 81.32% of the total. In other words, the education level of farmers engaged in food production and operation at present is mainly primary and junior high school.
Physical health condition. For the elderly in rural areas, health and physical strength are the most important factors that affect their engagement in agricultural work [71]. In the survey sample, 47.12% of the farmers were “relatively healthy”, 26.61% of the farmers had “average’ health’, 12.20% of the farmers were “very healthy”, and only 1.02% of the farmers were “very healthy”. Only 1.02% of farmers were “very unhealthy”.
Usage of WeChat payment. Digital financial payment methods represented by WeChat payment can meet farmers’ immediate consumption needs, increase some overspending and credit consumption concepts, and prompt farmers to accept emerging technologies [50,51]. Therefore, the use of WeChat payment can, to a certain extent, represent farmers’ attitudes toward the adoption of emerging technologies. In the research sample, 53.05% of farmers had not used WeChat payments, and 46.95% had used WeChat payments.
(4) Farm household characteristics
The number of people eating dinner at home. The number of people who eat dinner at home was used as a proxy for the number of people who stayed at home. Among the “number of people who ate dinner together”, the majority of households consisted of 2 members, 38.49% of the total sample, followed by 3 or 4 members, 32.89% of the total sample, consisting of the head of the household, his spouse, and the head of household’s father or mother or grandchildren. The third place consisted of a family of 5 or 6, consisting of the head of household, the spouse of the head of household, the son of the head of household, the daughter-in-law of the head of household, and the grandson or granddaughter of the head of household, accounting for 19.41% of the total sample. Fourth place was a family of 1 consisting of the head of household themself or the spouse of the head of household, accounting for 5.26% of the total sample. The extent of part-time employment. According to the criteria for classifying farm households by Chen [72], Zheng et al. [73], and Guo [74], 71.22% of farm households were part-time farm households, 16.94% were non-farm households, and only 11.84% were full-time farm households, which is consistent with the fact that non-farm part-time behavior is prevalent in China at present.
(5) Service subject selection preference
Among the sample farmers, the proportion of farmers who chose agricultural production services from their own village was the highest, reaching 51.86%, while the proportion of farmers who chose agricultural production services from other counties in the province and other villages in the township was 24.41% and 10.34%, respectively. The agricultural productive services chosen by farmers mainly came from local service providers. This is because rural areas are a society of acquaintances, and acquaintance relationships have a more significant influence on agricultural business agents, especially the production decisions of small farmers. Within the vast majority of rural communities, the social characteristics of acquaintances are more obvious, and the information asymmetry between farmers and service supply subjects is low. Of the many agricultural productive service supply subjects, farmers prefer the services of acquaintances from their own group and village [60,75]. A descriptive statistical analysis of the main variables is shown in Table 2.

3. Results and Discussion

3.1. Model Estimation

To determine the consistency and validity of the model, we tested the model with Hausman and Small–Hsiao tests under the hypothesis of “independence of uncorrelated choices”. The p-values of both the Hausman and Small–Hsiao test statistics were large and mostly close to 1, which indicates that the use of the mlogit model to analyze farmers’ willingness to choose agricultural production modes was appropriate. The specific regression results are shown in the table below.
In the empirical analysis, “self-growing” was used as a comparison group to show a willingness to adjust to two other agricultural production modes. All analyses were performed using the STATA version 14 statistical software (StataCorp LP, College Station, TX, USA). The regression results are shown in the following Table 3. The regression results show that the extent of the full-cycle adoption of agricultural production services, membership in the Communist Party, and the total power of agricultural machinery per hectare significantly affect farmers’ willingness to adjust their agricultural production modes. Thus, hypothesis 1 is supported.
(1) Farmers’ choice of “farmland transfer” is influenced by the extent of the full-cycle adoption of agricultural production services, the number of people who ate dinner at home, whether respondents were members of the Chinese Communist Party, the total agricultural machinery power per hectare, rural electricity consumption, and the per capita disposable income of rural residents. For each unit increase in the adoption of full-cycle agricultural production services, the probability of farmers choosing “farmland transfer” increased 11.31 times, and for each unit increase in the number of people who ate dinner at home, the probability of farmers choosing “farmland transfer” decreased by 75.00%. The probability of choosing “farmland transfer” was 2.11 times higher than the probability of choosing “self-growing” for party farmers. For each unit increase in total agricultural machinery power per hectare, rural electricity consumption, and rural per capita disposable income, the probability of farmers choosing “farmland transfer” increased by 1.09, 1.27, and 2.66 times.
(2) Farmers’ choice of “agricultural production trusteeship” was influenced by the extent of the full-cycle adoption of agricultural production services, whether they had used WeChat payments, the number of people who ate dinner at home, whether they were members of the Chinese Communist Party, and the total agricultural machinery power per hectare in the region. For each unit increase in the full-cycle adoption of agricultural production services, farmers were 7.24 times more likely to choose “agricultural production trusteeship”. Farmers who used WeChat payments in the last 12 months were 1.71 times more likely to choose “agricultural production trust”. For each unit increase in the number of people who ate dinner at home, the probability of choosing “agricultural production trusteeship” decreased by 88.90%. Farmers who were members of the Chinese Communist Party were 3.00 times more likely to choose “agricultural production trusteeship” than to choose “self-growing”. The probability of choosing “agricultural production trusteeship” will increase by 1.05 times for each unit increase in total agricultural machinery power per hectare.
In mlogit models, the average marginal effect is usually used to measure the effect of explanatory variables on the probability of occurrence of each group. Table 4 reports the average marginal effects of the main explanatory variables.
The following conclusions were drawn:
(1) When the values of other variables remained constant, the extent of the full-cycle adoption of agricultural production services had a significant effect on farmers’ choice of “self-growing” and “farmland transfer”. When the extent of full-cycle adoption of agricultural production services increased by one unit, the probability of farmers choosing “self-growing” decreased by 48.52%, while the probability of choosing “farmland transfer” increased by 29.64%.
(2) When the values of other variables remained constant, the use of WeChat payment within 12 months had a significant effect on farmers’ choice of “agricultural production trusteeship”. The probability of choosing “agricultural production trusteeship” increased by 8.13% for farmers who had used WeChat payments within 12 months.
(3) When the values of other variables remained constant, the number of people who ate dinner at home had a significant effect on farmers’ willingness to adjust their agricultural production modes “self-growing”, “farmland transfer”, and “agricultural production trusteeship”. For each unit increase in the number of people eating dinner at home, the probability of farmers choosing “self-growing” increases by 4.51%, and the probability of choosing “farmland transfer” and “agricultural production trusteeship” decreased by 4.00% and 0.53%.
(4) When the values of other variables are constant, whether a farmer is a member of the Chinese Communist Party has a significant effect on the choice of “self-growing” and “production trust”. When a farmer is a member of the Chinese Communist Party, the probability of a farmer choosing “self-growing” will decrease by 19.91%, and the probability of choosing “agricultural production trusteeship” will increase by 13.00%.
(5) When the values of other variables are constant, the total farm machinery power per hectare has a significant effect on farmers’ choice of “self-growing” and “farmland transfer”. An increase of one unit of total farm machinery power per hectare will decrease the probability of farmers choosing “self-growing” by 1.49% and increase the probability of choosing “farmland transfer” by 1.14%.
(6) When the values of other variables are constant, rural electricity consumption has a significant effect on farmers’ choice of “self-growing”. The probability of farmers choosing “self-growing” will decrease by 4.21% for each unit increase in rural electricity consumption.
(7) When the values of other variables are constant, the per capita disposable income of rural residents has a significant effect on farmers’ choice of “self-growing” and “farmland transfer”. For each unit increase in the per capita disposable income of rural residents, the probability of farmers choosing “self-growing” will decrease by 14.29%, and the probability of choosing “farmland transfer” will increase by 14.17%.

3.2. Robustness Test

To test the robustness of the impact of full-cycle adoption of agricultural production services on farmers’ willingness to adjust their agricultural production modes, farmers were classified according to their full-cycle adoption of agriculture production services. Farmers were classified as basic when their full-cycle adoption of agriculture production services was less than or equal to 0.5 and as extended when their adoption of agricultural production services was greater than 0.5. The core independent variable, the extent of adoption of agricultural production services, was replaced by the type of farm household. The estimated results are consistent with the original results, shown in Table 5. After changing the variable, the impact of the extent of adoption of full-cycle APS on the smallholder farmers’ APM was shown to be significant at the confidence level of 5%. There was no significant decrease compared with the baseline regression results. Hypothesis 1 remains supported.
As can be seen from the above table, farmers’ choice of “farmerland transfer” as opposed to “self-growing” is influenced by the extent to which they adopted full-cycle agricultural production services, the number of people who eat dinner at home, whether they are members of the Communist Party, the total power of agricultural machinery per hectare, and rural residents’ per capita disposable income. Farmers’ choice of “Agricultural production trusteeship” was influenced by the adoption of full-cycle agricultural production services, whether respondents’ had used WeChat payments, whether they were members of the Communist Party, and the total power of agricultural machinery per hectare in the region, compared to “self-growing”. Compared with the baseline regression results, there was no significant decrease, and the direction of influence of the above variables did not change.

4. Conclusions and Future Directions

Based on smallholder farmers’ use of agricultural productivity services in China, this study focuses on whether the use of full-cycle agricultural productivity services in regional cropping systems affects farmers’ willingness to choose certain agricultural production methods and, if so, the direction and magnitude of this effect. To answer these questions, this paper empirically analyzes the impact of smallholder farmers’ adoption of productive agricultural services on their willingness to adjust their agricultural production methods using farmer-level micro-research data and a disordered multinomial choice model. From the results of this paper, we draw the following key conclusions.
(1) Regarding the use of agricultural production services by farmers, the current agricultural production services have widely and deeply involved small farmers in the development of modern agriculture in various ways, but the proportion of small farmers who have used the entire mechanization service in the whole wheat–corn rotation cycle is still low, as can be seen from the cropping system in the study area. Roughly speaking, the current agricultural production service has shortcomings regarding “management”. In terms of access, farmers mainly obtain the corresponding services by “calling and contacting” or “waiting on the ground”.
(2) The regression results show that the extent of full-cycle adoption of agricultural production services, membership in the Communist Party, and the total power of agricultural machinery per hectare Significantly affect farmers’ willingness to adjust their agricultural production modes. Specifically, for each unit increase in the adoption of full-cycle agricultural productive services compatible with the regional cropping system, farmers are 11.31 and 7.24 times more likely to choose “land transfer” and “production trust”, respectively, than to choose “self-growing”. For each unit increase in the number of people eating dinner at home, the probability of farmers choosing “land transfer” and “production trust” will decrease by 75.00% and 88.90%, respectively, compared with the probability of choosing “self-growing”. When the farmer is a member of the CPC, the probability of choosing “land transfer” and “production trust” is 2.11 times and 3.00 times higher than the probability of choosing “self-growing”, respectively.
The findings of this study provide the following insights. First, more attention should be paid to the supply and demand of agricultural productive services themselves, especially to the key weak links in the development of agricultural productive services in the process of food production, such as fertilizer application services in the crop fertilization chain of the base and follow-up fertilizer spreading services, weed control and pest control services for drugging, and grain transportation services. According to the crop variety guidelines and production link guidelines, the market supply of production services should be supported in key areas, as well as weak links in the agricultural production chain, and agricultural machinery purchase subsidies should be combined with agricultural machinery service subsidies to stimulate the cultivation of the service market. Second, more active and effective publicity measures should be taken to make full use of expressions that are acceptable to small farmers to improve their understanding of agricultural production services further, enhance their willingness to adopt agricultural production services, and stimulate the demand for these services.
It is important to note that this study had certain limitations. First, this study does not discuss much about the impact that the form of organization, service mode, and agricultural production service fees have on small farmers, which are also important entry points when promoting the transformation of agricultural services and the modernization of agriculture for small farmers, and are worth further, in-depth study. Second, due to the limitations of data acquisition and data sources, this paper did not analyze the classification of machinery operation services and hired labor services used by small farmers, which are also important entry points to promote the transformation of agricultural services and the modernization of agriculture, and are worth further, in-depth study.

Author Contributions

Conceptualization, Y.H.; methodology, Y.H., D.F. and H.Z.; software, Y.H.; validation, Y.H. and D.F.; writing—original draft preparation, Y.H.; writing—review and editing, Y.H. and X.W.; visualization, H.Z. and X.W.; supervision, X.W.; project administration, X.W. All authors have read and agreed to the published version of the manuscript.

Funding

This research was funded by The Agricultural Science and Technology Innovation Program, grant numbers 10-IAED-08-2023 and 10-IAED-RC-04-2023.

Institutional Review Board Statement

Not applicable.

Informed Consent Statement

Not applicable.

Data Availability Statement

The data presented in this study are available within the article.

Conflicts of Interest

The authors declare no conflict of interest.

Abbreviations

The following abbreviations are used in this manuscript:
APMAgriculture Production Modes
APSAgriculture Production Services
CCPChinese Communist Party

References

  1. PeopleDaily. By the End of 2020, the Number of Agricultural Social Service Organizations across the Country Will Exceed 900,000. Available online: http://www.gov.cn/xinwen/2021-02/08/content_5585835.htm (accessed on 8 February 2021).
  2. He, X. On Mainstay Peasant. J. Nanjing Agric. Univ. Soc. Sci. Ed. 2015, 15, 1–6. [Google Scholar]
  3. Jiang, C. The impact of farmers’ differentiation on food production and planting behavior choices and policy considerations. Theor. Discuss. 2015, 1, 69–74. [Google Scholar]
  4. Kong, X. Improve the agricultural socialization service system to realize the organic connection between small farmers and modern agricultural development. Rural Manag. 2018, 2, 17–18. [Google Scholar]
  5. Zhang, X. Research on Supply-side Structural Reform to Promote the Revitalization of Rural Industries. Res. Financ. Issues 2019, 1, 114–121. [Google Scholar]
  6. Zhong, Z.; Jiang, W.; Li, D. Can social services promote high-quality agricultural development?—Evidence from food production in the third national agricultural census. China Rural Econ. 2021, 12, 109–130. [Google Scholar]
  7. Schultz, T.W.; Liang, X. Transforming Traditional Agriculture; Commercial Press: Beijing, China, 1987. [Google Scholar]
  8. Chen, C.; Li, Y.; Liao, X. Analysis of the Productivity Effect of Outsourcing in Rice Production–Based on the Panel Data of Three Counties in Jiangsu Province. China Rural Econ. 2012, 2, 86–96. [Google Scholar]
  9. Zhuang, L.; Mae, A.; Zhang, J. Analysis of willingness to demand agricultural productive services and its influencing factors—Taking the survey of 450 litchi producers in Guangdong Province as an example. China Rural Econ. 2011, 3, 70–78. [Google Scholar]
  10. Picazo-Tadeo, A.J.; Reig-Martinez, E.; Hernandez-Sancho, F. Directional distance functions and environmental regulation. Resour. Energy Econ. 2005, 27, 131–142. [Google Scholar] [CrossRef]
  11. Peng, D.; Wen, L. Aging of the Rural Labor Force, Does Feminization Reduce the Efficiency of Food Production—A Comparative Analysis of the North and the South Based on the Stochastic Front. Agric. Technol. Econ. 2016, 2, 32–44. [Google Scholar]
  12. Zhou, H.; Wang, Q.; Zhang, Q. Aging of Rural Labor Force and Lack of Rice Production Efficiency—Based on the Perspective of Socialized Services. China Popul. Sci. 2014, 2, 53–65. [Google Scholar]
  13. Zhang, Z.; Qian, W. Research on farmers’ willingness to transfer land under different degrees of concurrent business—Based on investigation and demonstration in Zhejiang. Agric. Econ. Issues 2014, 3, 19–24+100. [Google Scholar]
  14. Wang, X.; Xu, D.; Hou, L.; Yang, J. Research on the mechanization of corn production and the substitution effect of mechanical labor. Agric. Technol. Econ. 2016, 6, 4–12. [Google Scholar]
  15. Wang, Y.; Li, Q. Agricultural Productive Services, Increasing Grain Production and Increasing Farmers’ Income—An Empirical Analysis Based on CHIP Data. Financ. Sci. 2019, 3, 92–104. [Google Scholar]
  16. Wang, O.; Tang, K.; Zheng, H. The impact of agricultural machinery on labor force substitution intensity and grain output. China Rural Econ. 2016, 12, 46–59. [Google Scholar]
  17. Coelli, T.J.; Rao, D.S.P.; O’Donnell, C.J.; Battese, G.E. An Introduction to Efficiency and Productivity Analysis; Springer Science & Business Media: Berlin/Heidelberg, Germany, 2005. [Google Scholar]
  18. Hu, X.; Zhong, F. The Impact of Rural Population Aging on Food Production—Analysis Based on Data from Fixed Observation Points in Rural Areas. China Rural Econ. 2012, 7, 29–39. [Google Scholar]
  19. Wang, Y.; Jiang, Q. The Impact of Productive Services on the Efficiency of Agricultural Modernization. Bus. Res. 2016, 1, 22–30. [Google Scholar]
  20. Chandio, A.A.; Jiang, Y.; Wei, F.; Rehman, A.; Liu, D. Famers’ access to credit: Does collateral matter or cash flow matter?—Evidence from Sindh, Pakistan. Cogent Econ. Financ. 2017, 5, 1369383. [Google Scholar] [CrossRef]
  21. Cai, J.; Liu, W. Social division of labor, cost sharing and the emergence of agricultural machinery operation service industry—Taking the development of agricultural mechanization in the three provinces of Hebei, Henan and Shandong as an example. J. Jiangxi Univ. Financ. Econ. 2017, 4, 83–92. [Google Scholar]
  22. Luan, J.; Han, Y. The impact of drought disaster and farmland irrigation on the technical efficiency of wheat production. Resour. Sci. 2019, 41, 1387–1439. [Google Scholar] [CrossRef]
  23. Xie, D.; Li, Z. Research on the Coordination of Rural Land Scale Management and Service Scale Management under the Background of “Separation of Three Powers”. Economist 2021, 6, 121–128. [Google Scholar]
  24. Wu, S.; Qian, Y.; Yu, H. Farmers’ Participation Model and Stability of Agricultural Scale Management: Based on the Comparison of Land-Scale Management and Service-Scale Management. Econ. Manag. 2021, 35, 30–35. [Google Scholar]
  25. Zhao, X.; Zhang, Z.; Ren, J. Does Agricultural Productive Services Affect Farmer Income—An Empirical Analysis Based on the Propensity Score Matching Model of 800 Administrative Villages. Agric. Technol. Econ. 2021, 1, 32–45. [Google Scholar]
  26. Zhang, Z.; Yi, Z. Research on the Impact of Agricultural Productive Service Outsourcing on Rice Productivity—Based on the Empirical Analysis of 358 Farmers. Agric. Econ. Issues 2015, 36, 69–76. [Google Scholar]
  27. Yang, Z.; Zhang, J.; Zhu, P. Can agricultural socialization services promote the connection of small farmers to agricultural modernization—Based on the perspective of technical efficiency. Agric. Technol. Econ. 2019, 9, 16–26. [Google Scholar]
  28. Li, Y.; Wang, X.; Liu, Y. The impact of agricultural productive services on the scale of farmland management. China Agric. Sci. Bull. 2015, 31, 264–272. [Google Scholar]
  29. Liu, Q.; Yang, W. The impact of agricultural productive services on land scale management from the perspective of farmers’ behavior. J. China Agric. Univ. 2016, 21, 188–197. [Google Scholar]
  30. Liu, Q.; Yang, W. Analysis of the Impact of Agricultural Productive Services on the Cost Efficiency of my country’s Grain Production—Taking the Rice Industry as an Example. Agric. Mod. Res. 2017, 38, 8–14. [Google Scholar]
  31. Wang, Y.; Zhao, P. Non-agricultural employment, agricultural productive services and farmland transfer—Based on the survey data of rice growers in Hunan, Anhui and Jiangsu. China’s Agric. Resour. Reg. 2022, 43, 113–121. [Google Scholar]
  32. Li, X.; Ding, D.; Gao, Q. How small farmers can organically link the whole process of mechanization—Based on the perspective of socialized service of agricultural machinery. Agric. Technol. Econ. 2021, 4, 98–109. [Google Scholar]
  33. Jiang, S.; Cao, Z.; Liu, H. The Impact and Comparative Study of Agricultural Socialized Service on Land Moderate Scale Operation—Based on the Empirical Study of CHIP Micro Data. Agric. Technol. Econ. 2016, 11, 4–13. [Google Scholar]
  34. Duan, P.; Wang, L.; Luo, J. Research on Individual Response and Influencing Factors of Outsourcing of Technology-intensive Links in Planting Industry—A Case Study of 631 Wheat Farmers in Henan and Shanxi. China Rural Econ. 2017, 8, 29–44. [Google Scholar]
  35. Chen, Y. Agricultural Technology Changes and Agricultural Transformation: A Review of Appropriationism/Substitutionism Theory. J. China Agric. Univ. Soc. Sci. Ed. 2019, 36, 24–34. [Google Scholar]
  36. Hicks, J. The Theory of Wages; Springer: Berlin/Heidelberg, Germany, 1963. [Google Scholar]
  37. Hayami, Y.; Ruttan, V.W. Factor prices and technical change in agricultural development: The United States and Japan, 1880–1960. J. Political Econ. 1970, 78, 1115–1141. [Google Scholar] [CrossRef]
  38. Ma, X.; Shen, Y.; Qiu, T.; Liu, H. Self-exploitation, endowment effect and potential market development of farmland transfer—Also discussing the transformation of small farmers’ production mode in economically underdeveloped areas. China Popul. Resour. Environ. 2017, 27, 40–47. [Google Scholar]
  39. Liu, S.; Wang, R. Agricultural Industrialization and Service Scale: Theory and Experience. Int. Econ. Rev. 2019, 6, 9–23. [Google Scholar]
  40. Luo, B. On Service Scale Operation—From Vertical Division to Horizontal Division and Contiguous Specialization. China Rural. Econ. 2017, 11, 2–16. [Google Scholar]
  41. Nevin, J.A. Signal detection theory and operant behavior: A review of David M. Green and John A. Swets’ Signal detection theory and psychophysics. J. Exp. Anal. Behav. 1969, 12, 475. [Google Scholar] [CrossRef] [Green Version]
  42. Yang, T.; Jin, X. The impact of resource endowment and social security on migrant workers’ willingness to dispose of land—Analysis based on the perspective of rational choice. China Rural Obs. 2015, 4, 16–25. [Google Scholar]
  43. Li, S.; Zhang, L. Turn out or abandon: The crowding out effect of outsourcing services on small farmers—Evidence from wheat farmers in Henan Province. J. Nanjing Agric. Univ. (Soc. Sci. Ed.) 2022, 22, 136–149. [Google Scholar]
  44. Tian, Y.; Zhang, J.; He, K.; Feng, J. Analysis of Farmers’ Agricultural Low-Carbon Production Behavior and Its Influencing Factors—Taking Fertilizer Application and Pesticide Use as Examples. China Rural Obs. 2015, 4, 61–70. [Google Scholar]
  45. Emmanuel, D.; Owusu-Sekyere, E.; Owusu, V.; Jordaan, H. Impact of agricultural extension service on adoption of chemical fertilizer: Implications for rice productivity and development in Ghana. NJAS-Wagening. J. Life Sci. 2016, 79, 41–49. [Google Scholar] [CrossRef]
  46. Yang, Z. Aging, Social Networks and Green Production Technology Adoption Behavior of Farmers—Validation of Farmer Data from Six Provinces in the Yangtze River Basin. China Rural Obs. 2018, 4, 44–58. [Google Scholar]
  47. Tong, D.; Huang, W.; Ying, R. The impact of grass-roots public agricultural technology promotion on farmers’ technology adoption—Taking rice technology demonstration as an example. China Rural Obs. 2018, 4, 59–73. [Google Scholar]
  48. Han, H.; Kong, Y. Analysis of Influencing Factors of Farmers’ Agricultural Mutual Insurance Participation Behavior—Taking Zhejiang Lin’an Hickory Farmers as an Example. China Rural. Econ. 2013, 7, 24–35. [Google Scholar]
  49. Gong, M.; Gong, Z. Household Demographics, Land Transfer, and Food Output: An Empirical Analysis Based on CHFS Data. Math. Stat. Manag. 2022, 41, 1069–1084. [Google Scholar]
  50. Zheng, J. Research on the Development of Mobile Payment in Rural Areas. Southwest Financ. 2020, 5, 63–64. [Google Scholar]
  51. Luo, L. Mechanism Analysis and Optimization Path of Inclusive Finance Empowering the Development of Rural E-commerce in Minority Areas—Taking the Three Southwest Provinces as an Example. Bus. Econ. Res. 2021, 9, 161–164. [Google Scholar]
  52. Zhou, W.; Zhang, L. The Impact of Commercial Insurance on Household Consumption Behavior—A Quantile Regression Analysis Based on CFPS. West. Financ. 2020, 2, 33–38. [Google Scholar]
  53. Wang, H.; Zhang, Q.; Lu, Q. Factor Endowment, Farmer Differentiation and Technology Selection Bias in Agricultural Value Chain. J. Huazhong Agric. Univ. (Soc. Sci. Ed.) 2022, 160, 116–128. [Google Scholar]
  54. Lin, S.; Yu, F. The Influencing Factors of Farmers’ Green Production Behavior under the Background of Comprehensively Promoting Rural Revitalization: Based on the Survey Evidence of 2448 Rural Households in 10 Provinces (Regions) across the Country. Available online: http://kns-cnki-net.webvpn.gdufs.edu.cn/kcms/detail/50.1012.F.20230105.1622.004.html (accessed on 4 February 2023).
  55. Cui, B.; Cheng, Y. Does Internet Use Increase Investment in the Education of Farmers’ Children: Micro Evidence from CHFS2019? J. Huazhong Agric. Univ. (Soc. Sci. Ed.) 2023, 1, 215–233. [Google Scholar]
  56. Xie, X.; Zhu, J. Analysis of Regional Differences in Factors Influencing Cultivated Land Quality and Research on Improvement Ways—Taking Xinzheng City, Henan Province as an Example. China Land Sci. 2017, 31, 70–78. [Google Scholar]
  57. Huo, Z.; Li, S.; Wang, S.; Liu, J.; Xue, C. Research on risk assessment technology and application of major agrometeorological disasters. J. Nat. Resour. 2003, 18, 692–703. [Google Scholar]
  58. Chen, X.; Yue, X.; Ge, X.; Wang, X. Effects of long-term straw returning to the field on soil organic carbon pool in the plow layer. J. Nat. Resour. 2012, 27, 25–32. [Google Scholar]
  59. Mu, Y. Research on the path of effective use of resources to ensure food security. Theor. J. 2022, 6, 110–118. [Google Scholar]
  60. Li, H.; Zhong, Z. Acquaintance Service: The Priority Choice of Agricultural Productive Services for Small Farmers. J. Northwest A&F Univ. Soc. Sci. Ed. 2020, 20, 121–127. [Google Scholar]
  61. Shen, X.; Wu, C.; Fang, M. Analysis of Coordination of Industry, Population and Land Non-agriculturalization in Zhejiang Province. China Popul. Resour. Environ. 2014, 24, 129–134. [Google Scholar]
  62. Yang, J.; Zhong, F.; Chen, Z.; Peng, C. The price of rural labor force, the impact of population structure changes on the grain planting structure. Adm. World 2016, 1, 78–87. [Google Scholar]
  63. Zhang, X.; Yang, J.; Thomas, R. Mechanization outsourcing clusters and division of labor in Chinese agriculture. China Econ. Rev. 2017, 43, 184–195. [Google Scholar] [CrossRef]
  64. Li, Z.; Feng, L. The pulling effect of optical fiber network scale on rural non-agricultural employment. Econ. Rev. 2021, 227, 96–111. [Google Scholar]
  65. Zhang, Y.; Dai, R. The Impact of Rural Infrastructure on Agricultural Economic Growth: An Empirical Analysis Based on National Provincial Panel Data. Agric. Technol. Econ. 2018, 3, 90. [Google Scholar]
  66. Chen, X.; Yao, L. Characteristics of Rural Dilution in Northern Anhui, Influencing Factors and Formation Mechanism—Based on the Perspective of Urban-Rural Relations. J. Nat. Resour. 2020, 35, 1958–1971. [Google Scholar]
  67. Zhu, F.; Zhang, F.; Li, C.; Jiao, P.; Wang, J. Coordination degree and regional differences of land and population urbanization in China from 1993 to 2008. Prog. Geogr. Sci. 2014, 33, 10. [Google Scholar]
  68. Ma, W.; Renwick, A.; Grafton, Q. Farm machinery use, off-farm employment and farm performance in China. Aust. J. Agric. Resour. Econ. 2018, 62, 279–298. [Google Scholar] [CrossRef]
  69. Kousar, R.; Abdulai, A. Off-farm work, land tenancy contracts and investment in soil conservation measures in rural Pakistan. Aust. J. Agric. Resour. Econ. 2016, 60, 307–325. [Google Scholar] [CrossRef]
  70. Xiaoshi, Z. Study on the Production Effect of Farmers Using Agricultural Machinery. Ph.D. Thesis, Huazhong Agricultural University, Wuhan, China, 2019. [Google Scholar]
  71. Pang, L.; Rozelle, S.; de Brauw, A. Research on Labor Supply of the Elderly in Rural China. Economics 2003, 2, 721–730. [Google Scholar]
  72. Chen, X.; Wang, Z. Factor Analysis of Suzhou Farmers’ Concurrent Business Behavior. China Rural. Econ. 2007, 4, 25–31. [Google Scholar]
  73. Zheng, X.; Wang, F.; Ying, R. Farmer’s Endowment Constraints, Technical Attributes and Agricultural Technology Selection Bias—An Analytical Framework of Farmer’s Technology Adoption Based on Incomplete Factor Market Conditions. China Rural Econ. 2018, 3, 105–122. [Google Scholar]
  74. Guo, Q. Small Farmers: Attributes, Types, Business Status and Its Connection with Modern Agriculture. Agric. Econ. Issues 2018, 6, 25–37. [Google Scholar]
  75. Dong, H. Agricultural Machinery Service System: Model Comparison and Policy Optimization—An Investigation Based on the Perspective of Differentiation of Agricultural Management Subjects. Rural Econ. 2018, 10, 116–122. [Google Scholar]
Figure 1. Theoretical framework.
Agriculture 13 00564 g001
Figure 2. Wheat and maize planting operation flow. (a) Wheat planting operation flow; (b) Maize planting operation flow chart.
Agriculture 13 00564 g002
Table 1. Specific definitions and assignments of the main variables of each variable.
Variable NameVariable Definition and Assignment
Willingness to adjust agricultural production modes1 = self-growing; 2 = farmland transfer; 3 = Agricultural production trusteeship.
The extent of full-cycle adoption of APSContinuous Variables
Gender0 = Female; 1 = Male
AgeContinuous variables (years)
Years of educationYears of education (years)
Physical health condition1 = very unhealthy; 2 = relatively unhealthy; 3 = average;
4 = relatively healthy; 5 = very healthy
WeChat payment usageHave you used WeChat Pay in the past twelve months: 0 = No; 1 = Yes
Number of people who eat dinner at homeContinuous variables (number)
Extent of part-time employment(Total household income − Total farm business income)/
Total household income
Whether the village officials0 = No; 1 = Yes
Whether the member of the CCP0 = No; 1 = Yes
Frequency of irrigation in full cycleFrequency
Grain yield per hectareTotal yield of wheat and maize per hectare of arable land (t/ha)
Preference of service provider selectionMain sources of services used: 1 = village; 2 = village outside the village; 3 = village outside the county; 4 = county outside the province; 5 = non-province
Total agricultural machinery power per hectareTotal agricultural machinery power/total crop sowing area ( 10 2  kWh/ha)
Electricity consumption in rural areas 10 9 kWh
Disposable income per rural resident 10 3 USD/person
Table 2. Descriptive statistical analysis of the main variables.
Variable NameObservationsMeanSDMinMax
Willingness to adjust the APM5901.5810.7841.0003.000
Extent of adoption of full-cycle APS5900.4700.1140.1250.792
Gender5900.6830.4660.0001.000
Age59060.01010.19229.00083.000
Years of education5905.8343.6310.00016.000
Physical health condition5903.5640.9021.0005.000
Usage of WeChat payment5900.4690.4990.0001.000
Number of people who eat dinner at home5903.3271.6671.00010.000
Extent of part-time employment5900.4450.3090.0001.000
Whether the village officials5900.0830.2760.0001.000
Whether the member of the CCP5900.1140.3180.0001.000
Frequency of irrigation in full cycle5903.3972.2050.00010.000
Grain yield per hectare59013.6523.1964.50021.750
Preference of service subject selection5902.2631.4841.0005.000
Total power of agricultural machinery per hectare59010.4347.2635.60629.264
Electricity consumption in rural areas5902.8161.1911.2104.430
Disposable income per rural resident5902.7320.4641.9403.427
Table 3. Estimation results of mlogit model of willingness to adjust agricultural production methods.
Variable NameLn (P2/P1)Ln (P3/P1)
CoefficientRelative Risk RatioCoefficientRelative Risk Ratio
Extent of adoption of full-cycle APS2.424 **11.2941.979 *7.238
Gender−0.0220.9780.2731.314
Age0.0091.009−0.0090.991
Years of education0.0561.0570.0071.008
Physical health condition−0.0470.954−0.0670.935
Usage of WeChat payment−0.0200.9800.538 *1.712
Number of people who eat dinner at home−0.285 ***0.752−0.1200.887
Extent of part-time employment−0.2020.8170.1161.123
Whether the village officials−0.4630.630−0.1180.889
Whether the member of the CCP0.740 *2.0971.088 ***2.968
Frequency of irrigation in full cycle0.0111.0110.0091.010
Grain yield per hectare0.0411.0420.0561.058
Preference of service subject selection0.0431.0440.0001.000
Total power of agricultural machinery per hectare0.086 ***1.0900.049 *1.050
Electricity consumption in rural areas0.237 *1.2680.1431.153
Disposable income per rural resident0.978 **2.6580.2971.346
Constant−7.0170.001−4.2990.014
Sample size590
Pseudo-judgment factor0.0670
IIA x 2 ( 18 ) = 0.81 ( p = 1.000 )
IIA x 2 ( 17 ) = 3.65 ( p = 0.9997 )
Likelihood ratio test69.91
p-value0.000
Log-likelihood value−486.485
Note: ***, **, * denote variables significant at the 1%, 5%, and 10% levels, respectively; relative risk ratio denotes the contribution of the corresponding explanatory variables to the probability of occurrence of the explanatory variables; the model uses farmers who chose “self-growing” as the benchmark group.
Table 4. Average marginal effects of main variables.
Willingness to Adjust Agricultural Production ModesSelf-GrowingFarmland TransferAgriculture Production Trusteeship
The extent of full-cycle APS−0.485 ***0.296 *0.189
(0.186)(0.163)(0.156)
Other Variablescontrolled
Usage of WeChat payment−0.054−0.0270.081 *
(0.054)(0.046)(0.044)
Other Variablescontrolled
Number of people who eat dinner at home0.045 ***−0.040 ***−0.005
(0.013)(0.012)(0.011)
Other Variablescontrolled
Whether the member of the CCP−0.199 ***0.0690.130 **
(0.076)(0.062)(0.056)
Other Variablescontrolled
Total power of agricultural machinery per hectare−0.015 ***0.011 ***0.004
(0.005)(0.004)(0.004)
Other Variablescontrolled
Electricity consumption in rural areas−0.042 *0.0310.011
(0.025)(0.021)(0.020)
Other Variablescontrolled
Disposable income per rural resident−0.143 **0.142 **0.001
(0.068)(0.058)(0.058)
Other Variablescontrolled
Note: Numbers in parentheses are robust standard errors; ***, **, * indicate variables significant at the 1%, 5%, and 10% levels, respectively.
Table 5. Estimation results of mlogit model of willingness to adjust agricultural production modes.
Variable NameLn (P2/P1)Ln (P3/P1)
CoefficientRelative Risk RatioCoefficientRelative Risk Ratio
Farmers’ type0.477 **1.6110.497 **1.644
Gender−0.0390.9620.2581.294
Age0.0091.009−0.0090.991
Years of education0.0511.0530.0051.005
Physical health condition−0.0420.959−0.0650.937
Usage of WeChat payment0.0141.0140.568 *1.764
Number of people who eat dinner at home−0.279 ***0.756−0.1150.891
Extent of part-time employment−0.1610.8520.1411.151
Whether the village officials−0.4650.628−0.1380.871
Whether the member of the CCP0.758 *2.1351.105 ***3.018
Frequency of irrigation in full cycle0.0121.0120.0101.010
Grain yield per hectare0.0431.0440.0581.060
Preference of service subject selection0.0411.041−0.0010.999
Total power of agricultural machinery per hectare0.085 ***1.0880.049 *1.050
Electricity consumption in rural areas0.2221.2480.1371.147
Disposable income per rural resident0.989 **2.6880.2991.348
Constant−6.6120.001−4.1420.016
Sample size590
Pseudo-judgment factor0.0668
IIA x 2 ( 17 ) = 0.06 ( p = 1.000 )
IIA x 2 ( 16 ) = 5.65 ( p = 0.9915 )
Likelihood ratio test69.71
p-value0.000
Log-likelihood value−486.585
Note: ***, **, * denote variables significant at the 1%, 5%, and 10% levels, respectively; relative risk ratio denotes the contribution of the corresponding explanatory variables to the probability of occurrence of the explanatory variables; the model uses farmers who chose “self-growing” as the benchmark group.
Disclaimer/Publisher’s Note: The statements, opinions and data contained in all publications are solely those of the individual author(s) and contributor(s) and not of MDPI and/or the editor(s). MDPI and/or the editor(s) disclaim responsibility for any injury to people or property resulting from any ideas, methods, instructions or products referred to in the content.

