
BAG: A Linear-Nonlinear Hybrid Time Series Prediction Model for Soil Moisture

1
College of Mathematics and Computer Science, Zhejiang A&F University, Hangzhou 311300, China
2
School of Information Engineering, Huzhou University, Huzhou 313000, China
*
Author to whom correspondence should be addressed.
Agriculture 2023, 13(2), 379; https://doi.org/10.3390/agriculture13020379
Submission received: 23 November 2022
/
Revised: 25 January 2023
/
Accepted: 2 February 2023
/
Published: 4 February 2023
(This article belongs to the Special Issue Applications of Data Analysis in Agriculture)
Abstract
:Soil moisture time series data are usually nonlinear in nature and are influenced by multiple environmental factors. The traditional autoregressive integrated moving average (ARIMA) method has high prediction accuracy but is only suitable for linear problems and only predicts data with a single column of time series. The gated recurrent unit neural network (GRU) can achieve the prediction of time series and nonlinear multivariate data, but a single nonlinear model does not yield optimal results. Therefore, a hybrid time series prediction model, BAG, combining linear and nonlinear characteristics of soil moisture, is proposed in this paper to achieve the identification process of linear and nonlinear relationships in soil moisture data so as to improve the accuracy of prediction results. In BAG, block Hankel tensor ARIMA (BHT-ARIMA) and GRU are selected to extract the linear and nonlinear features of soil moisture data, respectively. BHT-ARIMA is applied to predict the linear part of the soil moisture, and GRU is used to predict the residual series, which is the nonlinear part, and the superposition of the two predicted results is the final prediction result. The performance of the proposed model on five real datasets was evaluated. The results of the experiments show that BAG has a higher prediction accuracy compared with other prediction models for different amounts of data and different numbers of environmental factors.
1. Introduction
In the process of modernization, soil moisture forecast is very important for agricultural planting. By automatically monitoring soil moisture data and establishing an effective soil moisture prediction model, we can predict the trend of the soil moisture content at different depths in advance in order to improve the utilization of water resources, which is of certain significance for the scientific water supply of crops and sustainable development of agriculture.
Changes in soil moisture can be predicted by a variety of methods, and the main models commonly used are the empirical equation method, the water balance method [1,2], the time series prediction method [3,4], and the neural network prediction method [5,6]. Among them Pignotti et al. [7] analyzed the target predicted changes by simulating soil moisture through artificial perturbations and assessed the sensitivity of complex ecology to soil moisture with the help of a water balance model. Although the equations of the water balance method are simple and easy to understand, the measurement indicators are numerous and complex. Figueroa et al. [8] used time series analysis methods for the outlier detection and pattern recognition of soil moisture sensor data and improved soil moisture prediction and irrigation systems. However, soil moisture data usually have nonlinear characteristics, and traditional time series prediction models are linear models, which provides some limitations in modeling soil moisture time series. Among them, are physically based soil-vegetation-atmosphere transfer (SVAT) [9] schemes that address the nonlinear properties of the soil moisture time series. However, the operation of the SVAT model usually requires data such as vegetation structure (including canopy height), optical characteristics of soil and vegetation (such as reflectance), physiological characteristics of vegetation (such as stomatal conduction), and so on. The existing SVAT model contains a large number of parameters and empirical constants that need to be determined. Even a fully equipped micro-meteorological test site that can fully control the plant environment cannot fully provide the exact values of these constants. At the same time, neural networks with nonlinear models are widely used in the field of time series prediction. Cai et al. [10] proposed a deep learning regression network (DNRR) with a large data fitting capability to construct soil moisture prediction models, and the relationship between features and variables was clarified by Taylor diagrams, and meteorological parameters were selected to provide effective weights for predicting moisture. However, a single nonlinear model does not obtain optimal results for soil moisture time series data with both linear and nonlinear characteristics. Guo et al. [11]. proposed a combined prediction method that first extracts the linear part of the fitted wind speed data using the ARIMA model and then extracts the fitted nonlinear components using least squares and support vector machine, and this combined model improves the wind speed prediction accuracy.
Changes in soil moisture conditions are a complex nonlinear process. For example, Peterson et al. [12] proposed a nonlinear transfer function noise model because existing methods do not consider nonlinear soil drainage, and in a test of 84 nonlinear models and two linear models, it was possible to obtain that the nonlinear time series model performed significantly better in all observation holes during calibration and evaluation. Figure 1 shows the trend in the soil moisture content at depths 5 cm, 20 cm, 40 cm, and 60 cm in one of the experiment areas from January 2010 to December 2010, respectively, and it can be seen that soil moisture data usually are nonlinear time series data.
Soil moisture is influenced by the properties of the soil itself (texture, composition, permeability, organic content, etc.) [13,14,15] and by environmental factors (temperature, precipitation, evaporation, etc.) [16,17]. Niu et al. [18] found that the GEP model based on temperature, barometric pressure, humidity, wind speed, ground temperature, rainfall, and initial temperature values as model inputs could better achieve soil moisture prediction. Fu et al. [19] used the ensemble Kalman filter (EnKF) and simple biosphere model (SiB2) for soil moisture assimilation prediction to study the initial state values at different assimilation frequencies and rainfall on soil moisture prediction and found that soil moisture prediction was influenced by precipitation during the prediction period. In response to the above characteristics of soil moisture, a hybrid prediction model BAG was proposed in this paper combining linear and nonlinear characteristics of soil moisture, which uses the multiple short time series prediction of block Hankel tensor ARIMA [20] (BHT-ARIMA) and gated recurrent unit(GRU) [21], and is able to identify and process environmental factors affecting soil moisture to improve the accuracy of prediction results. First of all, BAG analyzes the collected time series data to grasp the time series characteristics of the soil moisture and, after correlation analysis, selects multiple environmental factors related to them as inputs; then, BHT-ARIMA is used to reveal the linear pattern of soil moisture data; finally, the residual series of BHT-ARIMA were modeled and predicted by GRU, a neural network with nonlinear characteristics, to obtain the nonlinear variation pattern of soil moisture. The superposition of the two predicted results is the final predicted result of BAG.
2. Materials and Methods
This section describes the BAG proposed in this paper. Firstly, the dataset used in this paper is introduced. Afterward, the main idea of BAG and the underlying principles involved are described in detail. Finally, the experimental design is described.
2.1. Datasets
The data used in this study are the long-term positioning observation data of basic ecological elements provided by the Ecological Positioning Station of Zhejiang Province, including meteorological factors, soil moisture, and temperature. The study areas were five regions in Zhejiang Province, and their locations (latitude and longitude) with their climatic characteristics are given in Table 1. The soils in the five experimental areas were red loam soils with high hematite content, the red color of iron and aluminum oxides, and acidic reaction. Additionally, the clay grain content is very high, and the texture is sticky and heavy, but the structural body formed by the iron oxide and alumina colloids results in a relatively good infiltration of the soil and less severe water stagnation; its soil is highly weathered and poor in plant nutrients.
The data in this study spanned from January 2010 to December 2010, and the data collection device measured every hour and took daily average records, and a total number of 1825 sets of samples were obtained from the five experimental areas. Each data set included soil temperature, humidity, and meteorological data for one day. The data were collected at a depth of 0~60 cm, and the corresponding sensors were buried at 5 cm, 20 cm, 40 cm, and 60 cm to collect them. The details are described as follows.
- (1)
- Soil moisture variables include soil moisture at 5 cm, 20 cm, 40 cm, and 60 cm, where soil moisture data is the volumetric water content of the soil at different depths, i.e., units.
- (2)
- Other environmental variables refer to meteorological data and soil temperature data at different depths, where meteorological data include rainfall, atmospheric temperature, vegetation temperature, relative air humidity, wind speed, wind direction, sunshine duration, daily evaporation, and solar radiation intensity. Soil temperature data at different depths include soil temperature at 5 cm, 20 cm, 40 cm, and 60 cm.
2.2. Problem Definition
Soil moisture prediction, which is based on input soil moisture time series data and multiple environmental factor time series data, predicts the data for the next time point of the soil moisture time series. The symbols are defined here as follows.
- t: The length of the time series, i.e., the number of rows of input data.
- m: The sum of soil moisture and the number of types of environmental factor data, i.e., the number of columns of input data.
- n: The sum of soil moisture and the number of types of environmental factor data actually used, i.e., the number of columns for the preprocessed data.
- S = {s1, s2, …, st}: The data of daily average soil moisture time series to be predicted for the next data.
- F = {{f1,1, f1,2, …, f1,t}, {f2,1, f2,2, …, f2,t}, …, {fn-1,1, fn-1,2, …, fn-1,t}, …, {fm-1,1, fm-1,2, …, fm-1,t}}: Denoted as the time series data of m-1 environmental factors.
- X = {x1, x2, …, xt}, : The actual values after the analyzed and processed time series data.
- : The denotation of soil moisture and multiple related environmental factors data using a multi-way delay embedding transform, i.e., the soil Hankel tensor.
- Y = {y1, y2, …, yt}, : The linear predicted result after BHT-ARIMA prediction.
- : The core tensor of the soil used the Hankel tensor of the soil obtained in the previous step and used Tucker decomposition to obtain a new identity.
- R = {r1, r2, …, rt}, : The residual series of the actual value X and the linear part of the predicted result Y after the analyzed and processed time series data.
Based on the definitions above, the problem to be resolved in this paper is designing a time series prediction model; the use of a predicted value for the next data of the soil moisture time series can be obtained for the input data of soil moisture time series data S and multiple environmental factor time series data F.
2.3. BAG Model
2.3.1. Main Idea
The variation in soil moisture is a complex nonlinear process which is greatly affected by environmental factors such as temperature, rainfall, and evaporation. A single soil moisture prediction model is only able to extract one of the linear or nonlinear relationships in complex data, making the prediction results more inaccurate. Therefore, a time series prediction model, BAG, is proposed in this paper, which combines the characteristics of linear and nonlinear models to achieve the identification and processing of linear and nonlinear relationships of soil moisture data in order to improve the accuracy of prediction results.
In the BAG proposed in this paper, block Hankel tensor ARIMA (BHT-ARIMA) and the gated recurrent unit neural network (GRU) was selected to extract linear and nonlinear characteristics of soil moisture data, respectively. Among the time series forecasting models, ARIMA [22,23,24] is a very classical time series forecasting model with high prediction accuracy and a good fit for the linear part of the data, but it can only predict data with time series in a single feature. Therefore, BAG chose to incorporate BHT-ARIMA, which uses a multiway delay embedding transform (MDT) along the time direction, which is capable of converting multiple time series into a higher-order block Hankel tensor for the prediction of multiple environmental factors and soil moisture. GRU enables the better prediction of time series and nonlinear data but soil moisture time series data have both linear and nonlinear characteristics, and optimal results are not obtained using a single nonlinear model GRU. The BAG proposed in this paper uses a hybrid model for soil moisture prediction, and its structure is shown in Figure 2.
The main idea of the BAG model for soil moisture data which has strong nonlinear characteristics consists of three components, which are as follows.
- (1)
- The analysis and processing of time series data. The collected soil moisture data S and multi-environmental factor data F were analyzed for normality and correlation to comprehensively grasp the time series characteristics of soil moisture data. The input time series data were then processed to obtain the normalized data x1, …, xt, which reduces the problem of the large relative variability of the data due to the unit differences of different sample data.
- (2)
- The prediction of linear components of soil moisture. Linear features of soil moisture time series were extracted using a BHT-ARIMA. BHT-ARIMA uses a multiway delay embedding transform (MDT) [25,26] to represent soil moisture and multiple relevant environmental factor data, such as a soil higher-order Hankel tensor , …, . Tucker decomposition [27,28] can be applied to project the higher-order tensor onto the compressed soil core tensor ,…,. At the same time, the generalized tensor. The autoregressive integrated moving average (ARIMA) was explicitly used to predict a continuous core tensor to obtain the prediction of the linear part yt+1, which improved the intrinsic correlation between the soil moisture and several environmental factors.
- (3)
- Prediction of nonlinear components of soil moisture. A GRU network was established to model the residual series r1, …, rt between the predicted results y1, …, yt and the actual values x1, …, xt of the BHT-ARIMA to obtain the nonlinear part of the prediction result rt+1 to solve the nonlinear problem of soil moisture data.
2.3.2. Analysis and Processing of Time Series Data
The analysis and processing of time series data mainly include the following aspects.
- (1)
- Data outlier correction. As the acquisition system for data usually has coarse error data, outliers in the data need to be processed. Based on the fact that soil moisture data are fixed interval time series data, the mean value of the data before and after the time of the outliers is used to correct for outliers in the data and to maintain the integrity of the data.
- (2)
- Data dimensionality reduction includes two steps the normality test and correlation analysis. The correlation analysis of different data series was used to determine the association between the data of each dimension, and the data with a strong correlation was selected near subsequent processing. Among them, the larger the absolute value of the correlation coefficient, the stronger the correlation. The closer the correlation coefficient is to 1 or −1, the stronger the correlation is, and the closer the correlation coefficient is to 0, the weaker the correlation is. In order to express the correlation of the data, it is necessary to test the normality of the data and select corresponding correlation evaluation indicators according to whether the data are normal or not.
- (3)
- Data normalization. Because of the large range of relative variation in values between soil moisture and other environmental factor data, direct input is not conducive to model convergence, so the input data for soil moisture needs to be standardized.
In the above three aspects, a relatively general method was used for the first one, so we do not introduce it in any more detail. The second one mainly included two steps: the normality test and correlation analysis. They are introduced in the following part, along with the third aspect, data normalization.
- (1)
- Normality test
The test to determine whether the overall population follows a normal distribution using observed data is called a normality test and is an important special goodness-of-fit hypothesis test in statistical judgments. Common methods of testing the normality of data are graphical, statistical, and descriptive methods. The statistical tests include the K-S test (Kolmogorov–Smirnov test) and the S-W test (Shapiro–Wilk test), etc. The use of statistical plots for normality analysis relies too much on the subjective judgment of the analyst and is prone to biased results. Additionally, soil moisture data are usually small sample data. Thus, the S-W test was chosen to analyze whether the soil data had normally distributed qualities. By calculating the test statistic W, referencing a specific table of critical values for the normality W test, and comparing their magnitudes, the hypothesis was accepted that the overall population obeys the normal distribution if the conditions are met, and vice versa, and Equation (1) is the expression of its test statistic W.
where is the -th sample of the data, is the determined significance level, and the corresponding coefficient according to the sample size of .
- (2)
- Correlation analysis
Correlation analysis refers to the analysis of two or more elements of variables that have a correlation so as to measure the closeness of the correlation between two factors. By eliminating some environmental factors that play a smaller role, it can reduce the dimensionality of the soil moisture prediction model and save the time of model application, and it allows the calculation of strongly correlated environmental factors to reduce crossover and facilitate the experimental results. The correlation coefficient measures the degree of agreement between two variables, and the more commonly used ones are the Pearson correlation and Spearman correlation coefficient. Among them, the Pearson correlation coefficient is used to determine the degree of linear correlation between two variables and describe the closeness of the association between two fixed-distance variables. The Spearman correlation coefficient is a non-parametric rank statistical parameter that is a non-parametric measure of the statistical correlation between two variables. The Pearson correlation coefficient is chosen if the data are continuous variables and conform to a normal distribution, and the Spearman correlation coefficient is chosen otherwise. Equations (2) and (3) are the formulae for the Pearson correlation coefficient and Spearman correlation coefficient of the x and y variables, respectively.
where , are the sample means of x, y, respectively, and n is the number of samples for both x and y variables.
- (3)
- Data normalization
Since the input data of soil moisture at different depths and other environmental factors have a large range of relative variation in values with each other, direct input is not conducive to the convergence of the model. To eliminate these effects, this paper normalized the input data of the soil moisture, i.e., changed the distribution of the data without changing the data attributes, and made the data conform to a distribution with a mean of 0 and a variance of 1 by transformation so that the data were compared with each other. The input data are formed into an input sequence separately, and the data are normalized using z-score normalization: a method that normalizes the data based on the mean and standard deviation of the original data. Normalizing the original value of the data to and using the z-score, the transformation function (4) is shown below,
where is the mean of all the sample data and is the standard deviation of all the sample data.
2.3.3. Prediction of Linear Components of Soil Moisture
In BAG, BHT-ARIMA is used to extract linear features of soil moisture time series and to mine the relationship between multiple environmental factors associated with soil moisture. ARIMA is one of the popular and widely used linear models but requires multiple predictions of soil moisture time series data on a case-by-case basis and does not take into account the intrinsic relationships between relevant environmental factors. BHT-ARIMA combines the analyzed and processed time series data incrementally broadened into higher-order tensor with the help of the multi-way delay transform (MDT) technique and combines the tensor decomposition with the classical time series forecasting model ARIMA to achieve forecasting that is applicable to multiple time series data [29,30]. BHT-ARIMA utilizes the low-rank structure of the block Hankel tensor in the embedding space and is able to capture the intrinsic correlation of multiple environmental factors to improve the prediction results. It mainly consists of the following steps.
- (1)
- Model parameters determination
Before forecasting using BHT-ARIMA, the number of autoregressive order, differences, and moving average order, i.e., (p, d, q), need to be determined, where p is the AR model parameter, q is the MA model parameter, and d is the number of differences made to make the time series data a stationary series.
Fitting BHT-ARIMA requires that the time series data of the response inputs are all stationary series, so the remaining relevant environmental factors are tested according to the requirement of judging stationarity. It is more accurate to apply statistical tests for the stationarity of the time series using statistics in addition to judging it visually through graphs. The augmented Dickey–Fuller test (ADF) is a test commonly used in statistical tests: the original hypothesis is rejected when the obtained p-value is less than the significance level of 0.05, and the original time series is considered stable, and when the p-value is less than or equal to the level of 0.99 and greater than 0.5, the original hypothesis is not rejected and the time series is considered unstable. Therefore, the soil moisture data and the rest of the environmental factors undergo stationarity judgment, and if it is unstable, the time series is the first-order difference; that is, d = 1. Then, the ADF test is carried out, and a significant p-value can be obtained to judge the stationarity until the input variable is in a stable sequence.
The parameters of ARIMA (autocorrelation order p and moving average order q) were estimated based on autocorrelation plots (ACF) and partial autocorrelation plots (PACF) with the coefficient of certainty (R2), Akaike information criterion (AIC) [31], the Schwarz criterion (SC) [32], the HQ information criterion (HQ), Durbin Watson test (DW), and other information criterion value criteria to select the optimal model parameters for the BHT-ARIMA prediction model. In the experimental part of this paper, AIC is selected as the basis for determining the optimal model parameters. It is based on the concept of entropy and can measure the complexity of the evaluated model and the goodness of this model data. Among them, the model corresponding to the minimum AIC value is the optimal choice. It is shown in Equation (5).
where is the penalty factor, k is the number of sample parameters, and T is the number of samples.
- (2)
- BHT MDT. Soil moisture and multiple related environmental factors are transformed into higher-order multidimensional data along the time dimension using a multi-way delay embedding transform (MDT). The resulting higher-order multidimensional tensor is called “Block Hankel Tensor (BHT)”. Equation (6) is the formula for the MDT of time series data along the time dimension.
- (3)
- Tucker decomposition. The obtained Hankel tensor , …, of the soil block is used to obtain a new feature, called the core tensor , …, , using the Tucker decomposition [33], and the (p, d, q)-order classical ARIMA is extended to the tensor form so that it can directly deal with multiple environmental factors and better capture the correlation between the time series. Equation (7) is its main expression.
- (4)
- ARIMA predictor. The tensor ARIMA was trained using the soil core tensor , …, to predict the new core tensor , and then the predicted values yt+1 of all soil moisture and environmental factors were obtained simultaneously by Tucker’s inverse transform and MDT inverse transform, and the interrelationship between the soil moisture and multiple environmental factors time series was used in the model construction process to improve the prediction accuracy. Equation (8) is its expression.
Here, , The soil Hankel tensor ,…, is derived from the input soil data X = {x1, x2, …, xt}. Using the soil block Hankel tensor, its order difference is calculated to obtain . By using the joint orthogonal factor matrix to project onto the soil kernel tensor . and is the coefficient of AR and MA, is the random error of past q observations.
2.3.4. Prediction of Nonlinear Components of Soil Moisture
Soil moisture conditions are complex and variable, containing both linear and nonlinear trends, and it is difficult to fully fit the prediction using only a single model. Therefore, this paper selects the gated recurrent unit (GRU), which is more suitable for extracting the nonlinear part of the data for the feature extraction of the nonlinear part.
GRU is a simplification of the LSTM neural network [34] and was also proposed to solve problems such as long short-term memory and gradients in backpropagation for processing and predicting sequential data. Compared with LSTM, GRU are simpler to compute, easier to implement, have fewer parameters, and are less prone to overfitting. Additionally, in terms of the number of iterations needed and convergence time GRU are better.
The GRU network introduces two gate structures: the update gate and the reset gate. The update gate is used to describe the degree of influence of the soil characteristic information of the previous moment, and a larger threshold value indicates that the soil characteristic information of the previous moment has more influence on the current moment; the reset gate is used to control the degree of ignoring the soil characteristic information of the previous moment, and a smaller threshold value indicates more ignoring of the past information. Equations (9) and (10) represent the calculation formulae for the update gate and reset gate, respectively.
After calculating the update gate and the reset gate , the new candidate hidden state uses the reset gate to store the soil information related to the past. Finally, the update gate is used to calculate , which retains the soil information of the current cell and passes it to the next cell. The mapping relationship is shown in Equations (11) and (12).
Here, is the soil error input data at the current moment; is the hidden state passed down from the previous moment; and denote the update gate and reset gate, respectively; is the current suitable error output and is the new candidate hidden state. The tanh function is used to change the data to a value in the range [−1,1]. , and are the weight matrices of the update gate, reset gate, and candidate hidden state, respectively.
The actual values of the input soil moisture time series data x1, …, xt are subtracted from the predicted results y1, …, yt and measured by the linear part of BHT-ARIMA to obtain the residual data r1, …, rt. The residual data r1, …, rt is the input data of GRU. GRU training for nonlinear prediction is set up in three layers, as shown in Figure 3. The first layer is a GRU layer, which sets the input and output dimensions and the parameter return_sequences. If the return_sequences are false, the value of the hidden state for a single time step is returned; if it’s true, the value of all hidden states is returned. The Dropout, which is the random deactivation rate, is set to randomly discard some neural nodes during the training process to prevent overfitting. The second layer is also a GRU layer, where the input dimension is the output dimension of the previous layer, and the values of return_sequences and the parameter Dropout are set. The third layer is the fully connected dense layer, which maps the feature space calculated in the previous layer to the sample label space to improve the robustness of the whole network. In the training process of the model, the value of the loss function of the model is calculated to determine whether the model meets the accuracy requirements. The mean square error (RMSprop) is selected as our optimization algorithm. The smaller the loss is, the better the robustness of the model. When the model meets the accuracy requirements, the GRU model with good robustness is selected for the final output after setting the model learning rate and the number of iterations. If the model does not meet the accuracy requirement, the model needs to be continuously corrected by error backward transfer update until the model meets the prediction accuracy requirement.
2.4. Design of Experiments
2.4.1. Software and Hardware Configuration
To evaluate the performance of BAG, it was implemented using the deep learning framework PyTorch with the hardware and software configurations shown in Table 2.
2.4.2. Parameters of Experiments
The pre-processed time series data were processed and divided into a 90% training set and a 10% test set. There are 365 × 5 data labels in the five data sets of dataA~dataE, and 364 data labels were selected for each data set, including 364 × 90% data for the training set and 364 × 10% data for the test set. The optimal hyperparameters of the model were selected using a grid search method during the experiments and are shown in Table 3.
2.4.3. Evaluation Metrics
In this paper, the performance of BAG was evaluated using relative error (RE). The relative error refers to the value obtained by multiplying the ratio of the absolute error caused by the prediction and the predicted true value by 100% and is expressed as a percentage. Generally speaking, the relative error better reflects the degree of confidence in the measurement. The formula for the relative error is as follows.
where x is the predicted value and is the true value.
2.4.4. Schemes of Experiments
The experiment in this paper consists of five parts, one of which is for the performance of soil moisture prediction, three of which are about the influence factors of soil moisture prediction, and the last part of which is ablation experiments.
- (1)
- Soil moisture prediction. Using the time series data of DataA~DataE, BAG, and several other prediction models such as Prophet [35], LSTM, DeepAR [36], XGBoost [37], and DeepState [38] were used to conduct the soil moisture prediction comparison experiments. For each prediction model, the average of the prediction results of five datasets was calculated, and the performance of each model was evaluated accordingly.
- (2)
- The effect of the input sequence length on prediction performance. In the process of moisture monitoring and prediction, reasonable sampling intervals are very important for data modeling. Therefore, DataA~DataE were selected to conduct comparisons between the prediction and their actual measured values for three-time spans. The data were sequentially divided according to continuous, every other day, and every two days, and the resulting amounts of data were 365, 182, and 121, respectively, which constitute the three sets of input data for BAG to predict the predicted results at different depths for these three sets of data.
- (3)
- The effect of the number of environmental factors on prediction performance. To verify the effects of different environmental factors on BAG, environmental factors within different correlation thresholds were selected for the comparative analysis of DataA~DataE time series data based on the correlation analysis results.
- (4)
- Correlation between soil depth and performance of prediction. BAG was used to predict different depths of DataA~DataE to analyze the performance of the model at different depths. A total of 364 data items were used for all five data to predict soil moisture at different depths for the next time point.
- (5)
- Ablation experiments. The ablation experiment is one of the key factors for assessing the quality of the model. In this paper, we used DataA~DataE time series data to reduce the improvement features on BAG and verify the necessity of the corresponding improvement features.
3. Results and Discussion
This section validates the BAG proposed in this paper. First, the data are analyzed and processed. Then, BAG is compared with other prediction models. Finally, a series of simulations and ablation experiments are performed for this model, and the experimental results and analysis are conducted.
3.1. Data Analysis and Processing
Correlation analysis and normal distribution test were performed on the soil moisture data and environmental factor data after error processing to fully grasp the serial characteristics of DataA, DataB, DataC, DataD, and DataE.
3.1.1. Normality Test
The Shapiro–Wilk test was performed on the 17 impact factors of the time series data to check their significance. When the obtained p-value was less than 0.01, the null hypothesis was rejected, and the sample data was considered to be from the normal distribution. On the contrary, the null hypothesis was not rejected, and the sample data was not normally distributed. Table 4 shows the results of the normality test for each environmental factor, it can be obtained that the significance p-value for each environmental factor is less than 0.01, the level presents significance, and the original hypothesis is rejected, so the time series data does not satisfy the normal distribution. In Table 4 and other following tables, SM-5 cm means soil moisture at the depth of 5 cm, and ST-5 cm means soil temperature at the depth of 5 cm.
3.1.2. Correlation Analysis
In order to screen the key environmental impact factors, the correlation analysis of soil moisture and environmental factors for the five datasets was conducted in this study. From Section 3.1.1, DataA~DataE does not satisfy the normal distribution, so the Spearman correlation coefficient was chosen. The results of the analysis are shown in Table 5 and Table 6. The correlation coefficients of the soil moisture at the depths of 5 cm, 20 cm, 40 cm, and 60 cm for the same environmental factor varied, but the deviation was small. Therefore, taking the average value of the same environmental factor at different depths, it can be concluded that the correlation between the soil moisture and soil temperature at the depths of 5 cm, 20 cm, 40 cm, and 60 cm, and atmospheric temperature, rainfall, solar radiation intensity, vegetation temperature, air relative humidity and daylight hours are 0.874, 0.784, 0.899, 0.885, −0.323, −0.345, −0.369, −0.394, −0.314, 0.383, −0.341, −0.322, 0.344, and −0.328, respectively. The value of the correlation between the above 14 environmental factors and soil moisture is above 0.3, which means that these 14 environmental factors have a high correlation with soil moisture. The correlations between soil moisture, rainfall, air relative humidity, and soil moisture at the depths of 5 cm, 20 cm, 40 cm, and 60 cm were positive, and when rainfall and air relative humidity became larger, soil moisture increased. The correlation between the remaining environmental factors, such as soil temperature, solar radiation intensity, and daylight hours at different depths and soil moisture was negative; when the soil moisture increase, the other environmental factors became smaller and were negatively correlated. Therefore, the 14 variables of soil moisture and its different depths, such as soil temperature and humidity, atmospheric temperature, rainfall, solar radiation intensity, vegetation temperature, relative air humidity, and daylight hours, were initially determined as key influencing factors.
3.2. Soil Moisture Prediction
A single dataset may have randomness, and in order to better explore the model, five-time series data from DataA~DataE were predicted according to the steps of BAG. First, the data were judged by the ADF test to determine whether the data was a stationary series. Then, the autocorrelation order p and moving average order q were determined according to ACF and PACF, and the optimal model was selected for prediction by AIC. The (p,d,q) parameters of the five-time series data with different depths were determined, and their AIC values are shown in Table 7. The determined model parameters and data were substituted into BAG. Figure 4 shows the error comparison of the prediction results of five prediction models, Prophet, LSTM, DeepAR, XGBoost, and DeepState, with the model in this paper under the same dataset. Among them, ground truth refers to labels in data samples that have been processed but not standardized. Table 8 shows the prediction results of DataA in the five prediction models with the model in this paper, and the optimal results are shown in bold.
Compared with Prophet, LSTM, DeepAR, and XGBoost prediction models, the relative error of BAG was significantly reduced in all four depths, which shows that BAG has obvious advantages for soil moisture prediction. Among them, Prophet can estimate each time series well based on additive patterns, but the model is still the traditional modeling idea of time series analysis, resulting in the difficulty of learning complex patterns during model training and affecting the prediction accuracy. In terms of data volume, time series have small sample characteristics, while the deep learning algorithm model requires a large amount of data training and a long training time. Therefore, in the case of small data, the relative error of LSTM is higher compared with BAG; DeepAR uses probabilistic prediction to improve prediction accuracy, but it cannot capture information such as cycles and seasons; XGBoost is fast and effective in dealing with large-scale datasets, but a suitable deep learning model can obtain more accuracy. DeepState combines the state space model with deep learning, which can learn similar patterns from a large number of sequences and features, and also makes the model somewhat interpretable, but the accuracy in the short-term prediction range is slightly lower than the model in this paper. BAG, in this paper, satisfies BHT-ARIMA and can effectively compensate for the nonlinear characteristics of the time series while making full use of the valid information of the data, thus outperforming other methods in terms of prediction accuracy.
3.3. Effect of Input Sequence Length on Prediction Performance
The information of soil moisture conditions at different depths for three-time spans of continuous, every other day, and every two days of DataA~DataE time series data were selected as inputs, i.e., the lengths of the time series data t were 364, 182, and 121, respectively. A BAG model was established. The ADF test and ACF, and PACF were used to determine the autocorrelation order p and moving average order q. The parameters of the three-input series at different depths and their AIC values were obtained, and the prediction results and their relative errors were obtained by building the model based on the parameters. Figure 5 shows the error comparison of the prediction results of the BAG prediction model in five datasets with different input sequence lengths, and Table 9 shows the prediction results of DataA soil data in three input sequence lengths, and the optimal results are shown in bold.
As can be seen from Figure 5 and Table 9, the relative error values of BAG at the same depth tended to increase with the length of the input series, showing the uncertainty of the prediction. In general, due to the time-sensitive nature of the soil moisture and the large influence of environmental factors, the differences between predicted and measured soil moisture values at different depths gradually increased with the increase in the number of prediction interval days, which is in line with the development of short-term soil moisture prediction and its deviation was within the acceptable range. The predictions of the three short-term time span basically reflect the real change trends.
3.4. Effect of the Number of Environmental Factors on Prediction Performance
To verify the influence of different environmental factors on BAG, the soil moisture and environmental factor variables with correlation thresholds of 0, 0.3, and 0.7 or more were selected as key influencing factors for prediction according to the Spearman correlation analysis in Section 3.1.2, and the corresponding numbers of environmental factors n were 17, 14, and 4. The ADF test and ACF PACF were used to determine the autocorrelation order p and the moving average order q, and the BAG was established according to the parameters to obtain the prediction values and relative errors. Figure 6 shows the error comparison for the prediction results of BAG for different numbers of environmental factors on DataA~DataE time series data, and Table 10 shows the prediction results of DataA soil data in three numbers of environmental factors, and the optimal results are shown in bold.
As can be seen from Figure 6, the relative errors for the number of environmental factors n = 17 are both greater than n = 14 and above n = 4. Therefore, eliminating the environmental factors with weak correlations can improve the accuracy of BAG prediction. However, as can be seen from Table 10, the prediction accuracy does not change accordingly with the strength of correlation. When the number of environmental factors is n = 14, the prediction accuracy of the soil moisture at 20 cm, 40 cm, and 60 cm are better than that at n = 4.
3.5. Correlation between Soil Depth and Performance of Prediction
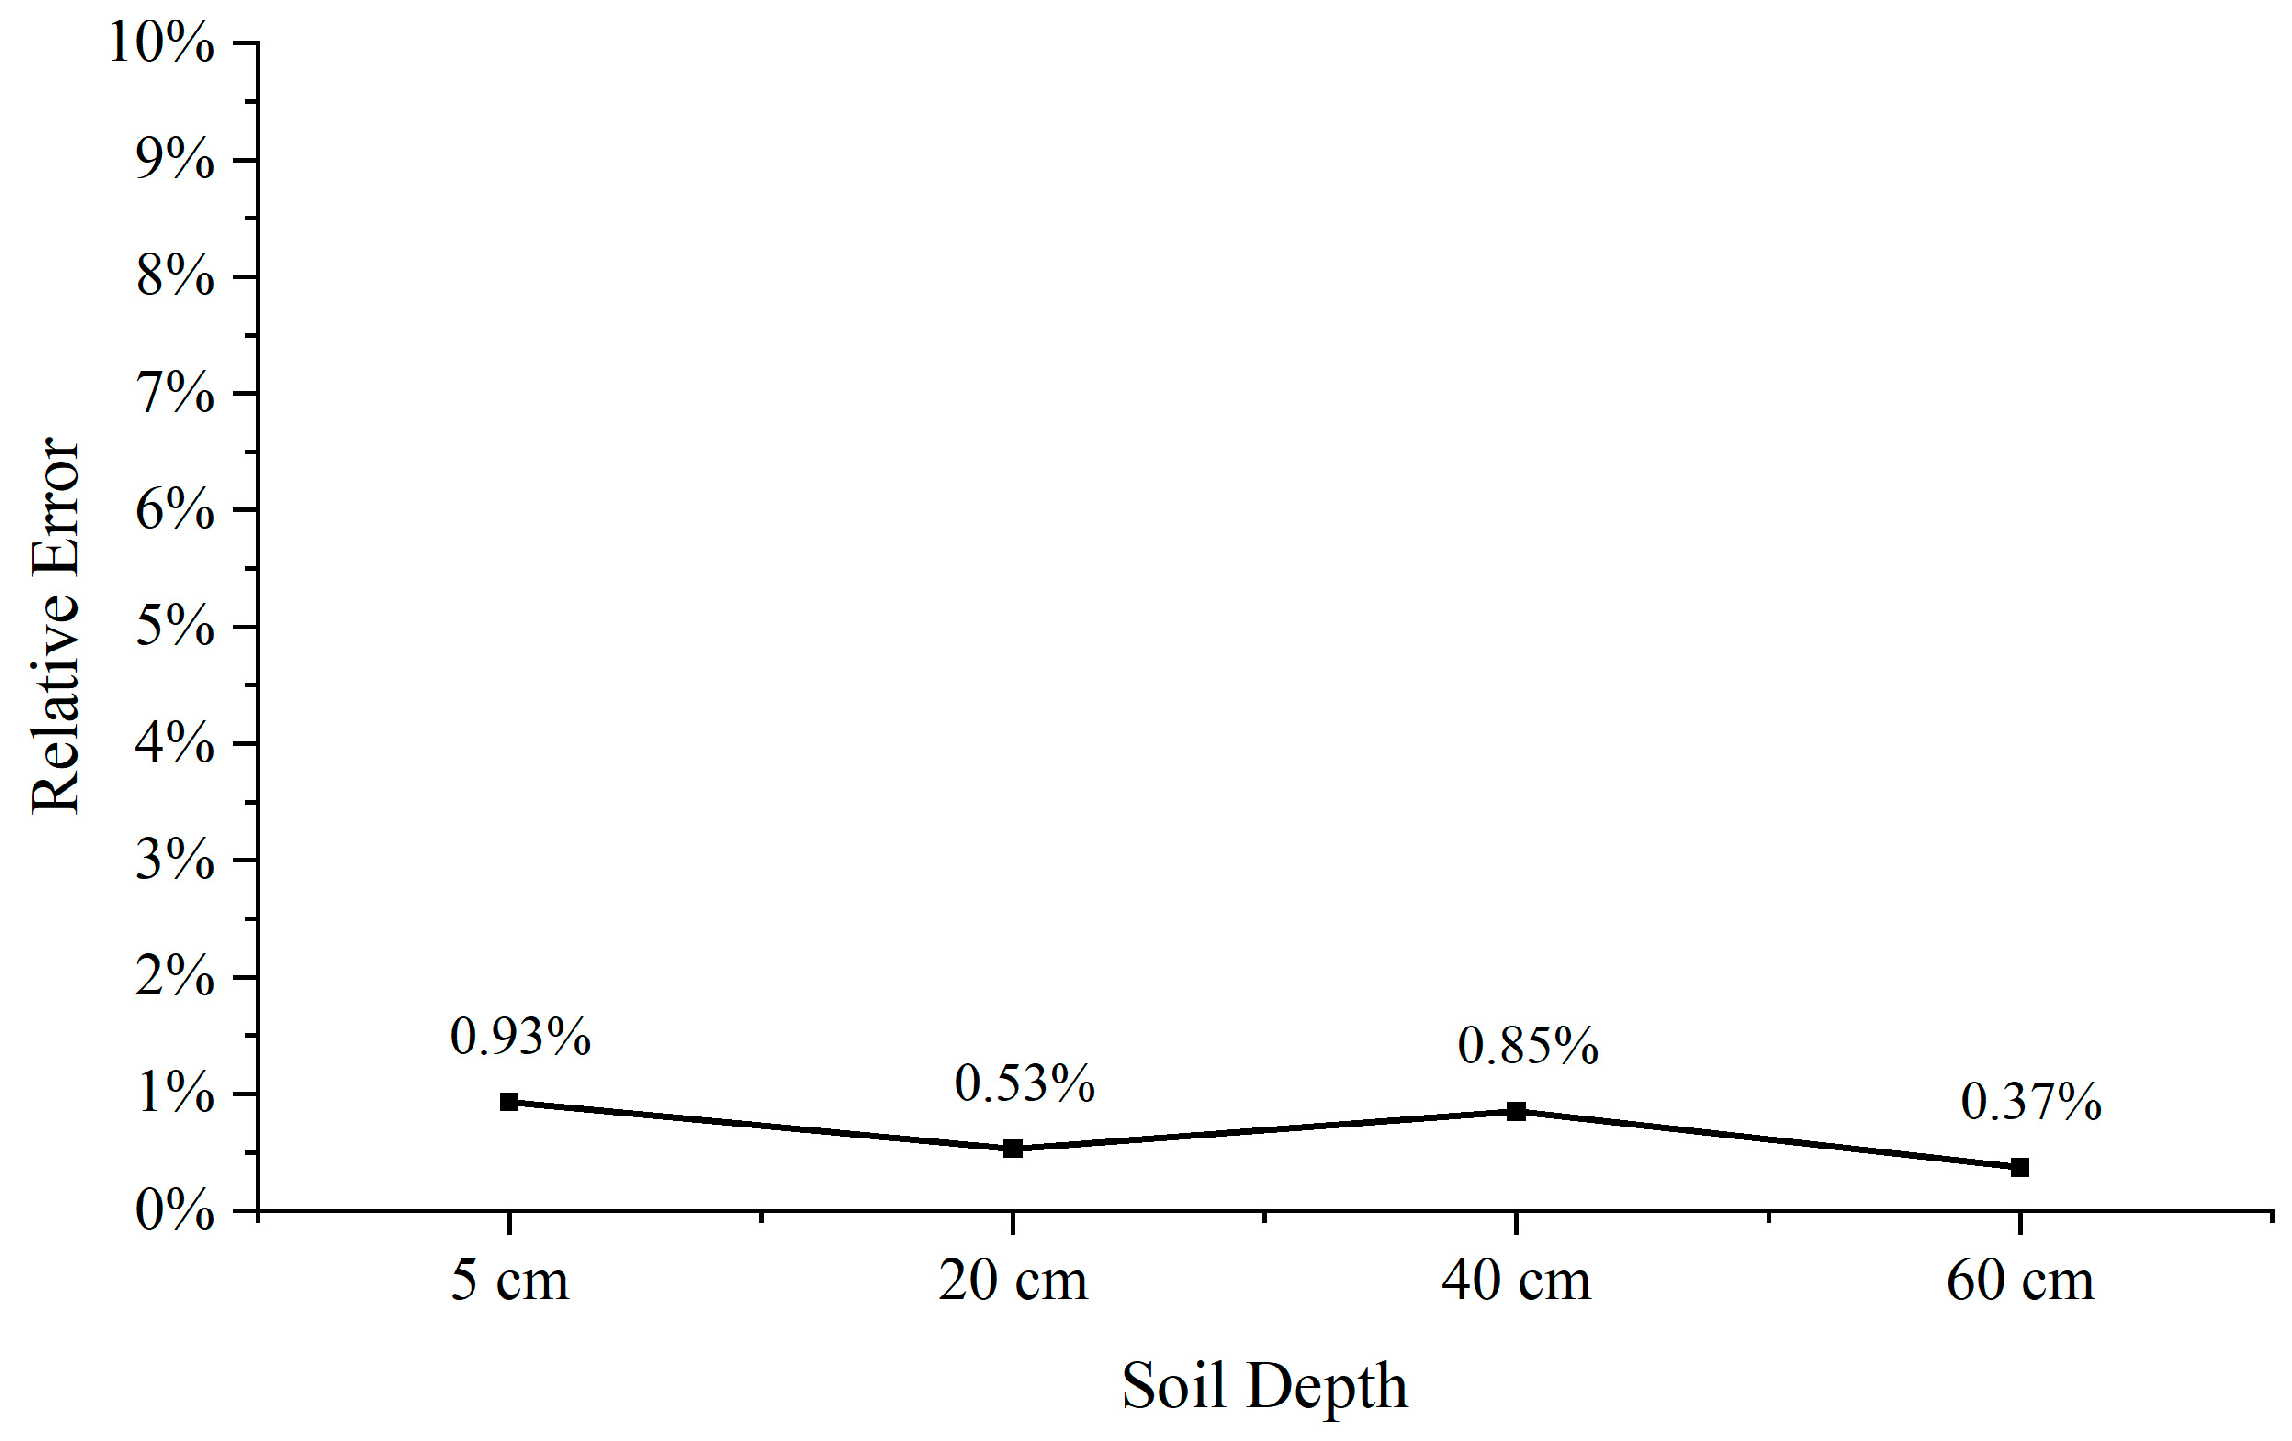
The determined model parameters and DataA~DataE time series data were substituted into BAG, and the predicted results obtained for different depths were compared with their corresponding actual values and the relative errors, as shown in Table 11. Figure 7 takes the average absolute value of the relative errors of the obtained prediction values.
As can be seen from Table 11, among the four different depths of soil moisture, the relative errors of DataB, DataC, and DataE were low; none of them exceeded 1%, which can better reflect soil moisture at different depths. The relative errors of DataD were higher than the other four datasets, where the relative errors at the depths of 5 cm and 40 cm were 2.254% and 2.608%, and the predicted values showed a large difference. The graph for the average absolute value of the relative error of the five datasets was made at different depths (Figure 7) to explore the association of different depths on the prediction performance. It can be seen that the average absolute values of the errors at different depths were relatively stationary, and they were all below 1%. Therefore, for soil moisture prediction, the difference in depth did not highly affect the prediction performance of BAG.
3.6. Ablation Experiments
To evaluate the effectiveness of each module of BAG, this paper used DataA~DataE time series data and reduced the improvement components of this prediction model. The comparison results and relative errors between the model in this paper and the model with the corresponding module removed are shown in Table 12. Among them, the individual models are described as follows.
- A: Only ARIMA prediction was retained without the block Hankel tensor decomposition and prediction of nonlinear model GRU.
- G: Only the nonlinear part, i.e., the GRU neural network, was retained, and the linear part of BHT-ARIMA was not used for prediction.
- BA: Only the linear part, i.e., the BHT-ARIMA forecasting model, was retained, and no GRU nonlinear forecasts were used.
- AG: The linear part of the ARIMA prediction and the nonlinear part of the GRU neural network were retained without the block Hankel tensor decomposition.
- BAG-Pre: The linear part of BHT-ARIMA prediction and the nonlinear part of GRU neural network prediction were retained without the analysis and processing part of the data.
- BAG: The model in this paper used analysis and processing of data, the linear part of BHT-ARIMA forecasting, and the nonlinear part of GRU forecasting.
Because BHT is an improvement on ARMIA, it is not possible to use only BHT without ARMIA, so the two solutions of B and BG were not considered.
As can be seen from Table 12, the relative error of A, which only retains ARIMA prediction, was greater than that of BA, indicating that the block Hankel tensor decomposition on ARIMA could improve the prediction accuracy of the model; the relative error of G, which only retained the nonlinear model, was greater than that of AG, indicating that for data with nonlinear characteristics, the prediction of the model with linear and nonlinear extraction is better than that of the single nonlinear model; BAG-pre, which does not use the analysis and processing of data, had poorer accuracy compared with BAG in this paper, indicating that the analysis and processing of data could improve the prediction accuracy.
The BAG proposed in this paper showed decreased accuracy after removing nonlinear components, linear components, block Hankel tensor, and data processing and analysis, respectively. Therefore, BAG addresses the nonlinear characteristics of soil moisture data and the association of multiple environmental factors to achieve the improvement of soil moisture prediction accuracy.
4. Conclusions
In this paper, a time series prediction model with a mixture of linear and nonlinear models, BAG, was proposed for soil moisture prediction with nonlinear characteristics. Compared with a single linear or nonlinear model, BAG has higher accuracy for soil moisture prediction and can capture the intrinsic correlation between the environmental factors associated with it, improving the prediction capability. In addition, the results of experiments show that the performance of BAG may be influenced by the input sequence length and the number of environmental factors, so the input data need to be sufficient from two aspects of the sequence length and the number of correlated environmental factors in order to achieve the better prediction accuracy of soil moisture. However, soil depth has little influence on the accuracy of soil moisture prediction. The result of ablation experiments shows that the BAG model is better than all the other compared models, which means that the BAG model is well designed to incorporate the nonlinear characteristics of the soil moisture prediction. Although the performance of soil moisture prediction on the nonlinear and multiple environmental factors correlation characteristics of soil moisture data can be improved using BAG, the influence of seasonal and climatic factors on the prediction results of soil moisture data has not been deeply analyzed and considered, which will be further studied in our future work. Using the BAG model to predict other nonlinear time series data, such as soil temperature, rainfall, and atmospheric temperature, also need to be studied in the future.
Author Contributions
Conceptualization, G.W. and L.Z.; methodology, L.Z.; software, L.Z.; validation, G.W. and L.Z.; formal analysis, G.W. and L.Z.; investigation, L.Z.; resources, L.M., X.Y. and P.W.; data curation, L.Z.; writing—original draft preparation, L.Z.; writing—review and editing, G.W. and L.Z.; visualization, G.W. and L.Z.; supervision, L.M.; project administration, L.M. and X.W.; funding acquisition, L.M. All authors have read and agreed to the published version of the manuscript.
Funding
This research was funded by the National Natural Science Foundation of China (Grant number: U1809208) and the Key Research and Development Program of Zhejiang Province (Grant number: 2021C02005).
Institutional Review Board Statement
Not applicable.
Data Availability Statement
The code for our proposed model BAG and dataset used in the experiments can be found on GitHub: https://github.com/zafucslab/BAG (accessed on 3 November 2022).
Conflicts of Interest
The authors declare that they have no known competing financial interests or personal relationships that could have appeared to influence the work reported in this paper.
References
- Halfond, W.; Orso, A. Improving Test Case Generation for Web Applications Using Automated Interface Discovery. In Proceedings of the the Joint Meeting of the European Software Engineering Conference & the Acm Sigsoft International Symposium on Foundations of Software Engineering, Dubrovnik, Croatia, 3–7 September 2007; pp. 145–154. [Google Scholar]
- Xie, Y.; Aiken, A. Static Detection of Security Vulnerabilities in Scripting Languages. Proc. Usenix Secur. Symp. 2006, 15, 179–192. [Google Scholar]
- Leroux, D.J.; Kerr, Y.H.; Wood, E.F.; Sahoo, A.K.; Bindlish, R.; Jackson, T.J. An approach to constructing a homogeneous time series of soil moisture using SMOS. IEEE Trans. Geosci. Remote Sens. 2013, 52, 393–405. [Google Scholar] [CrossRef]
- Al-Khaldi, M.M.; Johnson, J.T. Soil Moisture Retrievals Using CYGNSS Data in a Time-Series Ratio Method: Progress Update and Error Analysis. IEEE Geosci. Remote Sens. Lett. 2021, 19, 1–5. [Google Scholar] [CrossRef]
- Dahse, J.; Holz, T. Simulation of Built-in PHP Features for Precise Static Code Analysis. In Proceedings of the Network and Distributed System Security Symposium, San Diego, CA, USA, 23–26 February 2014. [Google Scholar]
- Dahse, J.; Holz, T. Static detection of second-order vulnerabilities in web applications. In Proceedings of the USENIX Security Symposium, San Diego, CA, USA, 20–24 August 2014. [Google Scholar]
- Pignotti, G.; Rathjens, H.; Chaubey, I.; Williams, M.; Crawford, M. Strong sensitivity of watershed-scale, ecohydrologic model predictions to soil moisture. Environ. Model. Softw. 2021, 144, 105162. [Google Scholar] [CrossRef]
- Figueroa, M.; Pope, C. Root System Water Consumption Pattern Identification on Time Series Data. Sensors 2017, 17, 1410. [Google Scholar] [CrossRef]
- Lee, J.H. Spatial-Scale Prediction of the SVAT Soil Hydraulic Variables Characterizing Stratified Soils on the Tibetan Plateau from an EnKF Analysis of SAR Soil Moisture. Vadose Zone J. 2014, 13, 11. [Google Scholar] [CrossRef]
- Cai, Y.; Zheng, W.; Zhang, X.; Zhangzhong, L.; Xue, X. Research on soil moisture prediction model based on deep learning. PLoS ONE 2019, 14, e0214508. [Google Scholar] [CrossRef]
- Guo, Z.; Zhao, J.; Zhang, W.; Wang, J. A corrected hybrid approach for wind speed prediction in Hexi Corridor of China. Energy 2011, 36, 1668–1679. [Google Scholar] [CrossRef]
- Peterson, T.J.; Western, A.W. Nonlinear time-seriesmodeling of unconfined groundwater head. Water Resour. Res. 2015, 50, 8330–8355. [Google Scholar] [CrossRef]
- Meißner, M.; Köhler, M.; Schwendenmann, L.; Hölscher, D.; Dyckmans, J. Soil water uptake by trees using water stable isotopes (delta H-2 and delta O-18)-a method test regarding soil moisture, texture and carbonate. Plant Soil 2014, 376, 327–335. [Google Scholar] [CrossRef]
- Shunjun, H.U.; Zhu, H.; Chen, Y. One-dimensional horizontal infiltration experiment for determining permeability coefficient of loamy sand. J. Arid. Land 2017, 9, 27–37. [Google Scholar]
- Wang, S.F.; Xu, C.; Song, H.Y. Analysis of the Effect of Moisture on Soil Organic Matter Determination and Anti-Moisture Interference Model Building Based on Vis-NIR Spectral Technology. Spectrosc. Spectr. Anal. 2016, 36, 3249–3253. [Google Scholar]
- Wu, D.; Wang, T.; Di, C.; Wang, L.; Chen, X. Investigation of controls on the regional soil moisture spatiotemporal patterns across different climate zones. Sci. Total Environ. 2020, 726, 138214. [Google Scholar] [CrossRef] [PubMed]
- Huang, X.; Shi, Z.H.; Zhu, H.D.; Zhang, H.Y.; Ai, L.; Yin, W. Soil moisture dynamics within soil profiles and associated environmental controls. Catena 2015, 136, 189–196. [Google Scholar] [CrossRef]
- Niu, H.; Meng, F.; Yue, H.; Yang, L.; Dong, J.; Zhang, X. Soil Moisture Prediction in Peri-urban Beijing, China: Gene Expression Programming Algorithm. Intell. Autom. Soft Comput. 2021, 28, 93–106. [Google Scholar] [CrossRef]
- Xiaolei, F.U.; Zhongbo, Y.U.; Tang, Y.; Ding, Y.; Lyu, H.; Zhang, B.; Jiang, X.; Ju, O. Evaluating Soil Moisture Predictions Based on Ensemble Kalman Filter and SiB2 Model. J. Meteorol. Res. 2019, 22, 190–205. [Google Scholar]
- Shi, Q.; Yin, J.; Cai, J.; Cichocki, A.; Yokota, T.; Chen, L.; Yuan, M.; Zwng, J. Block Hankel Tensor ARIMA for Multiple Short Time Series Forecasting. In Proceedings of the AAAI Conference on Artificial Intelligenc, Polo Alto, CA, USA, 22 February–1 March 2022. [Google Scholar]
- Ji, S.P.; Meng, Y.L.; Yan, L.; Dong, G.S.; Liu, D. GRU-corr Neural Network Optimized by Improved PSO Algorithm for Time Series Prediction. Int. J. Artif. Intell. Tools 2020, 29, 2040010. [Google Scholar] [CrossRef]
- Jeong, H.C.; Jung, J.; Kang, B.O. Development of ARIMA-based forecasting algorithms using meteorological indices for seasonal peak load. Trans. Korean Inst. Electr. Eng. 2018, 67, 1257–1264. [Google Scholar]
- Agarwal, A.; Amjad, M.J.; Shah, D.; Shen, D. Model Agnostic Time Series Analysis via Matrix Estimation. In Proceedings of the Acm on Measurement & Analysis of Computing Systems, New York, NY, USA, 13 June 2018; Volume 2, pp. 1–39. [Google Scholar]
- Araujo, M.; Ribeiro, P.; Faloutsos, C. TensorCast: Forecasting with Context Using Coupled Tensors. In Proceedings of the 2017 IEEE International Conference on Data Mining (ICDM), New Orleans, LA, USA, 18–21 November 2017. [Google Scholar]
- Yokota, T. Missing Slice Recovery for Tensors Using a Low-rank Model in Embedded Space. In Proceedings of the IEEE Conference on Computer Vision and Pattern Recognition, Salt Lake City, UT, USA, 18–23 June 2018. [Google Scholar]
- Yokota, T.; Hontani, H. Tensor Completion with Shift-invariant Cosine Bases. In Proceedings of the 2018 Asia-Pacific Signal and Information Processing Association Annual Summit and Conference (APSIPA ASC), Honolulu, HI, USA, 12–15 November 2018. [Google Scholar]
- Shi, Q.; Cheung, Y.M.; Zhao, Q.; Lu, H. Feature Extraction for Incomplete Data Via Low-Rank Tensor Decomposition With Feature Regularization. IEEE Trans. Neural Netw. Learn. Systems. 2018, 30, 1803–1817. [Google Scholar] [CrossRef]
- Yang, Z.; Cheung, Y.M. Bayesian Low-Tubal-Rank Robust Tensor Factorization with Multi-Rank Determination. IEEE Trans. Pattern Anal. Mach. Intell. 2019, 43, 62–76. [Google Scholar]
- Faloutsos, C.; Flunkert, V.; Gasthaus, J.; Januschowski, T.; Wang, Y. Forecasting Big Time Series: Theory and Practice. In Proceedings of the 25th ACM SIGKDD International Conference, Anchorage, AK, USA, 4–8 August; 2019. [Google Scholar]
- Ma, X.; Zhang, L.; Xu, L.; Liu, Z.; Chen, G.; Xiao, Z.; Wang, Y.; Wu, Z. Large-scale User Visits Understanding and Forecasting with Deep Spatial-Temporal Tensor Factorization Framework. In Proceedings of the 25th ACM SIGKDD International Conference on Knowledge Discovery & Data Mining; Association for Computing Machinery: New York, NY, USA, 2019; pp. 2403–2411. [Google Scholar]
- Ding, J.; Tarokh, V.; Yang, Y. Bridging AIC and BIC: A New Criterion for Autoregression. IEEE Trans. Inf. Theory 2018, 64, 4024–4043. [Google Scholar] [CrossRef]
- Selig, K.; Shaw, P.; Ankerst, D. Bayesian information criterion approximations to Bayes factors for univariate and multivariate logistic regression models. Int. J. Biostat. 2020, 17, 241–266. [Google Scholar] [CrossRef]
- Jing, P.; Su, Y.; Jin, X.; Zhang, C. High-Order Temporal Correlation Model Learning for Time-Series Prediction. IEEE Trans. Cybern. 2019, 49, 2385–2397. [Google Scholar] [CrossRef]
- Kumar, P.; Sihag, P.; Chaturvedi, P.; Uday, K.V.; Dutt, V. BS-LSTM: An Ensemble Recurrent Approach to Forecasting Soil Movements in the Real World. Front. Earth Sci. 2021, 9, 696792. [Google Scholar] [CrossRef]
- Taylor, S.J.; Letham, B. Forecasting at Scale. Am. Stat. 2018, 72, 37–45. [Google Scholar] [CrossRef]
- Flunkert, V.; Salinas, D.; Gasthaus, J. DeepAR: Probabilistic Forecasting with Autoregressive Recurrent Networks. Int. J. Forecast. 2020, 36, 1181–1191. [Google Scholar]
- Chen, T.; Guestrin, C. XGBoost: A Scalable Tree Boosting System. ACM: New York, NY, USA, 2016. [Google Scholar]
- Rangapuram, S.S.; Seeger, M.W.; Gasthaus, J.; Stella, L.; Wang, Y.; Januschowski, T. Deep State Space Models for Time Series Forecasting. In Proceedings of the Neural Information Processing Systems, Cambridge, MA, USA, 8–13 December 2018. [Google Scholar]
Figure 1.
Map of soil moisture content at different depth change trends in a certain area.
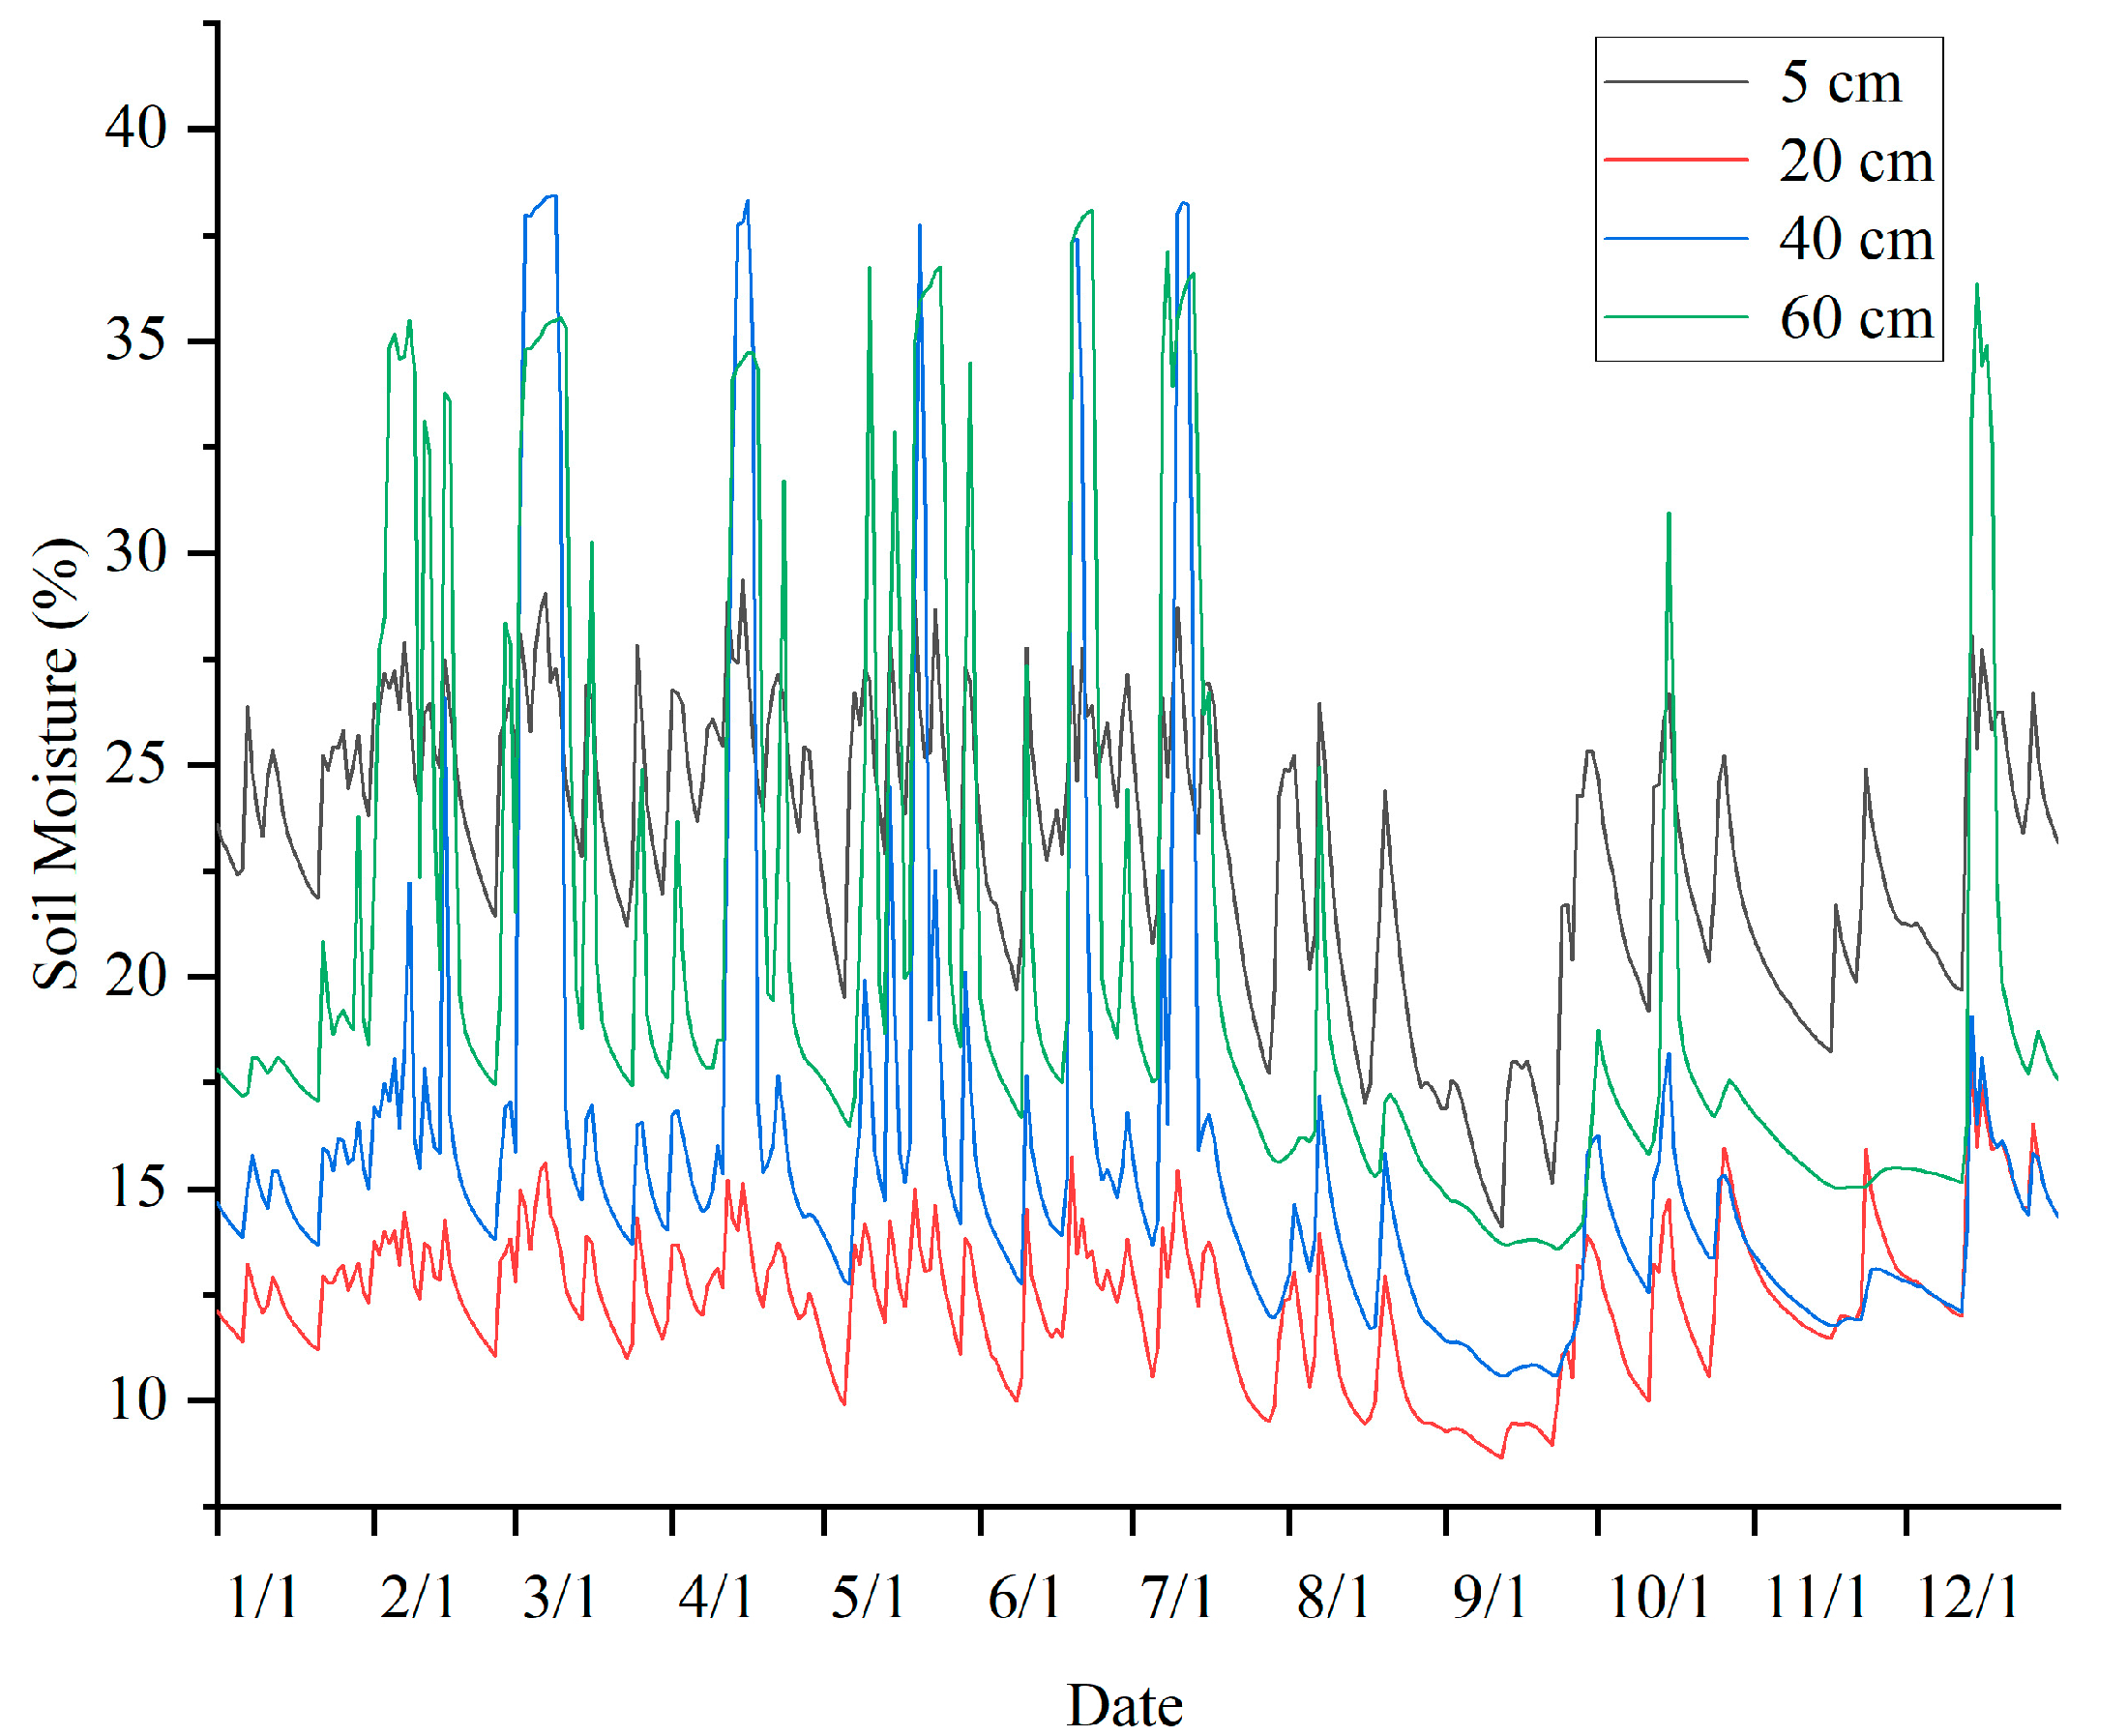
Figure 2.
Structure of BAG model.

Figure 3.
Structure of GRU neural network with nonlinear components.

Figure 4.
Comparison of prediction errors of different methods.

Figure 5.
Comparison of prediction errors with different sequence lengths.

Figure 6.
Comparison of prediction errors of different environmental factors.

Figure 7.
Average absolute value of predicted value error.

Table 1.
Experimental data information.
| Dataset | Position | Climate |
|---|---|---|
| DataA | 28°54′~29°29′ N, 118°01′~118°37′ E | Subtropical monsoon climate |
| DataB | 29°55′–30°15′ N, 121°38′–122°15′ E | Oceanic monsoon climate in the south margin of the north subtropical zone |
| DataC | 29°11′–30°02′ N, 118°20′–119°20′ E | Subtropical monsoon climate |
| DataD | 28.49′~29.19′ N, 120.17′~120.47′ E | Subtropical monsoon climate |
| DataE | 30°10′~30°16′ N, 120°4′~120°10′ E | Subtropical monsoon climate |
Table 2.
Software and hardware configuration of experiments.
| Item | Detail |
|---|---|
| CPU | 11th Gen Intel® CoreTM i5-1135G7 @ 2.40 GHz |
| RAM | 16 GB |
| Operating system | 64-bit Windows 11 |
| CUDA | CUDA11.3 |
| Data processing | Python 3.6 |
Table 3.
The optimal hyperparameters.
| Parameter | Value | Meaning |
|---|---|---|
| taus | [12,5] | MDT tensorization |
| Rs | [5,5] | Tucker decomposition |
| K | 10 | Training iteration of BHT-ARIMA |
| GRU_D1 | 50 | The first layer GRU input dimension |
| GRU_D2 | 40 | The second layer GRU input dimension |
| Dropout | 20% | Random inactivation rate of neural nodes |
| Loss | RMSprop | Loss function of GRU |
| Optimizer | Adam | The optimizer algorithm of GRU |
| Learning rate | 0.01 | Controling the rate of parameter update |
| Batch-size | 32 | Batch size |
| epoch | 100 | Training iteration of GRU |
Table 4.
Results of normality test for environmental factors.
| Median | Average | Standard Deviation | Partial Degrees | Kurtosis | p-Value | |
|---|---|---|---|---|---|---|
| SM-5 cm (%) | 22.565 | 22.211 | 3.325 | −0.459 | −0.304 | 9.76 × 10⁻⁴ |
| SM-20 cm (%) | 13.295 | 13.288 | 1.971 | 0.291 | 0.969 | 9.87 × 10⁻⁴ |
| SM-40 cm (%) | 14.2 | 15.306 | 5.24 | 3.263 | 10.95 | 5.81 × 10⁻⁴ |
| SM-60 cm (%) | 17.515 | 19.72 | 6.159 | 1.75 | 1.902 | 7.26 × 10⁻⁴ |
| ST-5 cm (°C) | 18.43 | 17.748 | 7.275 | −0.09 | −1.293 | 9.41 × 10⁻⁴ |
| ST-20 cm (°C) | 18.305 | 17.565 | 6.629 | −0.073 | −1.316 | 9.38 × 10⁻⁴ |
| ST-40 cm (°C) | 18.275 | 17.469 | 5.981 | −0.067 | −1.345 | 9.34 × 10⁻⁴ |
| ST-60 cm (°C) | 18.185 | 17.608 | 5.41 | −0.054 | −1.367 | 9.32 × 10⁻⁴ |
| Atmospheric temperature (°C) | 17.405 | 16.438 | 8.549 | −0.193 | −1.153 | 9.53 × 10⁻⁴ |
| Rainfall (mm) | 0.05 | 5.003 | 12.311 | 4.841 | 37.366 | 4.58 × 10⁻⁴ |
| Wind Speed (m/s) | 0.05 | 0.077 | 0.088 | 1.706 | 3.63 | 8.18 × 10⁻⁴ |
| Wind direction (°) | 142.3 | 172.923 | 130.836 | 0.01 | −1.726 | 8.48 × 10⁻⁴ |
| Solar radiation intensity (kw/m2) | 0.1 | 0.109 | 0.07 | 0.361 | −0.959 | 9.48 × 10⁻⁴ |
| Vegetation temperature (°C) | 18.695 | 17.641 | 9.543 | −0.208 | −1.011 | 9.64 × 10⁻⁴ |
| Air Relative Humidity (%) | 80.5 | 80.28 | 10.078 | −0.581 | 0.576 | 9.7 × 10⁻⁴ |
| Daylight hours (h) | 2.73 | 2.918 | 2.693 | 0.219 | −1.518 | 8.55 × 10⁻⁴ |
| Daily evaporation (mm) | 0.91 | 10.922 | 21.946 | 2.931 | 11.203 | 5.66 × 10⁻⁴ |
Table 5.
Spearman correlation coefficients of environmental factors (Part I).
| SM-5 cm | SM-20 cm | SM-40 cm | SM-60 cm | ST-5 cm | ST-20 cm | ST-40 cm | ST-60 cm | |
|---|---|---|---|---|---|---|---|---|
| SM-5 cm | 1 | 0.76 | 0.904 | 0.832 | −0.345 | −0.367 | −0.394 | −0.421 |
| SM-20 cm | 0.76 | 1 | 0.73 | 0.747 | −0.437 | −0.453 | −0.465 | −0.476 |
| SM-40 cm | 0.904 | 0.73 | 1 | 0.964 | −0.273 | −0.296 | −0.322 | −0.35 |
| SM-60 cm Average | 0.832 0.874 | 0.647 0.784 | 0.965 0.899 | 1 0.885 | −0.237 −0.323 | −0.265 −0.345 | −0.298 −0.369 | −0.332 −0.394 |
Table 6.
Spearman correlation coefficients of environmental factors (Part II).
| Atmospheric Temperature | Rainfall | Wind Speed | WindDirection | Solar Radiation Intensity | Vegetation Temperature | Air RelativeHumidity | Daylight Hours | DailyEvaporation | |
|---|---|---|---|---|---|---|---|---|---|
| SM-5 cm | −0.345 | 0.497 | −0.087 | −0.07 | −0.446 | −0.362 | 0.468 | −0.442 | 0.121 |
| SM-20 cm | −0.43 | 0.328 | −0.213 | −0.042 | −0.395 | −0.43 | 0.282 | −0.304 | −0.367 |
| SM-40 cm | −0.266 | 0.378 | −0.096 | −0.055 | −0.303 | −0.275 | 0.349 | −0.316 | 0.076 |
| SM-60 cmAverage | −0.218 −0.314 | 0.331 0.383 | −0.091 −0.121 | −0.058 −0.056 | −0.222 −0.341 | −0.223 −0.322 | 0.278 0.344 | −0.253 −0.328 | 0.083 −0.021 |
Table 7.
DataA~DataE parameters and AIC values.
| DataA | DataB | DataC | DataD | DataE | ||
|---|---|---|---|---|---|---|
| SM-5 cm | (p,d,q) | (1,1,1) | (1,1,1) | (0,1,2) | (0,1,1) | (1,1,1) |
| AIC | −1117.463 | −1250.764 | −1050.055 | −1164.823 | −1356.41 | |
| SM-20 cm | (p,d,q) | (1,1,1) | (2,1,3) | (1,1,1) | (2,1,1) | (1,1,1) |
| AIC | −1459.317 | −1452.934 | −1171.537 | −1086.214 | −1507.423 | |
| SM-40 cm | (p,d,q) | (2,1,1) | (1,1,1) | (1,1,1) | (0,1,1) | (0,1,1) |
| AIC | −718.706 | −1396.386 | −1217.633 | −1035.812 | −1404.259 | |
| SM-60 cm | (p,d,q) | (2,1,0) | (1,1,1) | (1,1,1) | (2,1,1) | (1,1,1) |
| AIC | −648.05 | −1537.424 | −1285.633 | −438.881 | −1487.736 |
Table 8.
Comparison of different prediction models of DataA.
| Prophet | LSTM | DeepAR | XGBoost | DeepState | BAG | ||
|---|---|---|---|---|---|---|---|
| SM-5 cm | Ground truth (%) | 23.16 | 23.16 | 23.16 | 23.16 | 23.16 | 23.16 |
| Prediction (%) | 22.139 | 22.323 | 23.772 | 24.704 | 23.990 | 23.442 | |
| RE (%) | −4.405 | −3.61 | 2.642 | 6.666 | 3.583 | 1.218 | |
| SM-20 cm | Ground truth (%) | 14.35 | 14.35 | 14.35 | 14.35 | 14.35 | 14.35 |
| Prediction (%) | 14.982 | 12.896 | 12.786 | 12.550 | 14.291 | 14.341 | |
| RE (%) | 4.405 | −10.13 | −10.895 | −12.541 | −0.411 | −0.060 | |
| SM-40 cm | Ground truth (%) | 14.34 | 14.34 | 14.34 | 14.34 | 14.34 | 14.34 |
| Prediction (%) | 13.060 | 15.851 | 14.004 | 16.339 | 14.526 | 14.319 | |
| RE (%) | −8.923 | 10.54 | −2.342 | 13.937 | 1.298 | −0.144 | |
| SM-60 cm | Ground truth (%) | 17.57 | 17.57 | 17.57 | 17.57 | 17.57 | 17.57 |
| Prediction (%) | 16.939 | 20.074 | 17.668 | 19.877 | 17.536 | 17.470 | |
| RE (%) | −3.590 | 14.25 | 0.556 | 13.128 | −0.196 | −0.569 |
Table 9.
Prediction results of DataA at different depths with different input sequence lengths.
| t = 364 | t = 182 | t = 121 | ||
|---|---|---|---|---|
| SM-5 cm | Ground truth (%) | 23.16 | 23.16 | 23.16 |
| Prediction (%) | 23.442 | 23.457 | 24.035 | |
| RE (%) | 1.218 | 1.281 | 3.778 | |
| SM-20 cm | Ground truth (%) | 14.35 | 14.35 | 14.35 |
| Prediction (%) | 14.341 | 14.389 | 15.218 | |
| RE (%) | −0.060 | 0.275 | 6.052 | |
| SM-40 cm | Ground truth (%) | 14.34 | 14.34 | 14.34 |
| Prediction (%) | 14.319 | 11.307 | 15.429 | |
| RE (%) | −0.144 | −21.148 | 7.591 | |
| SM-60 cm | Ground truth (%) | 17.57 | 17.57 | 17.57 |
| Prediction (%) | 17.470 | 17.125 | 14.989 | |
| RE (%) | −0.569 | −2.532 | −14.691 |
Table 10.
Prediction results of DataA at different depths with a different number of environmental factors.
Table 10.
Prediction results of DataA at different depths with a different number of environmental factors.
| n = 17 | n = 14 | n = 4 | ||
|---|---|---|---|---|
| SM-5 cm | Ground truth (%) | 23.16 | 23.16 | 23.16 |
| Prediction (%) | 23.018 | 23.442 | 23.259 | |
| RE (%) | −0.611 | 1.218 | 0.427 | |
| SM-20 cm | Ground truth (%) | 14.35 | 14.35 | 14.35 |
| Prediction (%) | 14.298 | 14.341 | 14.408 | |
| RE (%) | −0.363 | −0.060 | 0.402 | |
| SM-40 cm | Ground truth (%) | 14.34 | 14.34 | 14.34 |
| Prediction (%) | 10.259 | 14.319 | 13.853 | |
| RE (%) | −28.457 | −0.144 | −3.394 | |
| SM-60 cm | Ground truth (%) | 17.57 | 17.57 | 17.57 |
| Prediction (%) | 14.697 | 17.470 | 17.114 | |
| RE (%) | −16.352 | −0.569 | −2.595 |
Table 11.
Prediction results of DataA~DataE at different depths.
| DataA | DataB | DataC | DataD | DataE | ||
|---|---|---|---|---|---|---|
| SM-5 cm | Ground truth (%) | 23.16 | 25.2 | 31.1 | 15.5 | 19.7 |
| Prediction (%) | 23.442 | 25.266 | 31.171 | 15.849 | 19.566 | |
| RE (%) | 1.218 | 0.263 | 0.227 | 2.254 | −0.679 | |
| SM-20 cm | Ground truth (%) | 14.35 | 24.2 | 25.5 | 39 | 18.83 |
| Prediction (%) | 14.341 | 24.134 | 25.491 | 38.361 | 18.951 | |
| RE (%) | −0.060 | −0.274 | −0.034 | −1.638 | 0.642 | |
| SM-40 cm | Ground truth (%) | 14.34 | 25.6 | 20 | 30 | 25.54 |
| Prediction (%) | 14.319 | 25.681 | 20.123 | 29.218 | 25.409 | |
| RE (%) | −0.144 | 0.371 | 0.615 | −2.608 | −0.515 | |
| SM-60 cm | Ground truth (%) | 17.57 | 20.2 | 20 | 42.5 | 32.85 |
| Prediction (%) | 17.470 | 20.281 | 20.013 | 42.273 | 32.943 | |
| RE (%) | −0.569 | 0.402 | 0.067 | −0.534 | 0.282 |
Table 12.
Comparison results of different prediction models.
| A | G | BA | AG | BAG-Pre | BAG | ||
|---|---|---|---|---|---|---|---|
| SM-5 cm | Ground truth (%) | 23.16 | 23.16 | 23.16 | 23.16 | 23.16 | 23.16 |
| Prediction (%) | 24.291 | 24.520 | 22.586 | 24.196 | 23.317 | 23.442 | |
| RE (%) | 4.881 | 5.871 | −2.478 | 4.473 | 3.268 | 1.218 | |
| SM-20 cm | Ground truth (%) | 14.35 | 14.35 | 14.35 | 14.35 | 14.35 | 14.35 |
| Prediction (%) | 13.450 | 12.663 | 14.202 | 13.666 | 14.165 | 14.341 | |
| RE (%) | −6.274 | −11.758 | −1.030 | −4.768 | −1.287 | −0.060 | |
| SM-40 cm | Ground truth (%) | 14.34 | 14.34 | 14.34 | 14.34 | 14.34 | 14.34 |
| Prediction (%) | 16.327 | 21.390 | 13.765 | 17.0 | 10.633 | 14.319 | |
| RE (%) | 13.86 | 49.165 | −4.010 | 18.547 | −25.848 | −0.144 | |
| SM-60 cm | Ground truth (%) | 17.57 | 17.57 | 17.57 | 17.57 | 17.57 | 17.57 |
| Prediction (%) | 17.475 | 20.066 | 17.438 | 19.285 | 14.257 | 17.470 | |
| RE (%) | −0.540 | 14.208 | −0.752 | 9.760 | −18.859 | −0.569 |
Disclaimer/Publisher’s Note: The statements, opinions and data contained in all publications are solely those of the individual author(s) and contributor(s) and not of MDPI and/or the editor(s). MDPI and/or the editor(s) disclaim responsibility for any injury to people or property resulting from any ideas, methods, instructions or products referred to in the content. |
© 2023 by the authors. Licensee MDPI, Basel, Switzerland. This article is an open access article distributed under the terms and conditions of the Creative Commons Attribution (CC BY) license (https://creativecommons.org/licenses/by/4.0/).
Share and Cite
MDPI and ACS Style
Wang, G.; Zhuang, L.; Mo, L.; Yi, X.; Wu, P.; Wu, X. BAG: A Linear-Nonlinear Hybrid Time Series Prediction Model for Soil Moisture. Agriculture 2023, 13, 379. https://doi.org/10.3390/agriculture13020379
AMA Style
Wang G, Zhuang L, Mo L, Yi X, Wu P, Wu X. BAG: A Linear-Nonlinear Hybrid Time Series Prediction Model for Soil Moisture. Agriculture. 2023; 13(2):379. https://doi.org/10.3390/agriculture13020379
Chicago/Turabian StyleWang, Guoying, Lili Zhuang, Lufeng Mo, Xiaomei Yi, Peng Wu, and Xiaoping Wu. 2023. "BAG: A Linear-Nonlinear Hybrid Time Series Prediction Model for Soil Moisture" Agriculture 13, no. 2: 379. https://doi.org/10.3390/agriculture13020379
Note that from the first issue of 2016, this journal uses article numbers instead of page numbers. See further details here.