Article

Application of Blended Controlled-Release and Normal Urea with Suitable Maize Varieties to Achieve Integrated Agronomic and Environmental Impact in a High-Yielding Summer Maize System

1
Collaborative Innovation Center of Henan Grain Crops, College of Agronomy, Henan Agricultural University, Zhengzhou 450046, China
2
Institute of Cotton Research of Chinese Academy of Agricultural Sciences, Anyang 455099, China
3
State Key Laboratory of Regulating and Controlling Crop Growth and Development Ministry of Education, College of Agronomy, Henan Agricultural University, Zhengzhou 450046, China
*
Author to whom correspondence should be addressed.
Agriculture 2022, 12(8), 1247; https://doi.org/10.3390/agriculture12081247
Submission received: 4 July 2022 / Revised: 11 August 2022 / Accepted: 15 August 2022 / Published: 17 August 2022

Abstract

:
The use of blended controlled-release urea (CRU) with normal urea has appeared to effectively improve grain yield and nitrogen use efficiency in summer maize systems. Nevertheless, the environmental impacts based on a life cycle assessment (LCA) and the ecosystem economic benefits with different maize varieties and ratios of CRU and urea remain unclear. In our study, a consecutive two-year field experiment was designed in the North China Plain (NCP) using two nitrogen (N) rates (0 and 180 kg N ha−1), four N resources (urea-N, CRU-N:urea-N = 1:2, CRU-N:urea-N = 2:1 and CRU-N), and two maize varieties (ZD958 and YH988) in 2019 and 2020. The results showed that a once-off application of basal fertilizer in N180C2 (CRU-N:urea-N = 2:1) and N180C1 (CRU-N:urea-N = 1:2) achieved high grain yields in ZD958 and YH988 (11.0–13.5 Mg ha−1 and 11.3–13.2 Mg ha−1), respectively. Compared to treatment N180U, treatment N180C2 reduced reactive N losses through N leaching (−34.6%), ammonia volatilization (−17.1%), and nitrous oxide emissions (−42.0%) in variety ZD958, whereas treatment N180C1 reduced reactive N losses through N leaching (−20.3%), ammonia volatilization (−13.2%), and nitrous oxide emission (−24.2%) in variety YH988. The N180C2 and N180C1 treatments achieved the lowest C footprint (267.4 and 267.9 kg CO2 eq Mg−1) for ZD958 and YH988, respectively. Furthermore, N180C2 and N180C1 achieved the highest ecosystem economic benefits for ZD958 and YH988 of 831 and 1101 $ ha−1, respectively. In summary, the application of the mixture of controlled release urea and standard urea at appropriate N rates not only achieved a high grain yield but also enhanced the ecological economic benefits while mitigating the negative environmental impacts. To sum up, using the correct CRU-N management practices coordinated with suitable genetic varieties is an effective way of achieving sustainable and environmentally friendly maize production in a high-yielding summer maize system.

1. Introduction

Maize is one of China’s most important staple grain crops, providing starch and protein for many people. The North China Plain (NCP) produces about 31% of the total maize yield, and accounts for 31% of the total maize cultivation area in China [1]. Nitrogen (N) figures prominently for improving crop productivity and ensuring food security [2]; however, there are adverse environmental and human health impacts resulting from the release of mineral nitrogen from farmland soils, especially in the NCP. These include underground water pollution, water eutrophication, and greenhouse gas emissions, which are worse in some developing countries, such as China [3,4]. One way to achieve greater nitrogen use efficiency (NUE) and less reactive N losses is the implementation of science-based fertilizer-use practices, called the “4R” principle [5,6]: right time (fertilization time), right amount (application rate), right placement (e.g., deep application of fertilizer), and right resource (e.g., urea, ammonia, or nitrate). Another approach is the use of enhanced efficiency N fertilizers (EEFs) (e.g., controlled-release nitrogen, CRU) [7].
Nitrogen supply and crop N demand can be synchronized to reduce the environmental risks using CRU [8,9]. This strategy is expected to increase nitrogen use efficiency and reduce N loss to the environment in crop systems [10], whereas the single application of CRU could reduce labor costs compared to normal urea in many areas [11]. As the cost of CRU is high, a mixture of CRU and normal urea is most appropriate for realizing economic and ecological benefits [12]. Researches have reported that the mixture of CRU and normal urea can both increase grain yield and NUE, along with a net benefit in wheat production [13], but the N sources in these studies were not specified [14]. As more precise N regulation should aim to match the nitrogen rate and resources [15], the present study focused on determining whether the use of blended urea with controlled release nitrogen and normal urea could achieve high maize yields along with optimized N rate and sources.
Differences in varieties can also influence crop growth, grain yield, and N uptake under the stress of heat [16] and nutrient deficiency [17] in rice and maize. One main difficulty for plant breeders is the selection of suitable varieties with a high NUE and reduced N loss, in order to achieve higher yield [18]. To address this problem, an understanding of the available genetic variation in the N response is imperative. The N uptake, utilization, and transportation of different genotypic varieties can be evaluated through field and controlled environment approaches [19]. Some studies have demonstrated the environmental impact of nitrogen application while ignoring the influence of crop varieties [20]. Based on this, the profitability and integrated eco-economic benefits of the interaction between different maize varieties and nitrogen sources (different rates of CRU and urea) require further study.
A consecutive two-year field experiment in the North China Plain (NCP) was designed herein and included two nitrogen sources (CRU and urea), two N application rates (0 and 180 kg N ha−1), and two maize varieties. The aims were: (1) to demonstrate how the interaction between different maize varieties and N sources affects agronomic factors (grain yield, NUE and aboveground N uptake); (2) to qualify the environmental impacts (reactive nitrogen [Nr] losses, greenhouse gas [GHG] emissions, and N and C footprints), and economic benefits; and (3) to construct the best N management system with suitable varieties in a summer maize system in the NCP. Our hypothesis was that matching the maize varieties with a suitable ratio of CRU and urea would increase grain yield and economic benefits while reducing the environmental impact. The research conclusions provide a new approach for matching the N strategy and suitable varieties for high-yielding summer maize systems in the future.

2. Materials and Methods

2.1. Site Description

The experiment was conducted at the experimental station of Henan Agricultural University, Yuanyang county (34°55′ N, 113°36′ E), located in the north of Henan Province in NCP, which is the main wheat–maize rotation area in China [21]. The study was conducted over two maize seasons from 2019 and 2020, forming part of a long-term experiment that started in 2017. The average temperature was 26.5 and 25.1 °C and the total rainfall was 434.4 and 424.4 mm in the 2019 and 2020 maize growing seasons, respectively (Figure 1). Each irrigation application was approximately 100 mm in both 2019 and 2020, and the irrigation was applied in the silking period (VT) (Figure 1). The soil was fluvo-aquic soil (USDA) (19.6% clay, 25.1% silt and 55.3% sand), and the soil properties (0–30 cm) were as follows: bulk density 1.2 g cm−3, pH (soil:water 1:2.5) 7.0, organic matter 10.2 g kg−1, total N 1.15 g kg−1, Olsen-P 80.3 mg kg−1, and NH4OAc-K 129.5 mg kg−1.

2.2. Experimental Materials and Design

Experiments were designed as a split-plot design with three replications. The main plots included two N rates (0 and 180 kg N ha−1), and the subplots were N resources (CRU and normal urea) and maize varieties (Zhengdan 958 and Yuhe 988). The main plots were 46-m2 (4.8 m × 9.6 m). The N rate treatments were as follows: N0 (control, no nitrogen) and N180 (180 kg N ha−1, optimal N rate in the NCP). The details of nitrogen application are shown in Table 1. The two nitrogen sources included urea (46%-N), which was applied before seeding and at the six-leaf (V6) stage, and a once-off application of a blend of controlled-release urea and normal urea. The controlled release urea was a polymer-coated urea (45.2%) consisting of 2.56% polyurethane coating material. The CRU was manufactured based on MOITH New fertilizer Co., Ltd. (Chizhou, China), which has a 60-day release period by the static water (25 °C) releasing test in the laboratory (Figure S3). The urea was provided by Xinlianxin Co., Ltd. (Xinxiang, China) (Table 1).
The maize varieties (‘Zhengdan 958-ZD958’ and ‘Yuhe 988-YH988’) used in the study are local varieties in the NCP and particularly in Henan Province. ZD958 is a stay-green variety with high N efficiency, whereas YH988 is a density resistant variety. Summer maize was sowed on 6 June and 9 June in 2019 and 2020, respectively, and harvested on 25 September and 26 September in 2019 and 2020, respectively. The maize had a planting density of 67.500 plants ha−1, with a row spacing of 60 cm. Pesticides and herbicides were applied as required in both years.

2.3. Analysis of Aboveground Biomass Samples and Evaluation Index

2.3.1. Aboveground Biomass Sampling and Nitrogen Analysis

Three adjacent maize plants were selected randomly in each plot at the silking (VT) and harvest stage (R6), and were separated into grain and straw. The samples were oven-dried to a stable weight at 80 °C. Standard grain yield has a reported moisture factor of 15.5%. The NUE was calculated as the difference in N aboveground uptake between the N treatments and the control treatment and was divided by nitrogen application rate [22,23].

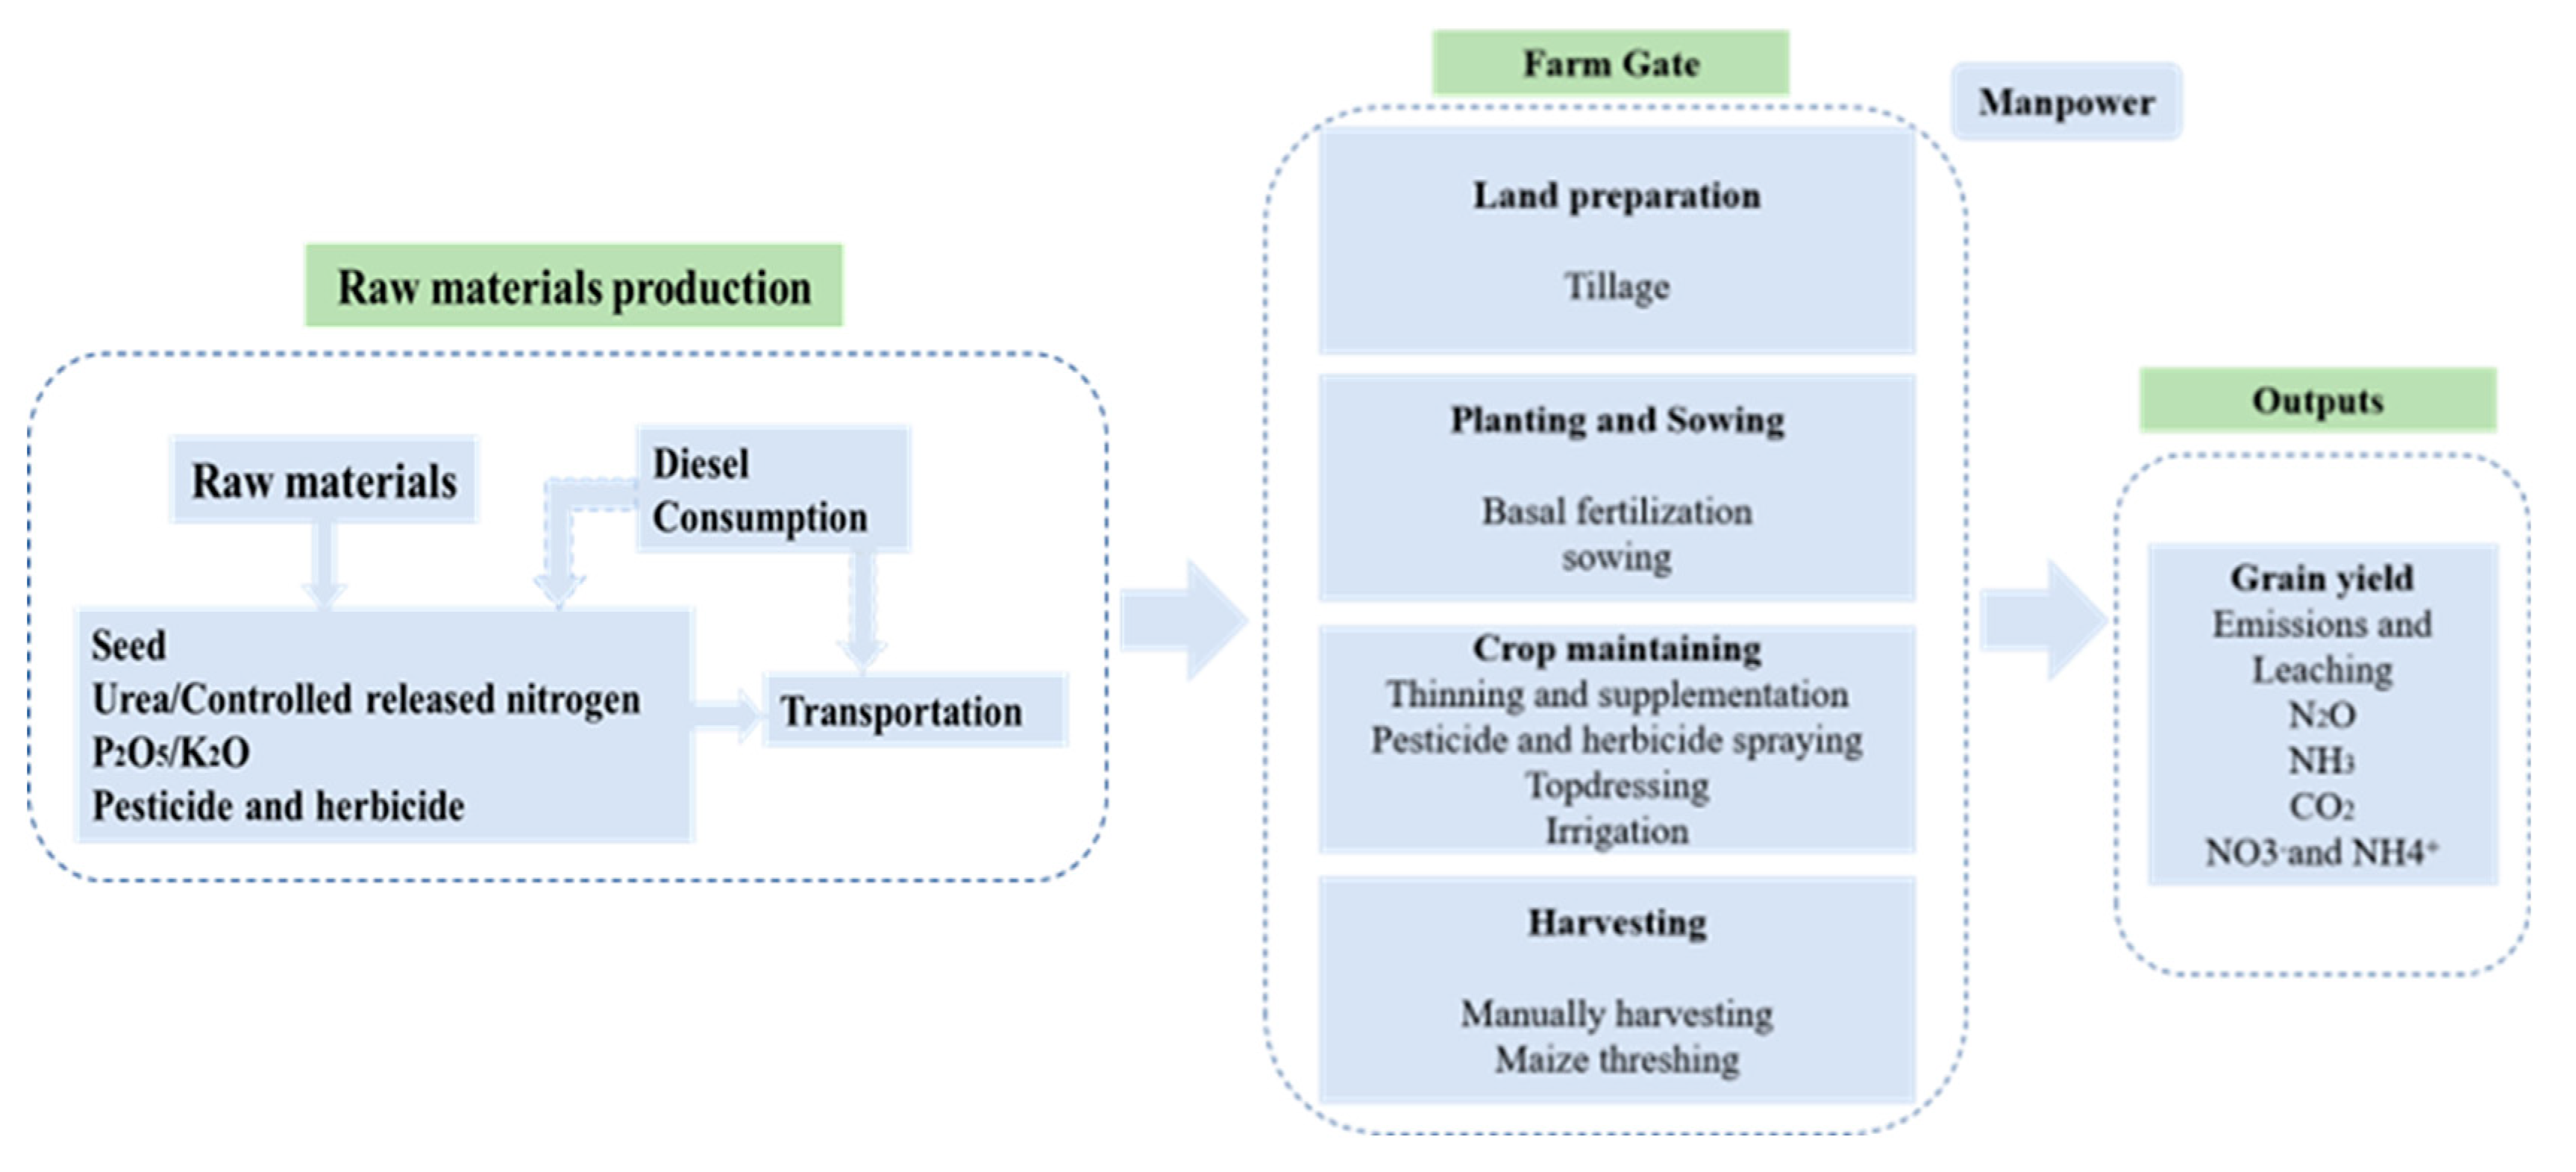
2.3.2. Reactive N Losses and GHG Emissions

Reactive N losses and environmental impacts were calculated by the life cycle assessment (LCA) methodology according to ISO standards 14040 and 14044 [24,25]. The system boundaries were from cradle to farm gate (Figure 2). The reactive N losses (kg N ha−1) originate from three processes: the first one is the nitrogen application, the second one is the nitrogen production and transportation, and the last one is other agricultural materials inputs. The reactive N losses were calculated as follows:
Nr   losses = i = 1 m R a t e i × F i + N 2 O d i r e c t N + N l e a c h i n g N + N H 3 v o l a t i l i z a t i o n N .
In the equation, i means the agricultural material input, Fi means the reactive nitrogen emission from the production and transportation of agricultural input, and Fi and Ratei were used in Figure S1 and Table S1. The direct N2O emission, NO3-leaching, and NH3 volatilization are in the form of N2O-N, NO3-N, and NH3-N, respectively.
During the nitrogen application period, we referred to all the related published papers to construct the empirical model. The reactive nitrogen losses models resulted from the publications according to the NCP by the empirical models (Figure S4).
The reactive nitrogen losses were counted as follows:
NH 3 - N urea = 0.11 × N u r e a r a t e + 3.54 ,
NH 3 - N CRU = 0.036 × N C R U r a t e + 3.12 ,
N 2 O direct - N urea = 0.72 × e 0.0034 × N u r e a r a t e ,
N 2 O direct - N CRU = 0.56 × e 0.0040 × N C R U r a t e ,
NH3-Nurea means the volatilized NH3-N loss from urea, whereas NH3-NCRU represents that from CRU. N2Odirect-Nurea means direct cumulative N2O-N losses from urea whereas N2Odirect-NCRU represents that from CRU. The NO3-leaching factors were supposed to be 27.0% and 17.0% for normal urea and CRU, respectively [26].
The GHG emissions were calculated as follows:
GHG   emission = i = 1 m R a t e i × G i + 298 × N 2 O t a t a l N × 44 / 28
N 2 O total - N = N 2 O d i r e c t N + 1 % × N H 3 N + 0.75 % × N O 3 N ,
Gi means the greenhouse gas emissions from the production and transportation of agricultural inputs. Ratei means the application rate of agricultural inputs (Table S1). The global warming potential of N2O is 298 times of that of CO2 [15]. The C footprint and N footprint were expressed in the terms of grain yield in CO2-eq Mg−1 grain.

2.3.3. Nitrogen-Derived Ecosystem Economic Benefits

The nitrogen-derived yield benefits (BY), private profitability (Bp), and EEB were counted as follows:
BY = (Y − Y0) × Mprice,
Bp = BY − Ncost − Lcost,
EEB = Bp − Ecost − Hcost,
In the equation, BY means the N-derived yield benefits, and Y and Y0 mean the maize yield with and without nitrogen application, respectively.
Mprice means the price of maize (USD 0.43 kg−1). The Ncost represents nitrogen costs and Lcost represents labor costs. EEB means the ecosystem economic benefit. Ecost represents climate change caused by GHG emissions, eutrophication of water bodies, and soil acidification. Hcost means the costs of reactive nitrogen losses in terms of human health. The Ncost and Lcost mean the fertilizer or labor costs. In the research, the normal urea costs USD 0.62 kg−1, whereas CRU costs USD 0.79 kg−1. The labor cost for once-off nitrogen application was USD 45.0 ha−1.
The calculation method of Ecost and Hcost was follows [27]:
E cost = C G H G + C e u + C a c i d = C O 2 × 0.0204 + 1.12 × N O 3 N + 0.24 × N H 3 N + 0.0018 × N + 1.87 × N H 3 N + 0.021 × N
H cost = 0.30 × N 2 O t o t a l N + 0.20 × N O 3 N + 3.30 × N H 3 N
In the equation, CGHG represents GHG emission, Ceu represents eutrophication of water bodies, and Cacid means soil acidification hazard [28]. The CO2 price was USD 0.0204 kg−1 [29]. The eutrophication costs for NO3-N and NH3-N were USD 1.12 and 0.24 kg−1, respectively [30]. The soil acidification cost for NH3-N was USD 1.87 kg−1 [31,32], and USD 0.0018 and 0.021 kg−1 per nitrogen production were the eutrophication and soil acidification costs [30]. The human health costs were USD 0.30, 0.20, and 3.30 kg−1 [32] of N2O total-N, NO3-N, and NH3-N per unit, respectively.

2.4. Data Analysis

Two-way analysis of variance (ANOVA) was used to test the main and interactive effects of N level (df = 1), N sources (df = 3) and maize varieties (df = 1) on grain yield, carbon footprint, and nitrogen footprint. Means of the treatments were tested using the least-significant difference (LSD) test at the 0.05 significance level with SAS (9.3, SAS institute, Cary, NC, USA).

3. Results

3.1. Grain Yield and Aboveground N Uptake

In the growing seasons (2019–2020), the grain yield was significantly increased in the Nopt treatment (180 kg N ha−1) compared to the N0 treatment (Figure 3). The grain yield among the four N sources (N180U, N180C1, N180C, and N180C) for ZD958 and YH988 was not significantly different in the year 2019, whereas the grain yield peaked around 13.5 Mg ha−1 in treatment N180C1 and N180C2 for ZD958 and YH988 in 2020, respectively.
Crop aboveground N uptake increased significantly with the increase in nitrogen rate (0–180 kg N ha−1 from the average 122.3 kg ha−1 in N0 to 219.3 kg ha−1 in all 180 kg N ha−1 treatments; Table 2).
For variety ZD958, aboveground N uptake in treatment N180C2 was significantly higher than in treatments N180U, N180C1, and N180C in 2019–2020 (Table 2), whereas for variety YH988, aboveground N uptake in treatments N180C1 and N180C2 was significantly higher than in N180U and N180C in 2019–2020 (Table 2).
The aboveground N uptake after anthesis for treatments N180U, N180C1, N180C2, and N180C was significantly higher than the N0 treatment (Figure S1). The aboveground N uptake after anthesis in N180C2 and N180C1 was significantly higher than in N180U for ZD958 and YH988 in both years (Figure S1), the values of which were 33.2–35.2% and 36.2–37.8%, respectively (Figure S2).

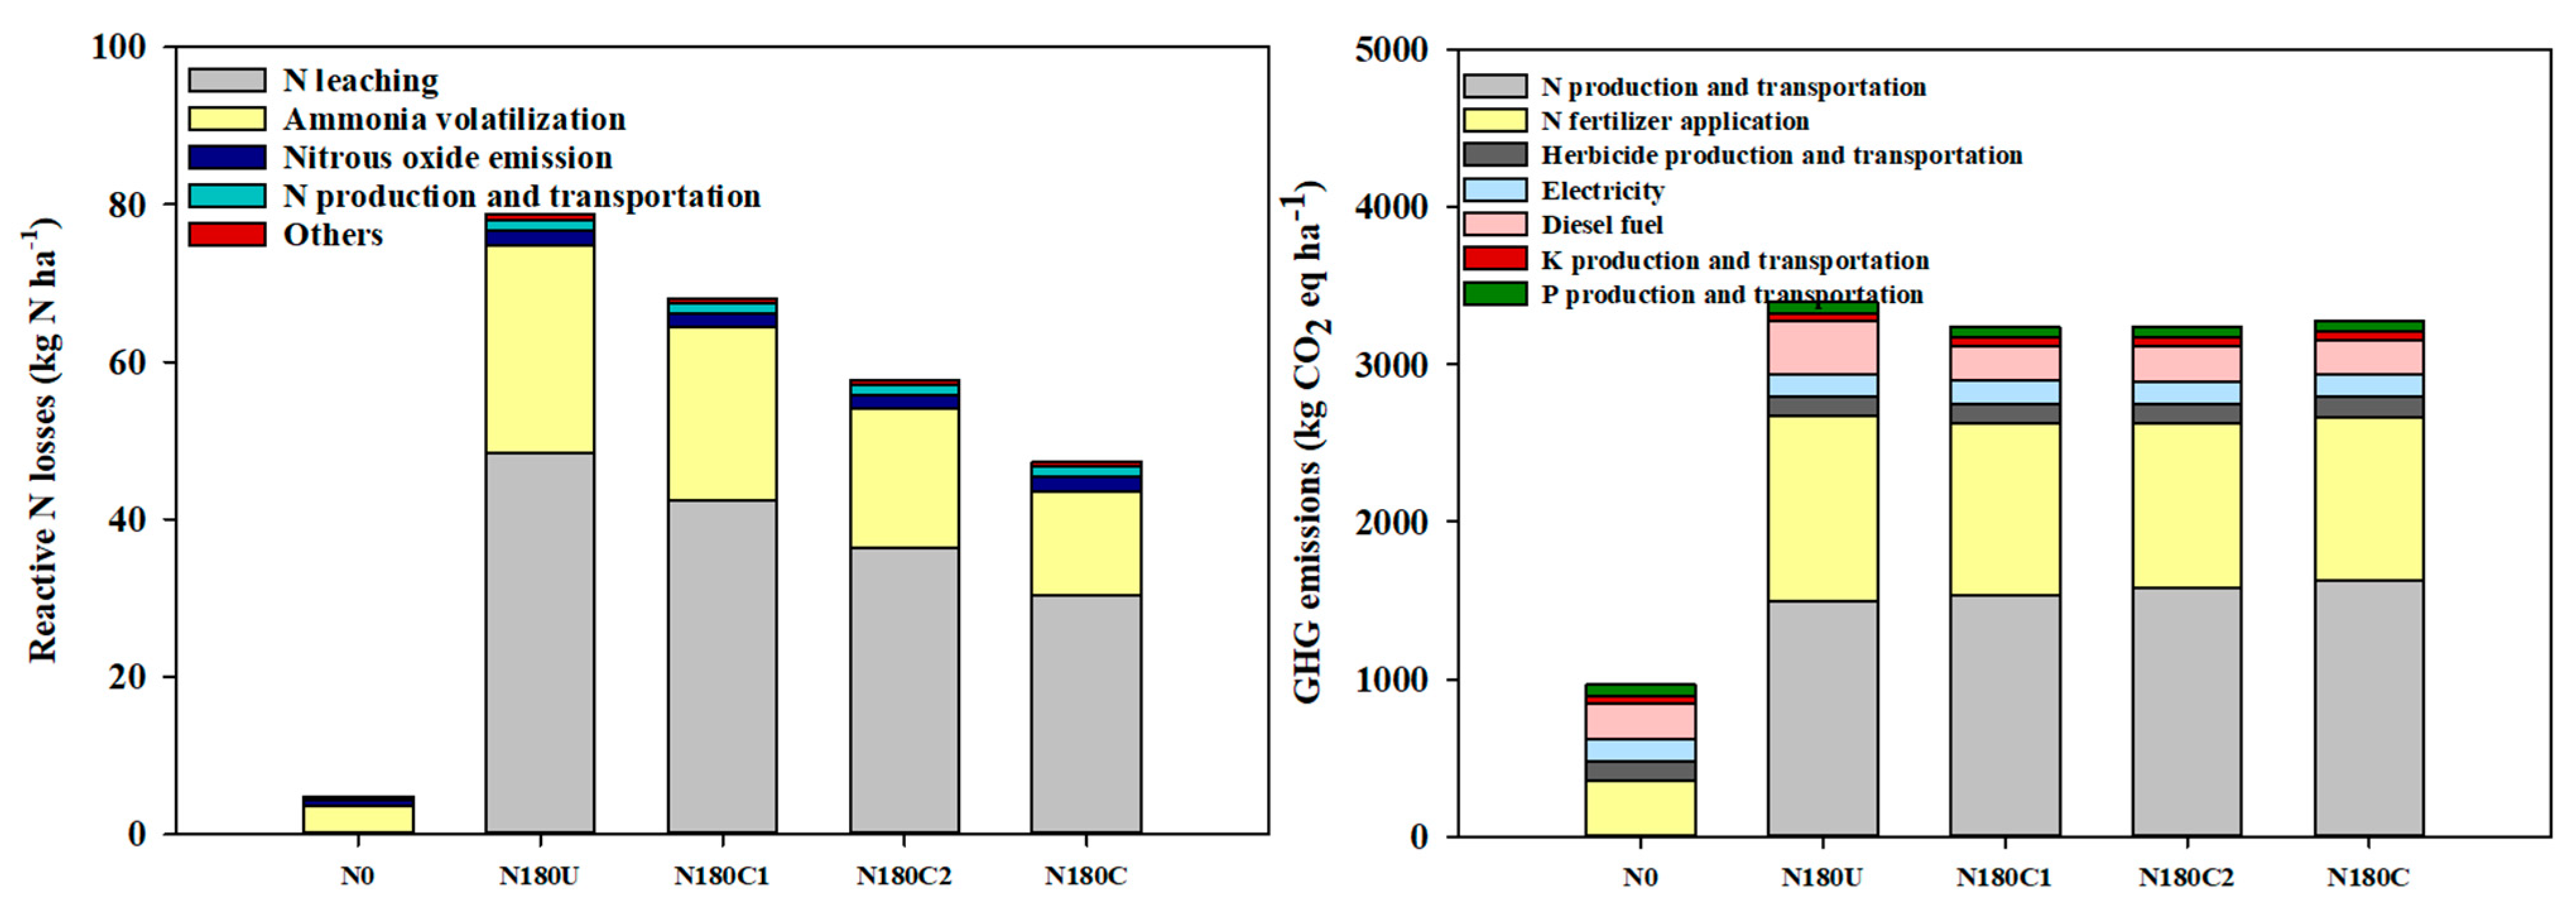
3.2. Nr Losses and N Footprint

The Nr losses and N footprint increased with an increased N rate for both maize varieties, with Nr losses from 4.79 to 78.7 kg N ha−1, whereas the N footprint was 0.6 to 7.4 kg N ha−1 for ZD958 and 0.7–7.1 kg N ha−1 for YH988 (Figure 4). The N footprint was significantly affected by N levels, N resources, and their interaction during the growing stages, and there was no significant effect detected between the maize varieties (Table S2). Compared to 180U, the Nr losses were significantly reduced by 13.5%, 26.8%, and 40.0% for treatment N180C1, N180C2, and N180C (Figure 4), respectively. Compared to 180U, the N footprint was significantly reduced by 17.4%, 36.0%, and 41.3% for treatment N180C1, N180C2, and N180C for variety ZD958, respectively, whereas these values were 24.3%, 32.4%, and 39.3% for variety YH988, respectively (Figure 5). The greatest reduction in N footprint in the CRU treatments was due to the reactive nitrogen losses decreasing and the maize grain yield increasing, which are shown in Figure 4 and Figure 6. In all the treatments, 96.2–97.6% of the reactive nitrogen losses and the N footprint originated from the nitrogen application, with NO3 leaching contributing the largest proportion (61.5–64.4%), followed by NH3 volatilization (27.8–33.6%) (Figure 4 and Figure 6).
Compared to the N180U treatment, N180C1, N180C2, and N180C reduced N leaching by 16.8%, 34.6%, and 38.9% for variety ZD958, and by 20.3%, 27.8%, and 34.0% for variety YH988, respectively (Figure 5). Compared to the N180U treatment, N180C1, N180C2, and N180C reduced NH3 volatilization by 9.1%, 17.1%, and 3.1% for variety ZD958, and 13.2%, 8.8%, and 4.3% for variety YH988, respectively (Figure 5). Compared to the N180U treatment, N180C1, N180C2, and N180C reduced N2O emissions by 20.5%, 42.0%, and 51.5% for variety ZD958, and 24.2%, 36.1%, and 47.8% for variety YH988, respectively (Figure 5). Agricultural inputs production and transportation, along with field operation consumption, took up only 2.4–3.8% (Figure 5).

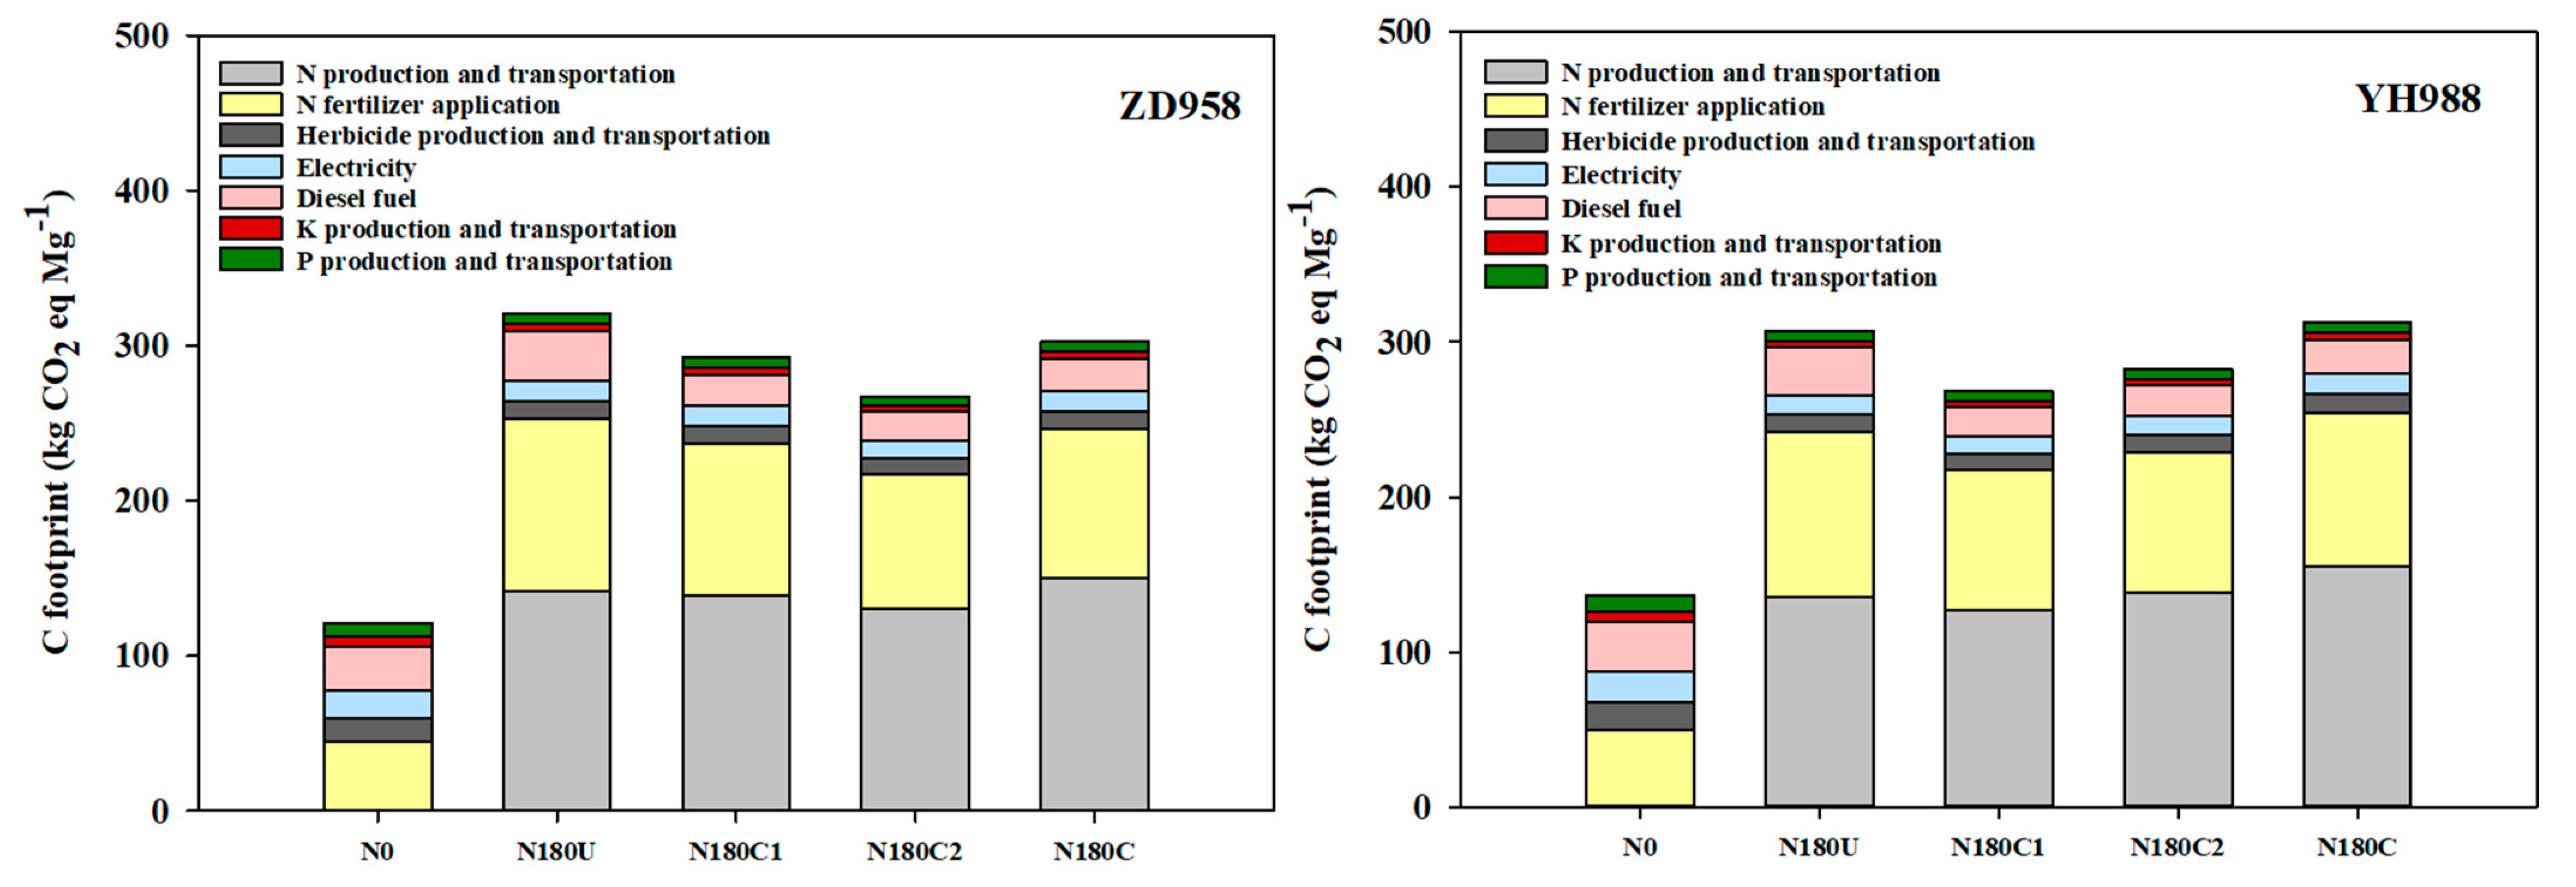
3.3. GHG Emission and C Footprint

The GHG emissions in the life cycle increased with the N rate, being 964.5 and 3395.3 kg CO2 eq ha−1 in treatment N0 and N180U (Figure 6), respectively. Compared with treatment N180U, the treatments N180C1, N180C2, and N180C increased GHG emissions from the production and transportation of nitrogen by 2.9%, 5.8%, and 8.7%, respectively. Conversely, treatments N180C1, N180C2, and N180C decreased GHG emissions from nitrogen application by 7.2%, 11.2%, and 11.3%, respectively (Figure 6). For the whole life cycle process, in comparison to the N180U1 treatment, treatments N180C1, N180C2, and N180C had 4.6%, 4.6%, and 3.4% lower GHG emissions, respectively. The C footprint was significantly affected by N sources in both years (Table S2).
For the C footprint, treatment N180U achieved the highest value (320.7 kg CO2 eq Mg−1) for ZD958, and N180C had the highest value (312.9 kg CO2 eq Mg−1) for YH988, whereas N180C2 and N180C1 had the lowest value (267.4 and 267.9 kg CO2 eq Mg−1) for ZD958 and YH988, respectively.

3.4. Ecosystem Economic Benefits

During the two growing seasons, treatments N180C2 and N180C1 achieved the highest N-derived grain benefits for ZD958 and YH988, respectively (Table 3). Although the cost of nitrogen was three times higher for CRU than for urea, CRU saved nearly 50% of the labor costs (USD 116 ha−1). Finally, as observed for N-derived grain, N180C2 and N180C1 had greater private profitability (USD 1000 ha−1 and USD 1304 ha−1) than the other treatments for ZD958 and YH988, respectively (Table 3).
Compared with N180U, N180C1, N180C2, and N180C reduced the ecological costs by 4.8%, 18.3%, and 42.1% for both varieties, respectively. N180C2 and N180C1 achieved the highest ecosystem economic benefits for ZD958 and YH988, which were USD 831 ha−1 and USD 1101 ha−1, respectively (Table 3).

4. Discussion

4.1. Effects of Different Combinations of CRU and Urea on the Yield and Aboveground N Uptake of Two Maize Varieties

The optimal N application is 180 kg N ha−1 for summer maize systems in the NCP [33], which is determined by the nitrogen in-season root-zone management to satisfy the N demand. In our study, we selected four N sources (I-all urea, II-CRU-N:urea-N = 1:2, III-CRU-N:urea-N = 2:1, and All CRU) at 180 kg N ha−1, and the two main varieties ZD958 and YH988, which are widely planted in the region and have been found to achieve high yields in the NCP. According to the results, the optimal N sources in our study were CRU-N:urea = 2:1 and 1:2 for variety ZD958 and YH988 in both years, respectively. The mixture of CRU and urea achieved the maximal grain yield of 11.02–13.51 Mg ha−1 for ZD958 in 2019 and 2020, and 11.33–13.18 Mg ha−1 for YH988 in 2019 and 2020, respectively (Figure 3), the NUE values of which were 62.2–65.3% and 57.6–60.3% at the optimal N rate (Table 2). These values are higher than those reported in other studies, which were typically conducted in a better growth environment. For instance, the NUE of an integrated soil-crop management system was around 40% in North-Central USA [34], as it was based on the optimized N management for high-yield maize [10]. Under the current conditions, the mixture of CRU and urea of CRU-N:urea-N = 2:1 and 1:2 for ZD958 and YH988, respectively, achieved high grain yield under 180 kg N ha−1, which was mainly attributed to the following two reasons. The first was the significant increase in grain numbers per ear and hundred-grain weights for ZD958 and YH988, respectively (Table S3), and the second was the greater N uptake after silking for the two treatments (Figures S1 and S2), which was proved to increase the percentage of N transformation to grain part [35]. Based on this, higher grain yield and N uptake can be achieved through the rational combination of CRU and normal urea to provide more N at the post-silking growth stages for varieties ZD958 and YH988.
According to an earlier study [36], ZD958 is a stay-green variety with high N-efficiency that requires more N uptake after silking to maintain high rates of photosynthesis and grain-filling. In our study, for variety ZD958, the significant increase in grain composition was the hundred-grain weight, as the blend of CRU-N:urea-N = 2:1 supplied more N after the silking stage, which benefitted milk-filling (Table S2). Variety YH988, is adapted for high-density (erectophile-type), and has green leaves throughout the grain-filling period, though some of its leaves senesce quickly near the mature stage. According to our result, significant increases were observed for both grain numbers per ear and hundred-grain weight, which suggests that the combination of CRU-N:urea-N = 1:2 benefitted the growth and development of the silks and ears, which are influenced by N supply and source, ultimately affect the grain numbers per ear and hundred-grain weight (Table S2). Therefore, the optimal mixture of CRU-N:urea-N for achieving high grain yield and aboveground N accumulation in the different varieties was determined by better matching nitrogen application.

4.2. Effects of the Combination of CRU and Urea on Nr Losses and N Footprint of Two Maize Varieties

Reducing reactive nitrogen losses is the key to mitigating negative environmental problems [37,38]. There has been little research focus on integrated reactive nitrogen losses (N leaching, N2O emissions, and NH3 volatilization) among mixtures of CRU and urea with different maize varieties in a high-yielding summer maize system. We quantified the reactive nitrogen losses using empirical models for both CRU and normal urea with the two maize varieties (ZD958 and YH988).
In our study, NH3 volatilization increased linearly, whereas the N2O emissions increased exponentially for both CRU and normal urea (Figure S4). A similar result was also reported for a wheat system in the NCP [39]. Few studies have focused on N leaching between different N sources and maize varieties. The results showed that, compared with normal urea, a mixture of CRU and urea significantly reduced the Nr losses by 13.5–40.0% and the N footprint for the two varieties ZD958 and YH988 by 17.4–41.3% and 24.3–39.3%, respectively (Figure 5). The decrease was mainly attributed to N leaching and NH3 volatilization (Figure 4). The greater the ratio of controlled-release nitrogen, the lower the potential for the reduction of Nr losses and N footprints for both varieties. The release of CRU-N could be better synchronized with the summer maize demand in our study and could significantly reduce the mineral N concentration in the field and delay the N2O and NH3 emissions.
According to Ding’s study [40], the low and high greenhouse gas-emitting rice varieties root exudates had different types of secondary metabolites, which increased expression of mcrA and AOA genes, leading to increased CH4 and N2O emissions. For our study, more detailed experiments should be arranged about the N2O emissions with different maize varieties in future, in order to cooperate with the results of the model data.

4.3. Effects of the Combination of CRU and Urea on GHG Emissions and the C Footprint of Two Maize Varieties

Compared with the two N resources, the blended N emitted slightly more GHGs than standard urea during N production and transportation, as the production of 1 kg N of CRU emits 0.72 kg CO2-eq more GHG [8]. Nevertheless, in our study, treatments N180C2 and N180C1 exhibited reduced N2O emissions and resulted in 7.8–12.8% lower GHG emissions than normal urea (Figure 4). Above all, the mixture of CRU and urea had lower life-cycle GHG emissions than standard urea (Figure 4). In addition, because the higher grain yield was achieved in the mixed treatments, it reduced the C footprint (Figure 6). The lowest C footprint was achieved in treatments N180C2 and N180C1 for ZD958 and YH988, respectively (Figure 6), which was similar to the results for grain yield and aboveground N uptake.
Across 5406 farms in China, Wu [33] reported a mean maize grain of 7.56 Mg ha−1, with an average of 220 kg N ha−1, and a GHG emission intensity average of 482 kg CO2 eq Mg−1 grain (155, 242, and 85 kg CO2 eq Mg−1 grain from nitrogen application, nitrogen product, and other sources, respectively). The NCP is a typical wheat–maize system, in which the maize grain yield averages 7.42 Mg ha−1 and C footprint averages 487 CO2 eq Mg−1 grain [32]. In our study, for varieties ZD958 and YH988, the highest grain yield averaged 11.0–13.5 and 11.3–13.2 Mg ha−1, and the optimal N rate and source were N180C2 (CRU-N:urea-N = 2:1) and N180C1 (CRU-N:urea-N = 1:2), calculated at 267.4 and 267.9 CO2 eq Mg−1 grain, respectively (Figure 6). In other high-yield and N-efficiency maize systems, the C footprint averaged 231 kg CO2 eq Mg−1 with a grain yield of 13.2 Mg ha−1 in Nebraska in USA, with an N rate of 183 kg ha−1 [41], and the C footprint averaged 287 kg CO2 eq Mg−1 with a grain yield 9.9 Mg ha−1 in southern Canada, with an N rate of 130 kg ha−1 [42].
For both the ZD958 and YH988 varieties, the N application, electricity, and diesel fuel were the most crucial components for GHG emissions, and N180U required top-dressing fertilizer for N180U, and thus more diesel oil, electric power, and extra labor were needed. With the current accelerated urbanization and political system in China, farmers have been encouraged to take jobs in big cities. It follows that the ownership of farmland has become less of priority to some individuals and companies, causing the emergence of many large-scale farms in the NCP [43]. In this situation, large-scale farms have been encouraged to use the energy and cost saving strategy, including the use of high-yield varieties, less labor and fertilizer input, and greater mechanization [44]. In our study, the use of a suitable blend of CRU and urea in a once-off application together with a suitable variety reduced the C footprint in the summer maize system, supporting large-scale agricultural production in future.

4.4. Effect of the Combination of CRU and Urea on Socioeconomic and Ecosystem Economic Benefits

For varieties ZD958 and YH988, the N180C2 and N180C1 treatments achieved higher economic profits due to higher grain yield, agricultural input costs, and ecological costs compared with the common urea treatment (Table 3). As mentioned earlier, the topdressing application has higher labor costs and is inconvenient during the later stage of crop growth. With rapid urbanization and an aging population in China aging rapidly [45], labor shortages are becoming more prominent and labor costs are increasing rapidly, particularly in the NCP. Owing to the once-off application of fertilizer, the labor costs of treatments N180C2 and N180C1 increased by USD 110 and 55 ha−1, whereas ZD958 and YH988 reduced costs by USD 116 and 116 ha−1 (Table 3).
Additionally, the highest EEB was achieved in treatments N180C2 and N180C1 for varieties ZD958 and YH988. Thus, optimizing the proportions of CRU and urea in combination with appropriate varieties could be a positive strategy for both farmers and society. As China’s Ministry of Agriculture announced that to achieve zero growth in the use of chemical fertilizer by 2020 and peak carbon dioxide emission and carbon neutrality by 2030 and 2060, respectively, improving fertilizer efficiency is necessary, especially if sustainable resource and environmental development with no yield penalty is to be achieved. Our result provides an example by which cleaner crop production can be achieved in the future.

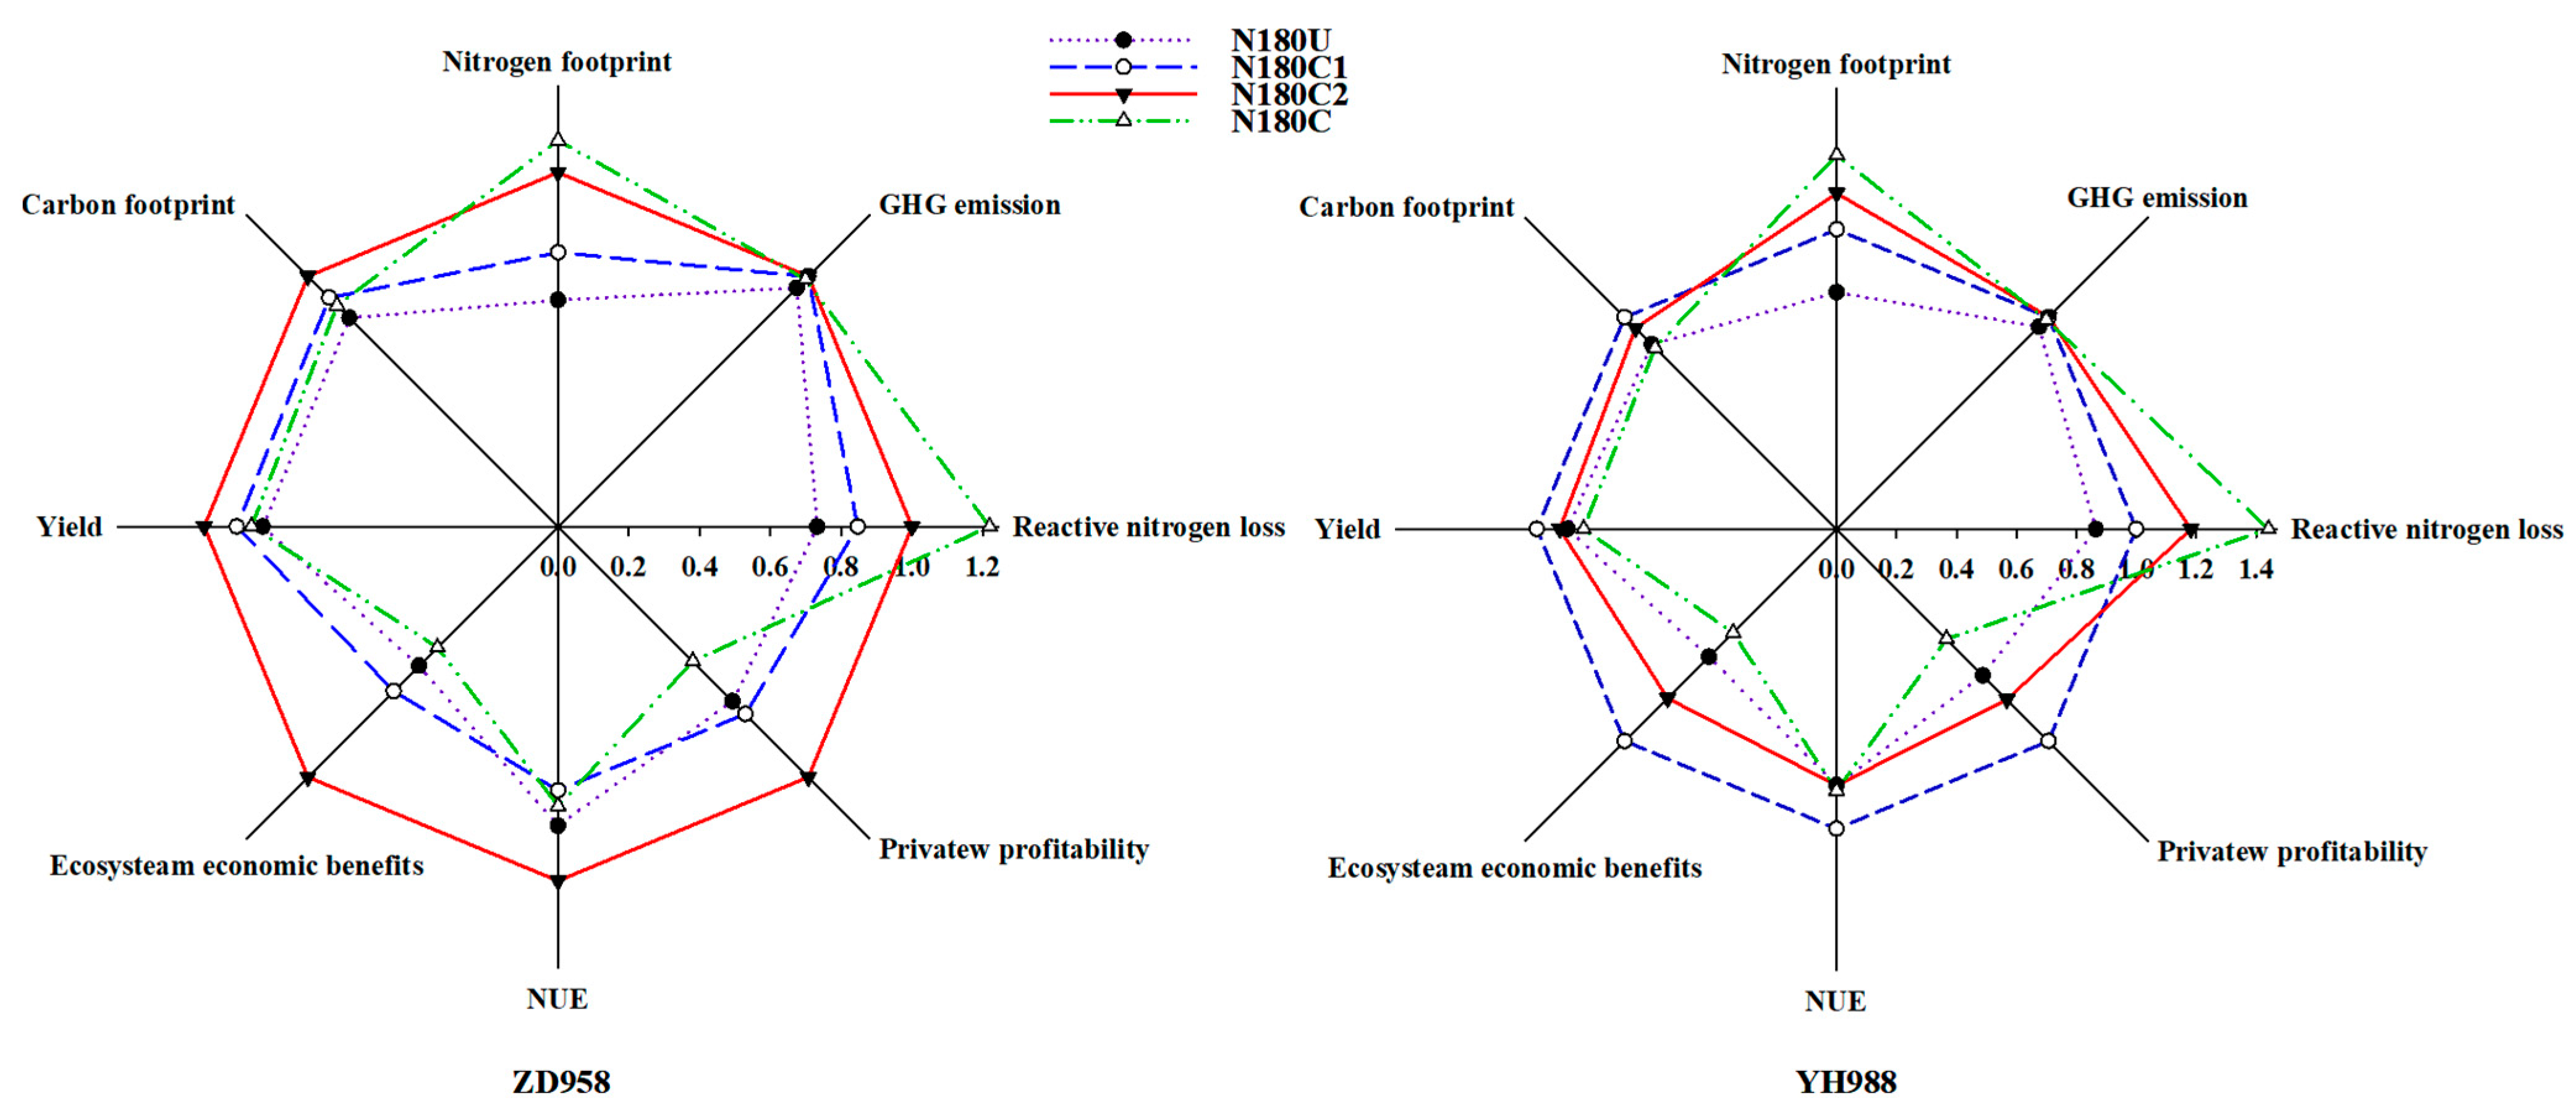
4.5. Comprehensive Analysis and Potential Limitations

Under the current situation in China, especially in the NCP, the overuse of N, low NUE, and high GHG emissions constitute severe problems [39]. The use of CRU can reduce N application, increase NUE, and decrease GHG emissions without a yield penalty; however, the cost of fertilizer is high [11]. In our study, treatments N180C2 (CRU-N:urea-N = 2:1) and N180C1 (CRU-N:urea-N = 1:2), with a once-off application of basal fertilizer, achieved the best results for varieties ZD958 and YH988, respectively (Figure 7). Although the N footprint and Nr loss did not obtain the best values, our comprehensive analysis still found that treatments N180C2 and N180C1 had the largest area in the radar chart for varieties ZD958 and YH988 (Figure 7). To promote cleaner summer maize production, the use of different varieties, yield, NUE, environmental parameters, and cost parameters, reflecting the “4R” components, should be considered. This approach was superior in terms of agronomic and environmental impacts, thus providing a rational framework for combining optimal N management strategies and appropriate maize varieties.
A favorable maize system should comprise a genotype (G) developed in an appropriate environment (E) with suitable nutrient resources, a pest- and disease-free environment, and the best management practices (M) for the adaptive varieties, weather, soil, and management conditions [46]. As the aboveground N uptake for different varieties and release rules of CRU differs in different soil types [22], and several typical toil types exist in the NCP, future studies should focus on long-term research on G (genotype) × E (environment) × M (management) interactions in this region.

5. Conclusions

The results showed that one basal application of N180C2 (CRU-N:urea-N = 2:1) and N180C1 (CRU-N:urea-N = 1:2) produced high grain yields and aboveground N uptake for ZD958 and YH988, respectively. Furthermore, reductions in Nr losses (N leaching, NH3 volatilization, and N2O emissions) were achieved in treatment N180C2 and N180C1 for varieties ZD958 and YH988, respectively. Further evaluation was performed using the LCA approach, which indicated that N180C2 and N180C1 effectively reduced the GHG emissions and the C and N footprints of varieties ZD958 and YH988, respectively. In brief, the correct CRU-N management (M-right rate× source) coordinated with appropriate genetic varieties (G) constitutes an effective strategy for achieving sustainable and cleaner maize production in a summer maize system in NCP. More studies should focus on the G × M × E interaction in various cropping systems and regions.

Supplementary Materials

The following supporting information can be downloaded at: https://www.mdpi.com/article/10.3390/agriculture12081247/s1, Figure S1. Aboveground N uptake before and after anthesis under different N rates and resources for varieties ZD958 and YH988 in 2019 and 2020. N0, no N; 180, 180 kg N ha−1; U, solely urea; C1, ratio of controlled-release nitrogen to urea nitrogen is 1:2; C2, ratio of controlled re-lease nitrogen to urea nitrogen is 2:1; C, all CRU. Figure S2. Percentage of aboveground N uptake before and after anthesis under different N rates and resources for varieties ZD958 and YH988 in 2019 and 2020. N0, no N; 180, 180 kg N ha−1; U, solely urea; C1, ratio of controlled-release nitrogen to urea nitrogen is 1:2; C2, ratio of controlled re-lease nitrogen to urea nitrogen is 2:1; C, all CRU. Figure S3. Release of CRU cumulatively and per time interval in 2019 in (A) laboratory water (25 °C) and (B) the field. Figure S4. Relationships between N rate and (A) NH3 volatilization, (B) N2O emissions with common urea (black solid circles and solid line) and controlled release urea (hollow triangles and circles and dotted line) for summer maize production. Table S1. Reactive N emission and GHG emission factors from the production and transportation of agricultural inputs in a summer maize production system. Table S2. Two-way analysis of variance of the nitrogen (N) level and N source on grain yield, varieties, N footprint, and C footprint of summer maize in the 2019 and 2020 growing seasons. Table S3. Ear numbers, grain numbers, and hundred-grain weight of summer maize in the 2019 and 2020 growing seasons.

Author Contributions

Conceptualization, J.G. and M.M.; methodology, Q.Y.; software, H.L.; validation, R.S. and Y.Z.; formal analysis, M.S.; investigation, H.W.; resources, J.G.; data curation, Y.W. and D.Y.; writing—original draft preparation, J.G. and M.M.; writing—review and editing, J.G.; visualization, M.M.; supervision, J.G.; project administration, D.Y. and M.M.; funding acquisition, J.G. All authors have read and agreed to the published version of the manuscript.

Funding

The research was funded by National Natural Science Foundation of China, grant number 32001478.

Data Availability Statement

Not applicable.

Conflicts of Interest

The authors declare no conflict of interest.

References

  1. Zhuang, M.; Liu, Y.; Yang, Y.; Zhang, Q.; Ying, H.; Yin, Y.; Cui, Z. The sustainability of staple crops in China can be substantially improved through localized strategies. Renew. Sustain. Energy Rev. 2022, 154, 111893. [Google Scholar] [CrossRef]
  2. Tilman, D.; Balzer, C.; Hill, J.; Befort, B.L. Global food demand and the sustainable intensification of agriculture. Proc. Natl. Acad. Sci. USA 2011, 108, 20260–20264. [Google Scholar] [CrossRef]
  3. Cui, Z.L.; Zhang, F.S.; Chen, X.P.; Dou, Z.X.; Li, J.L. In-season nitrogen management strategy for winter wheat: Maximizing yields, minimizing environmental impact in an over-fertilization context. Field Crop Res. 2010, 116, 140–146. [Google Scholar] [CrossRef]
  4. Zhang, Y.; Liu, J.; Mu, Y.; Pei, S.; Lun, X. Emissions of nitrous oxide, nitrogen oxides and ammonia from a maize field in the North China Plain. Atmos. Environ. 2011, 45, 2956–2961. [Google Scholar] [CrossRef]
  5. Davidson, E.A.; Suddick, E.C.; Rice, C.W.; Prokopy, L.S. More food, low pollution (mo fo lo Po): A grand challenge for the 21st century. J. Environ. Qual. 2015, 44, 305–311. [Google Scholar] [CrossRef]
  6. Flis, S. The 4Rs in Crop Nitrogen Research. Crops Soils 2017, 50, 18–20. [Google Scholar] [CrossRef]
  7. Hatfield, J.L.; Venterea, R.T. Enhanced efficiency fertilizers: A multi-site comparison of the effects on nitrous oxide emissions and agronomic performance. Agron. J. 2014, 106, 679. [Google Scholar] [CrossRef]
  8. Zhang, W.S.; Liang, Z.Y.; He, X.M.; Wang, X.Z.; Shi, X.J.; Zou, C.Q.; Chen, X.P. The effects of controlled release urea on maize productivity and reactive nitrogen losses: A meta-analysis. Environ. Pollut. 2019, 246, 559–565. [Google Scholar] [CrossRef]
  9. Dimkpa, C.O.; Fugice, J.; Singh, U.; Lewis, T.D. Development of fertilizers for enhanced nitrogen use efficiency e trends and perspectives. Sci. Total Environ. 2020, 731, 139113. [Google Scholar] [CrossRef]
  10. Akiyama, H.; Yan, X.Y.; Yagi, K. Evaluation of effectiveness of enhanced-efficiency fertilizers as mitigation options for N2O and NO emissions from agricultural soils: Meta-analysis. Glob. Change Biol. 2010, 16, 1837–1846. [Google Scholar] [CrossRef]
  11. Guo, J.M.; Wang, Y.H.; Blaylock, A.D.; Chen, X.P. Mixture of controlled release and normal urea to optimize nitrogen management for high-yielding (&15 Mg ha−1) maize. Field Crop Res. 2017, 204, 23–30. [Google Scholar]
  12. Noellsch, A.J.; Motavalli, P.P.; Nelson, K.A.; Kitchen, N.R. Corn response to conventional and slow-release nitrogen fertilizers across a Claypan Landscape. Agron. J. 2009, 101, 607–614. [Google Scholar] [CrossRef]
  13. Zhou, Z.; Shen, Y.; Du, C.; Zhou, J.; Qin, Y.; Wu, Y. Economic and soil environmental benefits of using controlled-release bulk blending urea in the North China Plain. Land Degrad. Dev. 2017, 28, 2370–2379. [Google Scholar] [CrossRef]
  14. Zhang, L.; He, X.; Liang, Z.; Zhang, W.; Zou, C.; Chen, X. Tiller development affected by nitrogen fertilization in a high-yielding wheat production system. Crop Sci. 2020, 60, 1034–1047. [Google Scholar] [CrossRef]
  15. Cui, Z.L.; Chen, X.P.; Zhang, F.S. Development of regional nitrogen rate guidelines for intensive cropping systems in China. Agron. J. 2013, 105, 1411–1416. [Google Scholar] [CrossRef]
  16. Al-Zahrani, H.S.; Alharby, H.F.; Fahad, S. Antioxidative defense system, hormones, and metabolite accumulation in different plant parts of two contrasting rice cultivars as influenced by plant growth regulators under heat stress. Front. Plant Sci. 2022, 13, 911846. [Google Scholar] [CrossRef]
  17. Liu, L.; Sadras, V.O.; Xu, J.; Hu, C.; Yang, X.; Zhang, S. Chapter Five—Genetic Improvement of Crop Yield, Grain Protein and Nitrogen Use Efficiency of Wheat, Rice and Maize in China. Advances in Agronomy; Sparks, D.L., Ed.; Academic Press: Massachusetts, MA, USA, 2021; pp. 203–252. [Google Scholar]
  18. Worku, M.; Bänziger, M.; Erley, G.S.; Friesen, D.; Diallo, A.O.; Horst, W.J. Nitrogen uptake and utilization in contrasting nitrogen efficient tropical maize hybrids. Crop Sci. 2007, 47, 519–528. [Google Scholar] [CrossRef]
  19. Mei, L.; Daud, M.; Ullah, N.; Ali, S.; Khan, M.; Malik, Z.; Zhu, S. Pretreatment with salicylic acid and ascorbic acid significantly mitigate oxidative stress induced by copper in cotton genotypes. Environ. Sci. Pollut. Res. 2015, 22, 9922–9931. [Google Scholar] [CrossRef]
  20. Yao, Z.; Zhang, W.S.; Wang, X.B.; Zhang, L.; Zhang, W.; Liu, D.Y.; Chen, X.P. Agronomic, environmental, and ecosystem economic benefits of controlled-release nitrogen fertilizers for maize production in Southwest China. J. Clean. Prod. 2021, 312, 127611. [Google Scholar] [CrossRef]
  21. National Bureau of Statistic of China (NBSC). Chinese Statistical Bulletin of National Economy and Social Development in China in 2017; National Bureau of Statistic of China: Beijing, China, 2018. Available online: http://www.stats.gov.cn/jsj/zxfb/201802/t20180228_1585631.html (accessed on 1 September 2018). (In Chinese)
  22. Yang, X.; Geng, J.; Li, C.; Zhang, M.; Tian, X. Cumulative release characteristic of controlled-release nitrogen and potassium fertilizers and their effects on soil fertility, and cotton growth. Sci. Rep. 2016, 6, 39030. [Google Scholar] [CrossRef]
  23. Cassman, K.G.; Dobermann, A.; Walters, D.T.; Yang, H.S. Meeting cereal demand while protecting natural resources and improving environmental quality. Annu. Rev. Environ. Resour. 2003, 28, 315–358. [Google Scholar] [CrossRef]
  24. ISO-14040; Environmental Management Life Cycle Assessment Principles and Framework. British Standards Institution: London, UK, 2006.
  25. ISO-14044; Environmental Management Life Cycle Assessment Requirements and Guidelines. British Standards Institution: London, UK, 2006.
  26. Yin, M.; Li, Y.; Xu, Y. Comparative effects of nitrogen application on growth and nitrogen use in a winter wheat/summer maize rotation system. J. Integr. Agric. 2017, 16, 2062–2072. [Google Scholar] [CrossRef]
  27. Ying, H.; Ye, Y.; Cui, Z.; Chen, X. Managing nitrogen for sustainable wheat production. J. Clean. Prod. 2017, 162, 1308–1316. [Google Scholar] [CrossRef]
  28. Xia, Y.; Yan, X. Ecologically optimal nitrogen application rates for rice cropping in the Taihu Lake region of China. Sustain. Sci. 2012, 7, 33–44. [Google Scholar] [CrossRef]
  29. Schiermeier, Q. Atmospheric science: Fixing the sky. Nature 2009, 460, 792–795. [Google Scholar] [CrossRef]
  30. Xiang, P.; Zhou, Y.; Jiang, J.; Zheng, H.; Yamn, H.M.; Huang, H. Studies on the external costs of and the optimum use of nitrogen fertilizer based on the balance of economic and ecological benefits in the paddy field system of the Dongting Lake area. Sci. Agric. Sin. 2006, 39, 2531–2537. [Google Scholar]
  31. Xia, Y.; Yan, X. Life-cycle evaluation of nitrogen-use in rice-farming systems: Implications for economically-optimal nitrogen rates. Biogeosciences 2011, 8, 3159–3168. [Google Scholar] [CrossRef]
  32. Gu, B.; Ge, Y.; Ren, Y.; Xu, B.; Luo, W.; Jiang, H.; Gu, B.; Chang, J. Atmospheric reactive nitrogen in China: Sources, recent trends, and damage costs. Environ. Sci. Technol. 2012, 46, 9420–9427. [Google Scholar] [CrossRef]
  33. Wu, L.; Chen, X.P.; Cui, Z.L.; Zhang, W.F.; Zhang, F.S. Establishing a regional nitrogen management approach to mitigate greenhouse gas emission intensity from intensive smallholder maize production. PLoS ONE 2014, 9, e98481. [Google Scholar] [CrossRef]
  34. Cassman, K.G.; Dobermann, A.R.; Walters, D.T. Agroecosystems, nitrogen-use efficiency, and nitrogen management. AMBIO 2002, 31, 132–140. [Google Scholar] [CrossRef]
  35. Fernandez, J.A.; Nippert, J.B.; Prasad, P.V.V.; Messina, C.D.; Ciampitti, I.A. Post-silking 15N labelling reveals an enhanced nitrogen allocation to leaves in modern maize (Zea mays) genotypes. J. Plant Physiol. 2022, 268, 153577. [Google Scholar] [CrossRef]
  36. Fu, W.; Wang, Y.; Ye, Y.; Zhen, S.; Zhou, B.; Wang, Y.; Hu, Y.; Zhao, Y.; Huang, Y. Grain yields and nitrogen use efficiencies in different types of stay-green maize in response to nitrogen fertilizer. Plants 2020, 9, 474. [Google Scholar] [CrossRef]
  37. Ju, X.T.; Xing, G.X.; Chen, X.P.; Zhang, S.L.; Zhang, L.J.; Liu, X.J.; Cui, Z.L.; Yin, B.; Christie, P.; Zhu, Z.L.; et al. Reducing environmental risk by improving N management in intensive Chinese agricultural systems. Proc. Natl. Acad. Sci. USA 2009, 106, 3041–3046. [Google Scholar] [CrossRef]
  38. Zhang, X.; Davidson, E.A.; Mauzerall, D.L.; Searchinger, T.D.; Dumas, P.; Shen, Y. Managing nitrogen for sustainable development. Nature 2015, 528, 51–59. [Google Scholar] [CrossRef]
  39. Zhang, L.; Liang, Z.; Hu, Y.; Schmidhalter, U.; Zhang, W.; Ruan, S.; Chen, X. Integrated assessment of agronomic, environmental and ecosystem economic benefits of blending use of controlled-release and common urea in wheat production. J. Clean. Prod. 2021, 287, 125572. [Google Scholar] [CrossRef]
  40. Ding, H.N.; Liu, T.Q.; Hu, Q.Y.; Liu, M.; Cai, M.L.; Jiang, Y.; Cao, C.G. Effect of microbial community structures and metabolite profile on greenhouse gas emissions in rice varieties. Environ. Pollut. 2022, 306, 119365. [Google Scholar] [CrossRef]
  41. Grassini, P.; Cassman, K.G. High-yield maize with large net energy yield and small global warming intensity. Proc. Natl. Acad. Sci. USA 2012, 109, 1074–1079. [Google Scholar] [CrossRef]
  42. Jayasundara, S.; Wagner-Riddle, C.; Dias, G.; Kariyapperuma, K.A. Energy and greenhouse gas intensity of corn (Zea mays L.) production in Ontario: A regional assessment. Can. J. Soil Sci. 2014, 94, 77–95. [Google Scholar] [CrossRef]
  43. Wang, J.; Yang, Y.; Huang, J.; Chen, K. Information provision, policy support, and farmers’ adaptive responses against drought: An empirical study in the North China Plain. Ecol. Model. 2015, 318, e275–e282. [Google Scholar] [CrossRef]
  44. Lowder, S.K.; Skoet, J.; Raney, T. The number, size, and distribution of farms, smallholder farms, and family farms worldwide. World Dev. 2016, 87, 16–29. [Google Scholar] [CrossRef]
  45. Liu, S.; Griffiths, S.M. From economic development to public health improvement: China faces equity challenges. Public Health 2011, 125, 669–674. [Google Scholar] [CrossRef]
  46. Edwards, J. Genotype × environment interaction for plant density in maize (Zea mays L.). Crop Sci. 2016, 56, 1493–1505. [Google Scholar] [CrossRef]
Figure 1. The daily precipitation and average temperature for the 2019–2020 summer maize growth period (May–September) in Yuanyang county (34°55′ N, 113°36′ E), Xinxiang city, Henan Province.
Agriculture 12 01247 g001
Figure 2. System boundary of the life cycle assessment for estimating the carbon footprint in maize production.
Agriculture 12 01247 g002
Figure 3. Influence of N treatments and maize varieties on maize yield during 2019–2020. N0, no N; 180, 180 kg N ha−1; U, solely urea; C1, ratio of controlled-release nitrogen to urea nitrogen is 1:2; C2, ratio of controlled release nitrogen to urea nitrogen is 2:1; C, all CRU. The lowercase letters represent significant differences (LSD = 0.05). Vertical bars represent the ±S.E. of the mean (n = 3).
Agriculture 12 01247 g003
Figure 4. The Nr losses and GHG emissions across the 2019 and 2020 growing periods in the summer maize life cycle. N0, no N; 180, 180 kg N ha−1; U, solely urea; C1, ratio of controlled-release nitrogen to urea nitrogen is 1:2; C2, ratio of controlled release nitrogen to urea nitrogen is 2:1; C, all CRU.
Agriculture 12 01247 g004
Figure 5. Average N footprint across the 2019 and 2020 growing periods in the summer maize system. N0, no N; 180, 180 kg N ha−1; U, solely urea; C1, ratio of controlled-release nitrogen to urea nitrogen is 1:2; C2, ratio of controlled release nitrogen to urea nitrogen is 2:1; C, all CRU.
Agriculture 12 01247 g005
Figure 6. Average C footprint across the 2019 and 2020 growing period in the summer maize life cycle. N0, no N; 180, 180 kg N ha−1; U, solely urea; C1, ratio of controlled-release nitrogen to urea nitrogen is 1:2; C2, ratio of controlled release nitrogen to urea nitrogen is 2:1; C, all CRU.
Agriculture 12 01247 g006
Figure 7. A radar char visualization of yield, NUE, environmental parameters (carbon footprint, nitrogen footprint, GHG emissions, reactive nitrogen loss), and cost parameters (private profitability and ecosystem economic benefits).
Agriculture 12 01247 g007
Table 1. Experimental design in 2019–2020 at the station of Yuanyang county (34°55′ N, 113°36′ E) in Xinxiang city, Henan Province, China.
VarietiesN TreatmentTotal N RateBasal N RateTopdressing N Rate (V6)
Urea-NCRU-NUrea-N
(kg N ha−1)
ZD958N00000
N180U180720108
N180C1180120600
N180C2180601200
N180C18001800
YH988N00000
N180U180720108
N180C1180120600
N180C2180601200
N180C18001800
N0, no N; 180, 180 kg N ha−1; U, solely urea; C1, ratio of controlled-release nitrogen to urea nitrogen is 1:2; C2, ratio of controlled release nitrogen to urea nitrogen is 2:1; C, all CRU.
Table 2. Maize aboveground N uptake and N use efficiency (NUE) in 2019 and 2020.
VarietiesN Rate20192020
N Uptake (kg N ha−1)NUE (%)N Uptake (kg N ha−1)NUE (%)
ZD958N0147.6 c——131.6 d——
N180U221.6 b43.1 b219.9 bc49.1 bc
N180C1219.8 b47.2 b228.3 b53.7 b
N180C2244.9 a62.2 a 249.1 a65.3 a
N180C228.1 b51.7 b214.3 c45.9 c
YH988N0136.1 c——131.2 d——
N180U213.6 b43.1 b214.1 c46.1 b
N180C1239.7 a57.6 a239.8 a60.3 a
N180C2223.1 b48.4 bc229.6 ab54.7 ab
N180C223.4 b48.5 b222.9 bc51.0 b
N0, no N; 180, 180 kg N ha−1; U, solely urea; C1, ratio of controlled-release nitrogen to urea nitrogen is 1:2; C2, ratio of controlled release nitrogen to urea nitrogen is 2:1; C, all CRU. Mean values followed by different letters are significantly different at 0.05.
Table 3. Ecosystem economic benefits of summer maize under different N t treatments and maize verities across 2019–2020.
VarietiesN RateN-Derived Grain BenefitsN
Costs
Labor CostsEcological CostsHealth CostsPrivate
Profitability
Ecosystem Economic Benefits
(USD ha−1)
ZD598N180U985 ab5723112687697 ab484 b
N180C1975 b11211512082748 ab546 ab
N180C21282 a167115103661000 a831 a
N180C875 b2221157338538 b427 b
YH988N180U1188 ab5723112687900 ab686 ab
N180C11531 a112115120821304 a1101 a
N180C21330 ab167115103661048 ab879 ab
N180C1013 b2221157338676 b565 b
180, 180 kg N ha−1; U, solely urea; C1, ratio of controlled-release nitrogen to urea nitrogen is 1:2; C2, ratio of controlled release nitrogen to urea nitrogen is 2:1; C, all CRU. Mean values by different letters are significantly different in 0.05.
Publisher’s Note: MDPI stays neutral with regard to jurisdictional claims in published maps and institutional affiliations.

