Article

An Integrated Assessment of Different Types of Environment-Friendly Technological Progress and Their Spatial Spillover Effects in the Chinese Agriculture Sector

1
College of Economics and Management, Northwest A&F University, 3 Taicheng Road, Xianyang 712100, China
2
School Management, Xi’an University of Science & Technology, Xi’an 710054, China
*
Author to whom correspondence should be addressed.
Agriculture 2022, 12(7), 1043; https://doi.org/10.3390/agriculture12071043
Submission received: 4 June 2022 / Revised: 13 July 2022 / Accepted: 15 July 2022 / Published: 18 July 2022
(This article belongs to the Special Issue Precision Agriculture Adoption Strategies)

Abstract

:
The progress of environment-friendly technology is an important means and fundamental way to achieve high-quality agricultural development. Based on the panel data of 30 provinces of China from 2000 to 2010, the study used the slack-based models (SBM) to measure the progress of China’s environment-based technology and its different types and discusses its dynamic evolution characteristics over time. First, the study adopted MATLAB software and used a slack-based models (SBM) method to split the environment-friendly technology progress (AGTP) into agricultural emission-reduction environment-friendly technology progress (AEGTP) and the agricultural re-source-saving environment-friendly technology progress (ARGTP). Then, global and local spatial autocorrelation analysis, spatial model testing, and Spatial Durbin Model (SDM) were performed on different types of environment-friendly technology progress using STATA15. Moreover, OpenGeoDa and ArcGIS software was used for visualization. The empirical results showed that: (i) from the perspective of time and space, the AGTP showed a slightly higher level in technological regression trend from 2000 to 2012, and rebounded rapidly from 2012 to 2019. In the spatial dimension, the spatial autocorrelation test results of environment-friendly technology progress at the global Moran I level showed a significant positive correlation; however, the phenomenon of the regional level showed a negative correlation. (ii) From the perspective of the type of heterogeneity, only the spatial distribution has a high degree of chance, and the aggregation area is more concentrated. Various influencing factors have a very significant impact on ACGTP but are less significant on agricultural resource-saving environment-friendly technology progress. However, various influencing factors have a more significant impact on the ACGTP than AEGTP. (iii) From the perspective of the spatial spillover effect, labor level, per capita agricultural gross product, and agricultural internal structure are positively and significantly related to environment-friendly technology progress and its different types. Agricultural price policy, financial support policy, economic environmental regulation, and administrative environmental regulation have significant negative effects on the progress of environment-friendly technology and its different types.

1. Introduction

Promoting environment-friendly agricultural development is an inevitable requirement for implementing new development concepts and promoting agricultural supply-side structural reforms [1,2,3]. In 2017, the General Office of the Central Committee of the Communist Party of China and the General Office of the State Council issued the “Opinions on Innovating Systems and Mechanisms to Promote Environment-friendly Agricultural Development”. It is a major measure to accelerate agricultural modernization and promote sustainable agricultural development in China [4]. In 2014, the Central “No. 1 Document” particularly emphasized that China needs to establish a long-term mechanism for environment-friendly agricultural development, increase agricultural ecological protection, and allow over-exploited resources to recuperate to promote the development of environment-friendly agriculture [5]. Among them, the use of new knowledge and new technologies to reduce environmental pollution, improve resource utilization efficiency, and promote energy conservation and emission reduction through the advancement of environment-friendly technology are important means for the development of environment-friendly agriculture [6,7]. Recently, the Ministry of Agriculture of China issued a notice of “Technical Guidelines for Environment-friendly Agricultural Development (2018–2030)” which proposes technologies for new varieties of high-efficiency and high-quality multi-resistance environmentally friendly and high-efficiency fertilizers, agricultural drugs, and biological agents [8]. Environmental friendly technology broadly deals with various resource-saving farming techniques to improve the optimal use of critical natural resources by the means of reducing the potential environmental impacts and ensuring the effective utilization of improved fertilization, water, and other critical resource-saving technology. Various regional and international organizations are also extensively supporting the expansions and promotions of environmentally friendly technology within the agriculture sector to make the sector more resilient to climate change, global warming, and ever-increasing resource depletion [9]. Therefore, the progress of environment-friendly technology has attracted extensive attention from scholars. However, the existing literature comprehensively evaluated the impacts of environmentally friendly agricultural technology to promote high and stable yield and high-quality agricultural products [10,11,12,13].
The general view is that environment-friendly technology progress is a key supporting factor for the development of modern agriculture [14,15]. However, the technological progress may not have similar effects on various regions and territories, and there must be some specific condition by which the impacts can be altered substantially [16]. Therefore, the following research question needs to be explored comprehensively: what is the changing trend of these environment-friendly technologies, whether environment-friendly technology progress has been enhanced over time, and whether environmental-friendly technology can foster agricultural pollution reduction and agricultural resource-saving. In particular, China has a vast territory, and there are obvious differences in the endowment of agricultural production factors between regions [17]. There may also be spatial and temporal differences in the factors affecting the progress of environment-friendly technology [18,19]. To make dynamic changes in the level of environment-friendly technology progress in plantation agriculture between regions in China, it is necessary to conduct serious exploration and research. In addition, from the perspective of the role of the classification of environment-friendly technology progress, it is to achieve the “triple” benefits of economic growth, resource efficiency improvement, and environmental performance improvement, that is, efficiency enhancement, energy saving, and emission reduction [20,21,22]. Therefore, from the perspective of type heterogeneity, it also needs to explore, the differences in the progress of different agricultural environment-friendly technologies. Only by grasping the mechanism of action of environment-friendly technology progress and the current characteristics of environment-friendly technology progress can we make more accurate use of environment-friendly technology progress and give full play to the driving value of environment-friendly technology progress [23]. A comprehensive investigation of these issues will help to make clear and specific recommendations for policymakers.
The primary objective is to comprehensively explore the environment-friendly technological progress (AGTP) by dividing it into two distinct aspects: (i) agricultural resources-saving environment-friendly technological progress (AEGTP) and (ii) agricultural emission reduction environment-friendly technological progress (ACGTP). More specifically, we tend to explore the three-in-one effect of efficiency enhancement, energy-saving, and emission reduction, and discuss the heterogeneity of types that will help to understand the differences in different environment-friendly technological progress. The study focused on the impact of green technology progress on carbon emissions to make up for the previous theoretical and empirical gaps in the analysis of carbon emissions based on agricultural technology progress. Secondly, we referred to the existing literature (Such as Northrup et al. [24], Yang et al. [25], and Wollenberg et al. [26]) and divided environmentally friendly technology progress into resource-saving and emission reduction technology progress according to the definition of green technology progress, and analyzed carbon emission reduction of different types of agricultural green technology progress in different time and space dimensions. The research tends to improve the previous research on carbon emission reduction of technological progress from a single perspective, which is conducive to reducing the problem of one-size-fits-all [27,28]. In the path research of emission reduction, technological progress is considered to play a leading role. However, to the best of our knowledge, there is no empirical support for exploring the spatiotemporal relationship between the progress of environmentally friendly technology and carbon emissions, and what kind of different carbon emission reduction effects will be formed by the progress of different types of agricultural environmental friendly technology. At the same time, accurately grasping the status quo characteristics and action mechanisms of different types of environment-friendly technological progress will assist the policymaker to foster more accurate use of environment-friendly technological progress and its diffusions into the industry. Therefore, from the perspective of heterogeneity, it has certain theoretical and practical significance to study the impact of agricultural green technology progress in reducing carbon emissions.

2. Literature Review

Environmentally friendly technological progress refers to technological progress that can promote resource conservation and emission reduction [29,30]. Existing literature (Tian et al. [31], Mostashari-Rad et al. [32], and Jantke et al. [33]) has formed the basic idea of green or pro-environmental technological progress measurement that incorporates pollutant emissions into the scope of analysis. Some scholars have studied the agricultural technology progress rate index and technical efficiency change index based on environmental factors and found that ignoring environmental factors will overestimate the growth of China’s agricultural productivity [34,35,36]. Hu et al. [37] studied the green productivity of China’s agriculture under the dual constraints of resources and the environment and highlighted the impacts of environmentally friendly technology on the reduction of carbon emissions and resource depilation. Xie et al. [38] found that the spatial spillover effect of environmental regulation on the progress of environmentally friendly technology has obvious attenuation and boundedness, and its local effect exhibits a “U-shaped” trend of first inhibition and then promotion. In a study of the Australian agriculture sector, Hamman et al. [39] found that the interaction of local environmental regulation policies strengthens the spatial spillover effect of environmentally friendly technology progress between regions. According to the study of Farooq et al. [40], the intensity of environmental subsidies will significantly affect the technological progress effect of environmental regulation policy combinations. However, China’s environmentally friendly technology progress can be decomposed into positive technology spillover effects and negative product structure effects [18]. By building a game model, Xiong et al. [41] found that environmental research and development is an important transmission path for environmental regulation to promote the progress of environmentally friendly technology.
The above research provides important analytical ideas for the in-depth discussion of agricultural environmentally friendly technology progress. In addition, some scholars have also discussed the factors affecting the progress of agricultural environmentally friendly technology. Luo et al. [42] and Mozzato et al. [43] found that the income level of rural residents, the level of agricultural human capital, the proportion of grain sown area, the urban–rural income gap, and the strength of agricultural policy support contribute to the degree of green output bias of agricultural technological progress, and the increase in urbanization level and fertilizer application will hinder its development. Zhang et al. [44] found that technology promotion and scale factors are the key factors for the progress of environmentally friendly technology in marine aquaculture, while the impact of science and education input factors is not significant. Interestingly, most of the existing studies (such as those by Li et al. [45], Fang et al. [46], Lansink and Reinhard [47], and Sherlund et al. [48]) have focused on total factor productivity or technical efficiency to analyze the spatial relationship between agricultural environmental friendly technology progress and environmental constraints, while there is a lack of in-depth analysis of the spatiotemporal dynamic evolution trend of China’s agricultural environmental friendly technology progress. In particular, most of them focus on agriculture in the broad sense and lack research on agriculture in the narrow sense or specific clusters of agriculture such as the planting industry. Since the planting industry is an important part of the development of green agriculture and its development is inseparable from the progress of environmentally friendly technology, an in-depth analysis of the temporal and spatial dynamic evolution trend of environmentally friendly technology progress in China’s planting industry is of great importance to providing policy suggestions for further promoting China’s agricultural green development.
The above literature has laid an important foundation for the spatial spillover effect of China’s agricultural green progress, but the spatial spillover effect of environmentally friendly technology progress in the planting industry still needs to be proved by the literature. A comprehensive and accurate analysis of the spatial spillover effects of environmentally friendly technological progress in various provinces can scientifically and effectively promote the green development of regional agriculture. There are few studies on the progress of agricultural environmentally friendly technology. This study explored the connotation and extension of agricultural technology progress and divided agricultural environmentally friendly technology into resource-saving technology and emission-reduction technology progress from the perspective of function goals.

3. Materials and Methods

3.1. Model Construction

3.1.1. Measurement Model of Agricultural Environmental Friendly Technology Progress

There are many methods for measuring the progress of agricultural environmentally friendly technology. For a more in-depth analysis of agricultural environmentally friendly technology progress and its different types, the study concerned the methods of van der Werf [49], Zhuang et al. [50], and Pang et al. [51] and simulated the method based on the improved SBM measurement method. The deflection process of the production frontier measures agricultural pollution reduction (ACGTP) and the agricultural resource-saving (AEGTP) technology, and finally measures the overall agricultural environmental friendly technology progress (AGTP). The specific formulae are shown below:
min ρ = { 1 1 m + t ( i = 1 m s x i x i o + i = 1 t s e i e i o ) } / { 1 + 1 p + q ( i = 1 p s y i + y i o + i = 1 q s b i b i o ) }
s . t . j = 1 n λ j x i j + s x i = x i o ,   i = 1 , 2 , m
j = 1 n λ j e i j + s e i = e i o ,   i = 1 , 2 , t  
j = 1 n λ j y i j s y i + = y i o ,   i = 1 , 2 , p
j = 1 n λ j x b i j + s b i = b i o ,   i = 1 , 2 , q
s x i ,   s e i , s y i + ,   s b i 0 ;   λ 0
where x , e , y   and   b are the input factors (capital and labor), energy input, desired output, and undesired output, respectively; s is the slack variable. Therefore, we can establish the Malmquist Index (ACGTP) of pollution-reducing agricultural environmental friendly technology progress as:
A C G T P D B / D b = ρ b s ( x s , y s ) / ρ b s ( x T , y T ) ρ b T ( x s , y s ) / ρ b T ( x T , y T ) / ρ x s ( x s , y s ) / ρ x s ( x T , y T ) ρ x T ( x s , y s ) / ρ x T ( x T , y T )
If ACGTP > 1, there may be technological progress in pollution reduction, that is, the greater the ACGTP value, the more significant the progress in pollution reduction in agricultural environmental friendly technology. Similarly, the Malmquist Index (AEGTP) of the progress of the environmentally friendly technology of agricultural resource-saving agriculture is:
A E G T P D B / D b = ρ E s ( x s , y s ) / ρ E s ( x T , y T ) ρ E T ( x s , y s ) / ρ E T ( x T , y T ) / ρ X s ( x s , y s ) / ρ X s ( x T , y T ) ρ X T ( x s , y s ) / ρ X T ( x T , y T )
If AEGTP > 1, there may be progress in agricultural environmentally friendly technology that saves resources, that is, the larger the AEGTP value, the more significant the progress in energy-saving technology. Since the improvement of environmental quality requires energy conservation and emission reduction at the same time, we define the comprehensive agricultural environmental friendly technology progress index by adjusting the methods used by Long et al. [52] as:
AGTP = AEGTP × ACGTP

3.1.2. Kernel Density Estimation Method

There are many methods for measuring the progress of agricultural environmentally friendly technology. For a more in-depth analysis of agricultural environmentally friendly technology progress and its different types, this study concerned the methods of van der Werf [49], Zhuang et al. [50], and Pang et al. [51] and simulated the method based on the improved SBM measurement method. The deflection process of the production frontier measures agricultural pollution reduction (ACGTP) and the agricultural resource-saving technology progress (AEGTP), and finally measures the overall agricultural environmental friendly technology progress (AGTP). The specific formulae are shown below.
The nonparametric estimation method of Kernel Density Estimation (KDE) has become a common method to study uneven distribution due to its weak dependence on the model and robustness (Doudou and Yuanping [53]). It is a non-parametric technique for estimating a randomized variable’s probability distribution. KDE is an essential dataset smoothing issue where such demographic assumptions are obtained from a fixed sampling size [54,55]. The study used this method to analyze the dynamic distribution characteristics of China’s agricultural environmentally friendly technology progress. The specific formula is:
F ( x ¯ ) = 1 N w i = 1 N K ( X i x ¯ w )
In Formula (5), F ( x ) represents the density function of agricultural environmental friendly technology progress, which x ¯ is the mean value, N represents the number of observations, Xi is the independent and identically distributed observations, w is the window width, and the larger w is, the higher the rate. The smoother the density function curve is, the lower the estimation accuracy will be, so a smaller window width is generally chosen in practical research.
K ( x ) = 1 2 π e x p ( x 2 2 )
According to the different expressions of the Kernel density function [56], the kernel function can be divided into the uniform kernel, quadratic kernel, and Gaussian kernel. Since there is no definite function expression for the nonparametric estimation, it is necessary to compare the position, shape, and ductility of the graph distribution to examine the change in the distribution. In this study, the Gaussian kernel density function was selected to estimate the distribution dynamics of China’s agricultural environmentally friendly technology progress as suggested by Ji et al. [57]. The function expression of the Gaussian kernel is shown in Equation (6).

3.1.3. Spatial Autocorrelation

Global autocorrelation (Moran’s I) and local autocorrelation analysis (Anselin Local Moran’s I) are analytical methods widely used to study spatial correlation [58]. Thus, we used both methods to verify the spatial correlation between China’s agricultural and environmentally friendly technology progress. The specific formulae are:
I = n   i   j W i j ( X i X ¯ ) ( X j X ¯ )   i   j W i j ( X j X ¯ )
I i = n ( X j X ¯ ) S X 2 W i j ( X j X ¯ )
Among them, Formula (7) is the global spatial autocorrelation “Moran’s I”, n is the total number of regions,   W i j is the spatial weight (queen contiguity weight matrix), X i and X j are the attributes X ¯ of the province, i and j , respectively, and are the attribute mean. In, Equation (8) the “Moran’s I” denotes the local spatial autocorrelation and S X 2 is the observed value variance, and its expression is S X 2 = j W i j X j X ¯   ) / n .

3.1.4. Spatial Dubin Model

At present, the mainstream research methods of spatial metrology include the spatial lag model (SAR) [59], spatial error model (SEM) [60], and spatial Durbin model (SDM) [61]. Compared with the SAR and SEM models, the SDM model considers the spatial correlation of dependent variables and the spatial correlation of independent variables and has both spatial autocorrelation and spatial interaction effects [62]. At the same time, for endogeneity problems, the SDM model can be used to obtain estimates that are not biased by amplification [63]. Therefore, the article used this model to investigate the impact of each variable on the progress of agricultural environmentally friendly technology and the spatial spillover effect. The model was set as follows:
Y = + β W y + β X + W X γ + ε
Among them, Y is the dependent variable, β is the spillover effect of neighboring provinces, X is the independent variable, β and γ are the parameters to be estimated, and W is the weight. In this paper, the spatial adjacency weight matrix was selected as the spatial weight matrix.

3.1.5. Data Sources

The study took 30 provinces in mainland China (excluding Hong Kong, Macao, and Taiwan) as the research object, and took 2000–2019 as the research interval. The relevant data used for spatial spillover effects were all from the China Rural Statistical Yearbook, China Agricultural Statistical Yearbook, China Statistical Yearbook, and the National Bureau of Statistics of China (https://data.stats.gov.cn/index.htm, accessed on 1 January 2021).

3.2. Variable Selection and Data Interpretation

3.2.1. Variable Selection and Data Description

In general, the factor inputs involved in agricultural production mainly include labor, land, resources, and technology. The study quantified the labor input by the number of employees in the planting industry, the land input by the total sown area of crops, and the resource input by the use of chemical fertilizers, pesticides, agricultural films, and the total power of planting machinery, and the output data include the total output value of the planting industry and the non-point source pollution index of undesired output. Among them, the total power data of the planting industry were calculated by subtracting the total power of forestry, animal husbandry, and fishing industry from the total power of agricultural, forestry, animal husbandry, and fishery industry in that year. However, the non-point source pollution is the main component of the current agricultural pollution discharge, which mainly includes the residual pollution of chemical fertilizers, pesticides, and agricultural film [64]. The study used the method of BaoYi and WeiGuo [65] for measuring the non-point source pollution: (i) the fertilizer loss is calculated by the amount of chemical fertilizer used multiplied by the fertilizer loss coefficient of 65%, (ii) the calculation method of pesticide invalid utilization is the pesticide use amount multiplied by the pesticide invalid utilization coefficient 50%, and (iii) the calculation method of agricultural film residue is the amount of agricultural film used multiplied by the correlation coefficient of agricultural film residue coefficient by 10%. Interestingly, the study used the entropy method to synthesize the amount of chemical fertilizer, pesticide, and agricultural film pollution into one integrated index to characterize agricultural non-point source pollution. The remaining missing data were filled by the weighted average value of adjacent areas and the fitted predicted value in different periods instead of the principle and method of the equal single value imputation method as recommended by Ferrari and Ozaki [66], Harrell [67], and Pažek and Rozman [68].

3.2.2. Variable Selection and Data Description of Spatial Spillover Effects

To explore the spatial spillover effect of agricultural green technology progress, the corresponding indicators selected in the study are as follows. (i) The per capita agricultural gross product (PGDP) is the embodiment of economic capacity, which can provide relevant supporting facilities, human resources, industrial foundation, technological foundation, and resources for the development of green technology [69,70]. In addition, regions with a better economy have more job opportunities, better infrastructure, and a better supervision system, forming the agglomeration effect of capital and labor, enhancing the level of innovation in the region, and eventually fostering environment-friendly technological progress [27,71]. Therefore, the study proposes Hypothesis 1 as:
H1. 
Per capita agricultural product has a positive impact on fostering environment-friendly technological progress.
(ii) Disposable income of farmers (PIC) is an important manifestation of the farmers’ economy. Farmers choose their production direction, production scale, and production method based on economic rationality and comparative analysis of costs and benefits, which affect the progress of agricultural green technology to a certain extent [72]. However, the current level of farmers’ disposable income is far from reaching the role of technological innovation [73]. Farmers or agricultural enterprises with higher incomes are often more likely to realize agricultural mechanization and modernization [74], which has a better effect on the local economy but has little effect on the progress of local agricultural green technology [16]. Therefore, the study proposes Hypothesis 2:
H2. 
Disposable income of farmers has a significant impact on the aspects of environment-friendly technological progress.
(iii) China’s agricultural terms of trade are deeply affected by agricultural price policies, which are mainly reflected in the changes in terms of trade caused by the reform of agricultural product price support policies and target price policies [65]. At the same time, the agricultural subsidy policy and its improvement also have a complex impact on the progress of agricultural technology. The agricultural price policy (PP) adopts the ratio (price) of the price index of agricultural products to the price index of agricultural means of production. The implementation of the minimum grain purchase price and the temporary purchase and storage policy has reduced the risk of farmers selling agricultural products [6], improved farmers’ enthusiasm for production, and increased the output of agricultural products significantly [70]. In addition, for a green environment, agricultural financial policies will change the relative prices of agricultural inputs and agricultural products, affect the production behavior of farmers, and thus have different impacts on resources and the environment [75]. For example, most of China’s agricultural subsidies are mainly price subsidies and are mainly used in the purchase and sale of agricultural products and agricultural production materials such as chemical fertilizers, agricultural films, and pesticides. Such subsidies support agricultural development to a certain extent, but at the same time seriously pollute soil and water resources, and even endanger the safety of agricultural products. Most agricultural subsidies are not directly financed but are indirectly subsidized through circulation channels. Therefore, the subsidy policy of chemical fertilizers and pesticides may make farmers increase the input of chemical elements, which relatively reduces the pollution to the environment and is not conducive to the progress of agricultural green technology. For the Fiscal Supporting Agriculture Policy (FIN), the indicator data are represented by the ratio of various fiscal expenditures for agriculture to total fiscal expenditures in each province. Therefore, the study proposes Hypothesis 3:
H3. 
Agricultural price policy (PP) and the financial support for agriculture (FIN) has a positive impact on environment-friendly technological progress.
(v) The article drews on the research of Feng et al. [76] and used the fiscal environmental protection expenditure per unit of the total output value of the planting industry to measure. Economical Environmental Regulation (EPR) refers to the government’s increased governance costs to solve actual and potential environmental problems, to encourage, regulate and guide the development of the environment in a positive direction. Administrative Environmental Regulation (CER) has a negative impact on the progress of agricultural green technology in the region and adjacent areas. However, Guyomard et al. [77] argued that environmental policies (e.g., emissions fees/taxes, trading permits) act as an external coercive factor that explicitly or implicitly makes products more expensive, thereby promoting technological innovation. The reason may be that only reasonable environmental regulations can make technological progress more green [78]. However, agricultural green technological progress measures technological development in the production process and is mostly associated with several issues such as pollution emissions. Therefore, only a reasonable response to administrative environmental regulation policies and the dual motives of maximizing profits can make green technologies tend to be green [79]. Based on the discussion, the study proposes Hypothesis 4:
H4. 
There is a positive relationship between Economical Environmental Regulation (CER) and environment-friendly technological progress.
(vi) Administrative Environmental Regulation (CER) refers to the normative documents formulated by the government to solve actual and potential environmental problems. Fiscal expenditures, subsidies, taxes, and investment in infrastructure construction are important means of implementing green agricultural policies which play an important role in regulating, promoting, and guiding the process of green technology [39]. Therefore, the study measured the command-type environmental regulation by the number of environmental regulation policies implemented by each province in that year [80]. Policy supervision is an opportunity to realize the transformation of the production mode to green production, and finally realize the coordinated development of the economy and environment [81,82]. On the contrary, due to the low level of technology and traditional production methods in economically underdeveloped areas, economic environmental regulation will reduce their economic scale. The overall agricultural economic operation of the region has been impacted, and some regions may even have relaxed law enforcement to avoid the adverse impact of environmental policies on the economy. Therefore, the current domestic imperative environmental policies are weak and cannot effectively promote the development of agricultural green technology progress. Thus, the study proposes Hypothesis 5:
H5. 
Administrative Environmental Regulation (CER) positively impacts environment-friendly technological progress.
Labor level refers to the labor achievements created by laborers in a certain period. The accelerated development of agricultural technology is the direct cause of the accelerated transfer of the rural labor force [83]. The combination of it and the relaxation of the household registration system can well promote the rural labor force and transfer and agricultural economic development [84]. From the perspective of human capital, the level of labor quality and quantity also affects technological progress to a certain extent [85]. Based on the research object, we measured the level of the labor force by the employees in the planting industry and assumed that more employees mean a greater impact on the progress of agricultural green technology. The degree of dependence on the original, production technology and production equipment is high, and extensive production is carried out by intensive use of unskilled and low-skilled labor. This forms the path dependence of the extensive development model of the input of tangible factors such as labor, which in turn hinders the progress of agricultural green technology and has a low-end lock-in effect. Therefore, in social development, creating more adequate employment opportunities, providing a more stable employment environment, and improving the social security system will help provide important guarantees for the green and high-quality development of agriculture [86,87]. Agricultural industry structure (PS) reflects the adjustment and change of the industrial structure of agricultural internal management. The adjustment of agricultural structure is affected by the price mechanism. If the production structure of agricultural products is adjusted and optimized according to resource and environmental constraints and market demand, the effective supply of agricultural products can be achieved, the total factor productivity of agriculture can be improved, and the progress of agricultural green technology can be promoted [88,89]. Therefore, the study selected the ratio of grain sown area to total crop sown area to measure agricultural industry structure. Based on the above assumptions, the study proposes Hypothesis 6:
H6. 
Labor level and Agricultural Industrial Structure have positively connected with environment-friendly technological progress.

3.3. Model Validation

Before measuring and analyzing the model, we should judge the reasonableness of the model. Commonly used test methods are the Lagrange multiplier test (LM test), likelihood ratio test (LR test), and Wald test (Wald test). The Lagrangian test value (LM test) and the robust Lagrangian test value (Robust LM) of the spatial lag model and the spatial error model under the economic weight matrix were positive at the 1% significance level. Meanwhile, the LR value and Wald test rejected the original hypothesis at the 1% significance level, indicating that the SDM model should be the best choice. The results are shown in Table 1.

4. Results

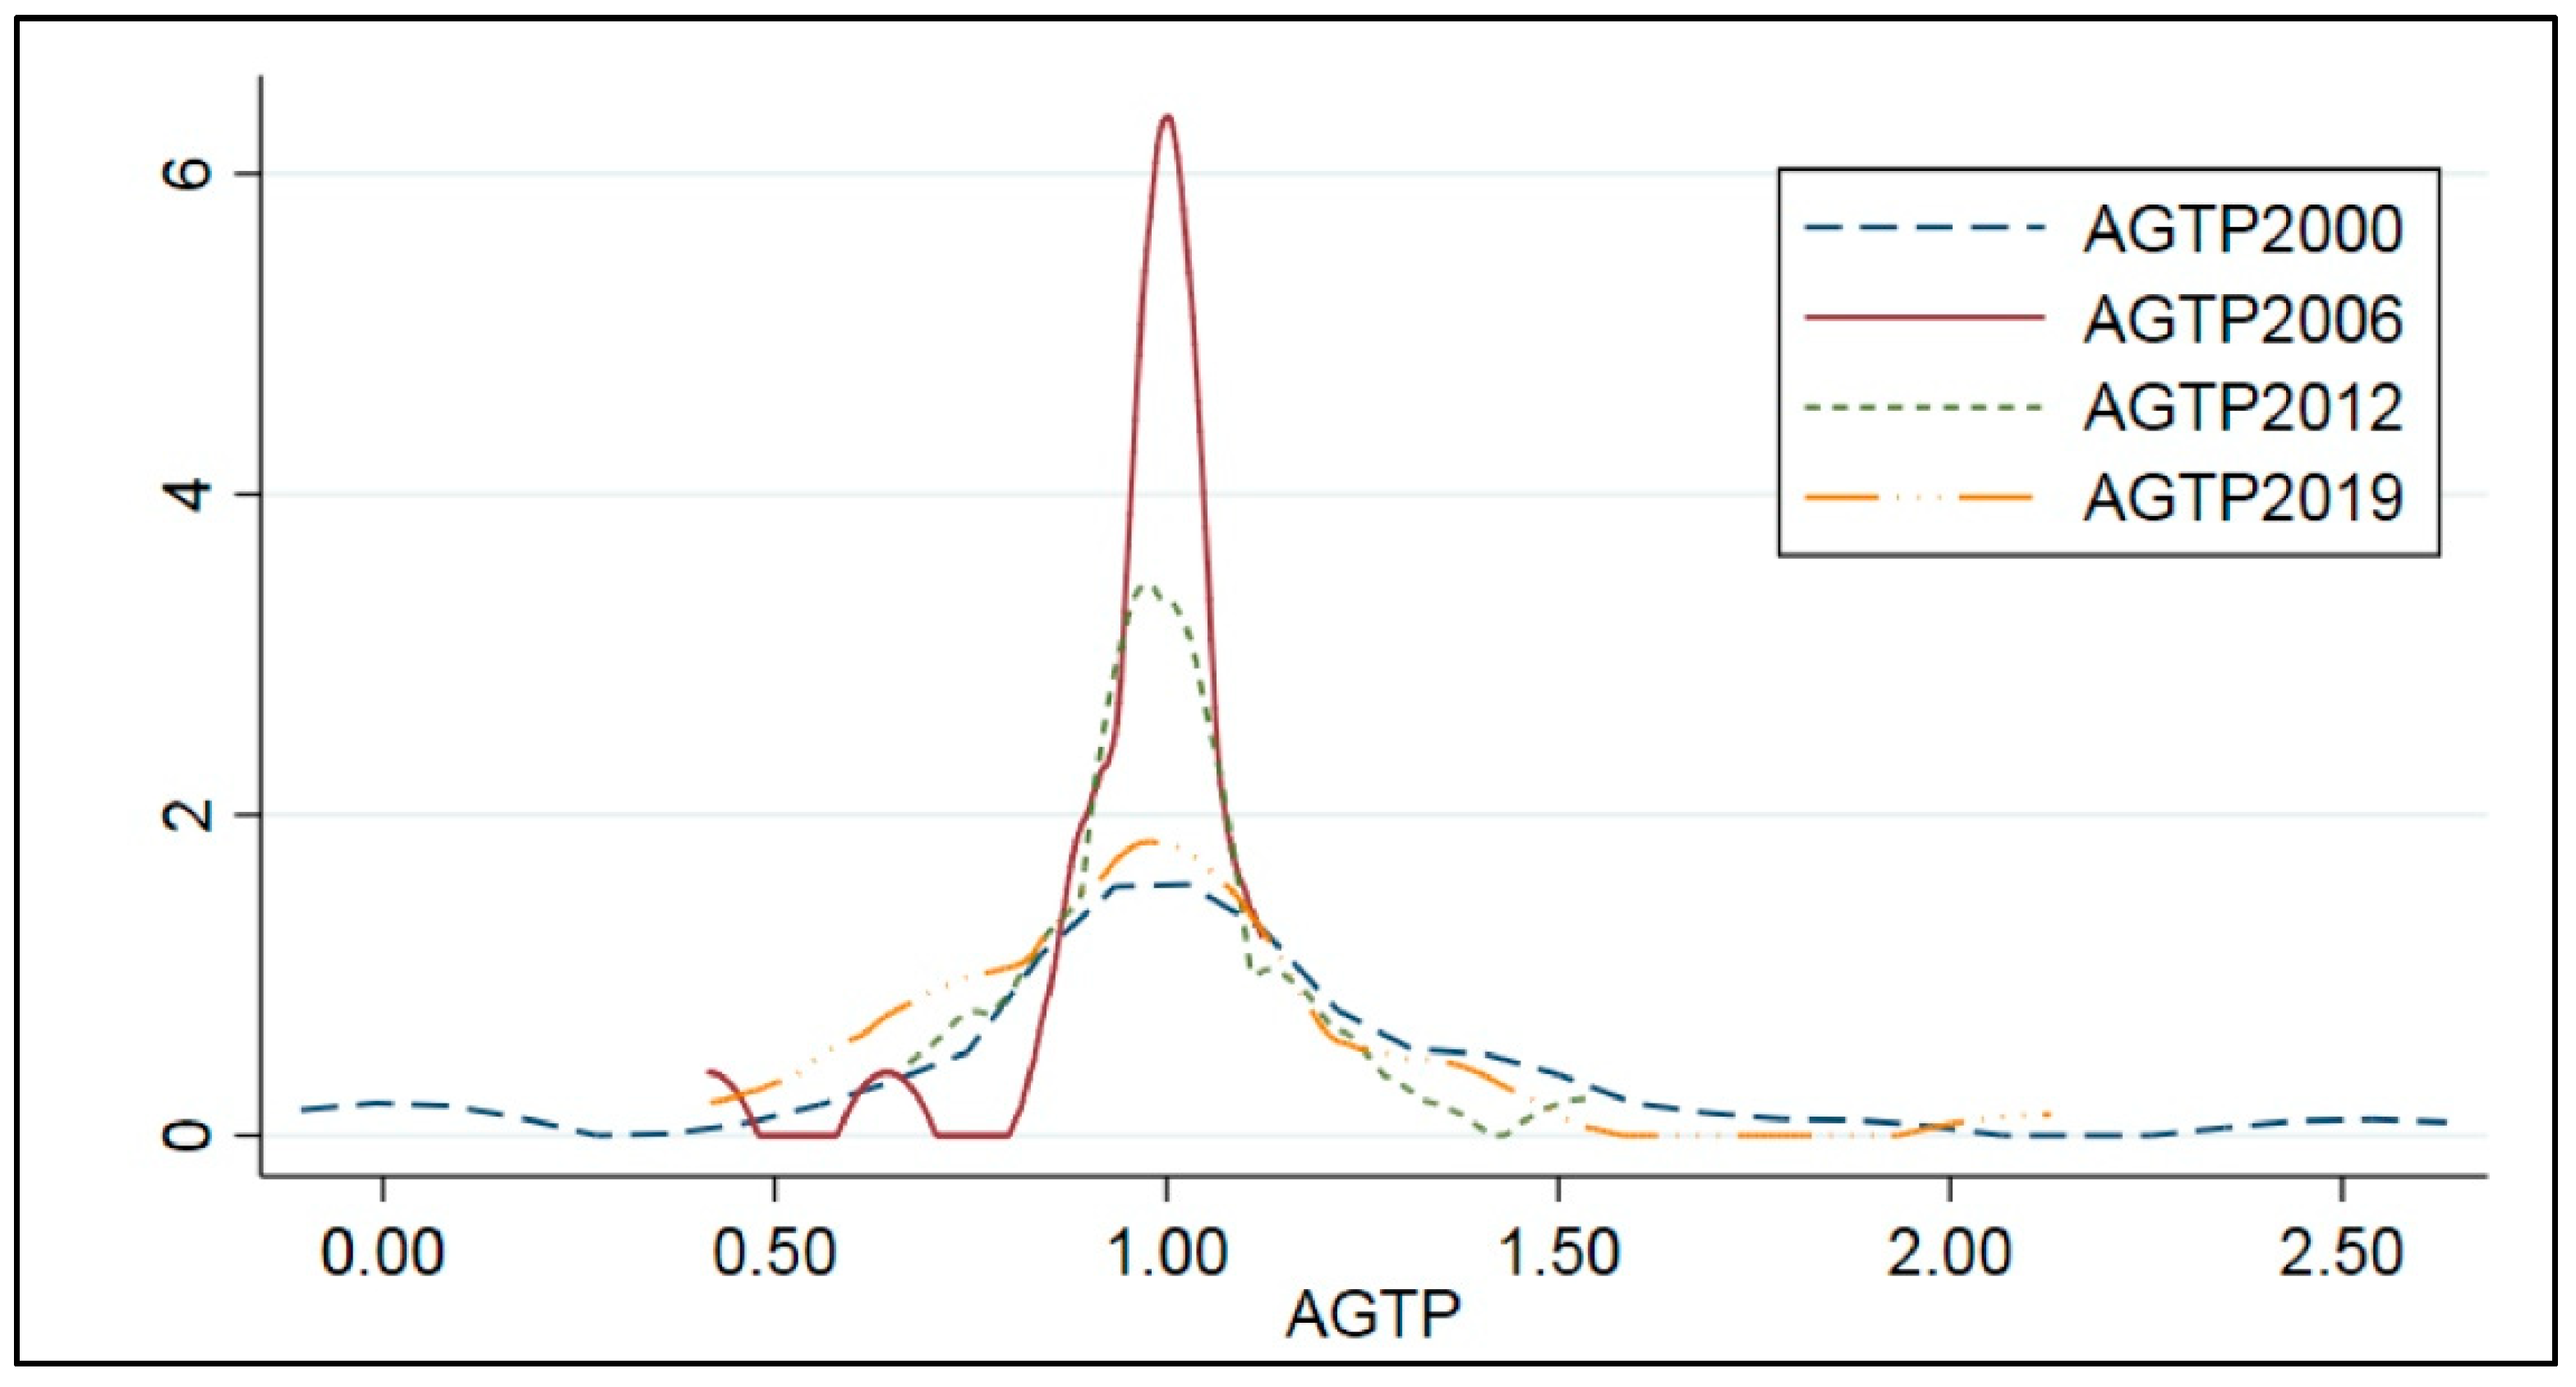
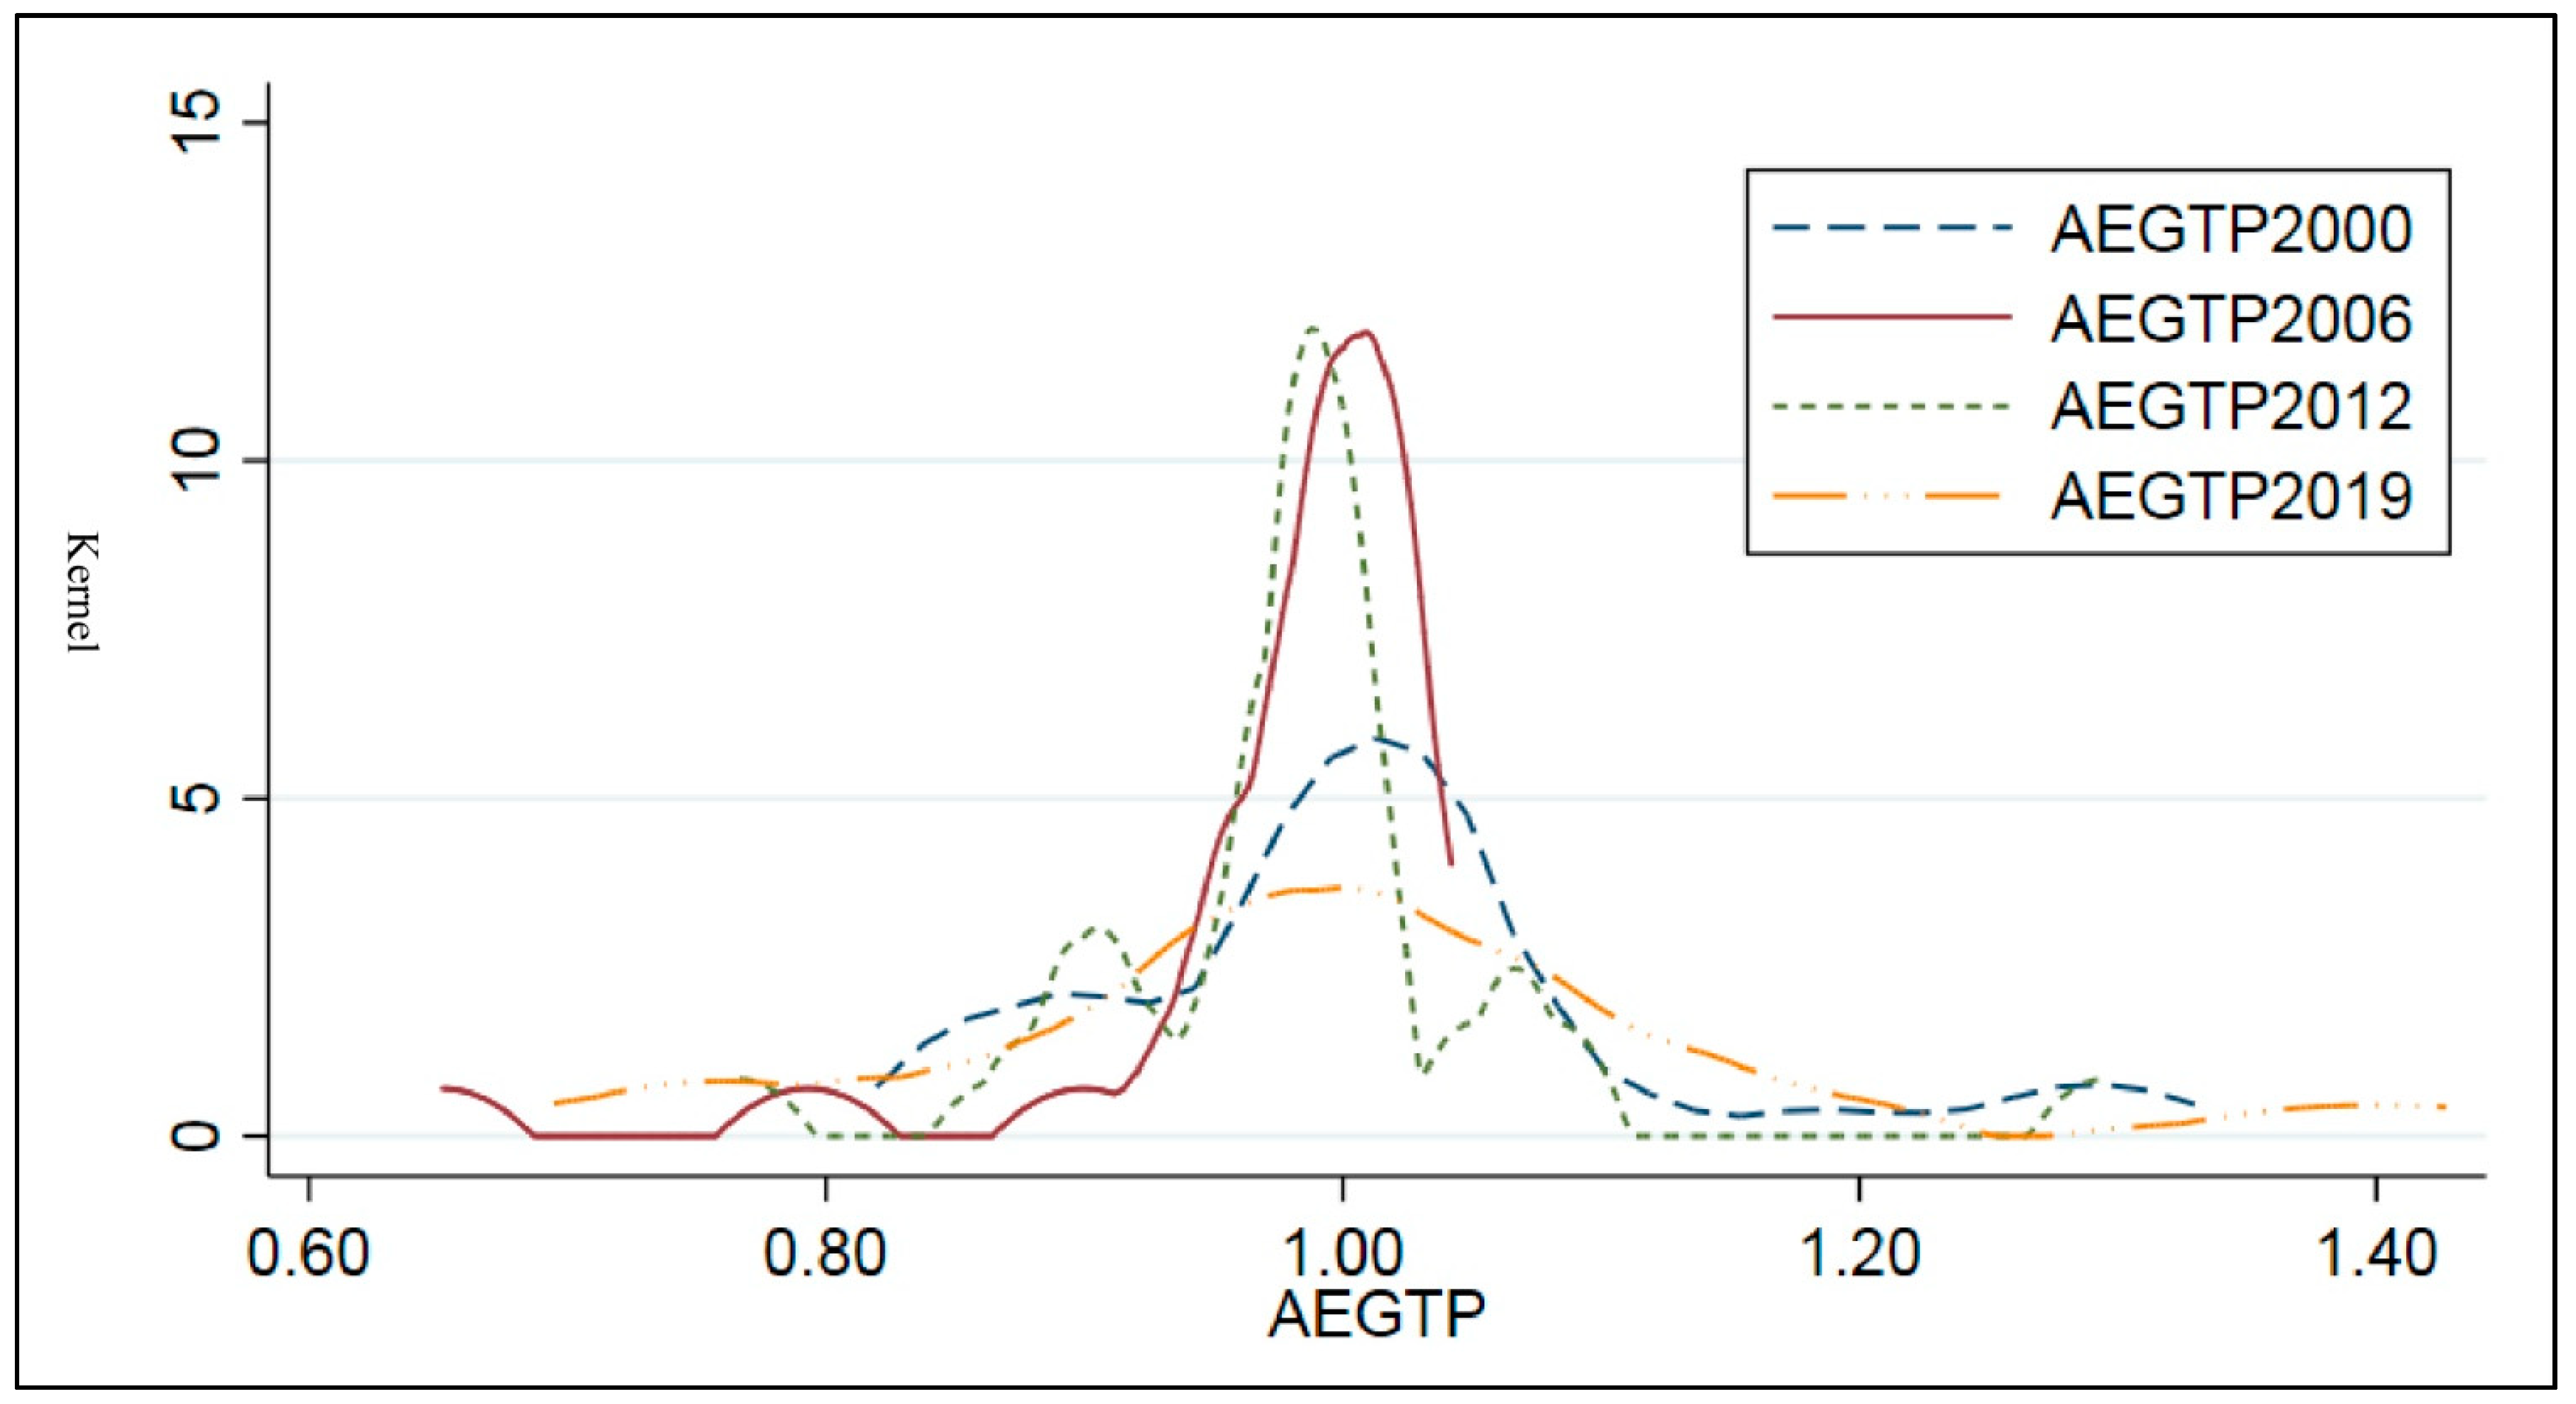
4.1. Time Dynamic Evolution of Agricultural Environmental Friendly Technology Progress

To intuitively understand the dynamic evolution characteristics of China’s agricultural environmentally friendly technology progress, this paper took 2000, 2006, 2012, and 2019 as the investigation years, and used the Kernel density estimation method to evaluate the agricultural environmentally friendly technology progress (AGTP) and agricultural pollution reduction (ACGTP) and the agricultural resource-saving (AEGTP) technology were analyzed, as shown in Figure 1, Figure 2 and Figure 3 respectively.
As can be seen from Figure 1, the dynamic evolution of agricultural environmental friendly technology progress (AGTP) in China’s 30 provinces (municipalities and autonomous regions) from 2000 to 2019 has the following characteristics. (i) From the perspective of location distribution, the center of the national overall distribution curve is to moved to the right, indicating that China’s Agricultural Environmental friendly technology Progress (AGTP) was on the rise during the study period. (ii) From the point of view of the distribution form, the peaks changed from double peaks in 2012 to single peaks in 2019, and the width of the main peak showed a transition characteristic of “broad peak-spike peak-broad peak”. Among them, from 2000 to 2006, there were mainly double peaks, the kurtosis decreased year by year, the peak shape changed from “broad peak” to “spiky peak”, and the horizontal span of the density distribution curve narrowed. This shows that the concentration of agricultural environmentally friendly technology progress (AGTP) increased and regional differences narrowed. From 2006 to 2019, it developed from a double peak to a single peak, the kurtosis decreased year by year, the peak shape changed from a “spiky peak” to a “broad peak”, and the horizontal span of the density distribution curve became wider. This means that the differences in the level of agricultural environmentally friendly technology progress in different regions were gradually widening. It may be that the technical level of some provinces was gradually “outdated”, resulting in a decrease in the concentration of the overall technical level and a widening of regional differences. The above analysis also shows that the level of China’s agricultural environmentally friendly technology progress (AGTP) has uneven regional development.
Figure 2, the dynamic evolution of agricultural resource-saving agricultural environmental friendly technology progress (AEGTP) in 30 provinces (municipalities and autonomous regions) in China from 2000 to 2019 has the following characteristics. (i) The center of the distribution curve experienced a slight “left–right shift” trend, indicating that China’s agricultural resource-saving agricultural environmentally friendly technology progress (AEGTP) at this stage showed a slight decline from 2000 to 2012 and a rapid recovery from 2000 to 2019. Among them, from 2000 to 2012, there was a slight trend of technological regression. This is similar to the study by Zhang et al. [80]. The possible reason is that because production technology is not reversible, changes in the production environment caused by factors such as agricultural policies and the natural environment are the key to the “regression” of technology. From 2012 to 2019, the rapid recovery of agricultural resource-saving environmental friendly technology progress (AEGTP) may be related to the country’s emphasis on establishing a long-term mechanism for agricultural green development and the release of the “Technical Guidelines for Agricultural Green Development (2018–2030)” in 2018 and other policies. (ii) From the perspective of distribution shape, the peaks changed from multi-peaks in 2000 to single-peaks in 2019, and the width of the main peak showed a transition characteristic of “broad peak-spike–broad peak”. Among them, from 2000 to 2006, it was mainly multi-peak, the kurtosis decreased year by year, the peak shape changed from “broad peak” to “sharp peak”, and the horizontal span of the density distribution curve narrowed, indicating the progress of agricultural resource-saving technology (AEGTP). The degree of concentration increased, and regional differences narrowed. From 2012 to 2019, it developed from multi-peak to single-peak, the kurtosis decreased year by year, the peak shape changed from a weak “spike” to a “broad peak”, and the horizontal span of the density distribution curve became wider. Like the Agricultural Environmental friendly technology Progress (AGTP), the differences in the level of the Agricultural resource-saving environmental friendly technology Progress (AEGTP) in different regions gradually widened. This also indirectly proves the importance of discussing the spatial spillover effect policy of agricultural environmentally friendly technology progress in different regions.
Figure 3 shows that the dynamic evolution of China’s pollution reduction agricultural environmental friendly technology progress (ACGTP) from 2000 to 2019 in China’s 30 provinces (municipalities and autonomous regions) has the following characteristics. (i) From the perspective of location distribution, the overall distribution curve of the country has the following characteristics: the center moved to the right, indicating that the agricultural pollution reduction environmental friendly technology progress (ACGTP) also showed an increasing trend during the study period. (ii) From the point of view of the distribution form, the wave peak changed from a single peak in 2000 to a double peak in 2019, and the width of the main peak showed a transition characteristic of “broad peak-spike peak-broad peak”. Among them, from 2000 to 2012, the single peak was dominant, the kurtosis decreased year by year, the peak shape changed from “broad peak” to “spiky peak”, and the horizontal span of the density distribution curve narrowed, indicating that the provinces are located in areas where in agricultural pollution-reducing environmentally friendly technology Progress (ACGTP) was high and concentration increased, and regional disparities narrowed. From 2012 to 2019, it developed from a single peak to a double peak, the kurtosis decreased year by year, the peak shape changed from a weak “spike” to a “broad peak”, and the horizontal span of the density distribution curve became wider. This means that the differences in the agricultural pollution reduction environmental friendly technology progress (ACGTP) in different regions are also gradually widening.
Figure 1, Figure 2 and Figure 3 show that the position distribution, peak shape, and kurtosis of Agricultural Environmental friendly technology Progress (AGTP) and pollution reduction agricultural environmental friendly technology Progress (ACGTP) are similar, which fully illustrates the existing agricultural environmental friendly technology in China. Technological progress mainly takes pollution abatement technology as the main goal. That is, the agricultural environmentally friendly technology mainly aims at minimizing the number of pollutants generated and harmlessly treating wastes. In addition, judging from the time dynamic evolution trend of agricultural environmental friendly technology progress (AGTP), agricultural resource-saving environmental friendly technology progress (AEGTP), and agricultural pollution reduction environmental friendly technology progress (ACGTP), there are regional imbalances in regional development. The regional gap is widening, and it is necessary to further analyze the spatial dynamic changes of agricultural environmentally friendly technology progress.

4.2. Subsection Evolution of Spatial Characteristics of Agricultural Environmental Friendly Technology Progress

To analyze the spatial correlation of agricultural environmental friendly technology progress, this paper measured the global Moran’s I index to test China’s agricultural environmental friendly technology progress (including agricultural resource-saving environmental friendly technology progress (AEGTP) and agricultural pollution reduction environmental friendly technology progress (ACGTP)). The spatial correlation and its evolution characteristics are shown in Table 2. As shown in Table 2, the global Moran’s I statistical value was partially significant under the confidence interval of 5% or 1% and both were greater than 0, indicating the progress of agricultural environmental friendly technology in China’s provinces, the agricultural resources saving environmental friendly technology (AEGTP), and the reduction of pollution (ACGTP). There is a positive spatial correlation between the agricultural environmentally friendly technology progress, and it has the characteristics of spatial aggregation. However, since all “Moran’s I” are prone to the mutual cancellation of positive and negative correlation regions, resulting in spatially uncorrelated results, further verification of local spatial autocorrelation is required.
The article used Open GeoDa to measure the local Moran’s I index to test the spatial correlation of China’s agricultural environmentally friendly technology progress as recommended by Anselin et al. [90]. The evolution characteristics of China’s agricultural environmentally friendly technology in 2000 and 2019 were drawn using ARCGIS software [91], and the degree of agglomeration was divided into four types: high–high, high–low, low–high, and low–low. The results are shown in Figure 4. From the local autocorrelation LISA agglomeration map of China’s agricultural environmental friendly technology progress index in 2000 and 2019 (Figure 4), it can be seen that the progress of agricultural environmental friendly technology in China’s 30 provinces (autonomous regions and municipalities) (including agricultural environmental friendly technological progress (AEGTP) and pollution-reduction-oriented agricultural environmental friendly technology progress (ACGTP) showed obvious disequilibrium in space.
Agricultural environmental friendly technology progress (AGTP) was obvious, and there was a Matthew effect. From 2000, it can be seen that the Northeast region showed high–high aggregation, indicating that the progress of agricultural environmental friendly technology in these regions is at a high level and is closely related to the development of environmentally friendly technology in the surrounding areas, and has strong radiation driving ability. North China and Northwest China are mainly characterized by low–low agglomeration, that is, the overall progress of agricultural environmentally friendly technology in this region is relatively low. The possible reason is that the extensive agricultural production methods in Northwest China have led to the concentration of non-green agricultural technologies in the region, while North China has superior resources and environment, but uses high machinery, high chemical fertilizers, and high pesticide production methods in pursuit of high agricultural output (Deng Yue et al., 2021), forming a cluster of agricultural non-green technologies. In addition, Hunan–Hubei–Guizhou–Jiangxi and other places are mainly characterized by low–high agglomeration, that is, the development of agricultural environmentally friendly technology in this region is in a state of scattered development, and the close relationship with the development of surrounding agricultural technology is low. It can be seen from 2019 that the high–high agglomeration shifted to the vicinity of the Yangtze River Delta, indicating that the economy has an important influence on the progress of agricultural environmental friendly technology (AGTP). Change is necessary. The low–high aggregation is mainly near Gan–Qing–Chuan, that is, the overall progress of agricultural environmental friendly technology in this area is relatively low, while the surrounding areas have a high level of agricultural environmental friendly technology progress. It is necessary to strengthen the communication between the surrounding areas and the region. Low–low areas are more scattered. This shows that the level of agricultural environmental friendly technology progress has been significantly improved at this stage, and the aggregation of low agricultural environmental friendly technology progress is not obvious.
The agglomeration characteristics of agricultural resource-saving environmentally friendly technology progress (AEGTP) are extremely obvious, and most provinces have similar agglomeration characteristics with neighboring provinces or provinces with similar economic development levels. Since 2000, it can be seen that high–high agglomeration is mainly concentrated in southern China. The main reason is that the technical advantages of this area can provide good technical support for the progress of agricultural environmentally friendly technology. Low–low agglomeration is mainly concentrated in the northern region. That is to say, in 2000, the ecological environment pressure of agricultural development and the dilemma of resource shortage faced by the northern region was relatively large, the overall level of agricultural green development was still relatively low, and the trend of increasing resource utilization intensity continued, and the problem of agricultural environmental pollution was still relatively prominent. This also makes the Sichuan–Shaanxi region with better agricultural resource endowments a high–low agglomeration area. In 2019, the agricultural resource-saving environmental friendly technology progress (AEGTP) was relatively scattered, and the high–high agglomeration areas were also transferred to the eastern coastal areas. The low–high agglomeration area is distributed in a chain-like manner in the coastal high–high agglomeration area, mainly due to the low development of its environmentally friendly agricultural technology and the influence of the coastal high–high agglomeration. This also shows that the advancement of agricultural environmental friendly technology in the eastern coastal areas has less driving effect on the low–high agglomeration area, especially the lack of a perfectly competitive agricultural economic system and the lack of sufficient scientific and technological support, so the progress of agricultural environmentally friendly technology in this area is evident, and the low–high agglomeration effect is significant.
However, the income level of residents is relatively low, and they pursue the growth of output and income while ignoring the protection of resources and the environment. The demand for natural resources (such as land resources, water resources, etc.) and production input factors (pesticides, fertilizers, etc.) in agriculture will be reduced. The local agricultural economic development mode is relatively extensive, and attention should be paid to the coordinated development of agricultural economic benefits and resource and environmental benefits. The high–low agglomeration is mainly in the Hunan–Guizhou–Guangxi region, and the low–high agglomeration region is mainly in the Gansu–Qinghai region. When the government formulates policies on agricultural green development, it can classify and deal with it according to the geographical characteristics of different provinces and cities, focusing on the development of “low–low” areas, strictly controlling “low–high” and “high–low” areas, and actively promoting the “high–high” areas to allow the continuous penetration of agricultural green development in provinces and cities, and improve the progress of China’s agricultural environmentally friendly technology.
The agglomeration characteristics of agricultural pollution reduction-oriented agricultural environmental friendly technology progress (ACGTP) are also more obvious. Since 2000, it can be seen that the high–high areas are distributed in a chain, including Shaanxi, Chongqing, Hunan, and Guangdong. This is mainly because, starting from the environmental protection of the production area and the treatment of the source, the local rural areas actively carry out environmental protection publicity activities, emphasize the importance of environmental protection, and implement corresponding pollutant emission reduction measures. The high–low agglomeration areas are mainly concentrated in the northwest region, and the low–high areas are concentrated in the Beijing–Tianjin–Hebei and Inner Mongolia regions, both of which are similar to the agricultural resource-saving environmental friendly technology progress (AEGTP). In 2019, it can be seen that low–low aggregation is still concentrated in the eastern coastal areas. The low–high agglomeration area is still in the Gan–Qing area. High–low clustering is mainly in the Hunan–Guizhou–Guangxi area. The reasons for these similarities in aggregation may be the same as those for agricultural resource-saving environmentally friendly technology progress (AEGTP). This also shows that the technological progress of pollutant emission reduction and the technological progress of agricultural resource conservation have a high degree of overlap. Of course, it may also be that the overall dimensions of agricultural environmental friendly technology, progress-oriented by national policy support, are the same, so the aggregation of the two types of agricultural environmental friendly technology progress is similar.

4.3. Subsection Spatial Spillover Effects of Agricultural Environmental Friendly Technology Progress

Since agricultural environmentally friendly technology progress has significant spatial autocorrelation, this paper used a spatial econometric model for estimation. Since the Hausman test values under the spatial weight matrix all significantly reject the null hypothesis of “random effects are better than fixed effects” at the 1% level, and the estimation results of spatial fixed effects under fixed time, fixed space, and double fixed effects are the best, this paper adopted the spatial Dobin model based on the fixed space and used the partial differential method of the SDM model to decompose the total effects under the three spatial weight matrices into direct effects and indirect effects. The results are shown in Table 3.
Overall, labor level (labor), per capita agricultural gross product (PGDP), and agricultural internal structure (PS) were all positive and significant to the progress of agricultural environmentally friendly technology and its different types. Agricultural price policy (PP), financial support policy (FIN), economic environmental regulation (EPR), and administrative environmental regulation (CER) had significant negative effects on the progress of agricultural environmentally friendly technology and its different types.

5. Discussions

Per capita agricultural product (PGDP) is an important reflection of the level of agricultural economic development [69,70]. The study found that PGDP has a positive impact on Agricultural Green Technology Progress (AGTP) and Abatement Agricultural Green Technology Progress (ACGTP), which has greatly contributed to the progress of green technology in the region. The outcomes are parallel with the study of Abdulai and Huffman [92] and Xue et al. [93]. In terms of economic development, the economic growth of a region can effectively promote innovation activities, provide external and internal support for innovation, create a good innovation environment, and strengthen information exchanges [94,95], which are conducive to the accumulation of technology, knowledge, and talents [96,97]. The study also found similar findings. Therefore, the government should pay full attention to strengthening the research, development, and promotion facilities of green production technology with market application value, which will become the core driving force for agriculture to improve profitability. At the same time, the per capita agricultural product (PGDP) does not play a significant role in the progress of agricultural material-saving agricultural green technology (AEGTP). However, the findings are quite different from the study of Milenković et al. [98]. The possible reason is that, in China, the growth of the agricultural economy will lead to new market demands, including changes in the consumption form and consumption structure of residents’ agricultural products, and new demands for farmers’ production technology. On this basis, the government should improve the labor productivity of agricultural enterprises, extends the support of agricultural cooperative organizations to improve the marginal efficiency of agricultural production factors, and promote the improvement of agricultural green technology progress.
The direct effect of farmers’ disposable income (PIC) on the progress of agricultural green technology is −0.632, and the indirect effect is 0.508, which reflects that farmers’ disposable income (PIC) has a significant negative effect on the progress of local agricultural green technology, while it has a significant positive effect on the progress of agricultural green technology in other places. This result different from the existing literature (Such as Chiputwa et al. [99], Anastasios et al. [100], and Akinola and Sofoluwe [101]). The study suggests that, when the economic level of a place is high, the surrounding area will be dominated by the local market demand, and there should be innovations in green technology.
Interestingly, the study found that agricultural price policy (PP) and fiscal support for agriculture (FIN) cannot support the progress of agricultural green technology. The reason may be that agriculture is fundamental and weak, and financial support for agriculture is used as a means of agricultural protection and support, but there is a serious shortage of financial support for agriculture in the development of agricultural environmental protection, which is not conducive to the progress of agricultural green technology. On the other hand, the agricultural price policy improves the agricultural trade conditions, reduces the risk of farmers’ sales, and increases the enthusiasm of farmers for production [102]. Subsidies for fine seeds and the purchase of agricultural machinery are conducive to the advancement of agricultural mechanization and the use and promotion of advanced agricultural machinery, but they do not support green ecology. This is parallel with the studies of Tang and Sun [103], Qin et al. [104], and Gao et al. [105]. Economical Environmental Regulation (EPR) has a positive but insignificant impact on the progress of agricultural green technology in the region. Economical environmental policies have a significant negative impact on the progress of agricultural green technology in adjacent areas. This is inconsistent with the results of He et al. [106] and Viaggi et al. [107]. The possible reason is that the study selected pollution control fees, which only control the pollution that has already been generated, and do not support the progress and innovation of green technology. On the other hand, economically developed regions have strong economic strength, and various command policies have a limited impact on them and are environmentally friendly. The outcome is supported by the study of Khan et al. [108] and Syed et al. [109].
The level of the labor force (labor) has a negative impact on the progress of agricultural green technology in the region. The possible reason is that the labor factor has become relatively cheap, and the price distortion has destroyed the market-oriented principle of allocating labor resources to farmers or agricultural enterprises with advanced agricultural green technology. In addition, the spatial spillover effect of labor level on the progress of agricultural green technology in adjacent areas is not significant. The main reason is that the surplus rural labor force is generally transferred to the urban sector to obtain more employment opportunities, so the impact on the progress of agricultural green technology in adjacent areas is not significant. However, the study of Ghana Conley and Christopher [110] found similar results. The direct effect of agricultural internal structure (PS) has a significant negative impact on the progress of agricultural green technology in the region. It shows that for every 1% increase in the internal structure of agriculture, the probability of agricultural green technology progress in local and non-local planting industries will decrease by 0.0373 and 0.2588, respectively. Compared with other agricultural planting industries such as forestry and animal husbandry, planting production will increase the input of carbon source products such as fertilizers, pesticides, and machinery [111,112]. With the popularization of agricultural mechanization and chemical products, ordinary farmers tend to have extensive management and have little demand for green technologies that require a lot of labor [113]. To obtain higher economic profits, the planting industry is more suitable for large-scale planting, which intensifies the extensive management mode of farmers and reduces the possibility of green technology for farmers. In addition, in the face of local technological progress, the mode of obtaining market profits based on chemistry and mechanization will adapt to the market model, which greatly reduces the adoption of green technology by foreign farmers and agricultural green technology progress [114].
In addition, from the perspective of type indicators, various influencing factors have a very significant impact on the progress of emission reduction-oriented agricultural green technology (ACGTP), but a less significant impact on the agricultural green technology progress of agricultural material-saving (AEGTP). Among them, farmers’ disposable income (PIC), agricultural price policy (PP), fiscal support policy (FIN), economic environmental regulation (EPR), etc. have no significant effect on agricultural material-saving agricultural green technology progress (AEGTP). When people’s living standards improve and their lifestyles change, they will inevitably have a certain degree of impact on the use of resources, and the overall development is an inverted U-shape. Only if the economic level reaches a certain level will these economic variables possibly have an impact on the progress of agricultural material-saving agricultural green technology (AEGTP). The outcomes are supported by the study of Marra et al. [115], Norton and Alwang [116], Schewe and Stuart [117] and Yang et al. [118].
It is an important issue to strengthen the protection of the rights and interests of local farmers in the innovation, promotion, and application of environmentally friendly technology, shorten the cycle of their research and development, application, and promotion areas, and continue to promote the benefits of surrounding areas. At the same time, the government should objectively view the negative impact of agricultural environmentally friendly technology progress on economic growth. It is destined to see the production capacity of green technologies catching up or even surpassing polluting technologies. There is a possibility of coordinated development between green production and economic growth. Vigorously promoting the transformation of technological progress from polluting technology to environmentally friendly technology will be beneficial to the healthy growth of China’s economy in the long run.

6. Conclusions

Measurement and dynamic monitoring of agricultural environmentally friendly technology progress have received widespread attention among general consumers, the government, academia, and international organizations. Therefore, analyzing its spatiotemporal dynamic evolution characteristics and influencing factors is the key to effectively formulating green development policies and implementing environmental protection measures. The article took the planting industry in the narrow sense as the research object and used the improved SBM model to measure the progress index of agricultural environmentally friendly technology. Moreover, we discussed its spatial spillover effect from three aspects: direct effect, indirect effect, and total effect. The main conclusions and implications are as follows:
(i)
From the perspective of time and space dimensions, China’s Agricultural Environmental friendly technology Progress (AGTP) showed an overall upward trend during the study period. Among them, from 2000 to 2012, the agricultural resource-saving technological progress (AEGTP) showed a slight technological regression trend, and from 2012 to 2019, it rebounded rapidly.
(ii)
From the perspective of type, the emission reduction environmental friendly technology progress (AEGTP) had similar spatial and temporal development patterns and wa only spatially similar to agricultural resource-saving technology progress. The distribution has a high degree of coincidence, and the aggregation area is more concentrated. Various influencing factors had a more significant impact on the emission reduction of agricultural environmentally friendly technology progress (ACGTP) than the agricultural resource-saving environmental friendly technology progress (AEGTP).
(iii)
From the perspective of the spatial spillover effect, labor level (labor), per capita agricultural gross product (PGDP), and agricultural internal structure (PS) were positively and significantly related to agricultural environmentally friendly technology progress and its different types. Agricultural price policy (PP), financial support policy (FIN), economic environmental regulation (EPR), and administrative environmental regulation (CER) had significant negative effects on the progress of agricultural environmentally friendly technology and its different types.
(iv)
However, as the aggregation characteristics of agricultural environmentally friendly technology progress are extremely obvious, most provinces with adjacent locations or provinces with similar economic development levels showed similar aggregation characteristics. High–high agglomeration areas are mainly concentrated in North China and East China, and low–low agglomeration areas are mainly concentrated in Northwest and Southwest China. Factors affecting the income level of rural residents include the selection of advanced agricultural production technology, the popularization and application, and the utilization efficiency of agricultural resources.
Though the study comprehensively explored the different types of environment-friendly technological progress within 30 provinces of China, portraying a broad view, there is still lots of room to explore the interesting topic within specific regions. Future studies should focus on smaller regions as every region has its unique characteristics and therefore it will them to grasp more accurate outcomes. Moreover, future studies should measure the impacts of control variables by integrating them into the core model. Finally, the model used in the study can be explored and tested by several other complex modeling tactics such as structural equation modeling (SEM) and composite structure diagram.

Author Contributions

Conceptualization, G.C. and Y.D.; methodology, Y.D.; software, A.S.; validation, G.C., Y.D. and Z.W.; formal analysis, G.C. and Y.D.; investigation, Y.D. and A.S.; resources, A.S.; data curation, G.C.; writing—original draft preparation, G.C., Y.D. and A.S.; writing—review and editing, G.C. and A.S.; visualization, Y.D.; supervision, Z.W.; project administration, A.S.; funding acquisition, Z.W. All authors have read and agreed to the published version of the manuscript.

Funding

This study was funded by the National Natural Science Foundation of China (Grant No: 42075172) and the Shaanxi Philosophy and Social Science Fund Project (Grant No: 2018S04).

Institutional Review Board Statement

The data used in the study comes from secondary sources; therefore the formal permission institutional review board statement can be waived.

Informed Consent Statement

The data used in the study comes from secondary sources; therefore the formal permission informed consent statement can be waived.

Data Availability Statement

The data will be provided upon request by the corresponding author.

Acknowledgments

The authors acknowledges the help and support of all the anonymous reviewers for their valuable input.

Conflicts of Interest

The authors declare no conflict of interest.

References

  1. Zhang, F.; Yue, Q.; Engel, B.A.; Guo, S.; Guo, P.; Li, X. A Bi-Level Multiobjective Stochastic Approach for Supporting Environment-Friendly Agricultural Planting Strategy Formulation. Sci. Total Environ. 2019, 693, 133593. [Google Scholar] [CrossRef] [PubMed]
  2. Pathak, J.; Rajneesh; Maurya, P.K.; Singh, S.P.; Häder, D.-P.; Sinha, R.P. Cyanobacterial Farming for Environment Friendly Sustainable Agriculture Practices: Innovations and Perspectives. Front. Environ. Sci. 2018, 6, 7. [Google Scholar] [CrossRef]
  3. Kim, N.-R.; Cho, Y.-S.; Kim, S.-A. Satisfaction and Recognition Level of Environment-Friendly Agricultural Products in Cheongju Area. Korean J. Community Nutr. 2011, 16, 75–85. [Google Scholar] [CrossRef]
  4. Liu, Y.; Liu, X.; Liu, Z. Effects of Climate Change on Paddy Expansion and Potential Adaption Strategies for Sustainable Agriculture Development across Northeast China. Appl. Geogr. 2022, 141, 102667. [Google Scholar] [CrossRef]
  5. Liu, D.; Zhu, X.; Wang, Y. China’s Agricultural Green Total Factor Productivity Based on Carbon Emission: An Analysis of Evolution Trend and Influencing Factors. J. Clean. Prod. 2021, 278, 123692. [Google Scholar] [CrossRef]
  6. Lefebvre, M.; Midler, E.; Bontems, P. Adoption of Environment-Friendly Agricultural Practices with Background Risk: Experimental Evidence. Environ. Resour. Econ. 2020, 76, 405–428. [Google Scholar] [CrossRef]
  7. Mao, K.; Jin, S.; Hu, Y.; Weeks, N.; Ye, L. Environmental Conservation or the Treadmill of Law: A Case Study of the Post-2014 Husbandry Waste Regulations in China. Int. J. Offender Ther. Comp. Criminol. 2022, 66, 296–326. [Google Scholar] [CrossRef]
  8. Chen, Z.; Sarkar, A.; Rahman, A.; Li, X.; Xia, X. Exploring the Drivers of Green Agricultural Development (GAD) in China: A Spatial Association Network Structure Approaches. Land Use Policy 2021, 112, 105827. [Google Scholar] [CrossRef]
  9. Chen, Z.; Sarkar, A.; Li, X.; Xia, X. Effects of Joint Adoption for Multiple Green Production Technologies on Welfare-a Survey of 650 Kiwi Growers in Shaanxi and Sichuan. Int. J. Clim. Change Strateg. Manag. 2021, 13, 229–249. [Google Scholar] [CrossRef]
  10. Wen, L.; Chatalova, L.; Gao, X.; Zhang, A. Reduction of Carbon Emissions through Resource-Saving and Environment-Friendly Regional Economic Integration: Evidence from Wuhan Metropolitan Area, China. Technol. Forecast. Soc. Change 2021, 166, 120590. [Google Scholar] [CrossRef]
  11. He, Z.; Zhang, R.; Wu, D. Evaluation of Resource-Saving and Environment-Friendly Agriculture Development Status Based on Hybrid Clustering; American Society of Civil Engineers: Chengdu, China, 26 April 2012; pp. 1962–1971. [Google Scholar] [CrossRef]
  12. Zhong, S.; Li, Y.; Li, J.; Yang, H. Measurement of Total Factor Productivity of Green Agriculture in China: Analysis of the Regional Differences Based on China. PLoS ONE 2021, 16, e0257239. [Google Scholar] [CrossRef] [PubMed]
  13. Huang, X.; Feng, C.; Qin, J.; Wang, X.; Zhang, T. Measuring China’s Agricultural Green Total Factor Productivity and Its Drivers during 1998–2019. Sci. Total Environ. 2022, 829, 154477. [Google Scholar] [CrossRef] [PubMed]
  14. Xu, X.; Huang, X.; Huang, J.; Gao, X.; Chen, L. Spatial-Temporal Characteristics of Agriculture Green Total Factor Productivity in China, 1998–2016: Based on More Sophisticated Calculations of Carbon Emissions. Int. J. Environ. Res. Public Health 2019, 16, 3932. [Google Scholar] [CrossRef] [PubMed] [Green Version]
  15. Chen, Y.; Miao, J.; Zhu, Z. Measuring Green Total Factor Productivity of China’s Agricultural Sector: A Three-Stage SBM-DEA Model with Non-Point Source Pollution and CO2 Emissions. J. Clean. Prod. 2021, 318, 128543. [Google Scholar] [CrossRef]
  16. Sarkar, A.; Wang, H.; Rahman, A.; Qian, L.; Memon, W.H. Evaluating the Roles of the Farmer’s Cooperative for Fostering Environmentally Friendly Production Technologies-a Case of Kiwi-Fruit Farmers in Meixian, China. J. Environ. Manag. 2022, 301, 113858. [Google Scholar] [CrossRef]
  17. Chi, Y.; Zhou, W.; Wang, Z.; Hu, Y.; Han, X. The Influence Paths of Agricultural Mechanization on Green Agricultural Development. Sustainability 2021, 13, 12984. [Google Scholar] [CrossRef]
  18. Xu, P.; Jin, Z.; Tang, H. Influence Paths and Spillover Effects of Agricultural Agglomeration on Agricultural Green Development. Sustainability 2022, 14, 6185. [Google Scholar] [CrossRef]
  19. Li, F.; Yang, P.; Zhang, K.; Yin, Y.; Zhang, Y.; Yin, C. The Influence of Smartphone Use on Conservation Agricultural Practice: Evidence from the Extension of Rice-Green Manure Rotation System in China. Sci. Total Environ. 2022, 813, 152555. [Google Scholar] [CrossRef]
  20. Han, H.; Ding, T.; Nie, L.; Hao, Z. Agricultural Eco-Efficiency Loss under Technology Heterogeneity given Regional Differences in China. J. Clean. Prod. 2020, 250, 119511. [Google Scholar] [CrossRef]
  21. Zhang, X.; Chen, H. Green Agricultural Development Based on Information Communication Technology and the Panel Space Measurement Model. Sustainability 2021, 13, 1147. [Google Scholar] [CrossRef]
  22. Chen, Z.; Li, X.; Xia, X. Measurement and Spatial Convergence Analysis of China’s Agricultural Green Development Index. Environ. Sci. Pollut. Res. 2021, 28, 19694–19709. [Google Scholar] [CrossRef] [PubMed]
  23. Sanders, R. A Market Road to Sustainable Agriculture? Ecological Agriculture, Green Food and Organic Agriculture in China. Dev. Change 2006, 37, 201–226. [Google Scholar] [CrossRef]
  24. Northrup, D.L.; Basso, B.; Wang, M.Q.; Morgan, C.L.S.; Benfey, P.N. Novel Technologies for Emission Reduction Complement Conservation Agriculture to Achieve Negative Emissions from Row-Crop Production. Proc. Natl. Acad. Sci. USA 2021, 118, e2022666118. [Google Scholar] [CrossRef] [PubMed]
  25. Yang, H.; Wang, X.; Bin, P. Agriculture Carbon-Emission Reduction and Changing Factors behind Agricultural Eco-Efficiency Growth in China. J. Clean. Prod. 2022, 334, 130193. [Google Scholar] [CrossRef]
  26. Wollenberg, E.; Richards, M.; Smith, P.; Havlík, P.; Obersteiner, M.; Tubiello, F.N.; Herold, M.; Gerber, P.; Carter, S.; Reisinger, A.; et al. Reducing Emissions from Agriculture to Meet the 2 °C Target. Glob. Change Biol. 2016, 22, 3859–3864. [Google Scholar] [CrossRef] [PubMed] [Green Version]
  27. Wang, G.; Liao, M.; Jiang, J. Research on Agricultural Carbon Emissions and Regional Carbon Emissions Reduction Strategies in China. Sustainability 2020, 12, 2627. [Google Scholar] [CrossRef] [Green Version]
  28. Fei, R.; Lin, B. Technology Gap and CO2 Emission Reduction Potential by Technical Efficiency Measures: A Meta-Frontier Modeling for the Chinese Agricultural Sector. Ecol. Indic. 2017, 73, 653–661. [Google Scholar] [CrossRef]
  29. Han, H.; Zhong, Z.; Guo, Y.; Xi, F.; Liu, S. Coupling and Decoupling Effects of Agricultural Carbon Emissions in China and Their Driving Factors. Environ. Sci. Pollut. Res. 2018, 25, 25280–25293. [Google Scholar] [CrossRef]
  30. Smith, P.; Martino, D.; Cai, Z.; Gwary, D.; Janzen, H.; Kumar, P.; McCarl, B.; Ogle, S.; O’Mara, F.; Rice, C.; et al. Policy and Technological Constraints to Implementation of Greenhouse Gas Mitigation Options in Agriculture. Agric. Ecosyst. Environ. 2007, 118, 6–28. [Google Scholar] [CrossRef]
  31. Tian, Y.; Zhang, J.; He, Y. Research on Spatial-Temporal Characteristics and Driving Factor of Agricultural Carbon Emissions in China. J. Integr. Agric. 2014, 13, 1393–1403. [Google Scholar] [CrossRef] [Green Version]
  32. Mostashari-Rad, F.; Nabavi-Pelesaraei, A.; Soheilifard, F.; Hosseini-Fashami, F.; Chau, K. Energy Optimization and Greenhouse Gas Emissions Mitigation for Agricultural and Horticultural Systems in Northern Iran. Energy 2019, 186, 115845. [Google Scholar] [CrossRef]
  33. Jantke, K.; Hartmann, M.J.; Rasche, L.; Blanz, B.; Schneider, U.A. Agricultural Greenhouse Gas Emissions: Knowledge and Positions of German Farmers. Land 2020, 9, 130. [Google Scholar] [CrossRef]
  34. Zhang, J.; Tian, H.; Shi, H.; Zhang, J.; Wang, X.; Pan, S.; Yang, J. Increased Greenhouse Gas Emissions Intensity of Major Croplands in China: Implications for Food Security and Climate Change Mitigation. Glob. Change Biol. 2020, 26, 6116–6133. [Google Scholar] [CrossRef] [PubMed]
  35. Rehman, A.; Ma, H.; Irfan, M.; Ahmad, M. Does Carbon Dioxide, Methane, Nitrous Oxide, and GHG Emissions Influence the Agriculture? Evidence from China. Environ. Sci. Pollut. Res. 2020, 27, 28768–28779. [Google Scholar] [CrossRef] [PubMed]
  36. Sikora, J.; Niemiec, M.; Szeląg-Sikora, A.; Gródek-Szostak, Z.; Kuboń, M.; Komorowska, M. The Impact of a Controlled-Release Fertilizer on Greenhouse Gas Emissions and the Efficiency of the Production of Chinese Cabbage. Energies 2020, 13, 2063. [Google Scholar] [CrossRef] [Green Version]
  37. Hu, Q.; Liu, T.; Jiang, S.; Cao, C.; Li, C.; Chen, B.; Liu, J. Combined Effects of Straw Returning and Chemical N Fertilization on Greenhouse Gas Emissions and Yield from Paddy Fields in Northwest Hubei Province, China. J. Soil Sci. Plant Nutr. 2020, 20, 392–406. [Google Scholar] [CrossRef]
  38. Xie, F.; Liu, Y.; Yang, M. Spatial Spillover Effect of Environmental Regulation on Regional Economic Growth. Environ. Dev. Sustain. 2022, 1–12. [Google Scholar] [CrossRef]
  39. Hamman, E.; Deane, F.; Kennedy, A.; Huggins, A.; Nay, Z. Environmental Regulation of Agriculture in Federal Systems of Government: The Case of Australia. Agronomy 2021, 11, 1478. [Google Scholar] [CrossRef]
  40. Farooq, M.S.; Riaz, S.; Abid, A.; Umer, T.; Zikria, Y.B. Role of IoT Technology in Agriculture: A Systematic Literature Review. Electronics 2020, 9, 319. [Google Scholar] [CrossRef] [Green Version]
  41. Xiong, K.; Kong, F.; Zhang, N.; Lei, N.; Sun, C. Analysis of the Factors Influencing Willingness to Pay and Payout Level for Ecological Environment Improvement of the Ganjiang River Basin. Sustainability 2018, 10, 2149. [Google Scholar] [CrossRef] [Green Version]
  42. Luo, L.; Qin, L.; Wang, Y.; Wang, Q. Environmentally-Friendly Agricultural Practices and Their Acceptance by Smallholder Farmers in China—A Case Study in Xinxiang County, Henan Province. Sci. Total Environ. 2016, 571, 737–743. [Google Scholar] [CrossRef]
  43. Mozzato, D.; Gatto, P.; Defrancesco, E.; Bortolini, L.; Pirotti, F.; Pisani, E.; Sartori, L. The Role of Factors Affecting the Adoption of Environmentally Friendly Farming Practices: Can Geographical Context and Time Explain the Differences Emerging from Literature? Sustainability 2018, 10, 3101. [Google Scholar] [CrossRef] [Green Version]
  44. Zhang, L.; Li, X.; Yu, J.; Yao, X. Toward Cleaner Production: What Drives Farmers to Adopt Eco-Friendly Agricultural Production? J. Clean. Prod. 2018, 184, 550–558. [Google Scholar] [CrossRef]
  45. Li, J.; Chen, J.; Liu, H. Sustainable Agricultural Total Factor Productivity and Its Spatial Relationship with Urbanization in China. Sustainability 2021, 13, 6773. [Google Scholar] [CrossRef]
  46. Fang, L.; Hu, R.; Mao, H.; Chen, S. How Crop Insurance Influences Agricultural Green Total Factor Productivity: Evidence from Chinese Farmers. J. Clean. Prod. 2021, 321, 128977. [Google Scholar] [CrossRef]
  47. Lansink, A.O.; Reinhard, S. Investigating Technical Efficiency and Potential Technological Change in Dutch Pig Farming. Agric. Syst. 2004, 79, 353–367. [Google Scholar] [CrossRef]
  48. Sherlund, S.M.; Barrett, C.B.; Adesina, A.A. Smallholder Technical Efficiency Controlling for Environmental Production Conditions. J. Dev. Econ. 2002, 69, 85–101. [Google Scholar] [CrossRef]
  49. van der Werf, E. Production Functions for Climate Policy Modeling: An Empirical Analysis. Energy Econ. 2008, 30, 2964–2979. [Google Scholar] [CrossRef] [Green Version]
  50. Zhuang, X.; Li, Z.; Zheng, R.; Na, S.; Zhou, Y. Research on the Efficiency and Improvement of Rural Development in China: Based on Two-Stage Network SBM Model. Sustainability 2021, 13, 2914. [Google Scholar] [CrossRef]
  51. Pang, J.; Chen, X.; Zhang, Z.; Li, H. Measuring Eco-Efficiency of Agriculture in China. Sustainability 2016, 8, 398. [Google Scholar] [CrossRef] [Green Version]
  52. Long, X.; Yu, H.; Sun, M.; Wang, X.-C.; Klemeš, J.J.; Xie, W.; Wang, C.; Li, W.; Wang, Y. Sustainability Evaluation Based on the Three-Dimensional Ecological Footprint and Human Development Index: A Case Study on the Four Island Regions in China. J. Environ. Manag. 2020, 265, 110509. [Google Scholar] [CrossRef]
  53. Doudou, B.; Yuanping, F. Global Productive Service Agglomeration Development Experience and Inspiration. Planners 2015, 7, 112–129. [Google Scholar]
  54. Hu, Y.; Wang, F.; Guin, C.; Zhu, H. A Spatio-Temporal Kernel Density Estimation Framework for Predictive Crime Hotspot Mapping and Evaluation. Appl. Geogr. 2018, 99, 89–97. [Google Scholar] [CrossRef]
  55. Shi, Z.; Huang, H.; Wu, Y.; Chiu, Y.-H.; Qin, S. Climate Change Impacts on Agricultural Production and Crop Disaster Area in China. Int. J. Environ. Res. Public. Health 2020, 17, 4792. [Google Scholar] [CrossRef] [PubMed]
  56. Kloog, I.; Haim, A.; Portnov, B.A. Using Kernel Density Function as an Urban Analysis Tool: Investigating the Association between Nightlight Exposure and the Incidence of Breast Cancer in Haifa, Israel. Comput. Environ. Urban Syst. 2009, 33, 55–63. [Google Scholar] [CrossRef]
  57. Ji, Y.; Li, Y.; Yao, N.; Biswas, A.; Chen, X.; Li, L.; Pulatov, A.; Liu, F. Multivariate Global Agricultural Drought Frequency Analysis Using Kernel Density Estimation. Ecol. Eng. 2022, 177, 106550. [Google Scholar] [CrossRef]
  58. Ping, J.L.; Green, C.J.; Zartman, R.E.; Bronson, K.F. Exploring Spatial Dependence of Cotton Yield Using Global and Local Autocorrelation Statistics. Field Crops Res. 2004, 89, 219–236. [Google Scholar] [CrossRef]
  59. Gao, C.; Feng, Y.; Tong, X.; Lei, Z.; Chen, S.; Zhai, S. Modeling Urban Growth Using Spatially Heterogeneous Cellular Automata Models: Comparison of Spatial Lag, Spatial Error and GWR. Comput. Environ. Urban Syst. 2020, 81, 101459. [Google Scholar] [CrossRef]
  60. Cho, S.-H.; Lambert, D.M.; Chen, Z. Geographically Weighted Regression Bandwidth Selection and Spatial Autocorrelation: An Empirical Example Using Chinese Agriculture Data. Appl. Econ. Lett. 2010, 17, 767–772. [Google Scholar] [CrossRef]
  61. Zhang, S.; Wang, S.; Yuan, L.; Liu, X.; Gong, B. The Impact of Epidemics on Agricultural Production and Forecast of COVID-19. China Agric. Econ. Rev. 2020, 12, 409–425. [Google Scholar] [CrossRef]
  62. Yin, Z.; Wu, J. Spatial Dependence Evaluation of Agricultural Technical Efficiency—Based on the Stochastic Frontier and Spatial Econometric Model. Sustainability 2021, 13, 2708. [Google Scholar] [CrossRef]
  63. LeSage, J.; Pace, R.K. Introduction to Spatial Econometrics; Chapman and Hall/CRC: New York, NY, USA, 2009; ISBN 0-429-13808-3. [Google Scholar]
  64. DOSSKEY, M.G. Setting Priorities for Research on Pollution Reduction Functions of Agricultural Buffers. Environ. Manag. 2002, 30, 0641–0650. [Google Scholar] [CrossRef] [PubMed]
  65. BaoYi, W.; WeiGuo, Z. Cross-provincial differences in determinants of agricultural eco-efficiency in China: An analysis based on panel data from 31 provinces in 1996–2015. China Rural Econ. 2018, 1, 1–15. [Google Scholar]
  66. Ferrari, G.T.; Ozaki, V. Missing Data Imputation of Climate Datasets: Implications to Modeling Extreme Drought Events. Rev. Bras. Meteorol. 2014, 29, 21–28. [Google Scholar] [CrossRef]
  67. Harrell, F.E. Missing Data. In Regression Modeling Strategies: With Applications to Linear Models, Logistic and Ordinal Regression, and Survival Analysis; Springer Series in Statistics; Springer International Publishing: Cham, Switzerland, 2015; pp. 45–61. ISBN 978-3-319-19425-7. [Google Scholar]
  68. Pažek, K.; Rozman, Č. Decision Making Under Conditions of Uncertainty in Agriculture: A Case Study of Oil Crops. Poljoprivreda 2009, 15, 45–50. [Google Scholar]
  69. Balmford, A.; Green, R.E.; Scharlemann, J.P.W. Sparing Land for Nature: Exploring the Potential Impact of Changes in Agricultural Yield on the Area Needed for Crop Production. Glob. Change Biol. 2005, 11, 1594–1605. [Google Scholar] [CrossRef]
  70. Alene, A.D.; Manyong, V.M. Farmer-to-Farmer Technology Diffusion and Yield Variation among Adopters: The Case of Improved Cowpea in Northern Nigeria. Agric. Econ. 2006, 35, 203–211. [Google Scholar] [CrossRef]
  71. Wang, B.; Sun, Y.; Wang, Z. Agglomeration Effect of CO2 Emissions and Emissions Reduction Effect of Technology: A Spatial Econometric Perspective Based on China’s Province-Level Data. J. Clean. Prod. 2018, 204, 96–106. [Google Scholar] [CrossRef]
  72. Adnan, N.; Nordin, S.M.; Rahman, I.; Noor, A. The Effects of Knowledge Transfer on Farmers Decision Making toward Sustainable Agriculture Practices: In View of Green Fertilizer Technology. World J. Sci. Technol. Sustain. Dev. 2018, 15, 98–115. [Google Scholar] [CrossRef]
  73. Laborte, A.G.; Schipper, R.A.; Van Ittersum, M.K.; Van Den Berg, M.M.; Van Keulen, H.; Prins, A.G.; Hossain, M. Farmers’ Welfare, Food Production and the Environment: A Model-Based Assessment of the Effects of New Technologies in the Northern Philippines. NJAS Wagening J. Life Sci. 2009, 56, 345–373. [Google Scholar] [CrossRef] [Green Version]
  74. Dube, K.; Sigauke, E. Irrigation Technology for Smallholder Farmers: A Strategy for Achieving Household Food Security in Lower Gweru Zimbabwe. S. Afr. J. Agric. Ext. 2015, 43, 1–11. [Google Scholar] [CrossRef]
  75. Rigby, D.; Cáceres, D. Organic Farming and the Sustainability of Agricultural Systems. Agric. Syst. 2001, 68, 21–40. [Google Scholar] [CrossRef]
  76. Feng, Y.; Wang, X.; Du, W.; Wu, H.; Wang, J. Effects of Environmental Regulation and FDI on Urban Innovation in China: A Spatial Durbin Econometric Analysis. J. Clean. Prod. 2019, 235, 210–224. [Google Scholar] [CrossRef]
  77. Guyomard, H.; Bouamra-Mechemache, Z.; Chatellier, V.; Delaby, L.; Détang-Dessendre, C.; Peyraud, J.-L.; Réquillart, V. Review: Why and How to Regulate Animal Production and Consumption: The Case of the European Union. Animal 2021, 15, 100283. [Google Scholar] [CrossRef] [PubMed]
  78. Ghadiyali, T.R.; Kayasth, M.M. Contribution of Green Technology in Sustainable Development of Agriculture Sector. J. Environ. Res. Dev. 2012, 7, 590–596. [Google Scholar]
  79. Borsato, E.; Tarolli, P.; Marinello, F. Sustainable Patterns of Main Agricultural Products Combining Different Footprint Parameters. J. Clean. Prod. 2018, 179, 357–367. [Google Scholar] [CrossRef]
  80. Zhang, Y.; Ju, G.; Zhan, J. Farmers Using Insurance and Cooperatives to Manage Agricultural Risks: A Case Study of the Swine Industry in China. J. Integr. Agric. 2019, 18, 2910–2918. [Google Scholar] [CrossRef]
  81. Chu, L.K.; Le, N.T.M. Environmental Quality and the Role of Economic Policy Uncertainty, Economic Complexity, Renewable Energy, and Energy Intensity: The Case of G7 Countries. Environ. Sci. Pollut. Res. 2022, 29, 2866–2882. [Google Scholar] [CrossRef]
  82. Su, H.; Geng, Y.; Xia, X.-Q.; Wang, Q.-J. Economic Policy Uncertainty, Social Development, Political Regimes and Environmental Quality. Int. J. Environ. Res. Public Health 2022, 19, 2450. [Google Scholar] [CrossRef]
  83. Jansen, K. Labour, Livelihoods and the Quality of Life in Organic Agriculture in Europe. Biol. Agric. Hortic. 2000, 17, 247–278. [Google Scholar] [CrossRef] [Green Version]
  84. She, W.; Wu, Y.; Huang, H.; Chen, Z.; Cui, G.; Zheng, H.; Guan, C.; Chen, F. Integrative Analysis of Carbon Structure and Carbon Sink Function for Major Crop Production in China’s Typical Agriculture Regions. J. Clean. Prod. 2017, 162, 702–708. [Google Scholar] [CrossRef]
  85. Ye, C.; Ye, Q.; Shi, X.; Sun, Y. Technology Gap, Global Value Chain and Carbon Intensity: Evidence from Global Manufacturing Industries. Energy Policy 2020, 137, 111094. [Google Scholar] [CrossRef]
  86. Mundlak, Y.; Butzer, R.; Larson, D.F. Heterogeneous Technology and Panel Data: The Case of the Agricultural Production Function. J. Dev. Econ. 2012, 99, 139–149. [Google Scholar] [CrossRef] [Green Version]
  87. Cermeño, R.; Maddala, G.S.; Trueblood, M.A. Modeling Technology as a Dynamic Error Components Process: The Case of the Inter-country Agricultural Production Function. Econom. Rev. 2003, 22, 289–306. [Google Scholar] [CrossRef]
  88. Chavas, J.-P. Chapter 5 Structural Change in Agricultural Production: Economics, Technology and Policy. In Handbook of Agricultural Economics; Agricultural Production; Elsevier: Amsterdam, The Netherlands, 2001; Volume 1, pp. 263–285. [Google Scholar]
  89. Aliev, E.B.; Bandura, V.M.; Pryshliak, V.M.; Yaropud, V.M.; Trukhanska, O.O. Modeling of Mechanical and Technological Processes of the Agricultural Industry. INMATEH-Agric. Eng. 2018, 54, 95–104. [Google Scholar]
  90. Anselin, L.; Syabri, I.; Kho, Y. GeoDa: An Introduction to Spatial Data Analysis. In Handbook of Applied Spatial Analysis: Software Tools, Methods and Applications; Fischer, M.M., Getis, A., Eds.; Springer: Berlin/Heidelberg, Germany, 2010; pp. 73–89. ISBN 978-3-642-03647-7. [Google Scholar]
  91. Law, M.; Collins, A. Getting to Know ArcGIS; ESRI Press: Redlands, CA, USA, 2015; ISBN 1-58948-382-0. [Google Scholar]
  92. Abdulai, A.; Huffman, W.E. The Diffusion of New Agricultural Technologies: The Case of Crossbred-Cow Technology in Tanzania. Am. J. Agric. Econ. 2005, 87, 645–659. [Google Scholar] [CrossRef]
  93. Xue, L.; Hou, P.; Zhang, Z.; Shen, M.; Liu, F.; Yang, L. Application of Systematic Strategy for Agricultural Non-Point Source Pollution Control in Yangtze River Basin, China. Agric. Ecosyst. Environ. 2020, 304, 107148. [Google Scholar] [CrossRef]
  94. Self, S.; Grabowski, R. Economic Development and the Role of Agricultural Technology. Agric. Econ. 2007, 36, 395–404. [Google Scholar] [CrossRef] [Green Version]
  95. Magruder, J.R. An Assessment of Experimental Evidence on Agricultural Technology Adoption in Developing Countries. Annu. Rev. Resour. Econ. 2018, 10, 299–316. [Google Scholar] [CrossRef]
  96. Timmer, C.P. Chapter 29 Agriculture and Economic Development. In Handbook of Agricultural Economics; Elsevier: Amsterdam, The Netherlands, 2002; Volume 2, pp. 1487–1546. [Google Scholar]
  97. D’Costa, A.P. Compressed Capitalism and Development. Crit. Asian Stud. 2014, 46, 317–344. [Google Scholar] [CrossRef]
  98. Milenković, L.; Stanojević, J.; Cvetković, D.; Stanojević, L.; Lalević, D.; Šunić, L.; Fallik, E.; Ilić, Z.S. New Technology in Basil Production with High Essential Oil Yield and Quality. Ind. Crops Prod. 2019, 140, 111718. [Google Scholar] [CrossRef]
  99. Chiputwa, B.; Langyintuo, A.S.; Wall, P. Adoption of Conservation Agriculture Technologies by Smallholder Farmers in the Shamva District of Zimbabwe: A Tobit Application; Southern Agricultural Economics Association (SAEA): Birmingham, AB, USA, 2010. [Google Scholar]
  100. Anastasios, M.; Koutsouris, A.; Konstadinos, M. Information and Communication Technologies as Agricultural Extension Tools: A Survey among Farmers in West Macedonia, Greece. J. Agric. Educ. Ext. 2010, 16, 249–263. [Google Scholar] [CrossRef]
  101. Akinola, A.A.; Sofoluwe, N.A. Impact of Mulching Technology Adoption on Output and Net Return to Yam Farmers in Osun State, Nigeria. Agrekon 2012, 51, 75–92. [Google Scholar] [CrossRef]
  102. Zhao, Y.; Xiujuan, T. The Transition of State-peasants Relationship: From the Fiscal Perspective in Three Decades of Reform in China. China Agric. Econ. Rev. 2009, 1, 382–394. [Google Scholar] [CrossRef]
  103. Tang, L.; Sun, S. Fiscal Incentives, Financial Support for Agriculture, and Urban-Rural Inequality. Int. Rev. Financ. Anal. 2022, 80, 102057. [Google Scholar] [CrossRef]
  104. Qin, T.; Gu, X.; Tian, Z.; Deng, J. Comparison of Agriculture and Forestry Fiscal Subsidy Policies in China. J. Sustain. For. 2015, 34, 683–697. [Google Scholar] [CrossRef]
  105. Gao, Y.; Shu, Y.; Cao, H.; Zhou, S.; Shi, S. Fiscal Policy Dilemma in Resolving Agricultural Risks: Evidence from China’s Agricultural Insurance Subsidy Pilot. Int. J. Environ. Res. Public Health 2021, 18, 7577. [Google Scholar] [CrossRef]
  106. He, Q.; Deng, X.; Li, C.; Yan, Z.; Kong, F.; Qi, Y. The Green Paradox Puzzle: Fiscal Decentralisation, Environmental Regulation, and Agricultural Carbon Intensity in China. Environ. Sci. Pollut. Res. 2022, 1–20. [Google Scholar] [CrossRef]
  107. Viaggi, D.; Bartolini, F.; Raggi, M. Combining Linear Programming and Principal–Agent Models: An Example from Environmental Regulation in Agriculture. Environ. Model. Softw. 2009, 24, 703–710. [Google Scholar] [CrossRef]
  108. Khan, Y.; Hassan, T.; Kirikkaleli, D.; Xiuqin, Z.; Shukai, C. The Impact of Economic Policy Uncertainty on Carbon Emissions: Evaluating the Role of Foreign Capital Investment and Renewable Energy in East Asian Economies. Environ. Sci. Pollut. Res. 2022, 29, 18527–18545. [Google Scholar] [CrossRef]
  109. Syed, Q.R.; Bhowmik, R.; Adedoyin, F.F.; Alola, A.A.; Khalid, N. Do Economic Policy Uncertainty and Geopolitical Risk Surge CO2 Emissions? New Insights from Panel Quantile Regression Approach. Environ. Sci. Pollut. Res. 2022, 29, 27845–27861. [Google Scholar] [CrossRef] [PubMed]
  110. Conley, T.; Christopher, U. Social Learning Through Networks: The Adoption of New Agricultural Technologies in Ghana. Am. J. Agric. Econ. 2001, 83, 668–673. [Google Scholar] [CrossRef] [Green Version]
  111. Chen, Z.; Sarkar, A.; Hasan, A.K.; Li, X.; Xia, X. Evaluation of Farmers’ Ecological Cognition in Responses to Specialty Orchard Fruit Planting Behavior: Evidence in Shaanxi and Ningxia, China. Agriculture 2021, 11, 1056. [Google Scholar] [CrossRef]
  112. Baerenklau, K.A.; Knapp, K.C. Dynamics of Agricultural Technology Adoption: Age Structure, Reversibility, and Uncertainty. Am. J. Agric. Econ. 2007, 89, 190–201. [Google Scholar] [CrossRef]
  113. Jat, H.S.; Datta, A.; Choudhary, M.; Sharma, P.C.; Jat, M.L. Conservation Agriculture: Factors and Drivers of Adoption and Scalable Innovative Practices in Indo-Gangetic Plains of India—A Review. Int. J. Agric. Sustain. 2021, 19, 40–55. [Google Scholar] [CrossRef]
  114. Aggarwal, P.; Vyas, S.; Thornton, P.; Campbell, B.M.; Kropff, M. Importance of Considering Technology Growth in Impact Assessments of Climate Change on Agriculture. Glob. Food Secur. 2019, 23, 41–48. [Google Scholar] [CrossRef]
  115. Marra, M.; Pannell, D.J.; Abadi Ghadim, A. The Economics of Risk, Uncertainty and Learning in the Adoption of New Agricultural Technologies: Where Are We on the Learning Curve? Agric. Syst. 2003, 75, 215–234. [Google Scholar] [CrossRef]
  116. Norton, G.W.; Alwang, J. Changes in Agricultural Extension and Implications for Farmer Adoption of New Practices. Appl. Econ. Perspect. Policy 2020, 42, 8–20. [Google Scholar] [CrossRef]
  117. Schewe, R.L.; Stuart, D. Diversity in Agricultural Technology Adoption: How Are Automatic Milking Systems Used and to What End? Agric. Hum. Values 2015, 32, 199–213. [Google Scholar] [CrossRef]
  118. Yang, G.; Zha, D.; Zhang, C.; Chen, Q. Does Environment-Biased Technological Progress Reduce CO2 Emissions in APEC Economies? Evidence from Fossil and Clean Energy Consumption. Environ. Sci. Pollut. Res. 2020, 27, 20984–20999. [Google Scholar] [CrossRef]
Figure 1. Kernel density estimation of China’s Agricultural Environmental friendly technology Progress (AGTP).
Agriculture 12 01043 g001
Figure 2. Kernel density estimation of China’s resource-saving agricultural environmental friendly technology progress (AEGTP).
Agriculture 12 01043 g002
Figure 3. Kernel density estimation of China’s pollution-reducing agricultural environmental friendly technology progress (ACGTP).
Agriculture 12 01043 g003
Figure 4. LISA of China’s agricultural environmentally friendly technology progress in 2000 and 2019.
Agriculture 12 01043 g004
Table 1. LM, LR, and Wald test results.
ModelIndexAGTPAEGTPACGTP
SARLM39.691 ***54.134 ***63.117 ***
Robust LM103.136 ***39.710 ***126.750 ***
LR93.850 ***49.370 ***98.340 ***
Wald24.189 ***103.515 ***30.168 ***
SEMLM476.079 ***737.994 ***440.713 ***
Robust LM2070.075 ***811.531 ***1256.248 ***
LR90.270 ***49.067 ***92.340 ***
Wald31.936 ***37.380 ***36.776 ***
Note: *** represent the significance levels of 1%.
Table 2. Overall Moran’s I statistics of China’s agricultural environmentally friendly technology progress from 2000 to 2019.
YearsAGTPACGTPAEGTP
Moran’s IZ ValueMoran’s IZ ValueMoran’s IZ Value
2000−0.0100.2450.0791.106−0.043−0.085
2001−0.054−0.282−0.0300.057−0.169−1.244
20020.0200.598−0.045−0.1100.2442.105 **
2003−0.053−0.183−0.189−1.570−0.198−1.615
2004−0.0130.376−0.060−0.5360.0981.338
20050.0670.9620.0020.370−0.150−1.103
20060.0210.6050.0550.9280.0581.052
20070.2281.954 *−0.125−1.195−0.046−0.110
20080.0460.9470.1381.712 *−0.0180.204
2009−0.0190.214−0.0150.198−0.052−0.272
20100.2492.970 ***0.2022.332 **0.2202.610
2011−0.137−0.989−0.092−0.544−0.117−0.791
2012−0.168−1.273−0.065−0.2880.2652.340 **
20130.2322.666 ***0.0741.0440.2583.135 ***
2014−0.047−0.142−0.038−0.041−0.087−0.519
2015−0.0050.3110.0210.1310.0350.733
2016−0.055−0.248−0.069−0.457−0.097−0.665
2017−0.117−0.8470.0100.4640.1200.827
2018−0.047−0.119−0.0050.298−0.106−0.724
20190.0100.2450.0711.043−0.086−0.487
Note: *** p < 0.01, ** p < 0.05, * p < 0.1.
Table 3. SDM model under spatial fixation and its direct and indirect effects.
AGTPAEGTPACGTP
VariableDirect EffectIndirect EffectTotal EffectDirect EffectIndirect EffectTotal EffectDirect EffectIndirect EffectTotal Effect
PGDP0.2380.3450.583 ***−0.0030.0260.0240.2420.3170.559 ***
(0.145)(0.252)(0.223)(0.025)(0.040)(0.038)(0.148)(0.243)(0.211)
PIC−0.632 ***0.508 **−0.124−0.06930.0900.020−0.564 **0.420 *−0.144
(0.238)(0.220)(0.160)(0.075)(0.087)(0.045)(0.232)(0.218)(0.140)
PP0.762−1.509 ***−0.747−0.0410.0830.0420.807−1.593 ***−0.786 *
(0.545)(0.580)(0.468)(0.096)(0.120)(0.085)(0.515)(0.545)(0.442)
FIN0.153−0.346 **−0.193 **−0.060 **0.032−0.0290.214−0.377 ***−0.163 **
(0.139)(0.139)(0.088)(0.024)(0.036)(0.018)(0.135)(0.126)(0.081)
EPR0.013−0.214 **−0.202 **−0.009−0.016−0.0240.021−0.199 **−0.178 **
(0.032)(0.093)(0.082)(0.011)(0.021)(0.019)(0.030)(0.087)(0.077)
CER−0.001 *0.001−0.0000.001−0.001−0.000−0.001*0.001−0.001
(0.001)(0.002)(0.002)(0.001)(0.001)(0.001)(0.001)(0.002)(0.002)
labor0.437 ***−0.0040.434 *0.129 ***−0.172 ***−0.0430.311 **0.1720.483 **
(0.140)(0.237)(0.228)(0.032)(0.045)(0.049)(0.137)(0.225)(0.218)
PS−0.1111.0710.960*0.0480.1750.224 **−0.1650.8920.727
(0.400)(0.805)(0.528)(0.051)(0.124)(0.111)(0.374)(0.767)(0.507)
rho0.052 0.063 0.045
(0.056) (0.060) (0.061)
sigma2_e0.278 ** 0.008 *** 0.244 **
(0.111) (0.002) (0.106)
Number600 600 600
R20.004 0.015 0.004
Id30 30 30
Robust standard errors in parentheses. *** p < 0.01, ** p < 0.05, * p < 0.1.
Publisher’s Note: MDPI stays neutral with regard to jurisdictional claims in published maps and institutional affiliations.

