
Interactive Effects of Honeysuckle Planting and Biochar Amendment on Soil Structure and Hydraulic Properties of Hillslope Farmland
 ,
,  ,
,
Abstract
:1. Introduction
2. Materials and Methods
2.1. Study Area
2.2. Soil Sampling
2.3. Laboratory Analysis
2.3.1. Analysis of Soil Basic Properties
2.3.2. Soil Aggregate Size Distribution and Its Stability
2.3.3. Soil Hydraulic Properties
2.3.4. Characterization of Soil Pore System
2.4. Statistical Analysis
3. Results
3.1. Soil Basic Properties
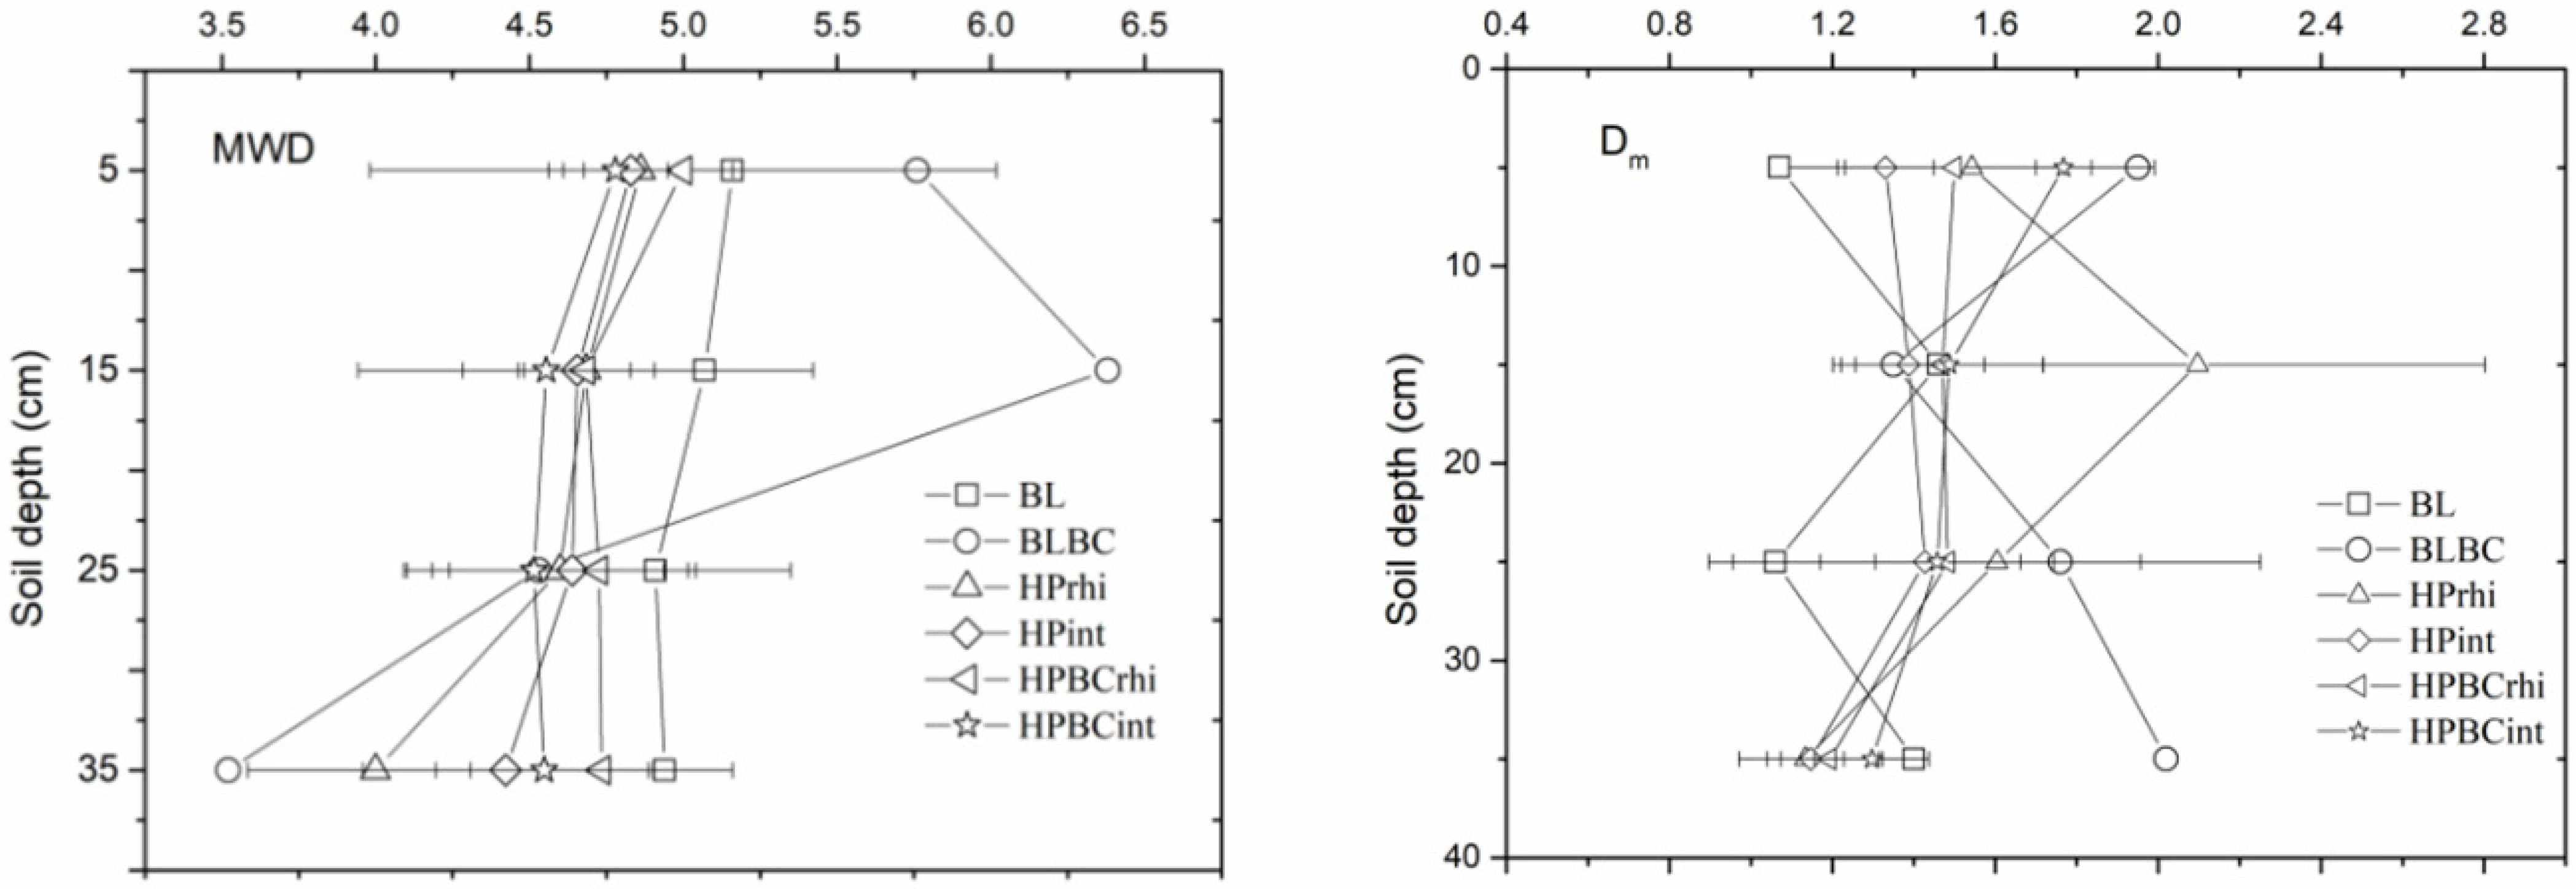
3.2. Soil Aggregate Size Distribution and Its Stability
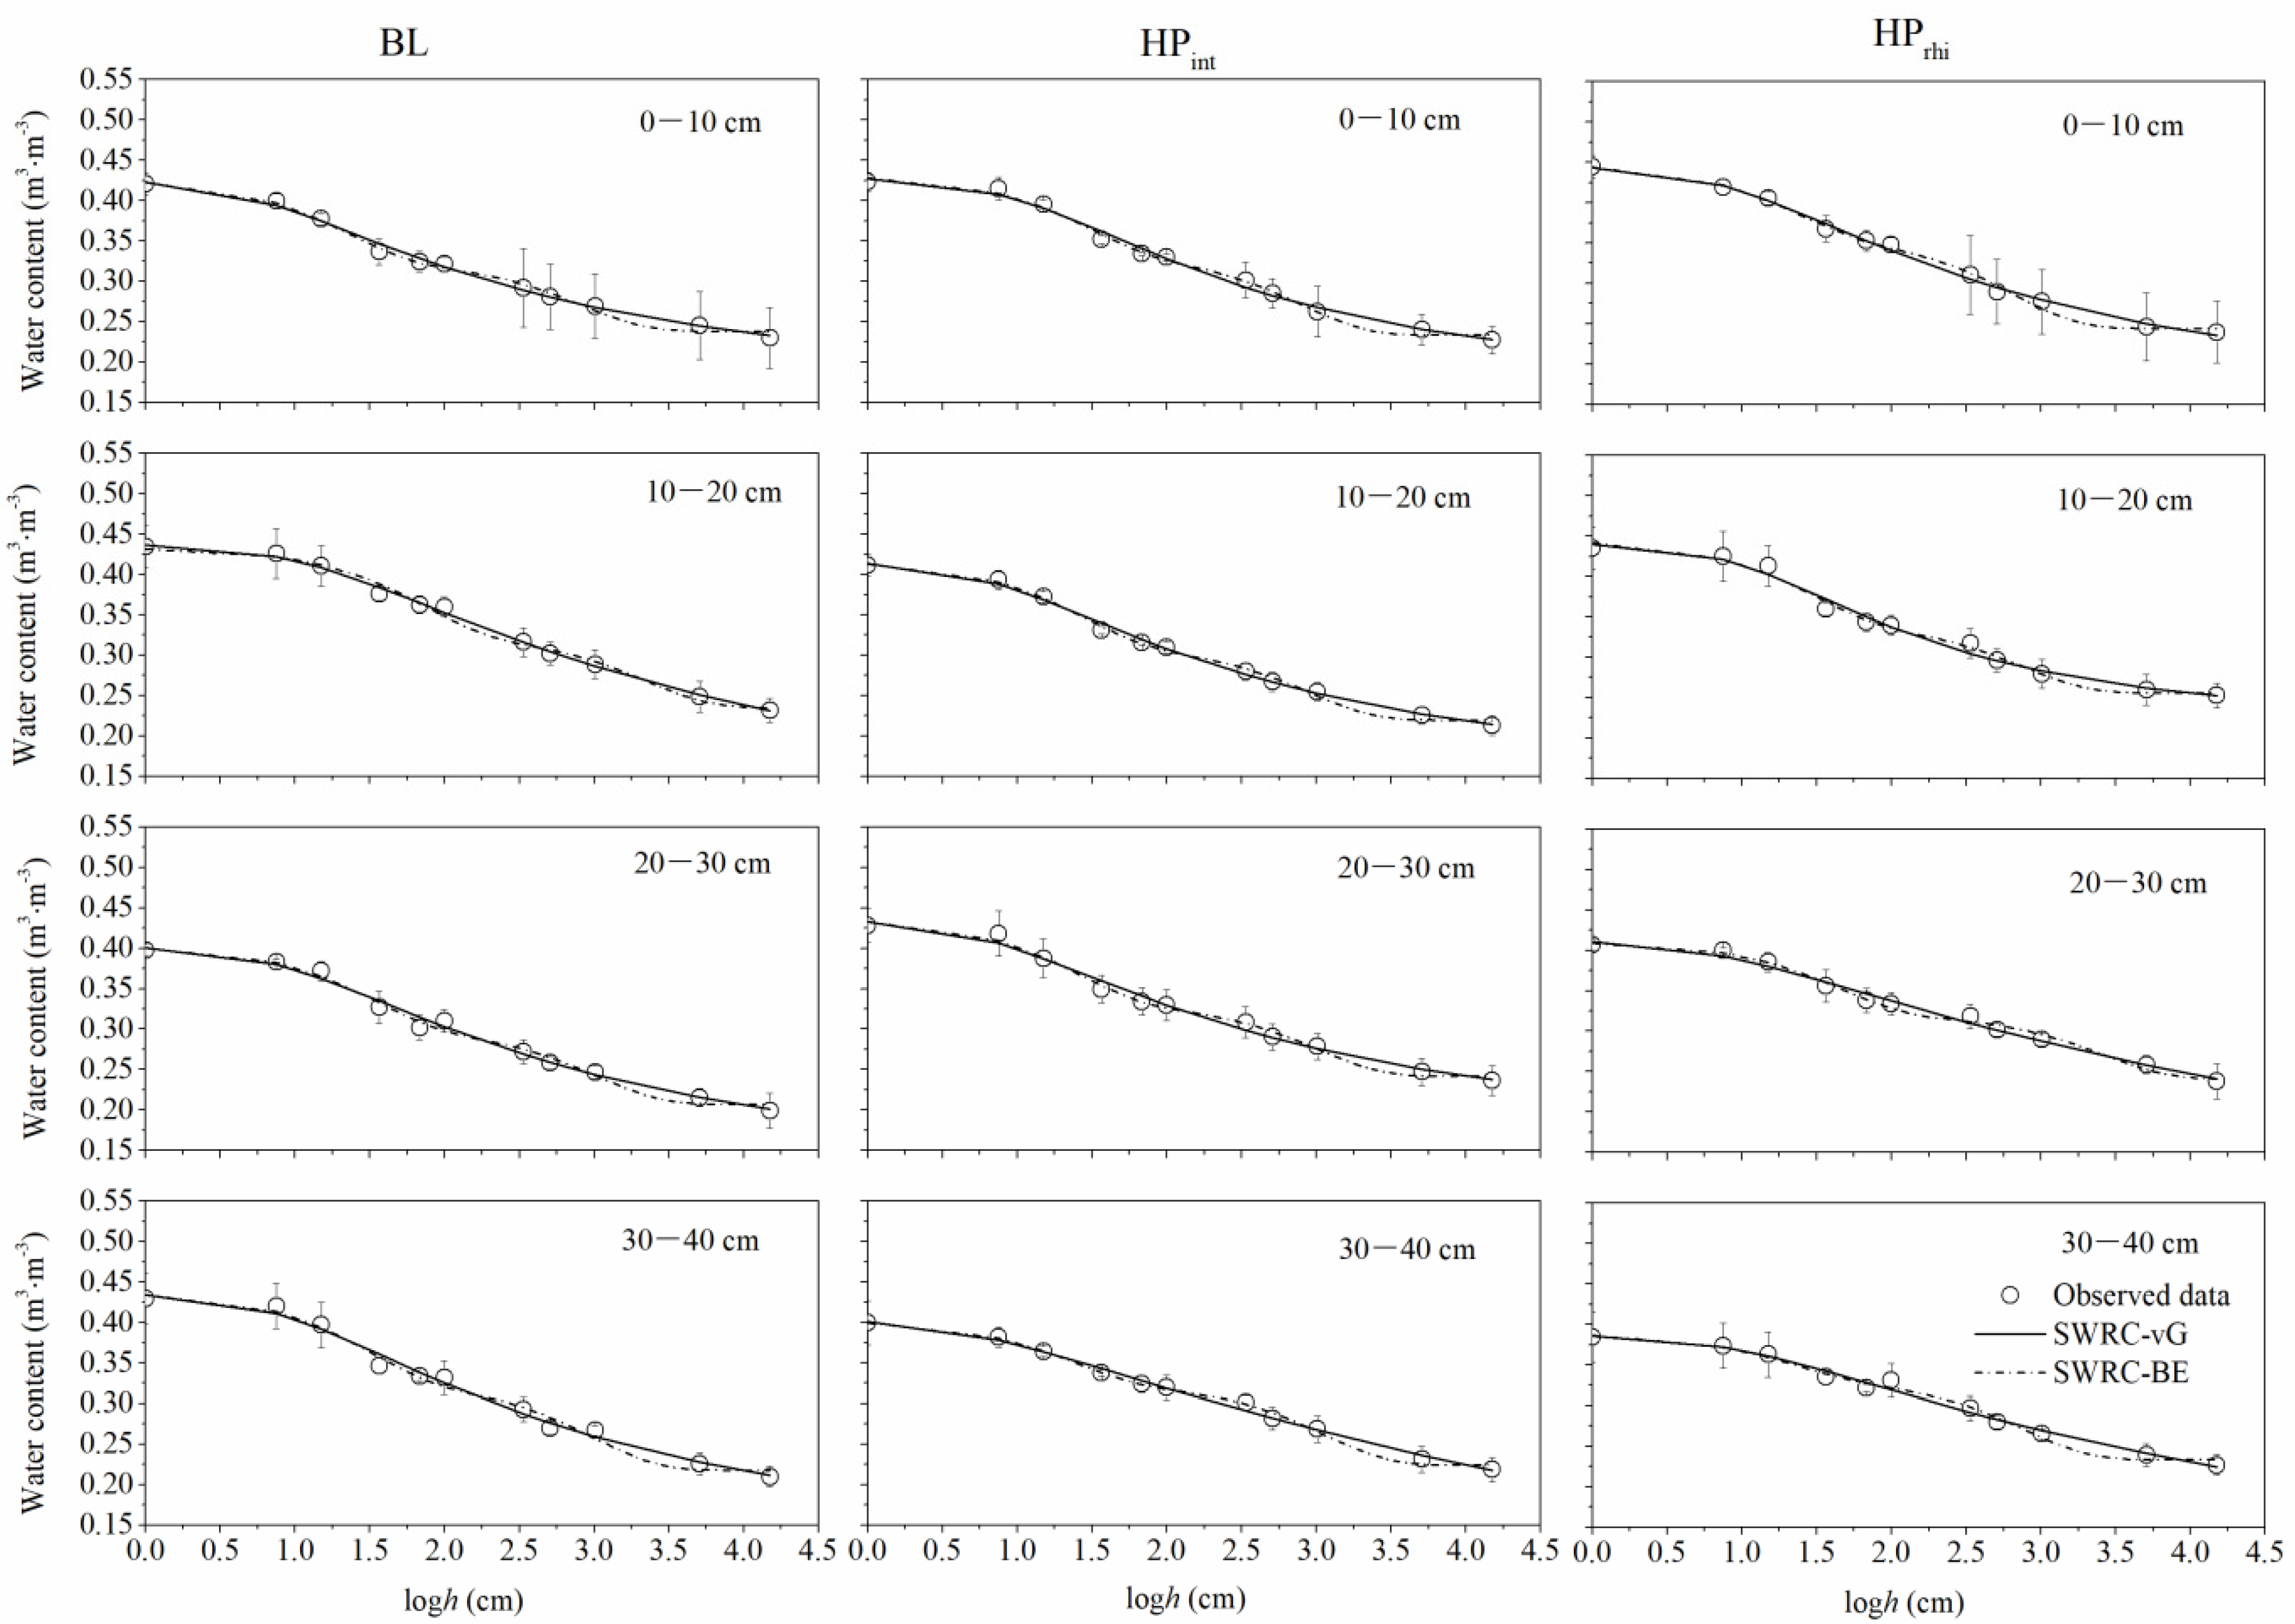
3.3. Soil Water Retention Curve (SWRC) Estimated by vG and BE Models
3.4. Soil Pore Distribution Estimated by SWRC
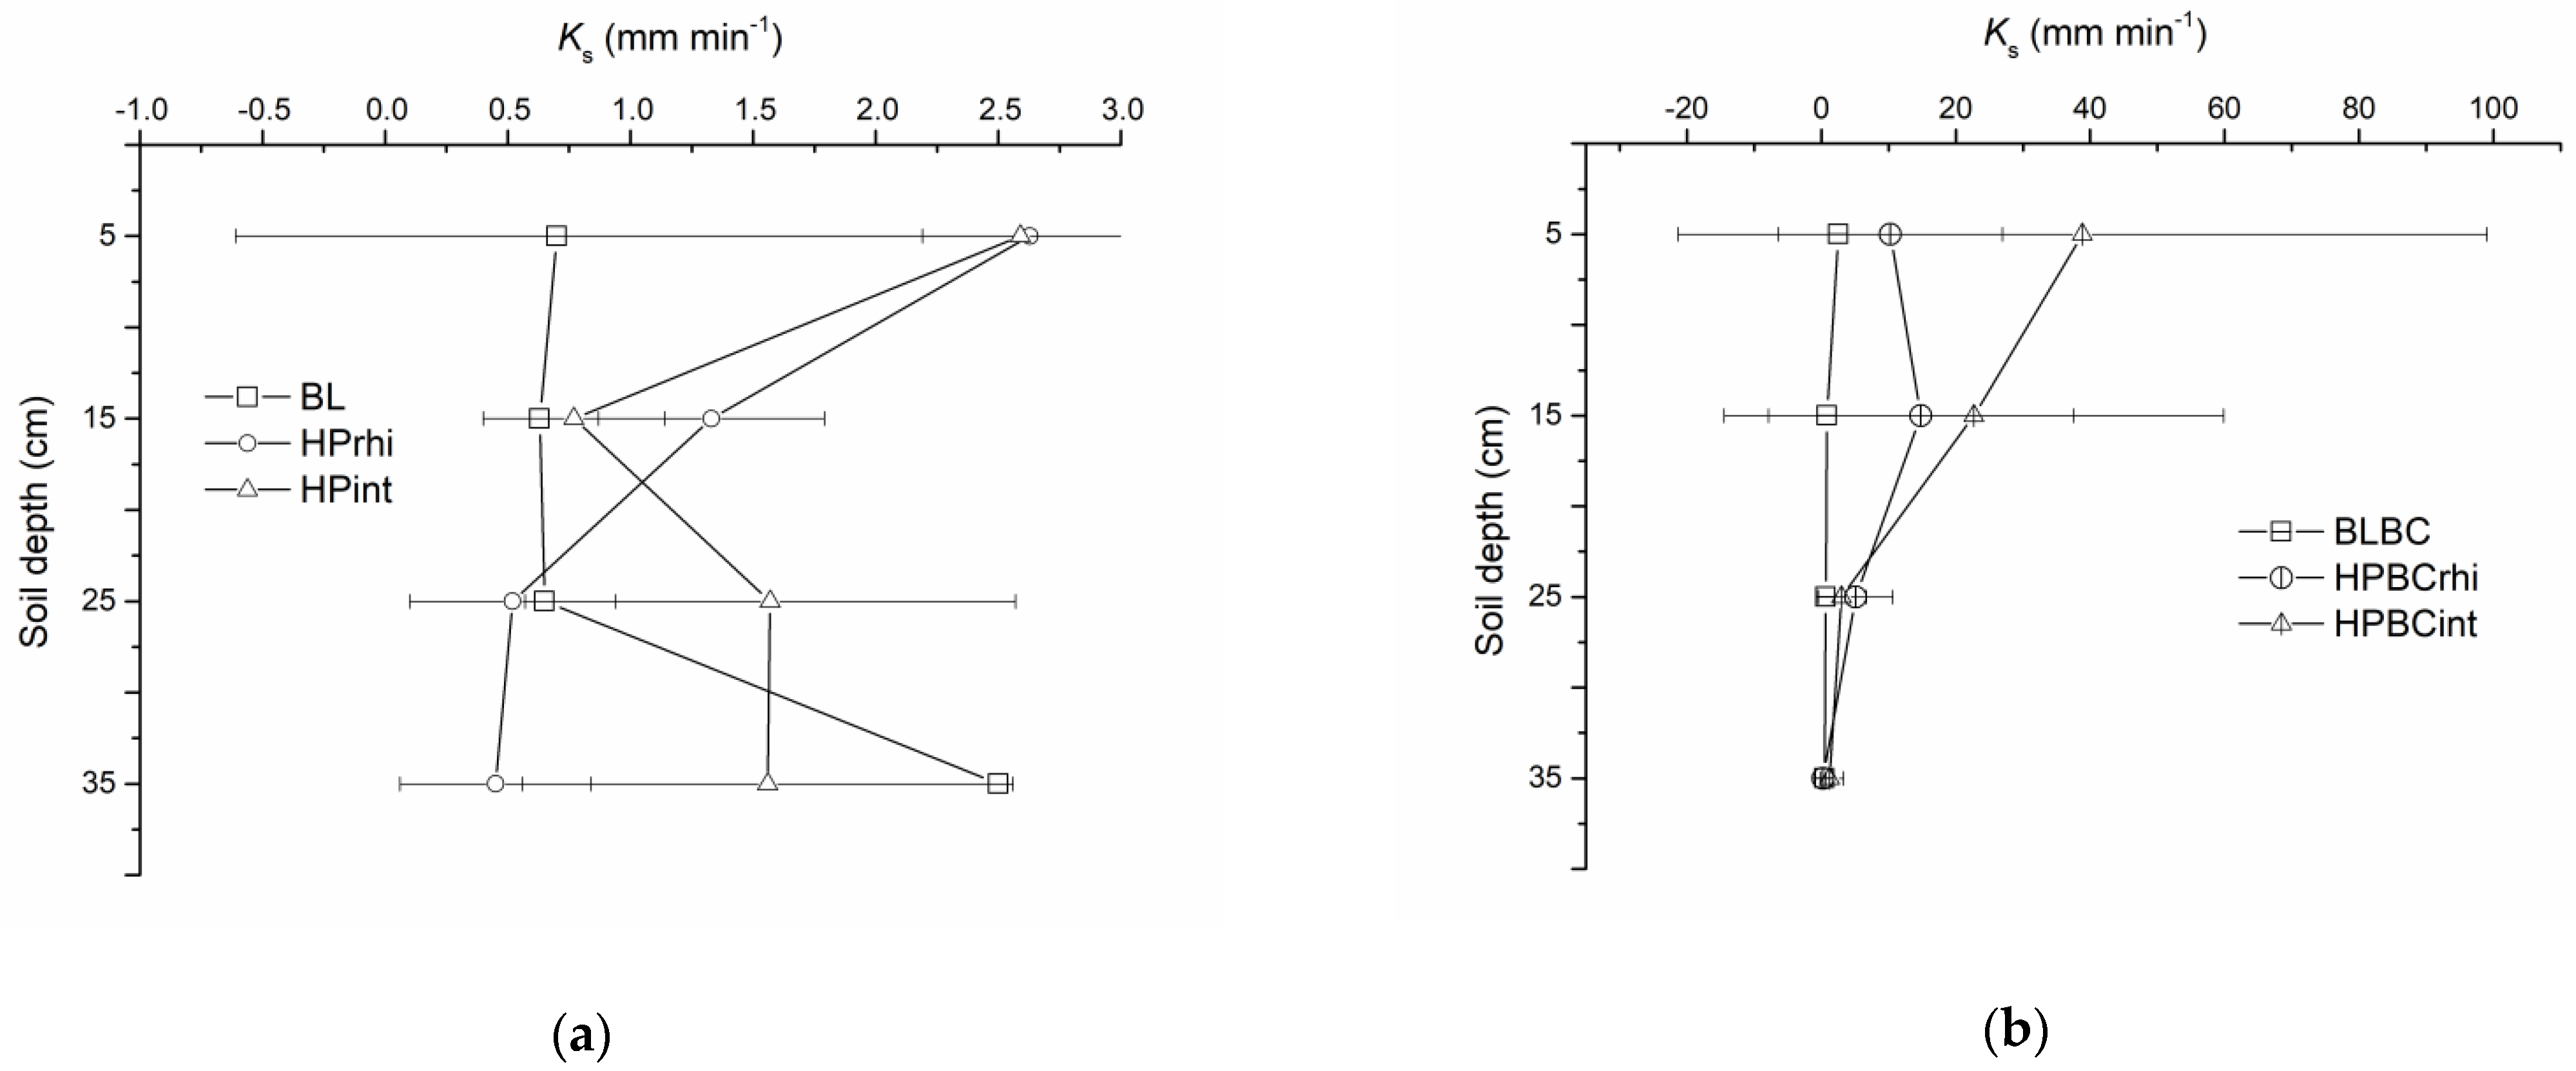
3.5. Saturated Soil Hydraulic Conductivity
3.6. Linking Treatment with Soil Properties
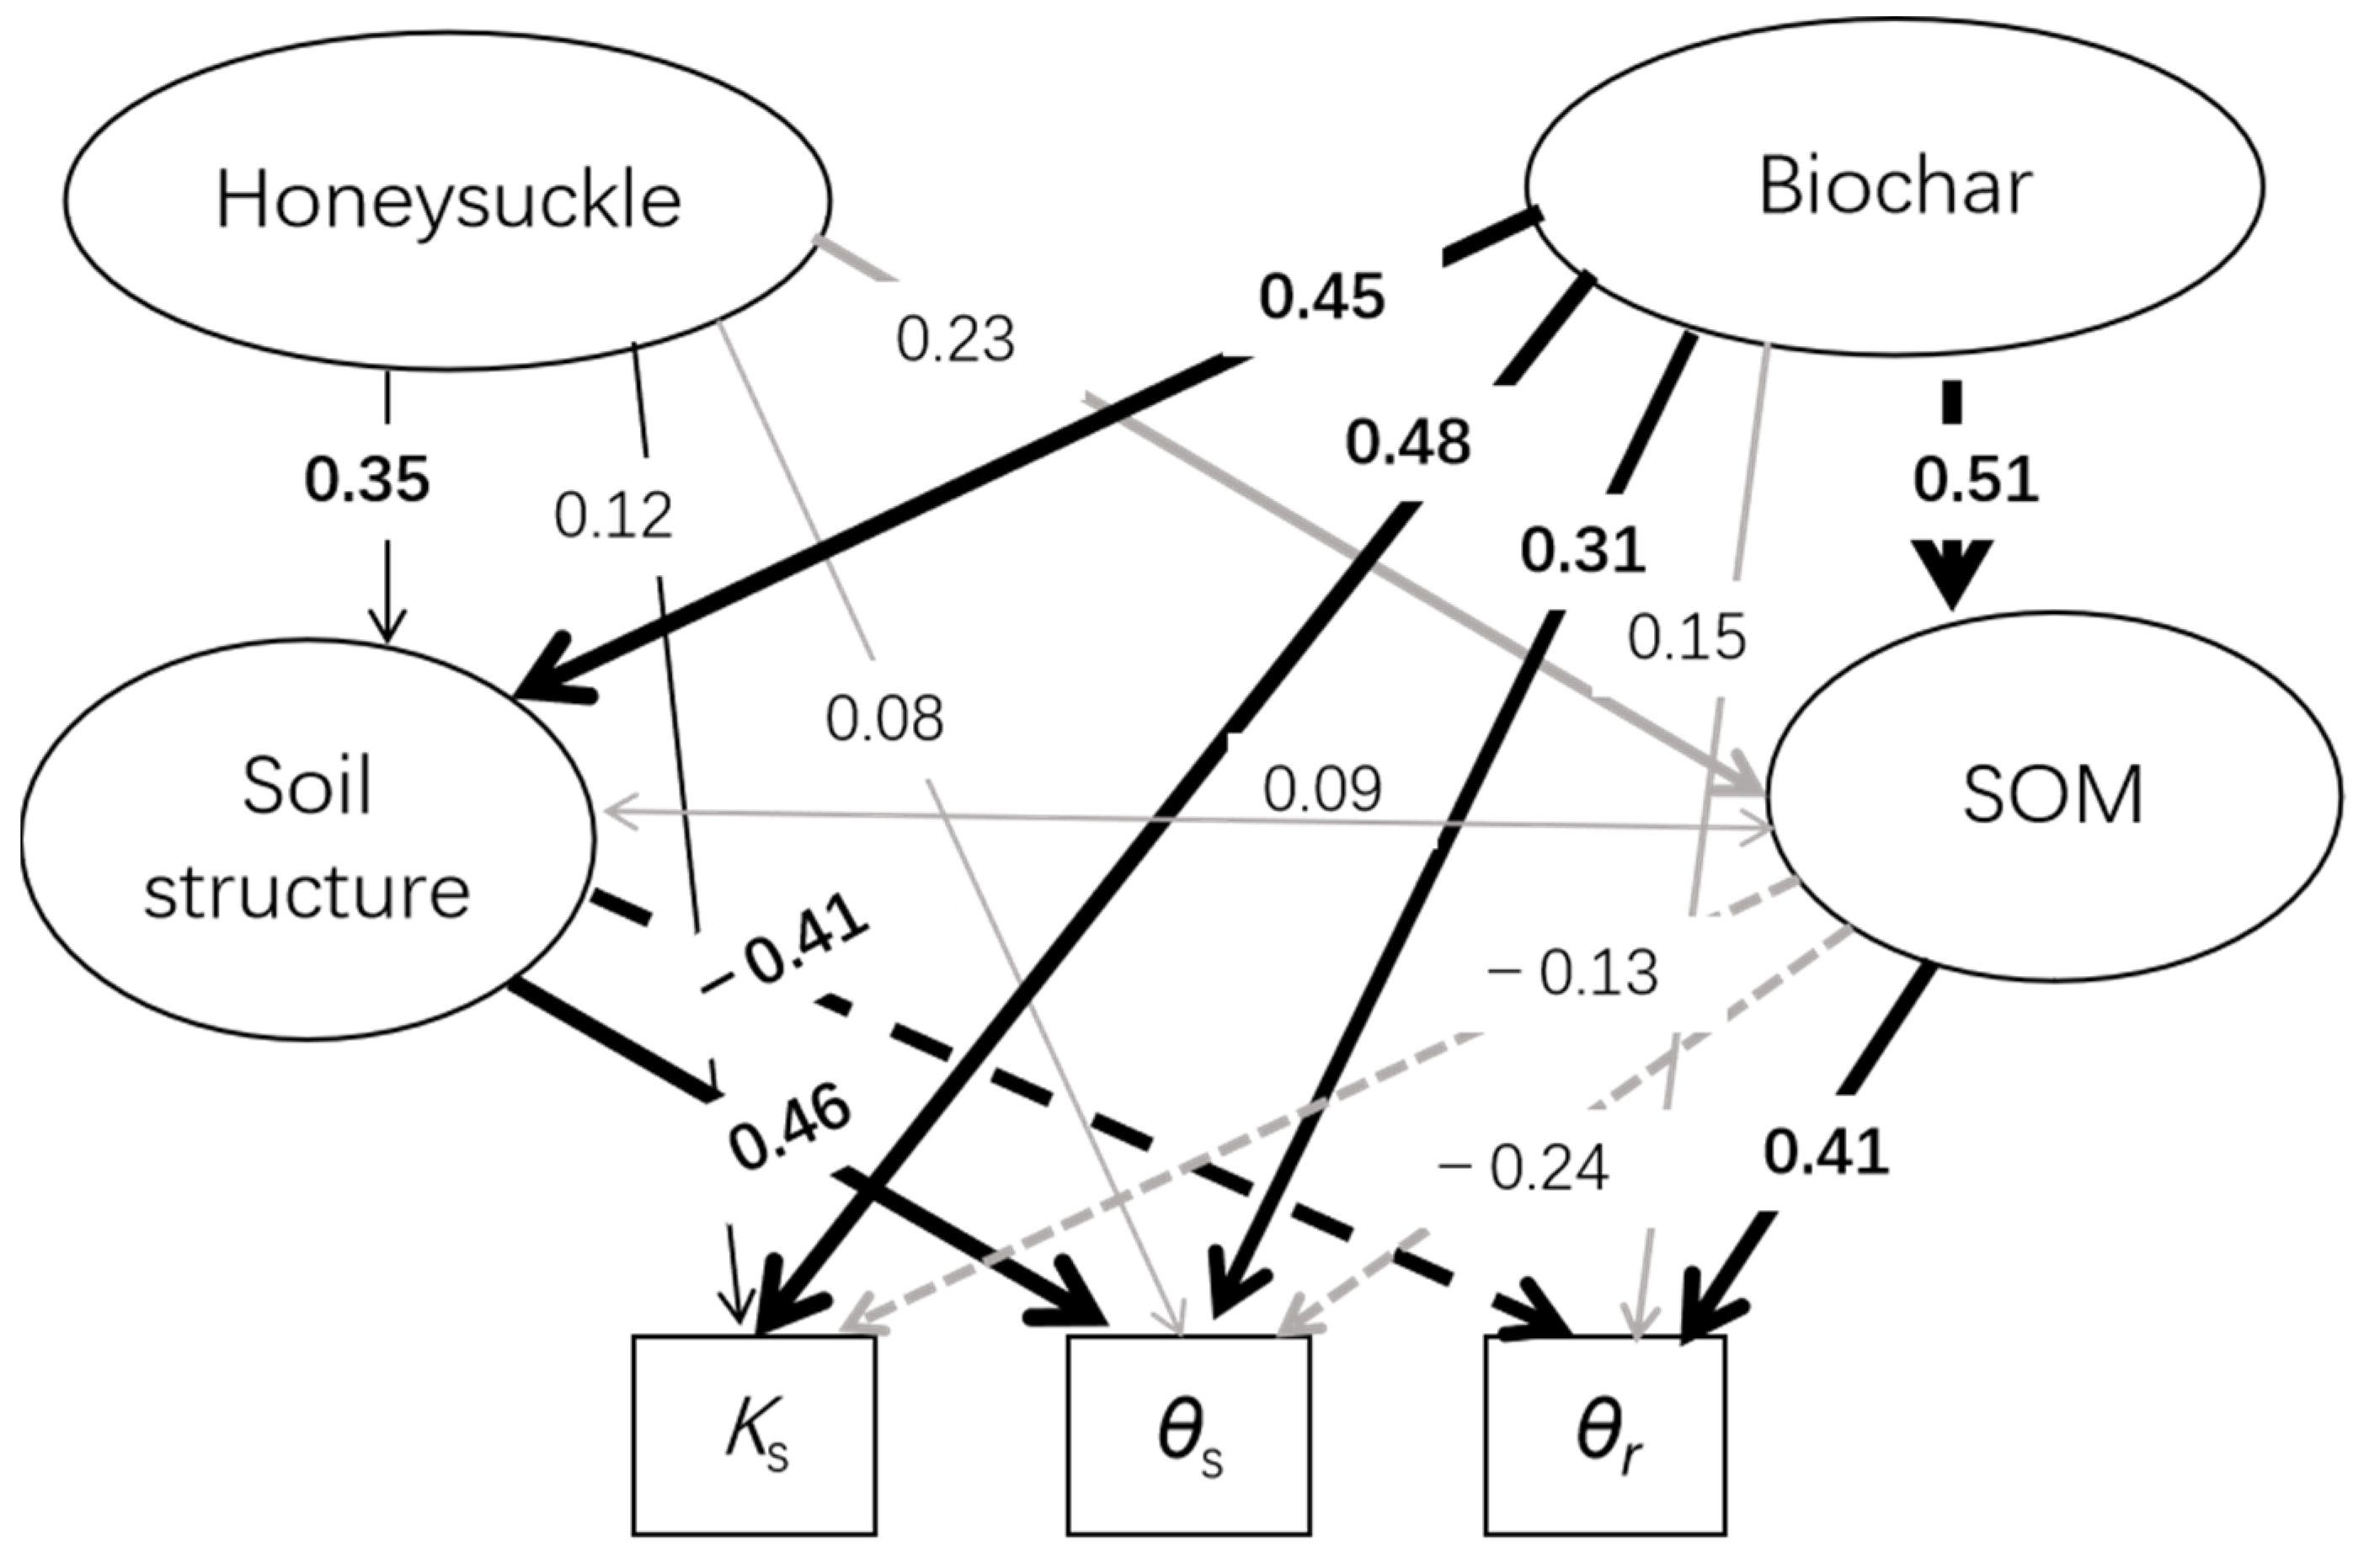
3.7. SEM
4. Discussion
4.1. Effects of Honeysuckle Planting
4.2. Effects of Biochar Amendment
4.3. Interactive Effects of Planting and Biochar
5. Conclusions
Author Contributions
Funding
Institutional Review Board Statement
Informed Consent Statement
Data Availability Statement
Acknowledgments
Conflicts of Interest
References
- Indoria, A.K.; Sharma, K.L.; Reddy, K.S. Hydraulic Properties of Soil under Warming Climate. In Climate Change and Soil Interactions, 1st ed.; Prasad, M.N.V., Pietrzykowski, M., Eds.; Elsevier: Amsterdam, The Netherlands, 2020; pp. 450–507. [Google Scholar] [CrossRef]
- Lu, J.; Zhang, Q.; Werner, A.D.; Li, Y.; Jiang, S.; Tan, Z. Root-Induced Changes of Soil Hydraulic Properties – A Review. J. Hydrol. 2020, 589, 125–203. [Google Scholar] [CrossRef]
- Oades, J.M. The Role of Biology in the Formation, Stabilization and Degradation of Soil Structure. Geoderma 1993, 56, 377–400. [Google Scholar] [CrossRef]
- Lynch, J. Root Architecture and Plant Productivity. Plant. Physiol. 1995, 109, 7–13. [Google Scholar] [CrossRef] [PubMed]
- Gillet, F. Plant Competition. Encycl. Ecol. 2008, 5, 2783–2793. [Google Scholar] [CrossRef]
- Hodge, A.; Robinson, D.; Griffiths, B.S.; Fitter, A.H. Why Plants Bother: Root Proliferation Results in Increased Nitrogen Capture from an Organic Patch When Two Grasses Compete. Plant. Cell Environ. 1999, 22, 811–820. [Google Scholar] [CrossRef]
- Ennos, A.R. The Scaling of Root Anchorage. J. Theor. Biol 1993, 161, 61–75. [Google Scholar] [CrossRef]
- Niklas, K.J.; Spatz, H.C. Allometric Theory and the Mechanical Stability of Large Trees: Proof and Conjecture. Am. J. Bot 2006, 93, 824–828. [Google Scholar] [CrossRef]
- Vannoppen, W.; Vanmaercke, M.; De Baets, S.; Poesen, J. A Review of the Mechanical Effects of Plant Roots on Concentrated Flow Erosion Rates. Earth-Sci. Rev. 2015, 150, 666–678. [Google Scholar] [CrossRef] [Green Version]
- Germann, P.F.; Lange, B.; Lüscher, P. Preferential Flow Dynamics and Plant Rooting Systems. In Hydropedology Synergistic Integration of Soil Science and Hydrology, 1st ed.; Lin, H., Ed.; Elsevier: Amsterdam, The Netherlands, 2012; pp. 121–141. [Google Scholar] [CrossRef]
- Ni, J.; Leung, A.K.; Ng, C.W.W. Unsaturated Hydraulic Properties of Vegetated Soil under Single and Mixed Planting Conditions. Geotechnique 2019, 69, 554–559. [Google Scholar] [CrossRef]
- Kammann, C.; Glaser, B.; Schmidt, H.P. Combining Biochar and Organic Amendments. In Biochar in European Soils and Agriculture: Science and Practice; Routledge: London, UK, 2016; pp. 136–164. [Google Scholar] [CrossRef]
- Atkinson, C.J.; Fitzgerald, J.D.; Hipps, N.A. Potential Mechanisms for Achieving Agricultural Benefits from Biochar Application to Temperate Soils: A Review. Plant. Soil 2010, 337, 1–18. [Google Scholar] [CrossRef]
- Wang, H.L.; Tang, X.Y.; Zhang, W.; Song, S.B.; McKenzie, B.M. Within-Year Changes in Hydraulic Properties of a Shallow Entisol in Farmland and Forestland. Vadose Zone J. 2015, 14, 1–15. [Google Scholar] [CrossRef]
- Liu, C.; Wang, H.; Tang, X.; Guan, Z.; Reid, B.J.; Rajapaksha, A.U.; Ok, Y.S.; Sun, H. Biochar Increased Water Holding Capacity but Accelerated Organic Carbon Leaching from a Sloping Farmland Soil in China. Environ. Sci. Pollut. Res. 2016, 23, 995–1006. [Google Scholar] [CrossRef] [PubMed]
- Zhang, J.; Amonette, J.E.; Flury, M. Effect of Biochar and Biochar Particle Size on Plant-Available Water of Sand, Silt Loam, and Clay Soil. Soil Tillage Res. 2021, 212, 104992. [Google Scholar] [CrossRef]
- Zhao, P.; Wei, L.; Tang, X.; Hu, W.; Wang, H.; Liu, C. Does Biochar Amendment Influence Water Uptake Pattern of Winter Wheat (Triticum aestivum)? A Case Study in a Shallow Entisol. Intl. J. Agric. Biol. 2020, 24, 935–944. [Google Scholar] [CrossRef]
- Oladipo, D.G.; Wei, K.; Hu, L.; Medaiyese, A.; Bah, H.; Gbadegesin, L.A.; Zhu, B. Short-term Assessment of Nitrous Oxide and Methane Emissions on a Crop Yield Basis in Response to Different Organic Amendment Types in Sichuan Basin. Atmosphere 2021, 12, 1104. [Google Scholar] [CrossRef]
- Zhou, M.; Zhu, B.; Brüggemann, N.; Dannenmann, M.; Wang, Y.; Butterbach-Bahl, K. Sustaining crop productivity while reducing environmental nitrogen losses in the subtropical wheat-maize cropping systems: A comprehensive case study of nitrogen cycling and balance. Agric. Ecosyst Environ. 2016, 231, 1–14. [Google Scholar] [CrossRef]
- Zhu, B.; Wang, T.; Kuang, F.; Luo, Z.; Tang, J.; Xu, T. Measurements of Nitrate Leaching from a Hillslope Cropland in the Central Sichuan Basin, China. Soil Sci. Soc. Am. J. 2009, 73, 1419–1426. [Google Scholar] [CrossRef]
- Thomas, G.W. Soil PH and Soil Acidity. In Methods of Soil Analysis. Part 3. Chemical Methods; Sparks, D.L., Page, A.L., Helmke, P.A., Loeppert, R.H., Soltanpour, P.N., Tabatabai, C., Johnston, T., Sumner, M.E., Eds.; Soil Science Society of America: Madison, WI, USA, 1996; pp. 475–490. [Google Scholar]
- Zhong, R.-H.; Hu, J.-M.; Bao, Y.-H.; Wang, F.; He, X.-B. Soil Nutrients in Relation to Vertical Roots Distribution in the Riparian Zone of Three Gorges Reservoir, China. J. Mt. Sci. 2018, 15, 1498–1509. [Google Scholar] [CrossRef]
- Nimmo, J.R.; Perkins, K.S. Aggregate Stability and Size Distribution. In Methods of soil analysis. Part 4. Physical Methods; Dane, J.H., Topp, G.C., Eds.; Soil Science Society of America: Madison, WI, USA, 2002; pp. 317–328. [Google Scholar]
- Cui, J.; Tang, X.; Zhang, W.; Liu, C. The Effects of Timing of Inundation on Soil Physical Quality in the Water-Level Fluctuation Zone of the Three Gorges Reservoir Region, China. Vadose Zone J. 2018, 17, 1–12. [Google Scholar] [CrossRef]
- Giménez, D.; Perfect, E.; Rawls, W.J.; Pachepsky, Y. Fractal Models for Predicting Soil Hydraulic Properties: A Review. Eng. Geol. 1997, 48, 161–183. [Google Scholar] [CrossRef]
- Tyler, S.W.; Wheatcraft, S.W. Fractal Scaling of Soil Particle-Size Distributions: Analysis and Limitations. Soil Sci. Soc. Am. J. 1992, 56, 362–369. [Google Scholar] [CrossRef]
- McKenzie, B.M.; Dexter, A.R. Methods for Studying the Permeability of Individual Soil Aggregates. J. Agric. Eng. Res. 1996, 65, 23–28. [Google Scholar] [CrossRef]
- Van Genuchten, M.T. A Closed-Form Equation for Predicting the Hydraulic Conductivity of Unsaturated Soils. Soil Sci. Soc. Am. J. 1980, 44, 892–898. [Google Scholar] [CrossRef] [Green Version]
- Dexter, A.R.; Czyż, E.A.; Richard, G.; Reszkowska, A.A. User-friendly water retention function that takes account of the textural and structural pore spaces in soil. Geoderma 2008, 143, 243–253. [Google Scholar] [CrossRef]
- Jirk, V.; Kode, R.; Nikodem, A.; Mühlhanselová, M.; Anna, Ž. Temporal Variability of Structure and Hydraulic Properties of Topsoil of Three Soil Types. Geoderma. 2013, 205, 43–58. [Google Scholar] [CrossRef]
- Dexter, A.R. Soil physical quality: Part III. Unsaturated hydraulic conductivity and general conclusions about S-theory. Geoderma 2004, 120, 227–239. [Google Scholar] [CrossRef]
- Vomocil, J.A.; Flocker, W.J. Degradation of Structure of Yolo Loam by Compaction1. Soil Sci. Soc. Am. J. 1965, 29, 7–12. [Google Scholar] [CrossRef]
- Dexter, A.R. Soil Physical Quality: Part I. Theory, Effects of Soil Texture, Density, and Organic Matter, and Effects on Root Growth. Geoderma 2004, 120, 201–214. [Google Scholar] [CrossRef]
- Dexter, A.R.; Czyz, E.A. Applications of S-Theory in the Study of Soil Physical Degradation and Its Consequences. Land Degrad. Dev. 2007, 18, 369–381. [Google Scholar] [CrossRef]
- Andrade, R.S.; Stone, L.F. S Index as an Indicator of Physical Quality of Brazilian “Cerrado” Soils. Rev. Bras. Eng. Agric. E Ambient. 2009, 13, 382–388. [Google Scholar] [CrossRef]
- Adamczyk, B.; Sietiö, O.M.; Straková, P.; Prommer, J.; Wild, B.; Hagner, M.; Pihlatie, M.; Fritze, H.; Richter, A.; Heinonsalo, J. Plant Roots Increase Both Decomposition and Stable Organic Matter Formation in Boreal Forest Soil. Nat. Commun 2019, 10, 1–9. [Google Scholar] [CrossRef] [PubMed] [Green Version]
- Bodner, G.; Leitner, D.; Kaul, H.-P. Coarse and Fine Root Plants Affect Pore Size Distributions Differently. Plant. Soil 2014, 380, 133–151. [Google Scholar] [CrossRef] [PubMed] [Green Version]
- Hallett, P.D.; Feeney, D.S.; Bengough, A.G.; Rillig, M.C.; Scrimgeour, C.M.; Young, I.M. Disentangling the Impact of AM Fungi versus Roots on Soil Structure and Water Transport. Plant. Soil 2009, 314, 183–196. [Google Scholar] [CrossRef]
- Luo, W.; Li, J.; Song, L.; Cheng, P.; Garg, A.; Zhang, L. Effects of Vegetation on the Hydraulic Properties of Soil Covers: Four-Years Field Experiments in Southern China. Rhizosphere 2020, 16, 100272. [Google Scholar] [CrossRef]
- Daynes, C.N.; Field, D.J.; Saleeba, J.A.; Cole, M.A.; McGee, P.A. Development and Stabilisation of Soil Structure via Interactions between Organic Matter, Arbuscular Mycorrhizal Fungi and Plant Roots. Soil Biol. Biochem. 2013, 57, 683–694. [Google Scholar] [CrossRef]
- Zhao, P.; Tang, X.; Zhao, P.; Wang, C.; Tang, J. Tracing Water Flow from Sloping Farmland to Streams Using Oxygen-18 Isotope to Study a Small Agricultural Catchment in Southwest China. Soil Tillage Res. 2013, 134, 180–194. [Google Scholar] [CrossRef]
- Lehmann, J.; Gaunt, J.; Rondon, M. Bio-Char Sequestration in Terrestrial Ecosystems - A Review. Mitig. Adapt. Strateg. Glob. Change 2006, 11, 403–427. [Google Scholar] [CrossRef]
- Cha, J.S.; Park, S.H.; Jung, S.C.; Ryu, C.; Jeon, J.K.; Shin, M.C.; Park, Y.K. Production and Utilization of Biochar: A Review. J. Ind. Eng. Chem. 2016, 40, 1–15. [Google Scholar] [CrossRef]
- Ntacyabukura, T.; Uwiringiyimana, E.; Zhou, M.; Zhang, B.; Zhu, B.; Harerimana, B.; Nambajimana, J.d.D.; Nsabimana, G.; Nsengumuremyi, P. Effect of Biochar and Straw Application on Nitrous Oxide and Methane Emissions from Eutric Regosols with Different pH in Sichuan Basin: A Mesocosm Study. Atmosphere 2021, 12, 729. [Google Scholar] [CrossRef]
- Laird, D.A.; Fleming, P.; Davis, D.D.; Horton, R.; Wang, B.; Karlen, D.L. Impact of Biochar Amendments on the Quality of a Typical Midwestern Agricultural Soil. Geoderma 2010, 158, 443–449. [Google Scholar] [CrossRef] [Green Version]
- Devereux, R.C.; Sturrock, C.J.; Mooney, S.J. The Effects of Biochar on Soil Physical Properties and Winter Wheat Growth. Earth Environ. Sci. Trans. R. Soc. Edinb. 2013, 103, 13–18. [Google Scholar] [CrossRef]
- Blanco-Canqui, H. Biochar and Soil Physical Properties. Soil Sci. Soc. Am. J. 2017, 8, 687–711. [Google Scholar] [CrossRef] [Green Version]
- Verheijen, F.G.A.; Jeffery, S.; Bastos, A.C.; van der Velde, M.; Diafas, I. Biochar Application to Soils – A Critical Scientific Review of Effects on Soil Properties, Processes and Functions; EUR 24099 EN; Office for the Official Publications of the European Communities: Luxembourg, 2009; p. 149. [Google Scholar]
- Githinji, L. Effect of Biochar Application Rate on Soil Physical and Hydraulic Properties of a Sandy Loam. Arch. Agron. Soil Sci. 2014, 60, 457–470. [Google Scholar] [CrossRef]
- Rawat, J.; Saxena, J.; Sanwal, P. Biochar: A Sustainable Approach for Improving Plant Growth and Soil Properties. Biochar-Imperative Amend. Soil Environ. 2019, 1–17. [Google Scholar] [CrossRef] [Green Version]
- Gao, S.; DeLuca, T.H. Rangeland Application of Biochar and Rotational Grazing Interact to Influence Soil and Plant Nutrient Dynamics. Geoderma 2022, 408, 115572. [Google Scholar] [CrossRef]
- Karhu, K.; Mattila, T.; Bergström, I.; Regina, K. Biochar Addition to Agricultural Soil Increased CH4 Uptake and Water Holding Capacity - Results from a Short-Term Pilot Field Study. Agric. Ecosyst. Environ. 2011, 140, 309–313. [Google Scholar] [CrossRef]
- Lehmann, J.; Rillig, M.C.; Thies, J.; Masiello, C.A.; Hockaday, W.C.; Crowley, D. Biochar Effects on Soil Biota - A Review. Soil Biol. Biochem. 2011, 43, 1812–1836. [Google Scholar] [CrossRef]
- Wong, J.T.F.; Chen, Z.; Wong, A.Y.Y.; Ng, C.W.W.; Wong, M.H. Effects of Biochar on Hydraulic Conductivity of Compacted Kaolin Clay. Environ. Pollut. 2018, 234, 468–472. [Google Scholar] [CrossRef]
- Ni, J.J.; Bordoloi, S.; Shao, W.; Garg, A.; Xu, G.; Sarmah, A.K. Two-Year Evaluation of Hydraulic Properties of Biochar-Amended Vegetated Soil for Application in Landfill Cover System. Sci. Total Environ. 2020, 712, 136486. [Google Scholar] [CrossRef]
- Kögel-Knabner, I. The Macromolecular Organic Composition of Plant and Microbial Residues as Inputs to Soil Organic Matter: Fourteen Years On. Soil Biol. Biochem. 2017, 105, A3–A8. [Google Scholar] [CrossRef]
- Novak, J.M.; Busscher, W.J.; Watts, D.W.; Laird, D.A.; Ahmedna, M.A.; Niandou, M.A.S. Short-Term CO2 Mineralization after Additions of Biochar and Switchgrass to a Typic Kandiudult. Geoderma 2010, 154, 281–288. [Google Scholar] [CrossRef]
- Zhang, X.C.; Liu, X.H. Effect of Biochar on pH of Alkaline Soils in the Loess Plateau: Results from Incubation Experiments. Int. J. Agric. Biol. 2012, 14, 745–750. [Google Scholar]
- Liang, B.; Lehmann, J.; Sohi, S.P.; Thies, J.E.; O’Neill, B.; Trujillo, L.; Gaunt, J.; Solomon, D.; Grossman, J.; Neves, E.G.; et al. Black Carbon Affects the Cycling of Non-Black Carbon in Soil. Org. Geochem. 2010, 41, 206–213. [Google Scholar] [CrossRef]
- Dijkstra, F.A.; Bader, N.E.; Johnson, D.W.; Cheng, W. Does Accelerated Soil Organic Matter Decomposition in the Presence of Plants Increase Plant N Availability? Soil Biol. Biochem 2009, 41, 1080–1087. [Google Scholar] [CrossRef]
- Bhogal, A.; Nicholson, F.A.; Rollett, A.; Taylor, M.; Litterick, A.; Whittingham, M.J.; Williams, J.R. Improvements in the Quality of Agricultural Soils Following Organic Material Additions Depend on Both the Quantity and Quality of the Materials Applied. Front. Sustain. Food Syst. 2018, 2, 1–13. [Google Scholar] [CrossRef] [Green Version]
- Wang, D.; Fonte, S.J.; Parikh, S.J.; Six, J.; Scow, K.M. Biochar Additions Can Enhance Soil Structure and the Physical Stabilization of C in Aggregates. Geoderma. 2017, 303, 110–117. [Google Scholar] [CrossRef] [Green Version]


| Plot | Depth (cm) | pH | Bulk Density (g cm−3) | Porosity (m3 m−3) | SOM (g kg−1) |
|---|---|---|---|---|---|
| BL | 0–10 | 8.26 ± 0.02a | 1.60 ± 0.08 | 0.39 ± 0.03 | 7.56 ± 0.65 |
| 10–20 | 8.36 ± 0.03ab | 1.59 ± 0.04 | 0.40 ± 0.02 | 4.75 ± 0.03 | |
| 20–30 | 8.60 ± 0.18bc | 1.58 ± 0.08 | 0.40 ± 0.03 | 3.86 ± 0.31 | |
| 30–40 | 8.68 ± 0.03c | 1.60 ± 0.06 | 0.39 ± 0.02 | 3.60 ± 0.18 | |
| Mean | 8.48 ± 0.19 * | 1.59 ± 0.06 | 0.40 ± 0.02 | 4.94 ± 1.67 * | |
| HPrhi | 0–10 | 8.17 ± 0.11a | 1.49 ± 0.02 | 0.43 ± 0.01 | 83.12 ± 6.91 |
| 10–20 | 8.35 ± 0.06ab | 1.58 ± 0.07 | 0.40 ± 0.03 | 89.28 ± 74.12 | |
| 20–30 | 8.42 ± 0.07b | 1.54 ± 0.01 | 0.42 ± 0.00 | 79.24 ± 78.41 | |
| 30–40 | 8.44 ± 0.01b | 1.65 ± 0.13 | 0.38 ± 0.05 | 67.28 ± 17.02 | |
| Mean | 8.35 ± 0.13 * | 1.56 ± 0.09 | 0.41 ± 0.03 | 80.07 ± 55.69 * | |
| HPint | 0–10 | 8.31 ± 0.02 | 1.55 ± 0.04 | 0.41 ± 0.02 | 55.26 ± 43.37 |
| 10–20 | 8.36 ± 0.04 | 1.61 ± 0.08 | 0.39 ± 0.03 | 39.35 ± 92.16 | |
| 20–30 | 8.38 ± 0.09 | 1.44 ± 0.14 | 0.45 ± 0.05 | 23.27 ± 30.29 | |
| 30–40 | 8.40 ± 0.03 | 1.59 ± 0.09 | 0.40 ± 0.03 | 74.27 ± 62.32 | |
| Mean | 8.36 ± 0.06 * | 1.55 ± 0.10 | 0.42 ± 0.04 | 31.56 ± 50.14 * |
| Soil | Depth (cm) | pH | Bulk Density (g cm−3) | Porosity (m3 m−3) | SOM (g kg−1) |
|---|---|---|---|---|---|
| BLBC | 0–10 | 8.30 ± 0.02a | 1.55 ± 0.04 | 0.41 ± 0.02 | 62.81 ± 13.68 |
| 10–20 | 8.36 ± 0.04c | 1.60 ± 0.08 | 0.39 ± 0.03 | 14.19 ± 1.04 | |
| 20–30 | 8.38 ± 0.09b | 1.44 ± 0.14 | 0.45 ± 0.05 | 6.20 ± 0.36 | |
| 30–40 | 8.40 ± 0.03c | 1.59 ± 0.09 | 0.40 ± 0.03 | 5.96 ± 0.96 | |
| Mean | 8.36 ± 0.06 * | 1.55 ± 0.10 * | 0.41 ± 0.04 * | 22.29 ± 25.37 * | |
| HPBCrhi | 0–10 | 8.10 ± 0.12a | 1.39 ± 0.15 | 0.47 ± 0.05 | 111.56 ± 111.5 |
| 10–20 | 8.34 ± 0.06b | 1.58 ± 0.07 | 0.40 ± 0.03 | 111.8 ± 93.25 | |
| 20–30 | 8.34 ± 0.02b | 1.65 ± 0.04 | 0.37 ± 0.02 | 75.50 ± 27.03 | |
| 30–40 | 8.31 ± 0.09ab | 1.58 ± 0.14 | 0.40 ± 0.05 | 70.42 ± 54.53 | |
| Mean | 8.27 ± 0.13 * | 1.55 ± 0.14 * | 0.41 ± 0.05 * | 94.27 ± 70.79 * | |
| HPBCint | 0–10 | 8.16 ± 0.09 | 1.31 ± 0.02a | 0.51 ± 0.01b | 79.77 ± 27.25 |
| 10–20 | 8.33 ± 0.09 | 1.48 ± 0.06b | 0.44 ± 0.02a | 55.11 ± 15.66 | |
| 20–30 | 8.35 ± 0.10 | 1.53 ± 0.07b | 0.42 ± 0.03a | 42.34 ± 55.26 | |
| 30–40 | 8.35 ± 0.06 | 1.52 ± 0.03b | 0.42 ± 0.01a | 33.1 ± 7.35 | |
| Mean | 8.30 ± 0.11 * | 1.46 ± 0.10 * | 0.45 ± 0.04 * | 52.56 ± 31.12 * |
| Soil | Depth (cm) | vG Model | BE Model | |||||
|---|---|---|---|---|---|---|---|---|
| θr (m3·m−3) | θs (m3·m−3) | n | Sinf | θr-BE (m3·m−3) | θtxt-BE (m3·m−3) | θstr-BE (m3·m−3) | ||
| BL | 0–10 | 0.230 ± 0.025 | 0.421 ± 0.034 | 1.21 ± 0.08 | 0.035 ± 0.002 | 0.238 ± 0.034 | 0.102 ± 0.041 | 0.147 ± 0.015 |
| 10–20 | 0.232 ± 0.016 | 0.435 ± 0.019 | 1.14 ± 0.04 | 0.034 ± 0.002 | 0.235 ± 0.028 | 0.108 ± 0.029 | 0.117 ± 0.014 | |
| 20–30 | 0.199 ± 0.009 | 0.398 ± 0.028 | 1.20 ± 0.03 | 0.026 ± 0.005 | 0.207 ± 0.038 | 0.102 ± 0.008 | 0.070 ± 0.007 | |
| 30–40 | 0.210 ± 0.012 | 0.430 ± 0.015 | 1.19 ± 0.09 | 0.022 ± 0.008 | 0.218 ± 0.029 | 0.112 ± 0.039 | 0.091 ± 0.008 | |
| HPrhi | 0–10 | 0.240 ± 0.038 | 0.445 ± 0.014 | 1.26 ± 0.08 | 0.046 ± 0.004 | 0.245 ± 0.037 | 0.086 ± 0.006 | 0.117 ± 0.037 |
| 10–20 | 0.253 ± 0.015 | 0.436 ± 0.026 | 1.26 ± 0.06 | 0.034 ± 0.006 | 0.256 ± 0.016 | 0.103 ± 0.034 | 0.086 ± 0.012 | |
| 20–30 | 0.238 ± 0.022 | 0.407 ± 0.007 | 1.12 ± 0.05 | 0.023 ± 0.005 | 0.239 ± 0.025 | 0.090 ± 0.018 | 0.082 ± 0.013 | |
| 30–40 | 0.227 ± 0.013 | 0.385 ± 0.032 | 1.16 ± 0.08 | 0.024 ± 0.010 | 0.230 ± 0.014 | 0.067 ± 0.026 | 0.088 ± 0.017 | |
| HPint | 0–10 | 0.227 ± 0.017 | 0.423 ± 0.012 | 1.23 ± 0.11 | 0.037 ± 0.012 | 0.232 ± 0.015 | 0.097 ± 0.019 | 0.103 ± 0.026 |
| 10–20 | 0.213 ± 0.012 | 0.412 ± 0.014 | 1.22 ± 0.07 | 0.034 ± 0.005 | 0.222 ± 0.011 | 0.105 ± 0.015 | 0.093 ± 0.011 | |
| 20–30 | 0.236 ± 0.018 | 0.429 ± 0.021 | 1.20 ± 0.04 | 0.027 ± 0.001 | 0.241 ± 0.017 | 0.105 ± 0.009 | 0.091 ± 0.011 | |
| 30–40 | 0.218 ± 0.015 | 0.400 ± 0.027 | 1.09 ± 0.02 | 0.021 ± 0.005 | 0.222 ± 0.013 | 0.084 ± 0.026 | 0.095 ± 0.016 | |
| Soil | Depth (cm) | vG Model | BE Model | |||||
|---|---|---|---|---|---|---|---|---|
| θr (m3·m−3) | θs (m3·m−3) | n | Sinf | θr-BE (m3·m−3) | θtxt-BE (m3·m−3) | θstr-BE (m3·m−3) | ||
| BLBC | 0–10 | 0.290 ± 0.025 | 0.506 ± 0.035 | 1.51 ± 0.05 | 0.060 ± 0.015 | 0.183 ± 0.034 | 0.201 ± 0.071 | 0.148 ± 0.012 |
| 10–20 | 0.256 ± 0.019 | 0.436 ± 0.044 | 1.09 ± 0.09 | 0.027 ± 0.004 | 0.198 ± 0.039 | 0.146 ± 0.051 | 0.117 ± 0.014 | |
| 20–30 | 0.255 ± 0.011 | 0.432 ± 0.021 | 1.33 ± 0.11 | 0.034 ± 0.008 | 0.261 ± 0.025 | 0.110 ± 0.049 | 0.070 ± 0.004 | |
| 30–40 | 0.235 ± 0.009 | 0.418 ± 0.051 | 1.18 ± 0.08 | 0.029 ± 0.005 | 0.243 ± 0.021 | 0.091 ± 0.012 | 0.092 ± 0.005 | |
| HPBCrhi | 0–10 | 0.288 ± 0.018 | 0.534 ± 0.045 | 1.26 ± 0.07 | 0.056 ± 0.012 | 0.256 ± 0.049 | 0.177 ± 0.088 | 0.107 ± 0.020 |
| 10–20 | 0.233 ± 0.046 | 0.459 ± 0.033 | 1.19 ± 0.01 | 0.040 ± 0.004 | 0.220 ± 0.018 | 0.136 ± 0.069 | 0.110 ± 0.015 | |
| 20–30 | 0.232 ± 0.024 | 0.428 ± 0.045 | 1.20 ± 0.06 | 0.038 ± 0.007 | 0.234 ± 0.024 | 0.100 ± 0.072 | 0.096 ± 0.027 | |
| 30–40 | 0.257 ± 0.016 | 0.415 ± 0.018 | 1.23 ± 0.11 | 0.044 ± 0.015 | 0.250 ± 0.022 | 0.088 ± 0.050 | 0.079 ± 0.014 | |
| HPBCint | 0–10 | 0.272 ± 0.034 | 0.502 ± 0.026 | 1.28 ± 0.07 | 0.047 ± 0.012 | 0.279 ± 0.034 | 0.148 ± 0.016 | 0.079 ± 0.007 |
| 10–20 | 0.232 ± 0.043 | 0.440 ± 0.011 | 1.23 ± 0.06 | 0.039 ± 0.002 | 0.233 ± 0.039 | 0.137 ± 0.031 | 0.075 ± 0.018 | |
| 20–30 | 0.213 ± 0.016 | 0.418 ± 0.030 | 1.18 ± 0.03 | 0.036 ± 0.007 | 0.218 ± 0.016 | 0.117 ± 0.015 | 0.087 ± 0.003 | |
| 30–40 | 0.231 ± 0.010 | 0.405 ± 0.010 | 1.16 ± 0.04 | 0.026 ± 0.005 | 0.233 ± 0.008 | 0.097 ± 0.015 | 0.073 ± 0.002 | |
| Soil Basic Properties | Soil Pore Characteristics | ||||||
|---|---|---|---|---|---|---|---|
| r > 125 (μm) | 0.1 < r < 125 (μm) | r < 0.1 (μm) | θr-BE (m3·m−3) | θtxt-BE (m3·m−3) | θstr-BE (m3·m−3) | Total Porosity % | |
| Bulk density | −0.461 ** | −0.068 | 0.224 | −0.299 * | −0.402 ** | 0.092 | −1.000 ** |
| pH | −0.301 * | −0.246 | 0.324 * | −0.273 * | −0.239 | 0.027 | −0.275 * |
| SOM | 0.053 | 0.119 | −0.123 | −0.085 | −0.074 | 0.209 | −0.017 |
| Treatment | r < 0.1 µm | 0.1 µm < r < 125 µm. | r > 125 µm |
|---|---|---|---|
| Honeysuckle planting | 0.049 | 0.177 | 0.168 |
| Biochar amendment | 0.001 | 0.053 | 0.000 |
| Honeysuckle planting × Biochar | 0.004 | 0.009 | 0.112 |
Publisher’s Note: MDPI stays neutral with regard to jurisdictional claims in published maps and institutional affiliations. |
© 2022 by the authors. Licensee MDPI, Basel, Switzerland. This article is an open access article distributed under the terms and conditions of the Creative Commons Attribution (CC BY) license (https://creativecommons.org/licenses/by/4.0/).
Share and Cite
Tuyishimire, E.; Cui, J.; Tang, X.; Sun, Z.; Cheng, J. Interactive Effects of Honeysuckle Planting and Biochar Amendment on Soil Structure and Hydraulic Properties of Hillslope Farmland. Agriculture 2022, 12, 414. https://doi.org/10.3390/agriculture12030414
Tuyishimire E, Cui J, Tang X, Sun Z, Cheng J. Interactive Effects of Honeysuckle Planting and Biochar Amendment on Soil Structure and Hydraulic Properties of Hillslope Farmland. Agriculture. 2022; 12(3):414. https://doi.org/10.3390/agriculture12030414
Chicago/Turabian StyleTuyishimire, Etienne, Junfang Cui, Xiangyu Tang, Zhixiang Sun, and Jianhua Cheng. 2022. "Interactive Effects of Honeysuckle Planting and Biochar Amendment on Soil Structure and Hydraulic Properties of Hillslope Farmland" Agriculture 12, no. 3: 414. https://doi.org/10.3390/agriculture12030414